Understandable Artificial Intelligence

A.I. In Action:

Evaluating Existing Fund

Overview

©2018 Economic Data Sciences

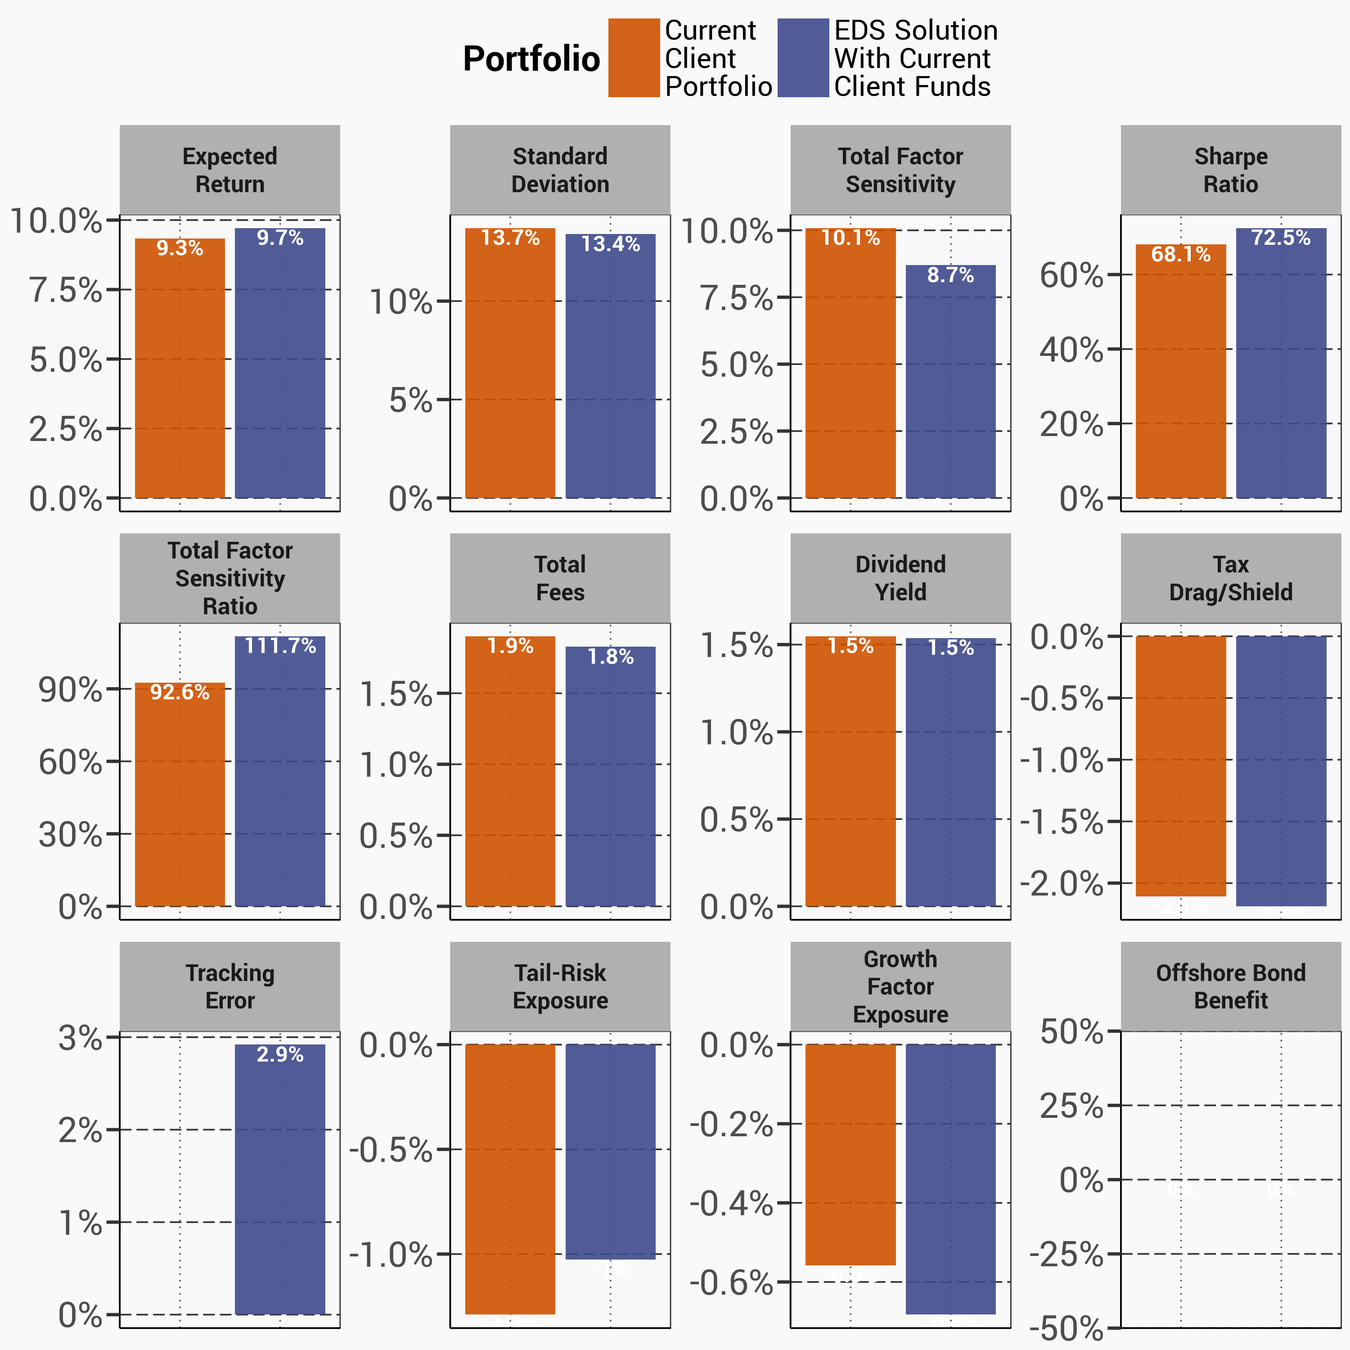
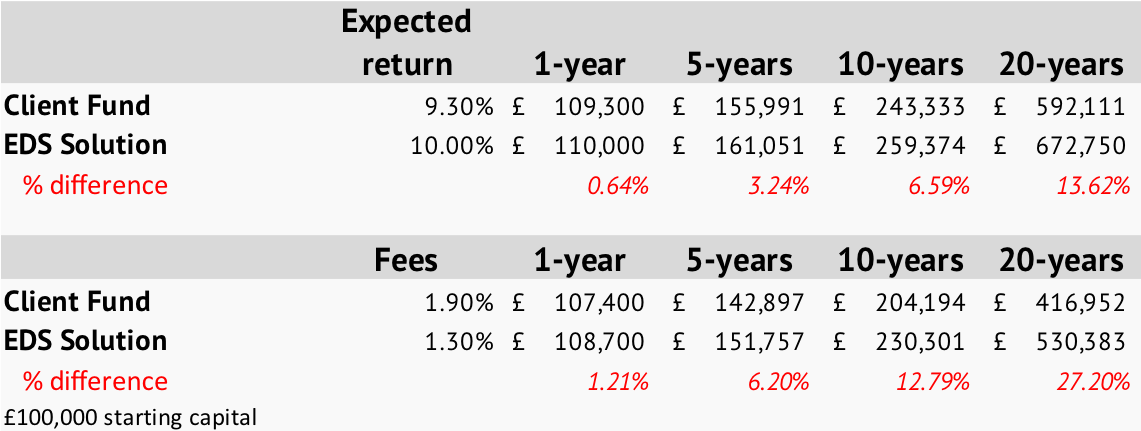
EDS was given a sample portfolio by a UK pension fund. Since only the asset weights were known, EDS tool deducted the investors' preferences and proceeded to analyze the holdings


The analysis was split into 3 stages:

  1. Asset allocation within the sample fund
  2. Incorporating other internally available funds
  3. Opening the universe to external funds

Step 1: Only Sample Fund

©2018 Economic Data Sciences

  • Use only the 7 funds currently in the portfolio
  • Conclusion:
    • Good current asset allocation
    • Little value add from using EDS tool
    •    

*Data from EDS, St. James's Place, & Bloomberg, courtesy of London Business School

Step 2: Other Internal Funds

©2018 Economic Data Sciences

  • Increase universe to all approved internal funds


  • Fees are not a focus point


  • In contrast to other portfolios, income, growth, and off-shore bonds are not strong preferences

Step 2: Results Overview

©2018 Economic Data Sciences

  • EDS is expected to outperform existing allocation
  •  
  • Given the fund universe:
    • Current fund selection is solid
    • Some gains with EDS method

*Data from EDS, St. James's Place, & Bloomberg, courtesy of London Business School

Step 3: Opening to External Funds

©2018 Economic Data Sciences

  • Expand possible investments beyond existing funds
    • Preference remains for approved client funds
  • Limit each fund to 20%
  • Focus on same preferences as the original portfolio

Step 3: Results - Risk/Return

©2018 Economic Data Sciences

EDS tool reviewed 2,743 potential U.K. funds

  • Original portfolio allocation shows good asset selection
  • Broader universe allows for more targeted risk taking
  • The average mixed allocation fund expects a 6.1% annual return with 13.8% S.D.

*Data from EDS, & Bloomberg, courtesy of London Business School

Step 3: Results Overview

©2018 Economic Data Sciences

Significant projected improvement using EDS tool

  • Higher expected return
    • With lower standard deviation
  • Lower management fees
  • Higher dividend yield
  • Client approved funds comprise 68% of the total
Every metric can be flexed and adjusted

depending on individual preferences

Step 3: Results Overview - Returns

©2018 Economic Data Sciences

Significant projected improvement using EDS tool

Step 3: Results Overview - Risk

©2018 Economic Data Sciences

Where do these gains come from?

  • Lower risk exposure across most metrics
  • Significantly improved factor risk exposure and risk distribution

Step 3: Results Overview - Funds

©2018 Economic Data Sciences

Breakdown of selected funds

  • Each fund is capped at 20%
  •  
  • 8 additions to original portfolio
  •  
  • Full flexibility around which funds and how many to include

*Data from EDS, St. James's Place, & Bloomberg, courtesy of London Business School

Step 3: Human Factor - EDS

©2018 Economic Data Sciences

We combine human analysis with A.I. and M.L.:

  • We maintain preference for client's funds
  • Original fund has a high return target
  • Our tool showed that fund holders were not getting paid sufficiently for the additional risk
  • All new funds are indexes, thereby lowering total fees
    • For actively managed funds more indepth research regarding the fund, the team, the manager and the process would be needed
  • Adding diversification to the existing portfolio

*Data from EDS, St. James's Place, & Bloomberg, courtesy of London Business School

Better Performance

©2018 Economic Data Sciences

Tangible benefits to working with EDS tool

Past performance is not a reliable indicator of future results

*Data from EDS, St. James's Place, & Bloomberg, courtesy of London Business School

Conclusion

©2018 Economic Data Sciences

Client fund: good, but can be improved

  • Within the current list of client funds, existing allocation is done well
  • Expanding the universe can provide several benefits:
    • Higher projected returns
    • Lower overall market risk exposure
    • More even factor risk exposure across factors
    • Lower fees

Disclaimers

©2018 Economic Data Sciences

Please remember that past performance may not be indicative of future results. Different types of investments involve varying degrees of risk, and there can be no assurance that the future performance of any specific investment, investment strategy, or product made reference to directly or indirectly in this presentation, will be profitable, equal any corresponding indicated historical performance level(s), or be suitable for an individual's portfolio.

Our projections are based on current market conditions which can vary over the coming months and weeks. Additionally, our projections are based on historical market behavior which may vary unexpectedly. Using Machine Learning, our tool should adjust to new market fluctuations but we might not be able to avoid short term volatility.

Get In Touch

©2018 Economic Data Sciences

Back to the Main Presentation

See A.I. In More examples

  • Sustainable Investing (ESG)
  • Big Data Simulations And Forecasts
  • Factor Tracking Error Management

info@EconomicDataSciences.com

www.EconomicDataSciences.com

Appendix

Risks by Geography

©2018 Economic Data Sciences

Risks by Type

©2018 Economic Data Sciences

Disclaimers

©2018 Economic Data Sciences

Please remember that past performance may not be indicative of future results. Different types of investments involve varying degrees of risk, and there can be no assurance that the future performance of any specific investment, investment strategy, or product made reference to directly or indirectly in this presentation, will be profitable, equal any corresponding indicated historical performance level(s), or be suitable for an individual's portfolio.

Our projections are based on current market conditions which can vary over the coming months and weeks. Additionally, our projections are based on historical market behavior which may vary unexpectedly. Using Machine Learning, our tool should adjust to new market fluctuations but we might not be able to avoid short term volatility.

Get In Touch

©2018 Economic Data Sciences

info@EconomicDataSciences.com

www.EconomicDataSciences.com

info@EconomicDataSciences.com

Simple Portfolio Optimization

By Economic Data Sciences

Simple Portfolio Optimization

  • 1,067