


Economic Data Sciences PRO
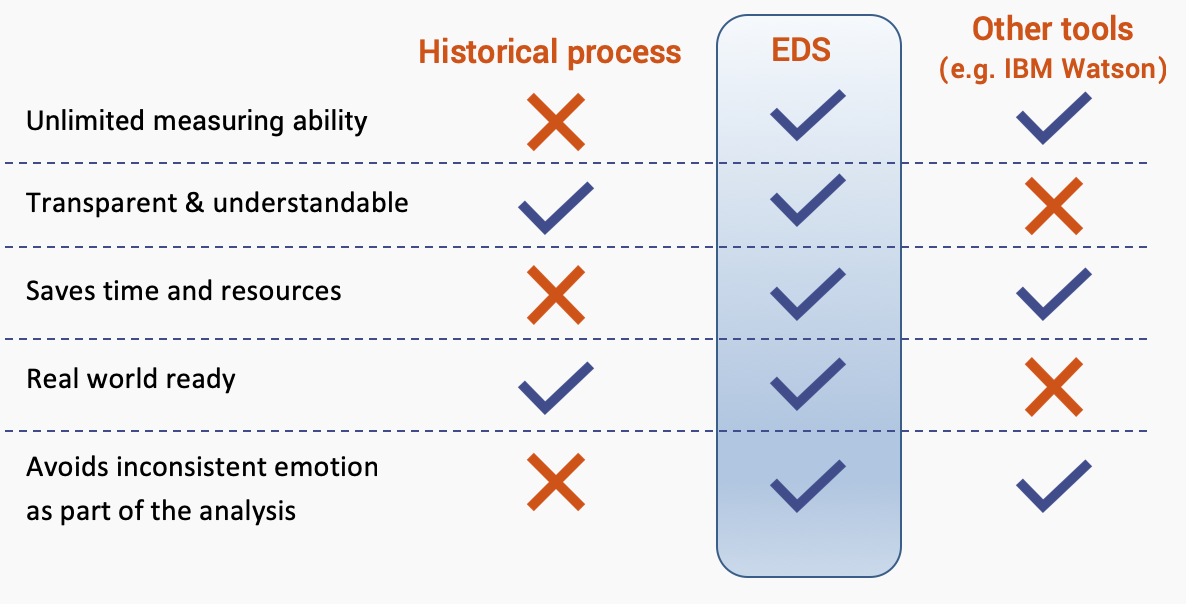
Understandable A.I.
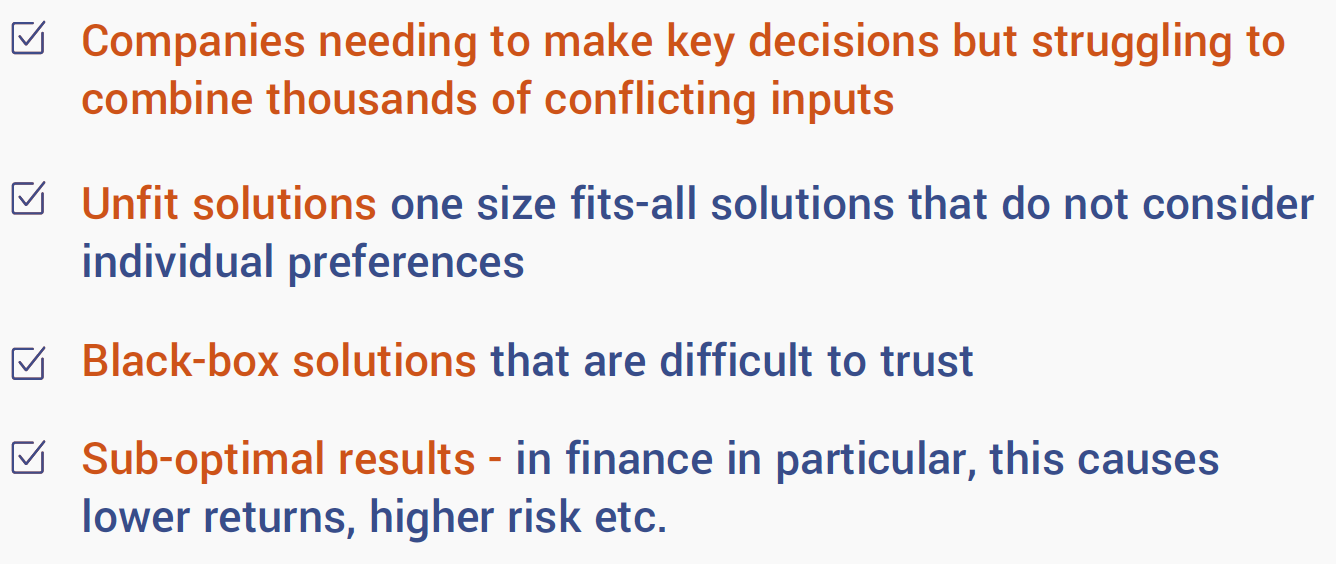
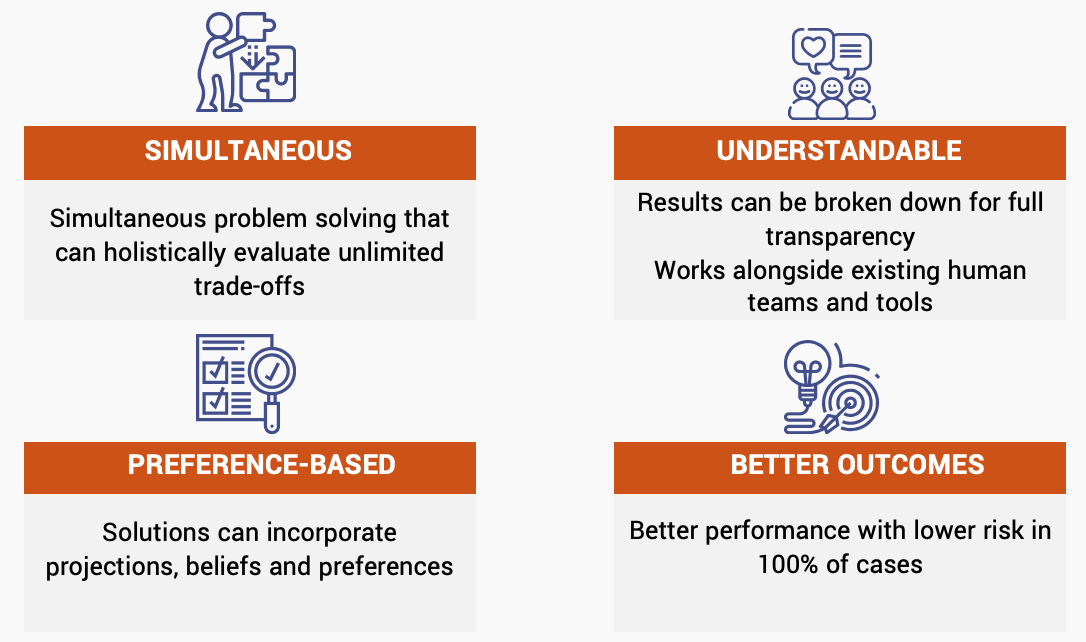
Understandable Artificial Intelligence
©2019 Economic Data Sciences
©2019 Economic Data Sciences
©2019 Economic Data Sciences
©2019 Economic Data Sciences
Machine Learning
Human + Machine Insight
Best Trade-offs In A Complex World
Broader, Deeper, More Detailed
Extending research from Stanford our modelling process flexibly incorporates data and checks for robustness
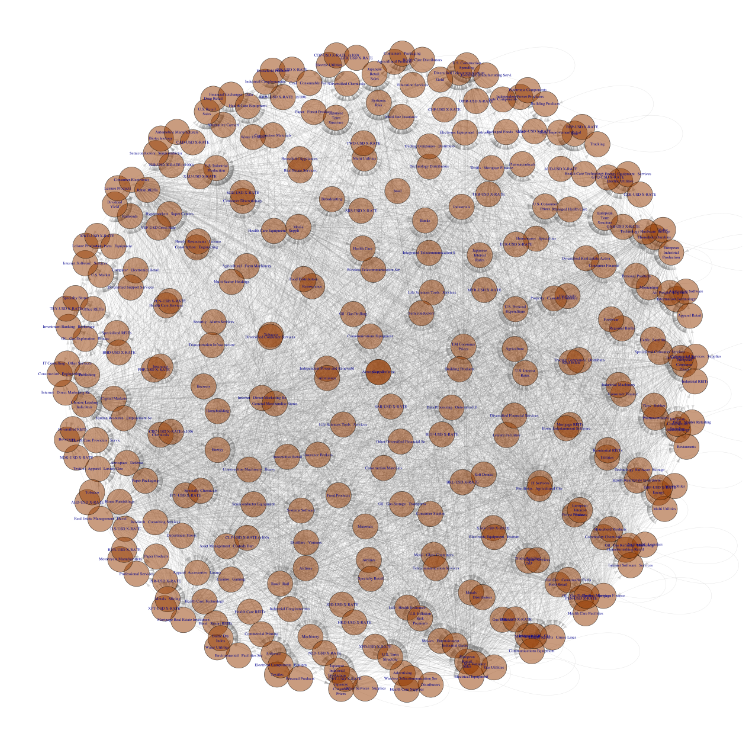
Combining the power of distributed computing, our A.I. solves problems simultaneously by combining optimization with an approach inspired by genetic algorithms
Our custom built data infrastructure combines many of the latest open source foundations which we have extended to meet today's needs
©2019 Economic Data Sciences
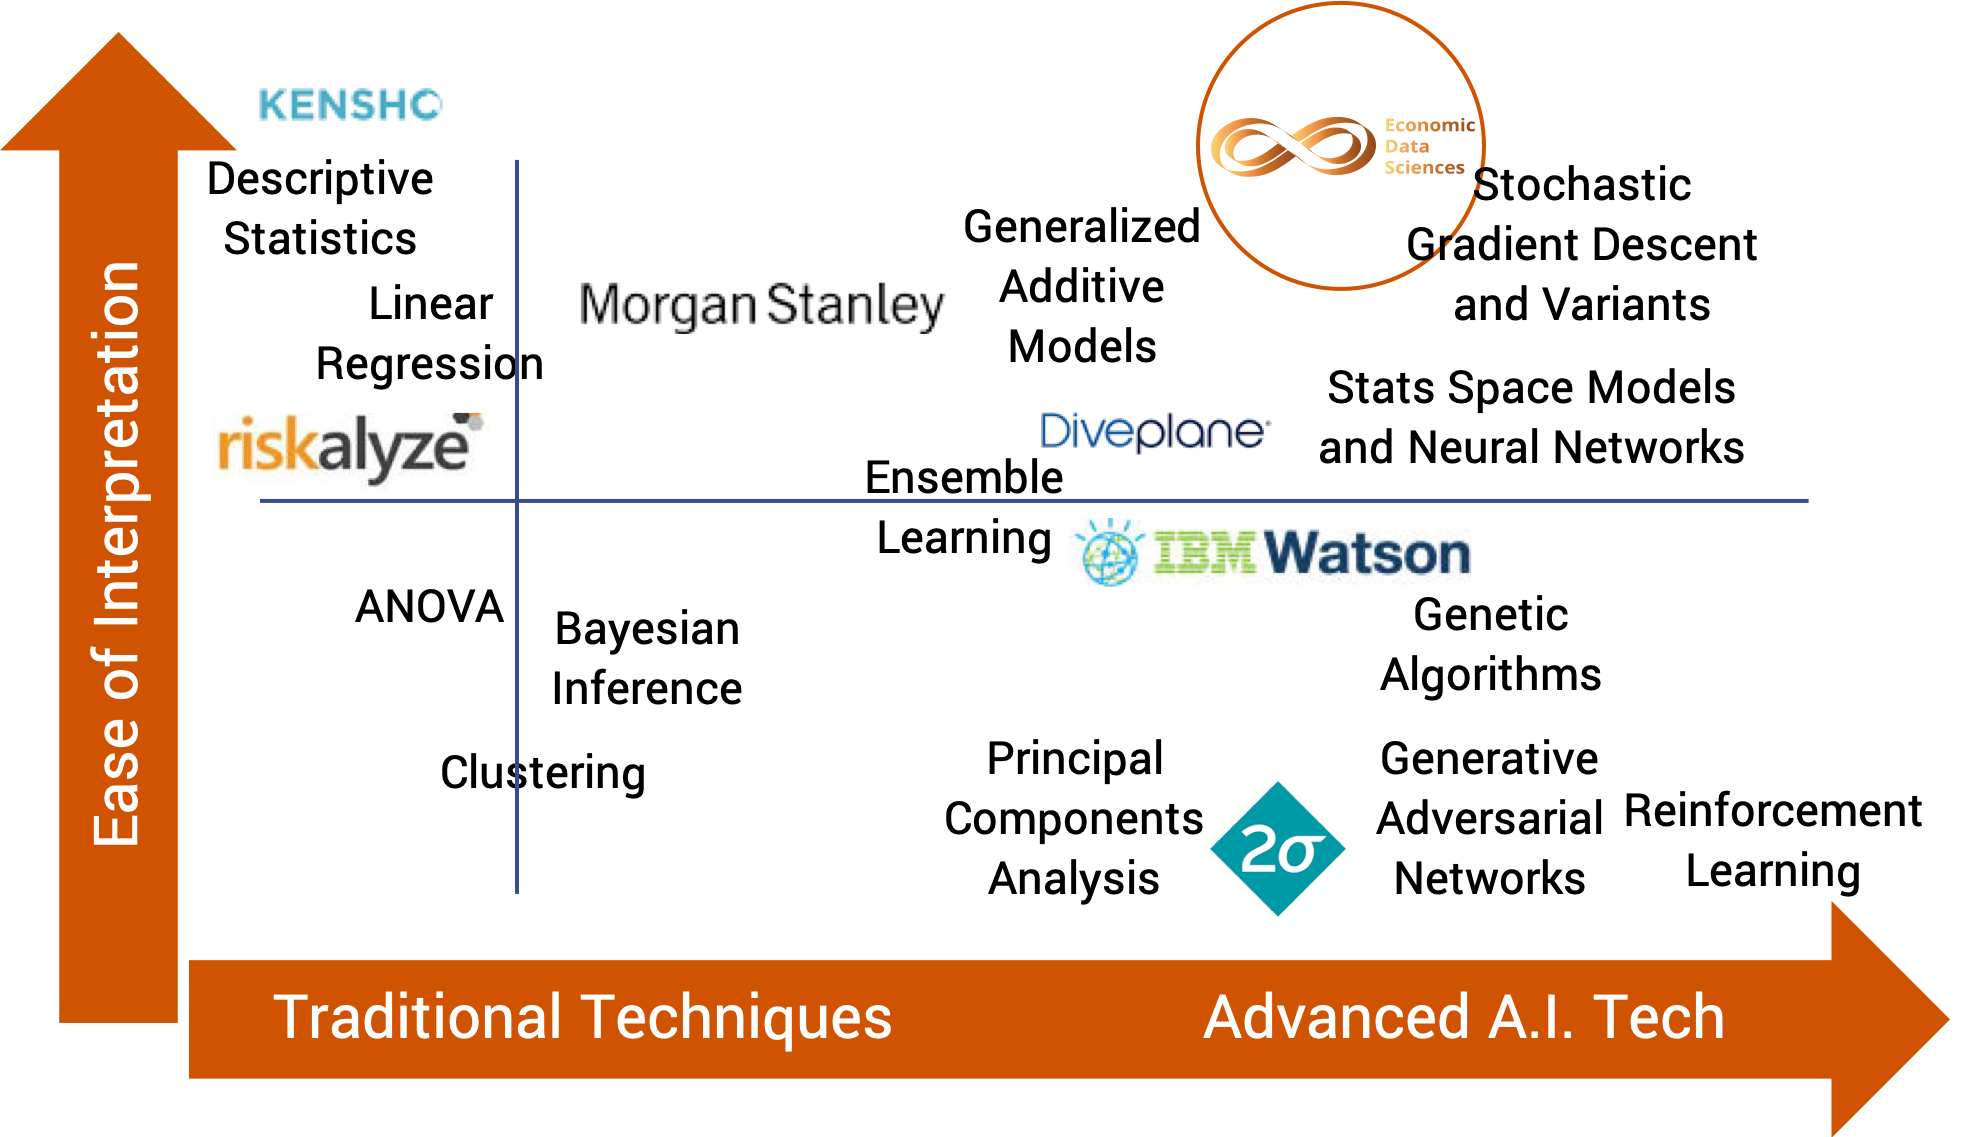
Artificial Intelligence
Big And Fast Data
©2019 Economic Data Sciences
EDS's mathematical insights extend current best practices
1950s
1980s
2010s
An Extendable
Framework
©2019 Economic Data Sciences
©2019 Economic Data Sciences
©2018 Economic Data Sciences
Cloud Resources
EDS Data Center
Combined Computing Power
Client Interface
©2018 Economic Data Sciences
Scala
Zookeeper
©2018 Economic Data Sciences
Asynchronous
Actions occuring at the same time, in any order, without waiting on each other
Current solutions are sequence oriented
Distributed
Connecting many smaller systems to work together
Current solutions grow by sequencing faster
Modular
This principal means components can be easily repurposed
As opposed to current monolithic designs
©2018 Economic Data Sciences
Scalable and Redundant
Built expecting failure and can easily 'drop-in' new resources live
Current solutions would need to be shut down and migrated
Analysis Focused not Storage Focused
We store data multiple times, in multiple forms, focused on insight
Current solutions minimize storage cost, but make insight costly
Flexible Data Consumption
Takes all data comers, SQL, NoSQL -- structure, unstructure
Current solutions have strict data structure requirements
©2018 Economic Data Sciences
| Cassandra | Database | Meets All | Puts Data of Any Kind Closer To Analysis For Speed and Flexibility |
| Hadoop | Distributed Disk | Meets All | Quickly Consumes Any Type of Data |
| Mesos | Scheduler | Meets All | Coordinates Tools for 'Drop-in' Flexibility |
| Zookeeper | Failover Coordinator | Meets All | Coordinates Redistribution of 'Duties' During Failures Or When Connections Are Dropped |
| Spark, Scala, and R | Analytics | Combined -- Meets All | When Combined, Tools Provide Analytics In Ways That Align With Principals |
| Play | Front-End | Meets All | Visualizes to client and collects client information |
| Component | Purpose | Principal | What It Does |
|---|
©2018 Economic Data Sciences
©2018 Economic Data Sciences
©2019 Economic Data Sciences
©2019 Economic Data Sciences
©2019 Economic Data Sciences
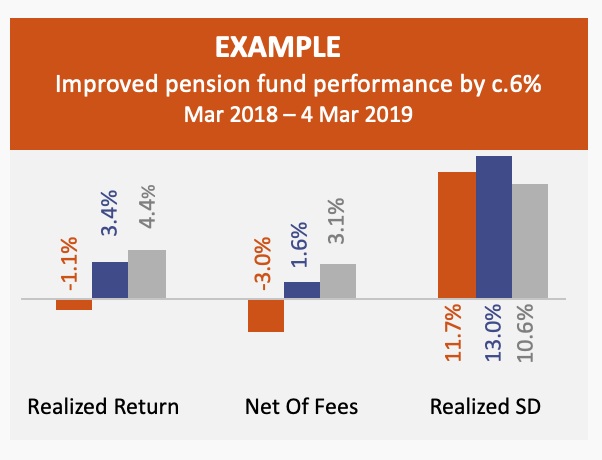
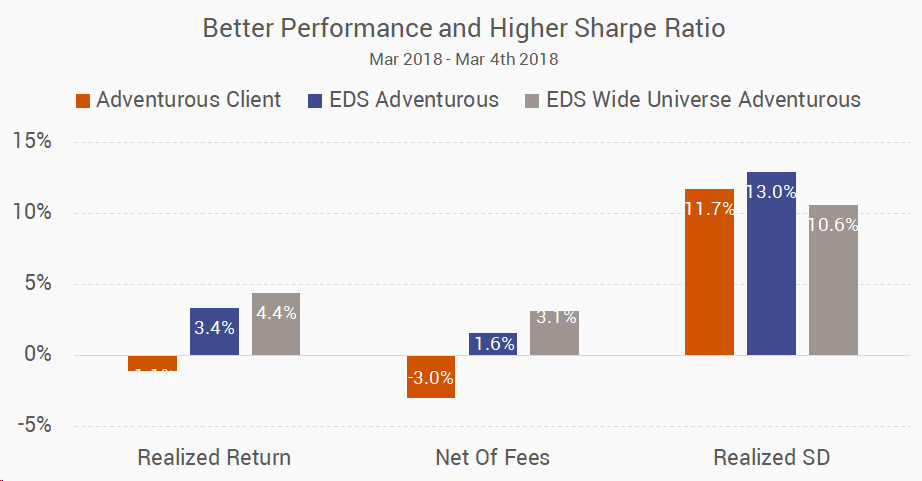
*Past performance is not a reliable indicator of future results, yearly performance breakout in the appendix
©2019 Economic Data Sciences
©2019 Economic Data Sciences
©2019 Economic Data Sciences
©2019 Economic Data Sciences
©2019 Economic Data Sciences
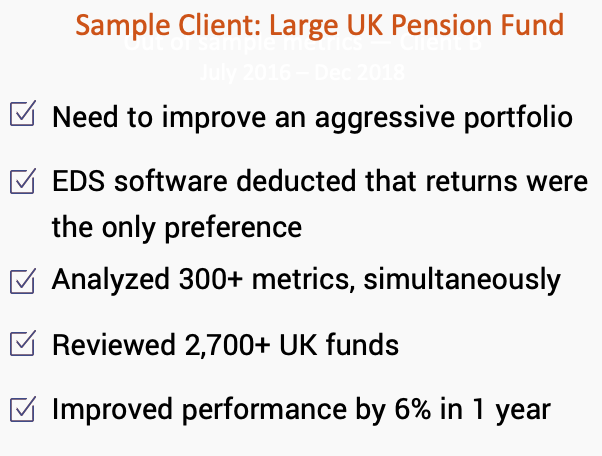
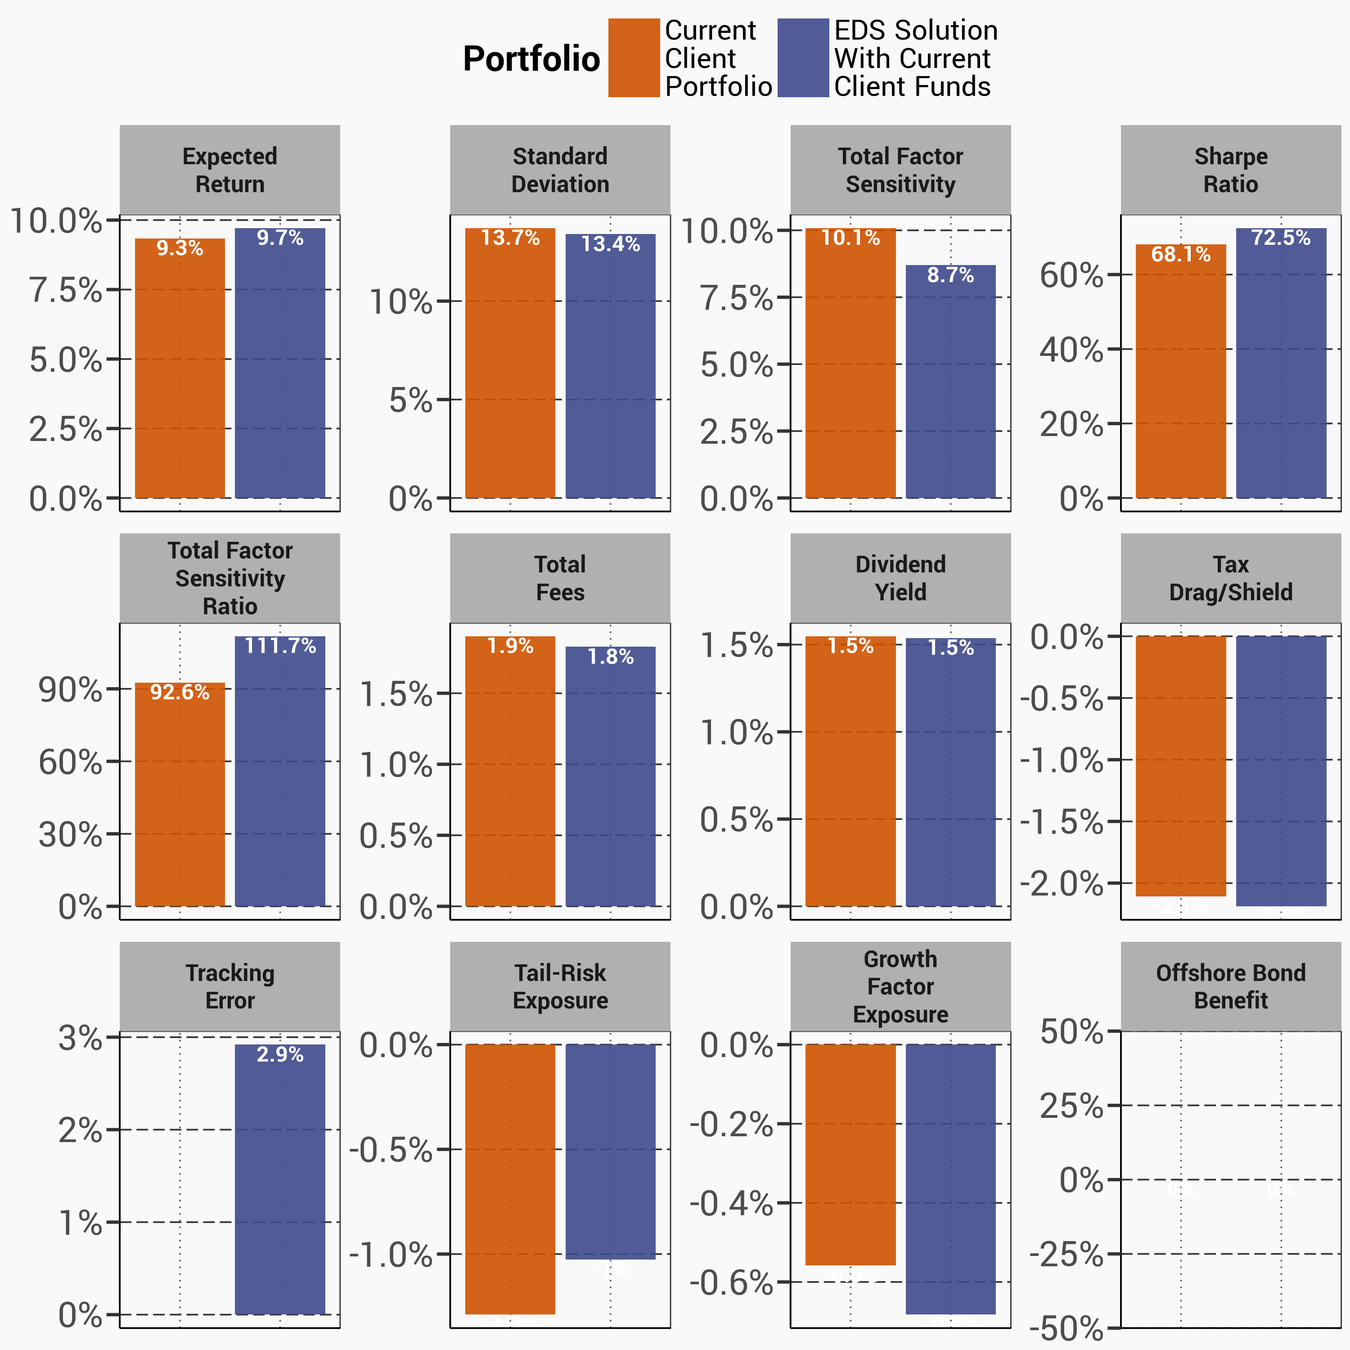
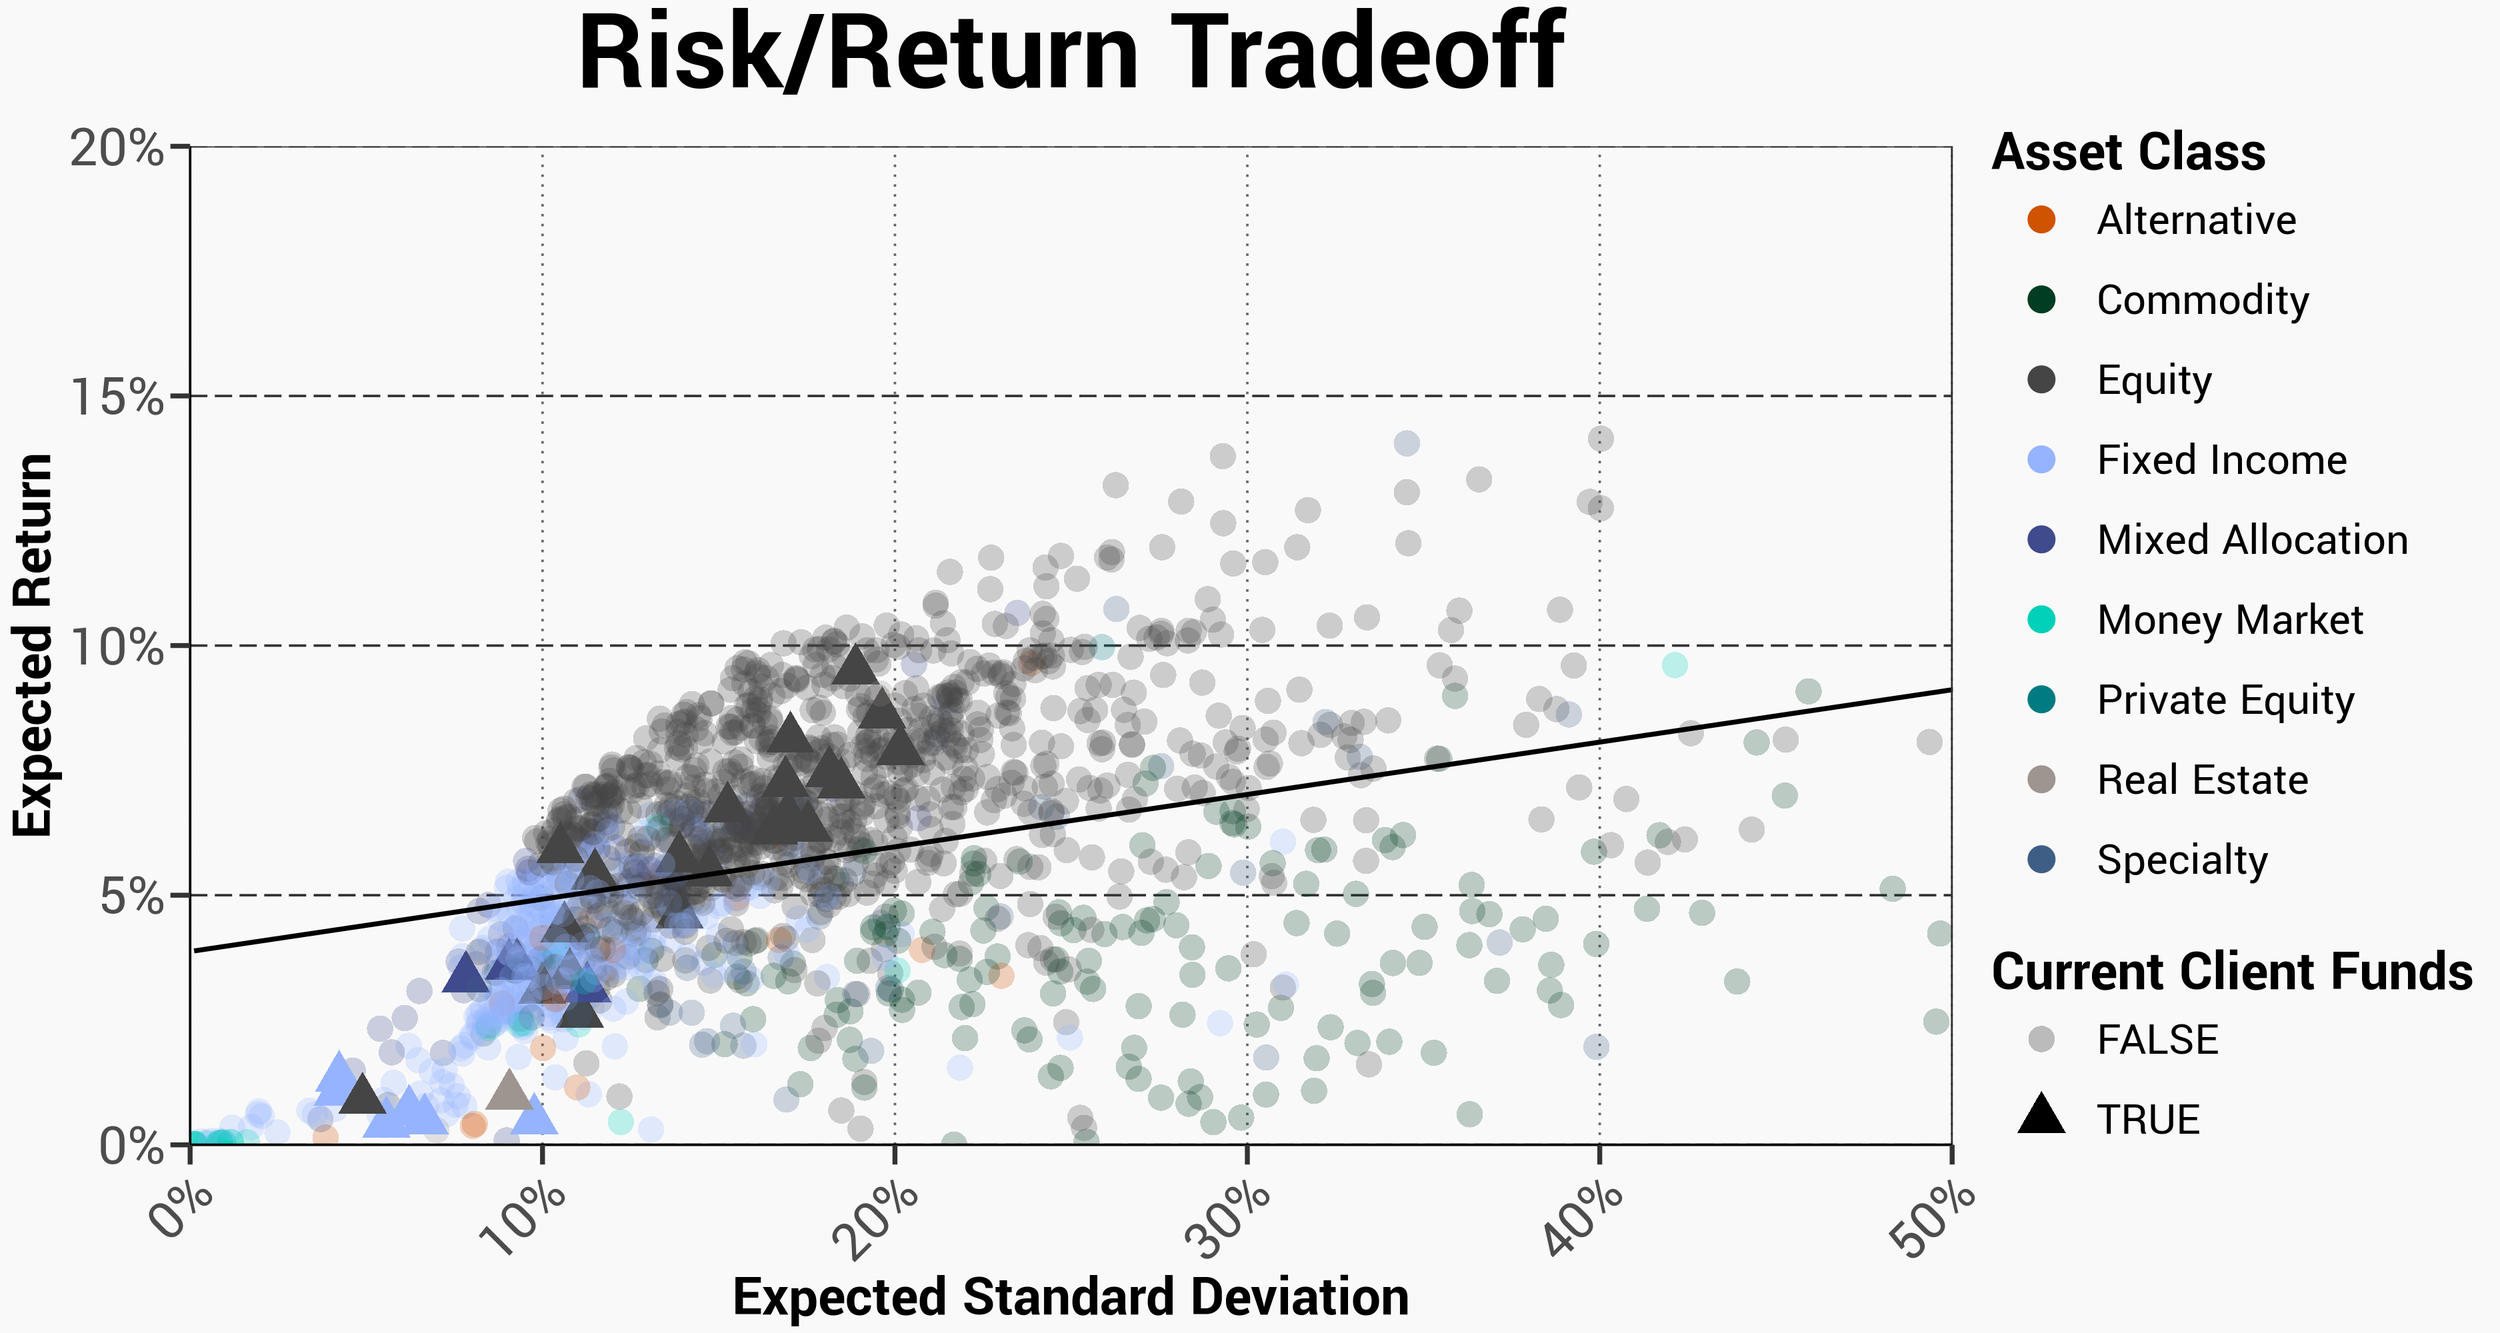
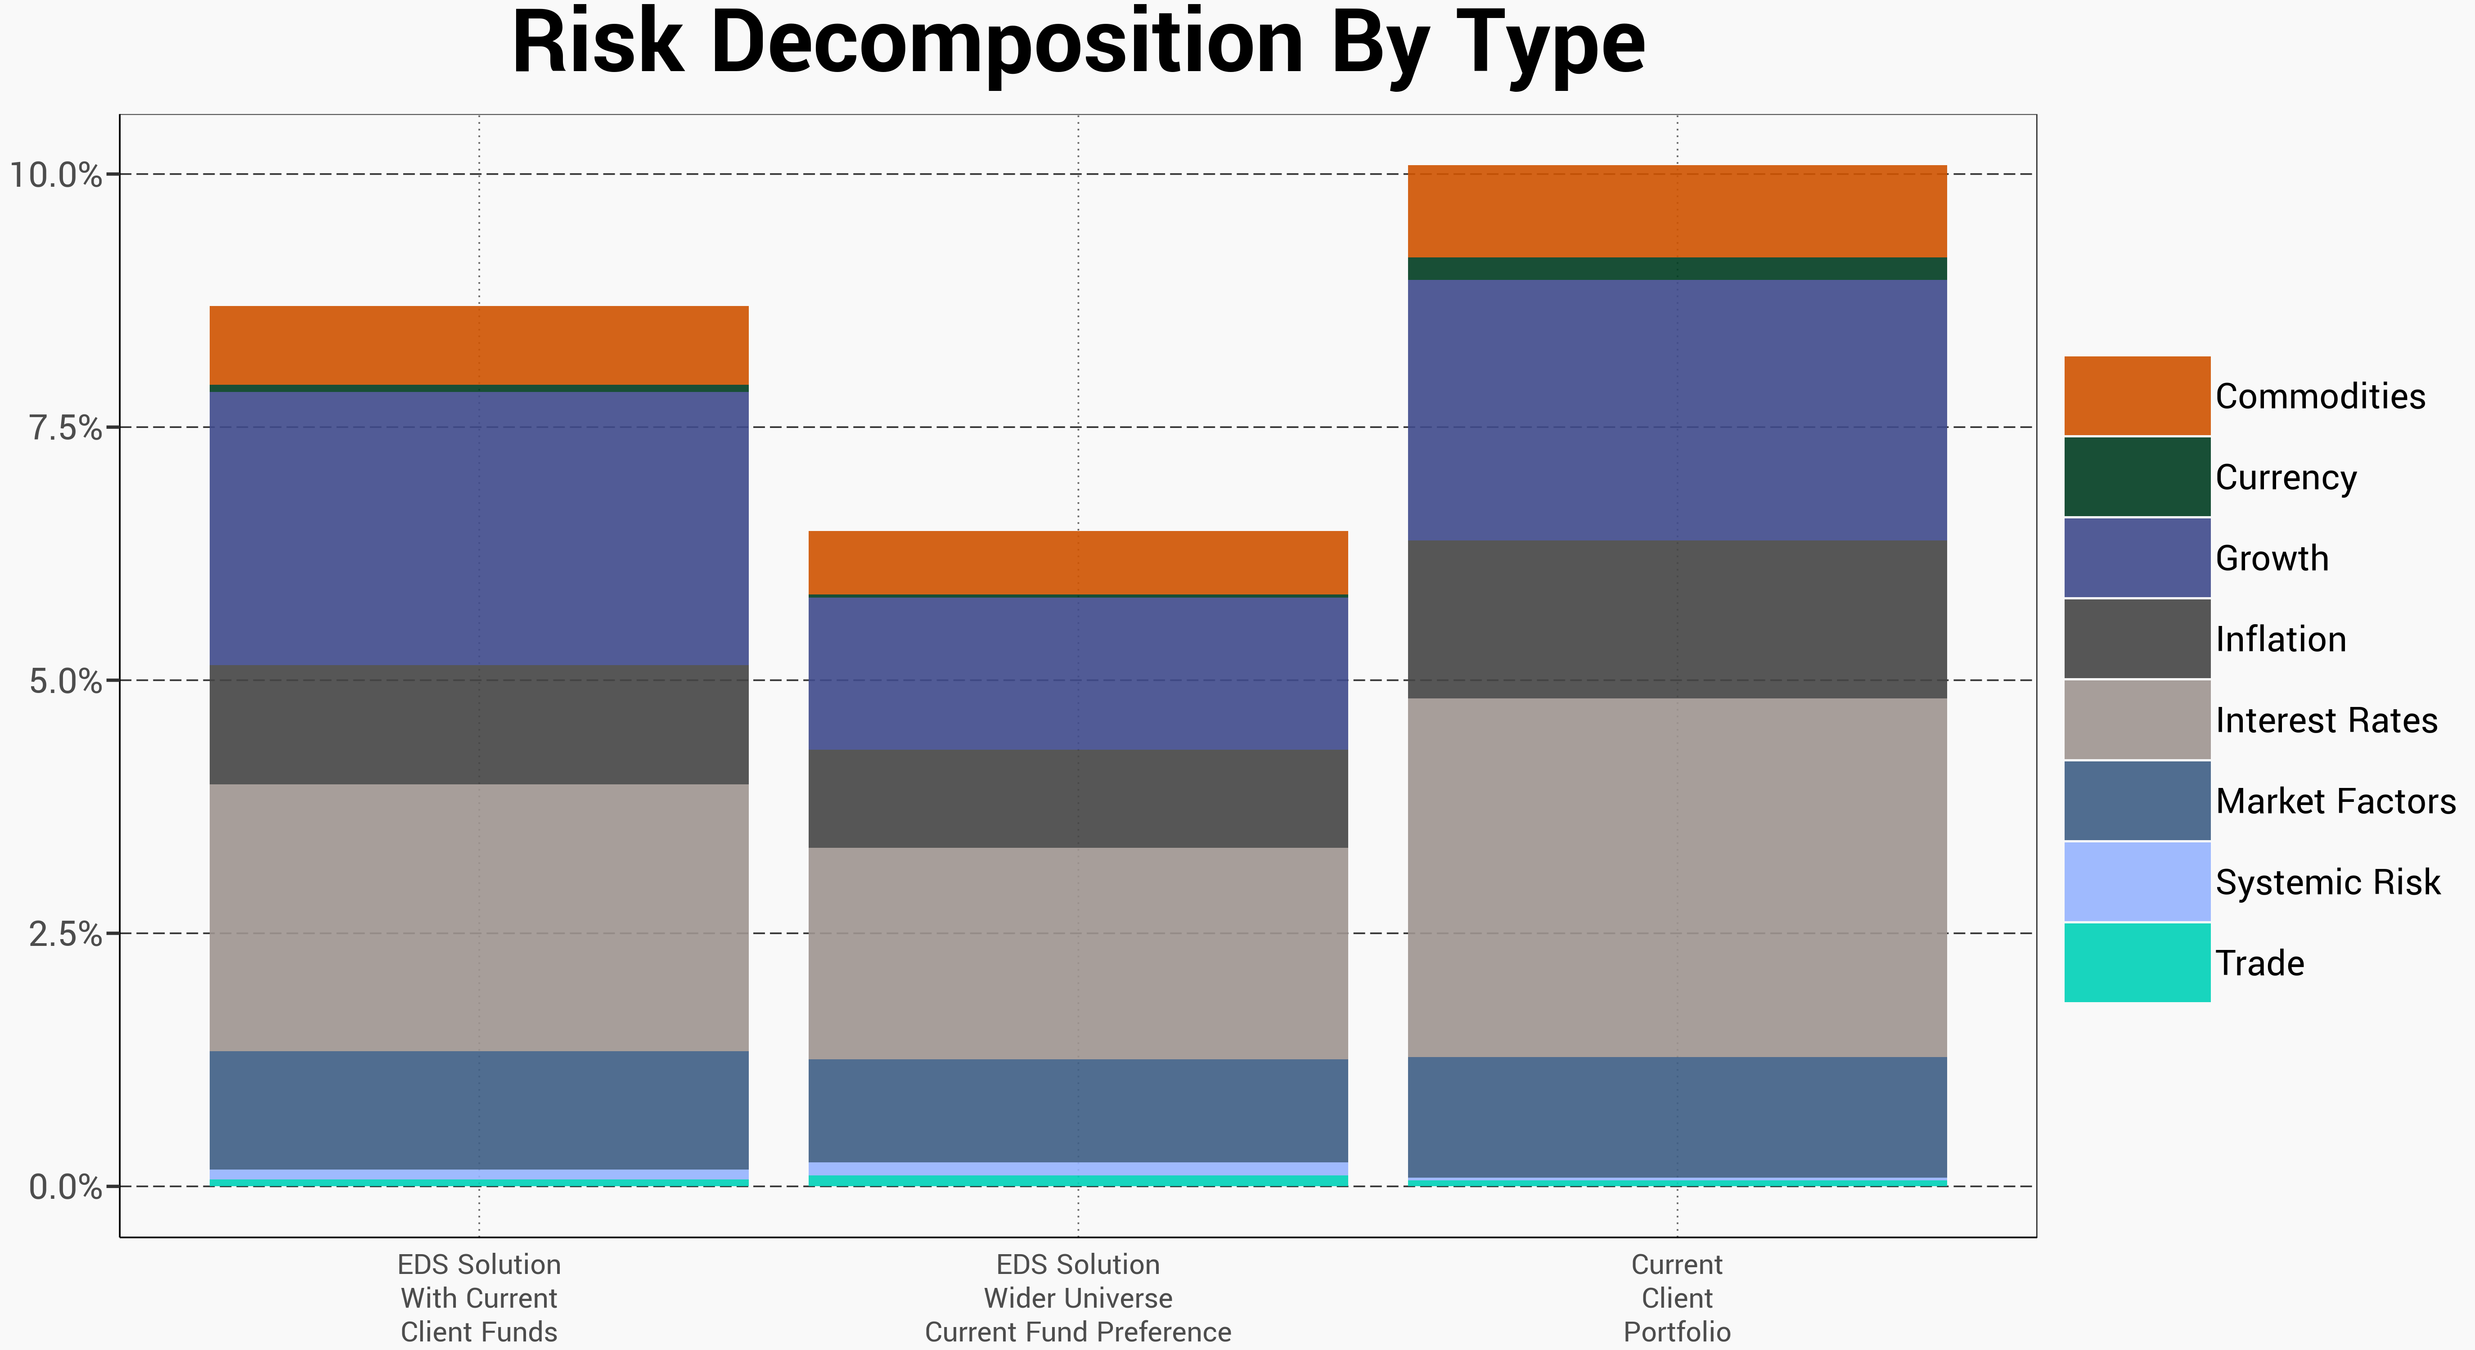
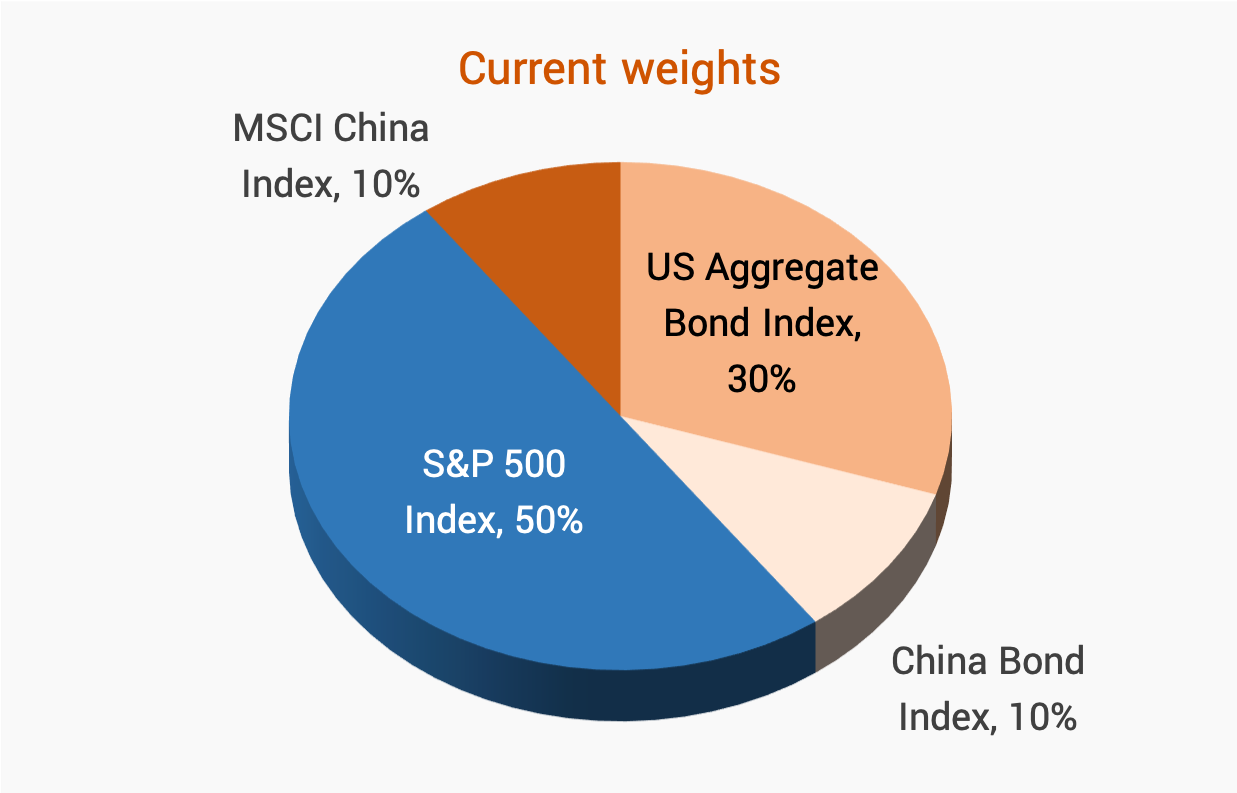
EDS was given a sample portfolio by a UK pension fund. Since only the asset weights were known, EDS tool deducted the investors' preferences and proceeded to analyze the holdings
The following preferences were deducted:
©2019 Economic Data Sciences
©2019 Economic Data Sciences
©2019 Economic Data Sciences
©2019 Economic Data Sciences
©2019 Economic Data Sciences
©2019 Economic Data Sciences
©2019 Economic Data Sciences
*Past performance is not a reliable indicator of future results
©2019 Economic Data Sciences
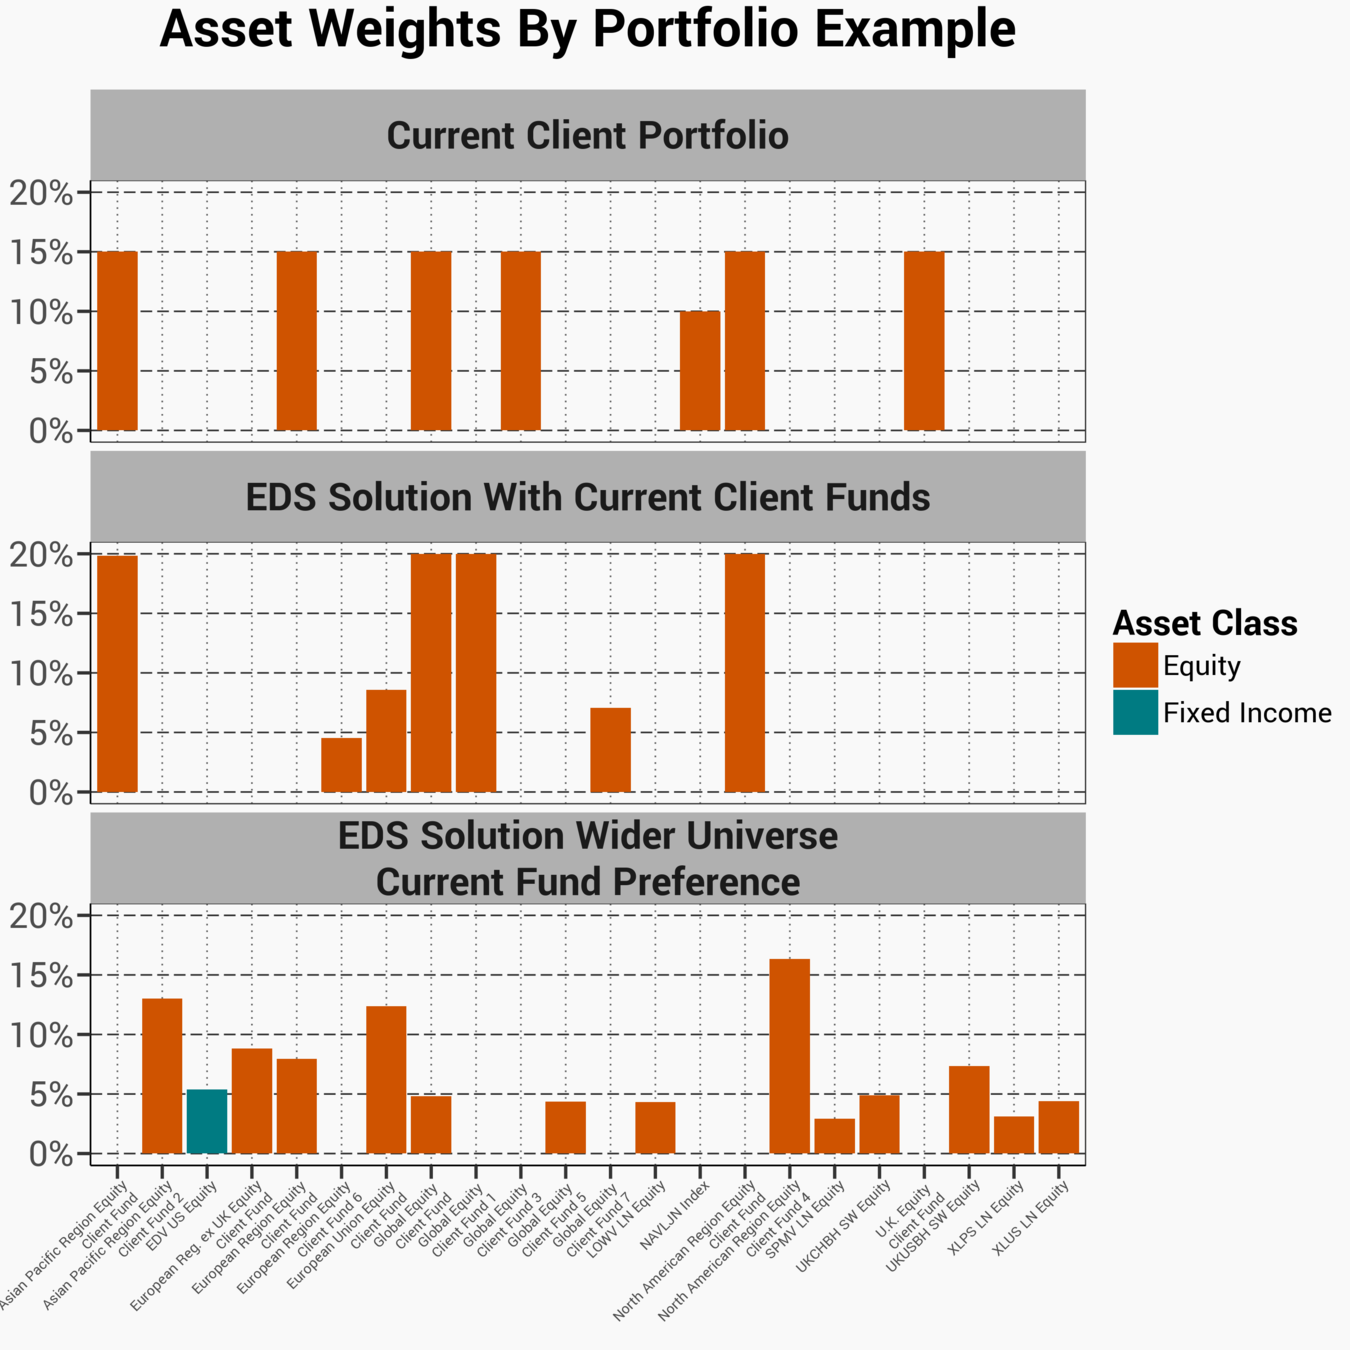
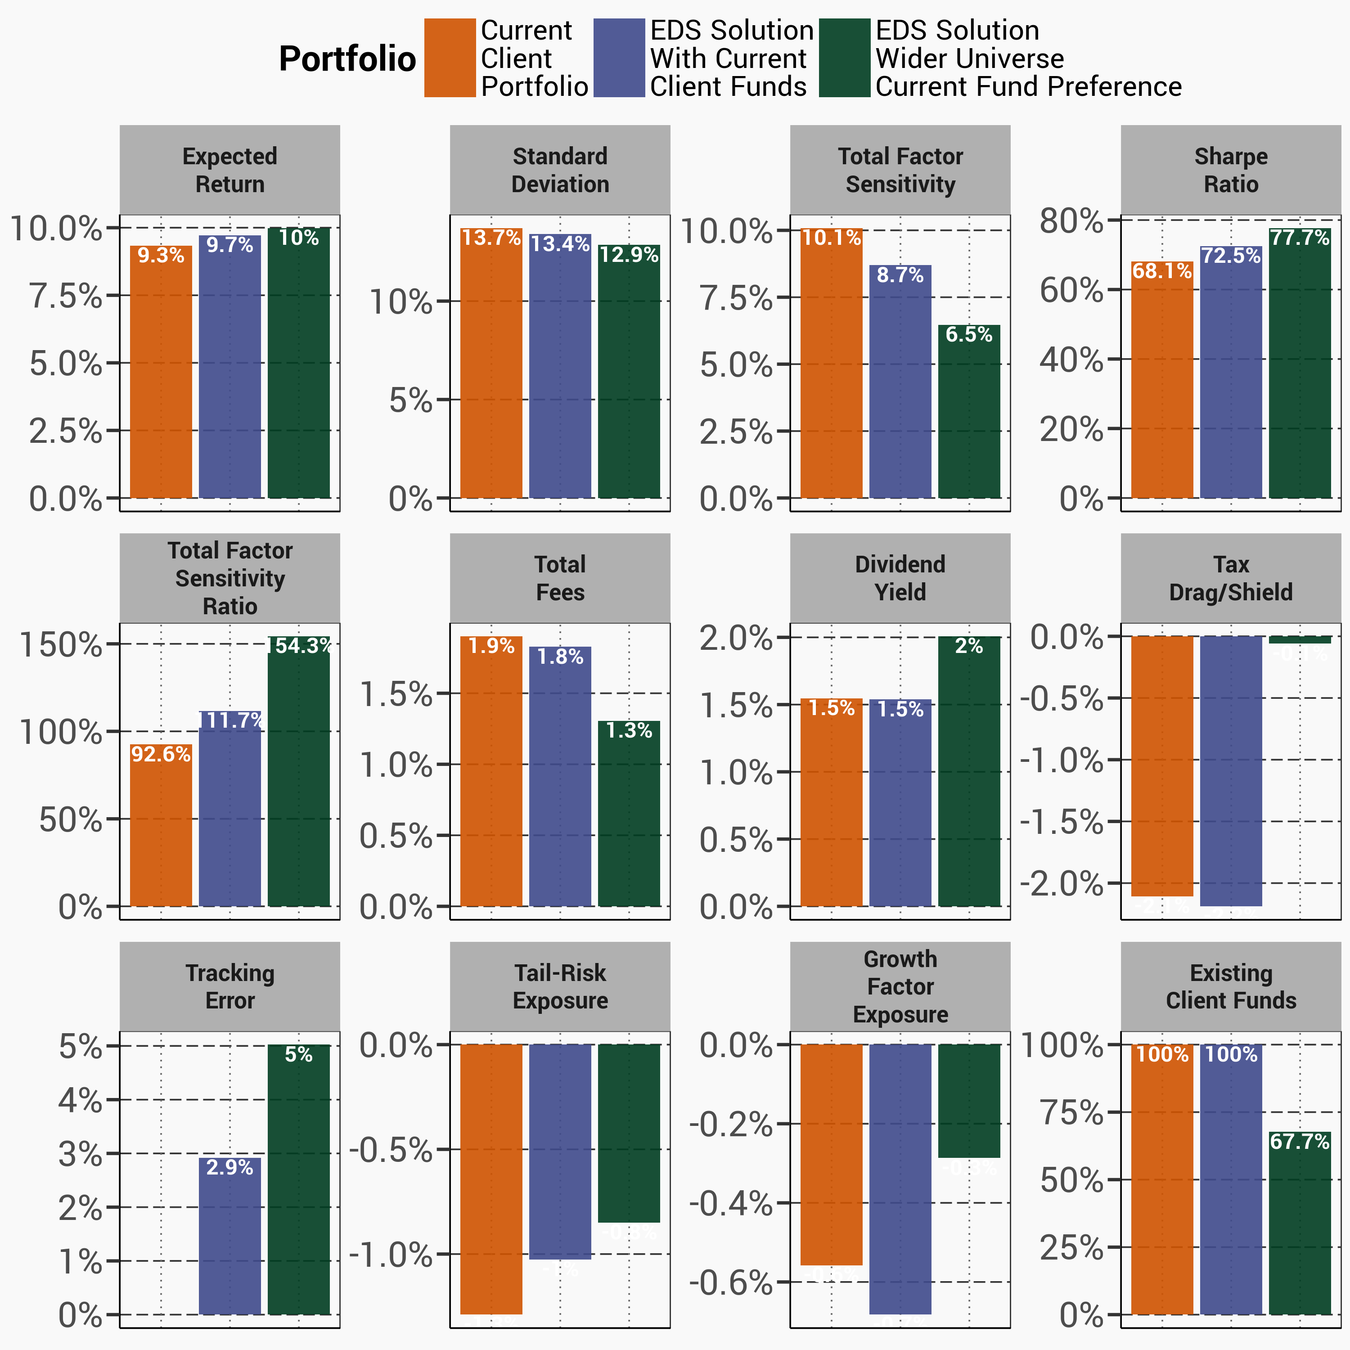
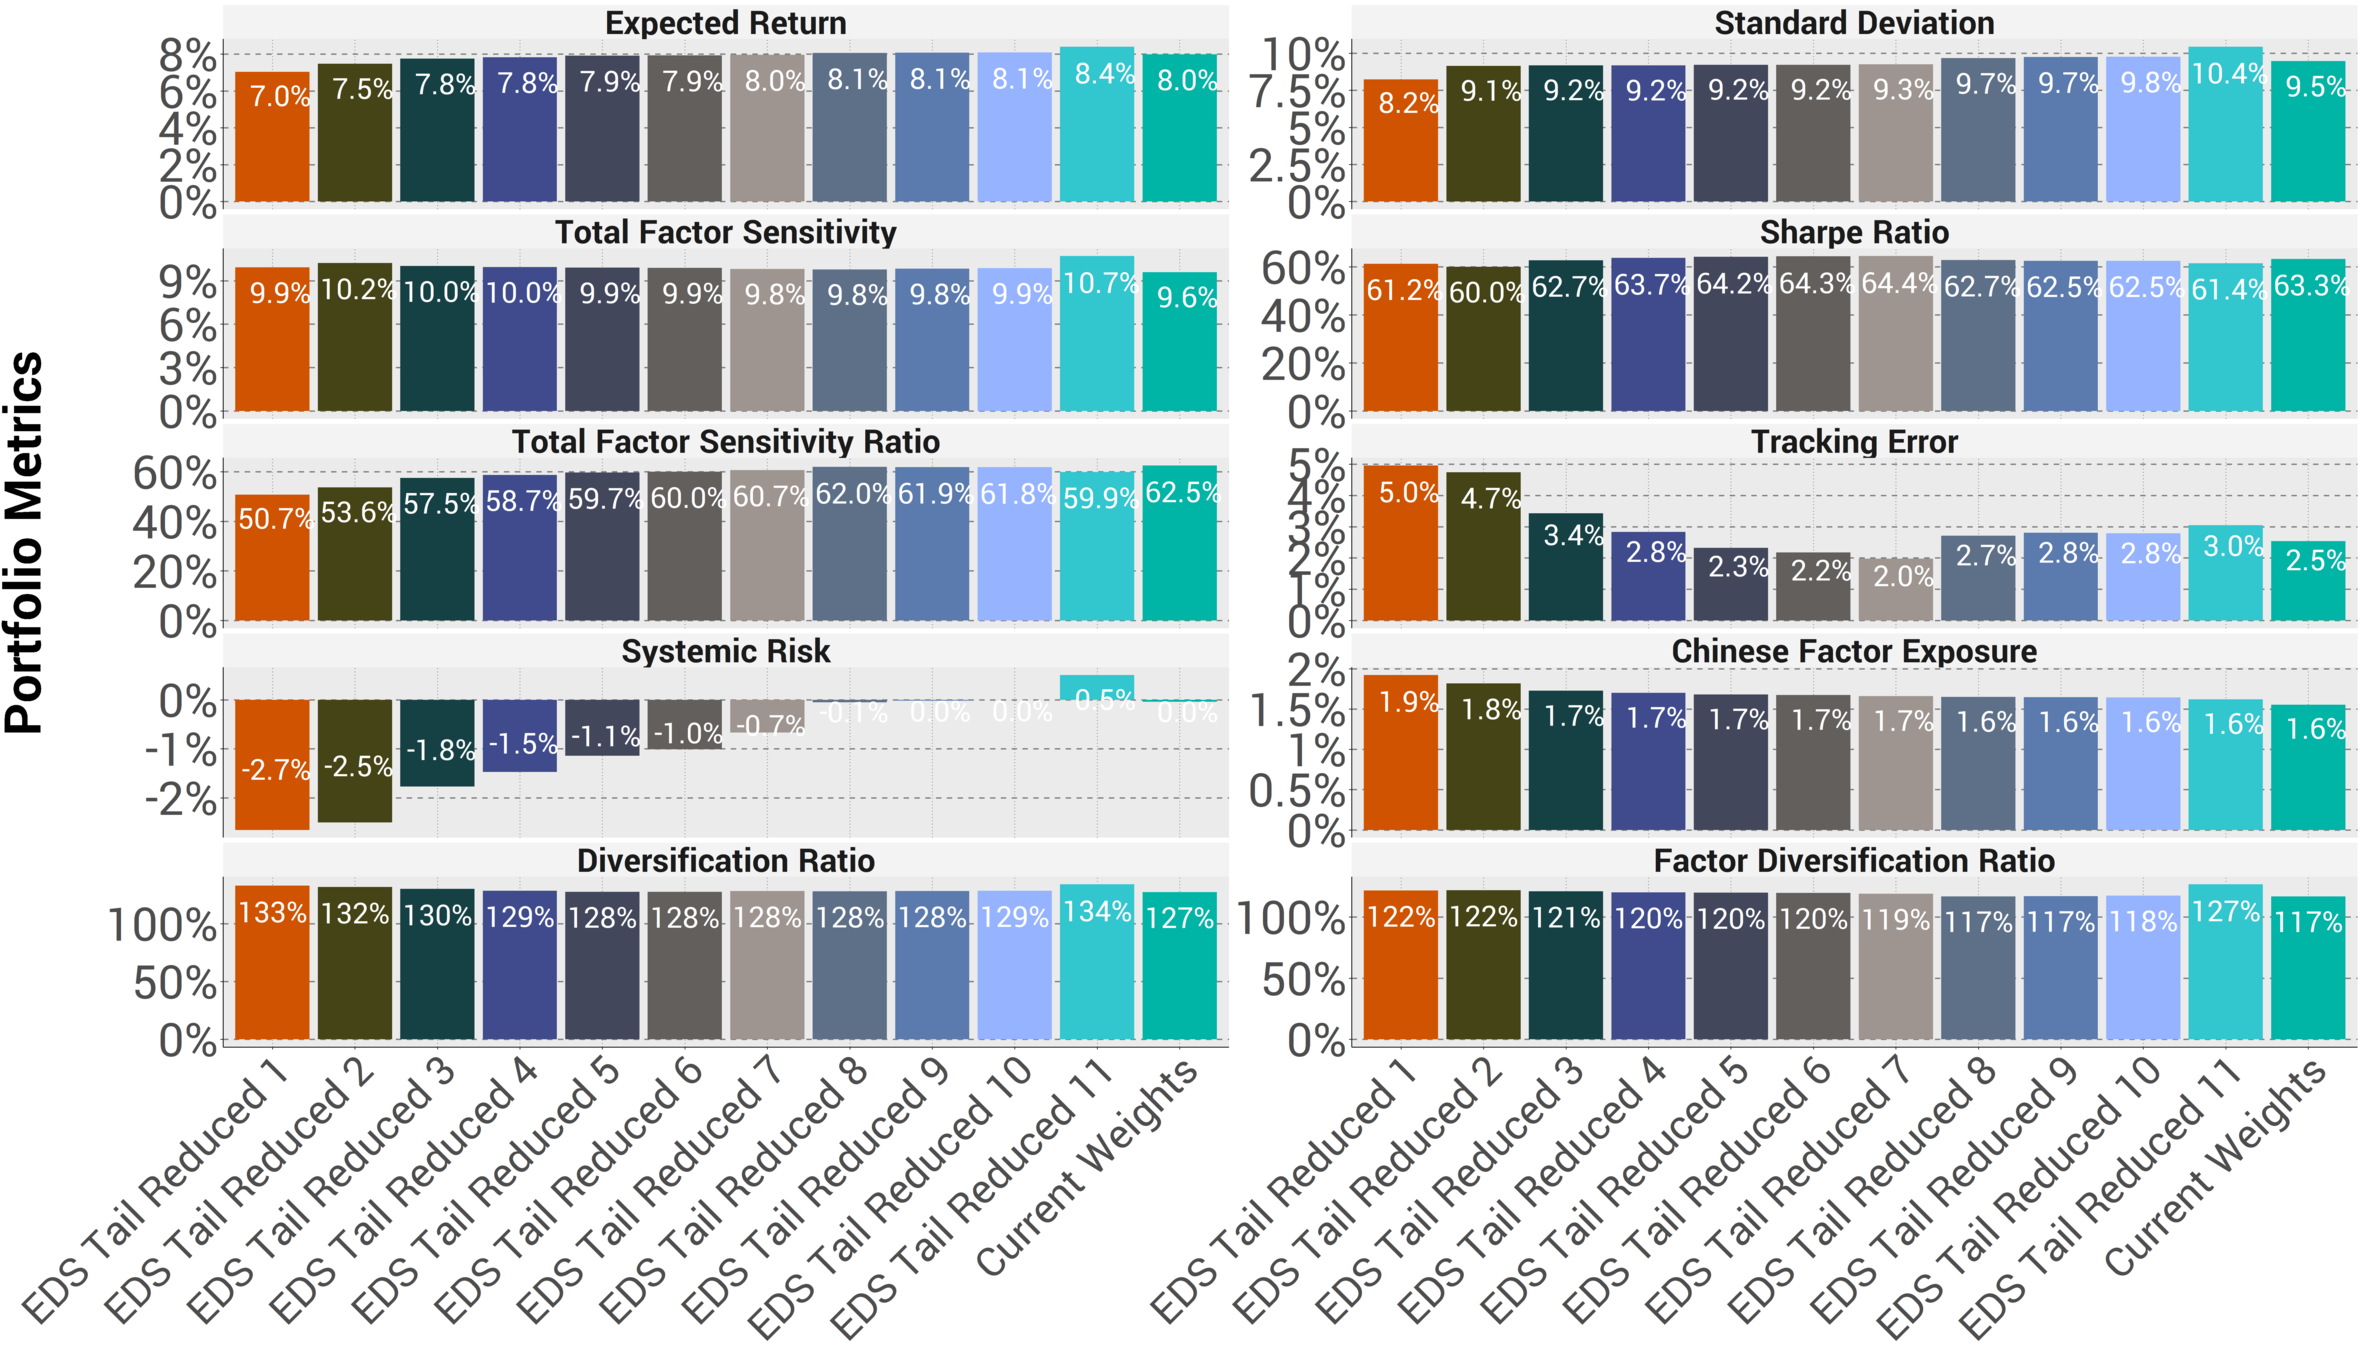
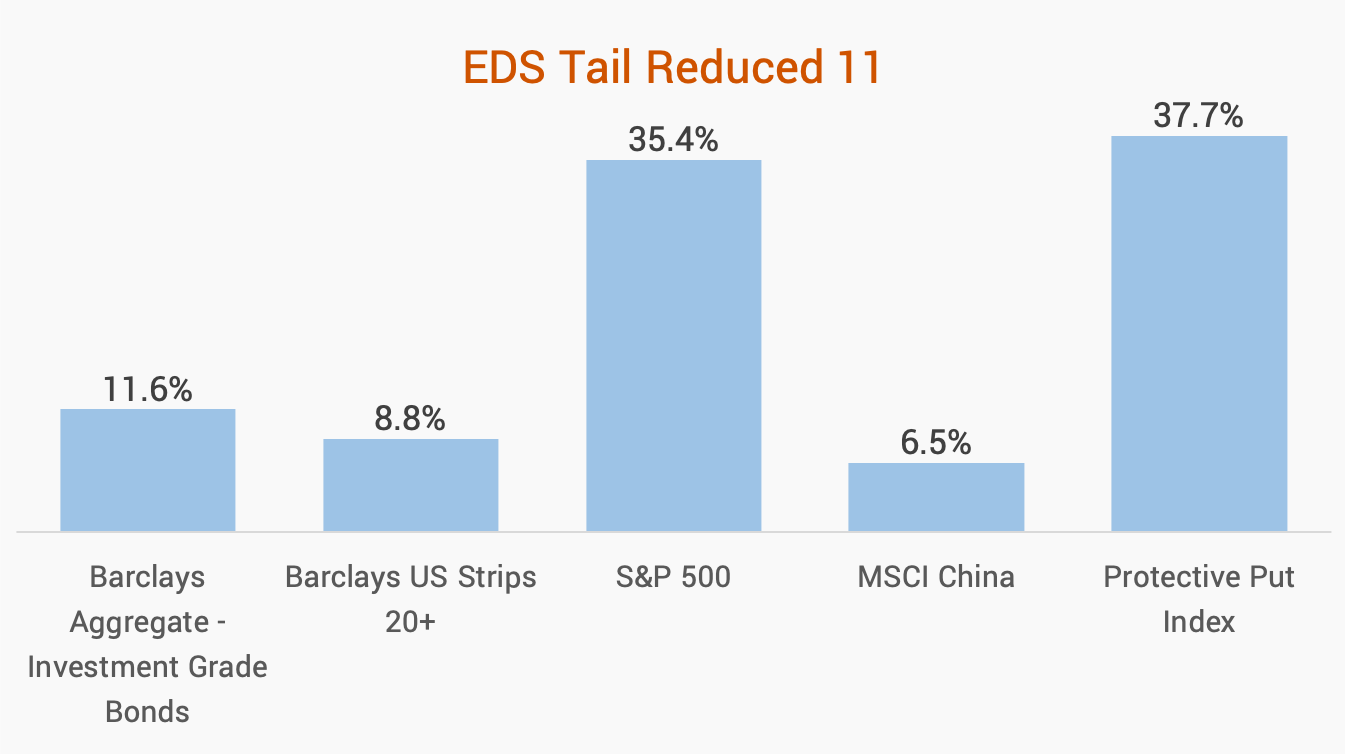
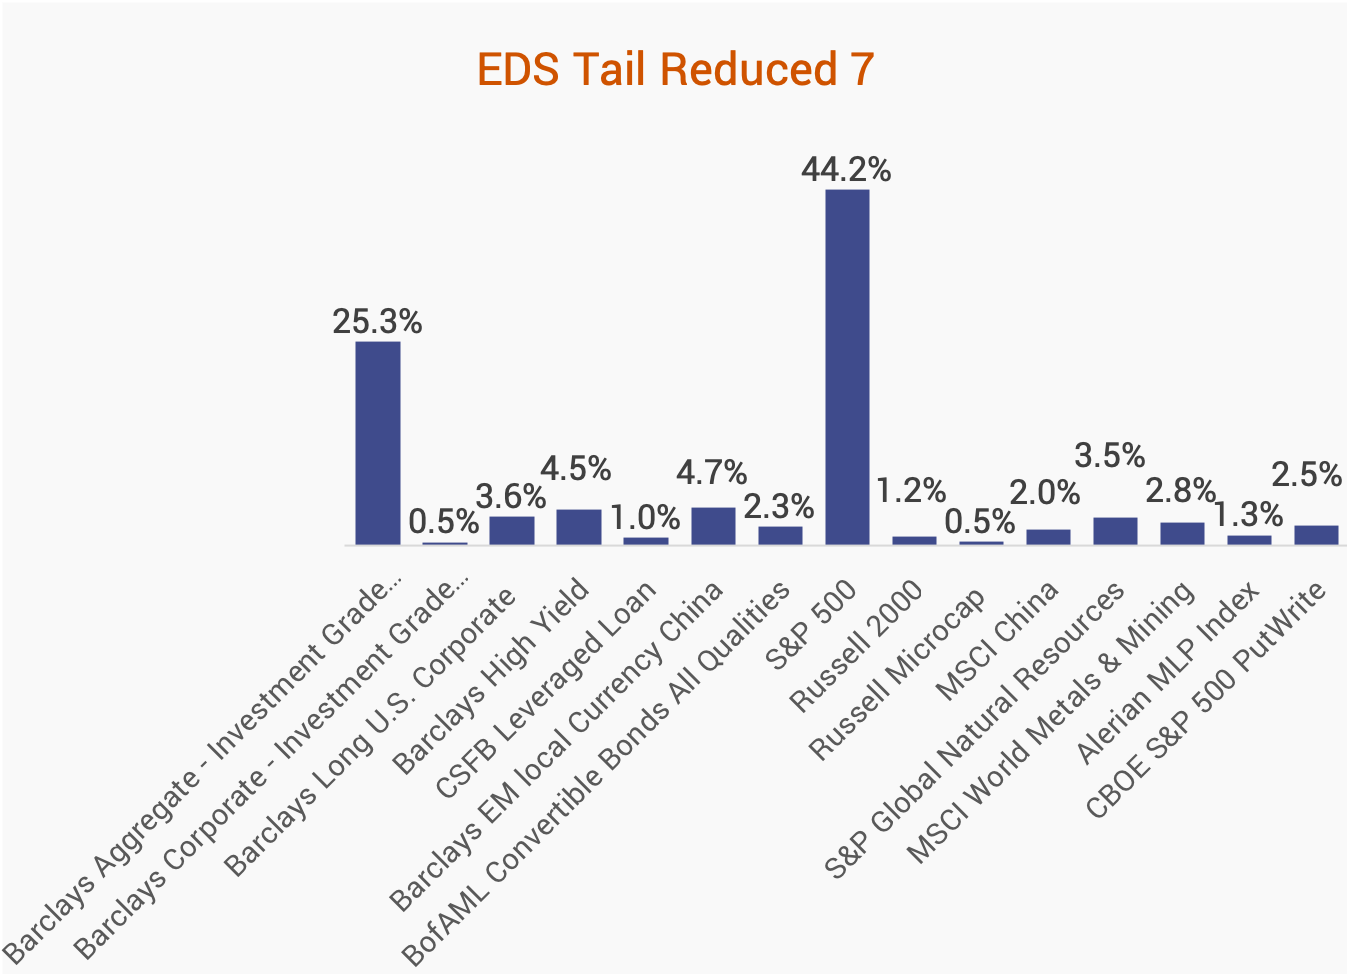
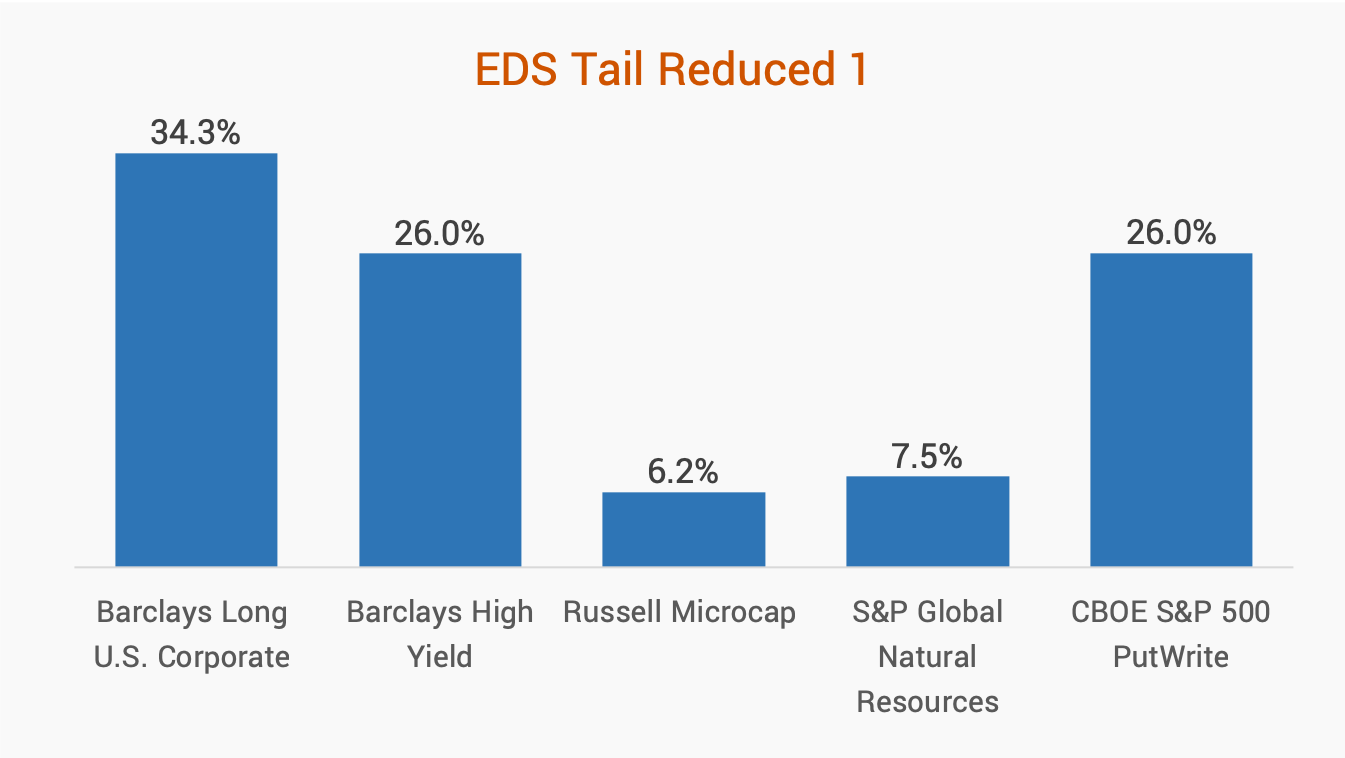
We show how the software iterates through portfolios and provides different options, depending on Client preferences
The Client had several simultaneous goals:
©2019 Economic Data Sciences
©2019 Economic Data Sciences
©2019 Economic Data Sciences
Number of funds or desired minimum/maximum fund weight can be modified
©2019 Economic Data Sciences
©2019 Economic Data Sciences
©2019 Economic Data Sciences
info@EconomicDataSciences.com
By Economic Data Sciences


