Understandable Artificial Intelligence

Content

©2019 Economic Data Sciences

  1. Takeaways From Other Projects
  2. A.I.'s Ability to Solve These Issues
  3. EDS Software Solution
  4. Where EDS is Different
  5. Tangible Client Benefits
  6. How We Work
  7. Two Client Work Examples

Takeaways From Other Projects

©2019 Economic Data Sciences

From our work with other investors, following challenges emerge:

  • Get more from less
    • Can we make existing resources more efficient?
  • 'Fat'-Tail Risk
    • How can we manage down markets that hurt performance and can permanently impair capital?
  • Balancing risk and opportunities in their many forms
    • How can we determine the 'right' trade-off for our investments?
  • Beyond attribution
    • What drives a manager's investment and style?

The Case for Artificial Intelligence

©2019 Economic Data Sciences

Significant performance improvement when combined with humans

At its core, A.I. allows for a broader, deeper analysis
Provides significant improvement in efficiency

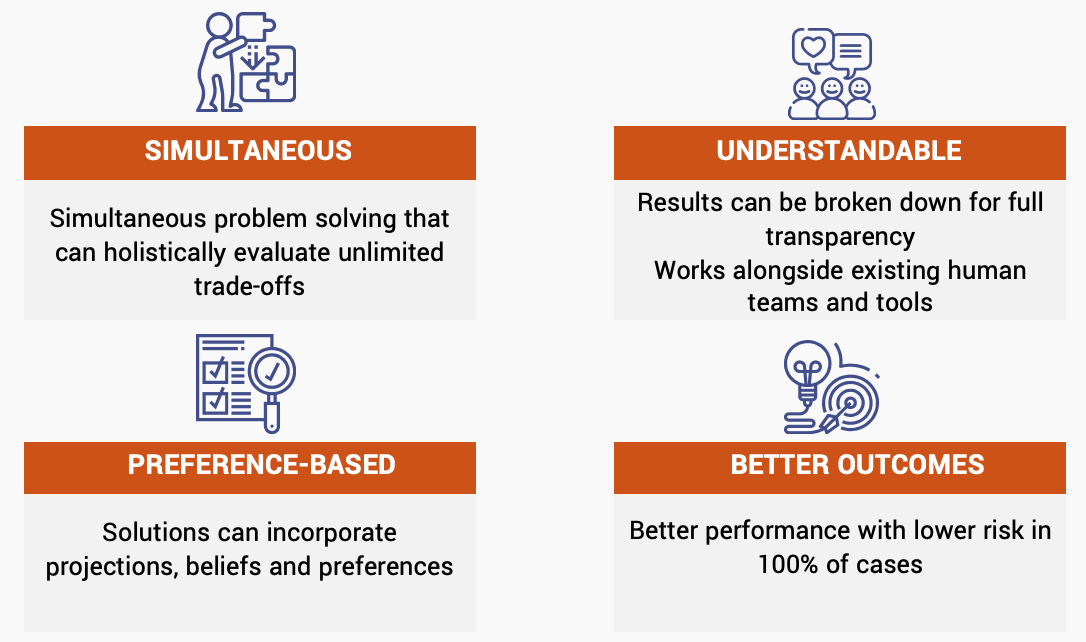
It has a unique ability to make improvements by searching across every known factor to get the best from existing best-practices

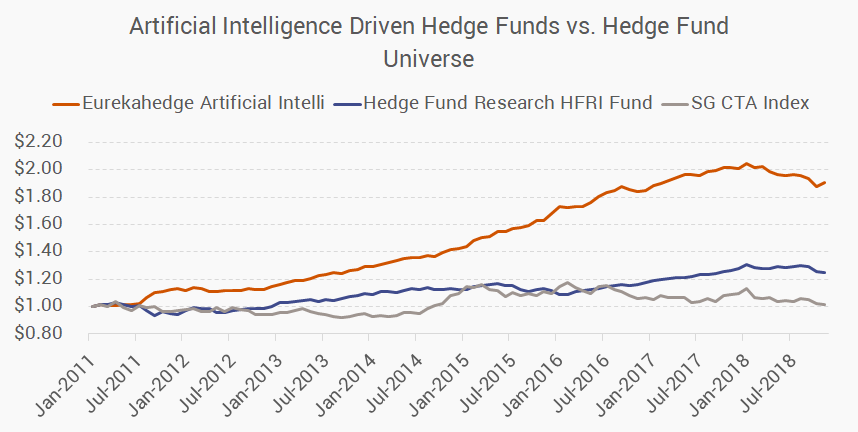
56% of institutional investors plan to increase integration of A.I.*

* - Greenwich Associates 2018 survey

A.I. is best used when combined with humans

A.I. Already Impacts Your Investments

©2019 Economic Data Sciences

  • Market participants are quickly adapting
    • 2013 these groups were negatively correlated, in 2018 strongly positive

The observable impact of A.I. in hedge funds is clear*

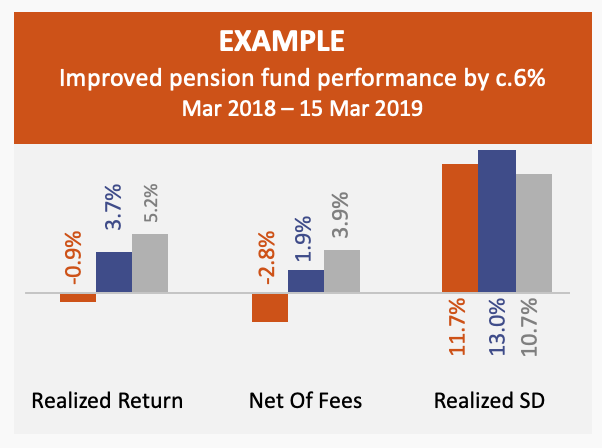
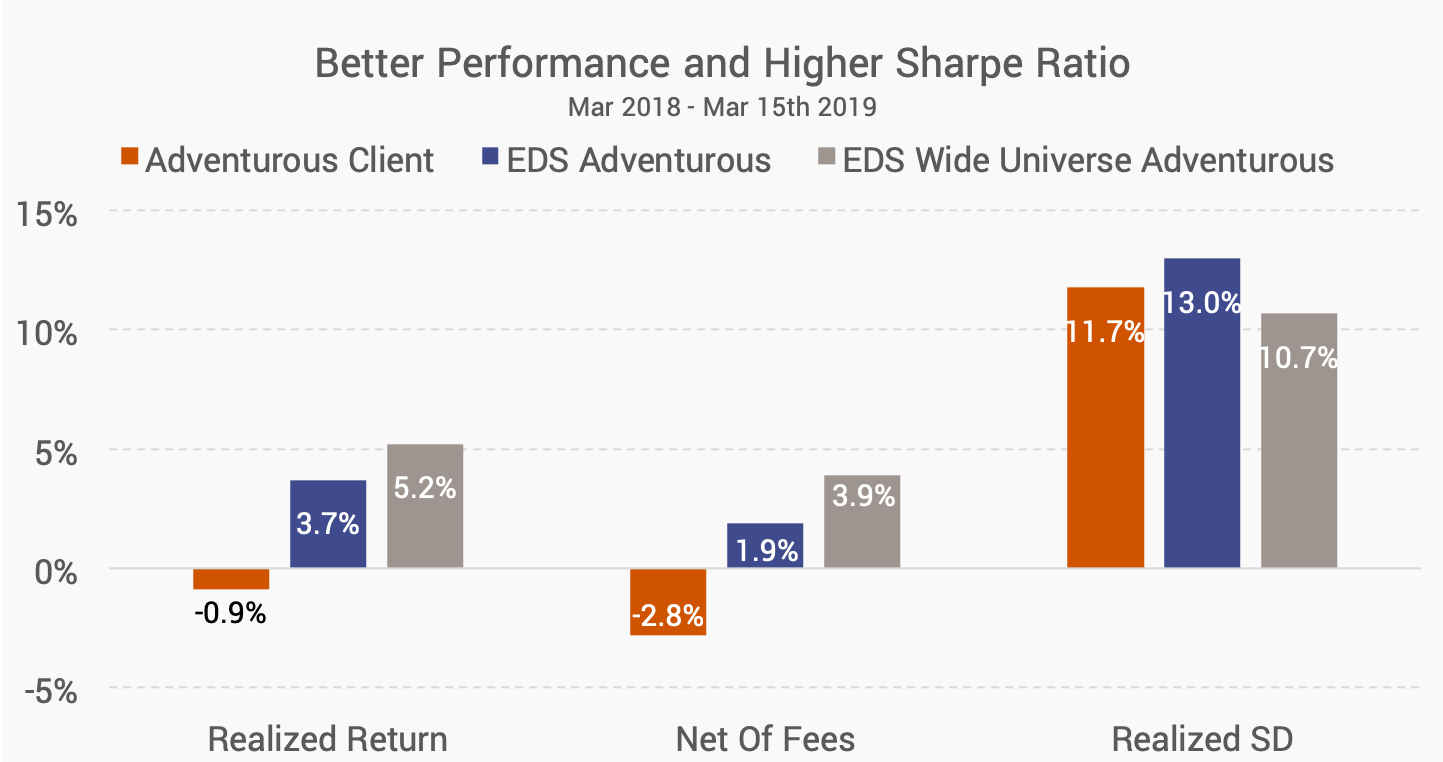
*Past performance is not a reliable indicator of future results, Yearly performance available in the Appendix

A.I. Is Transformational

©2019 Economic Data Sciences

Using A.I. in financial services has become industry best-practice

  • Aug 2017: 20% usage of A.I. or Machine Learning
  • Aug 2018: 56% usage

Blackrock Data Science Core

Exploratory programs on machine learning

  • A.I. based risk management
  • Dynamic factor analysis using A.I.
  • A.I. reconciling investment decisions

EDS Software Solution - First of its Kind

EDS developed the first software to solve these problems

©2019 Economic Data Sciences

Where EDS Differs

©2019 Economic Data Sciences

EDS improves results across dozens of metrics at the same time

EDS Tech - Best Possible Mix

©2019 Economic Data Sciences

Cutting edge technology with focus on ease of interpretation

Tangible Benefits to Working With EDS

©2019 Economic Data Sciences

EDS analysis has made immediate improvements in 100% of cases

*Past performance is not a reliable indicator of future results

Completed 21 pilot projects

Working With EDS

©2019 Economic Data Sciences

EDS provides 3 possible partner collaborations:

Case Study 1

Portfolio Optimization

Overview

©2019 Economic Data Sciences

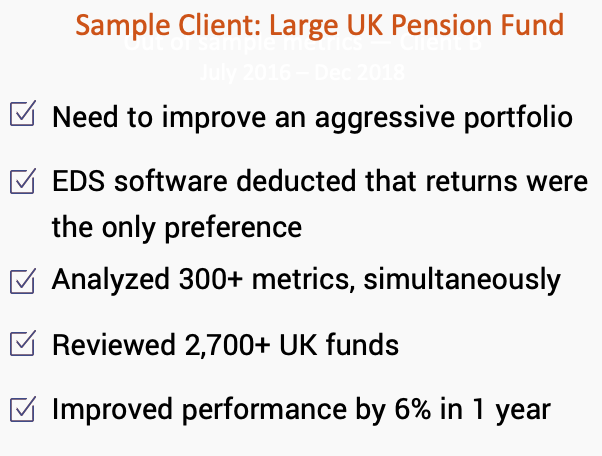
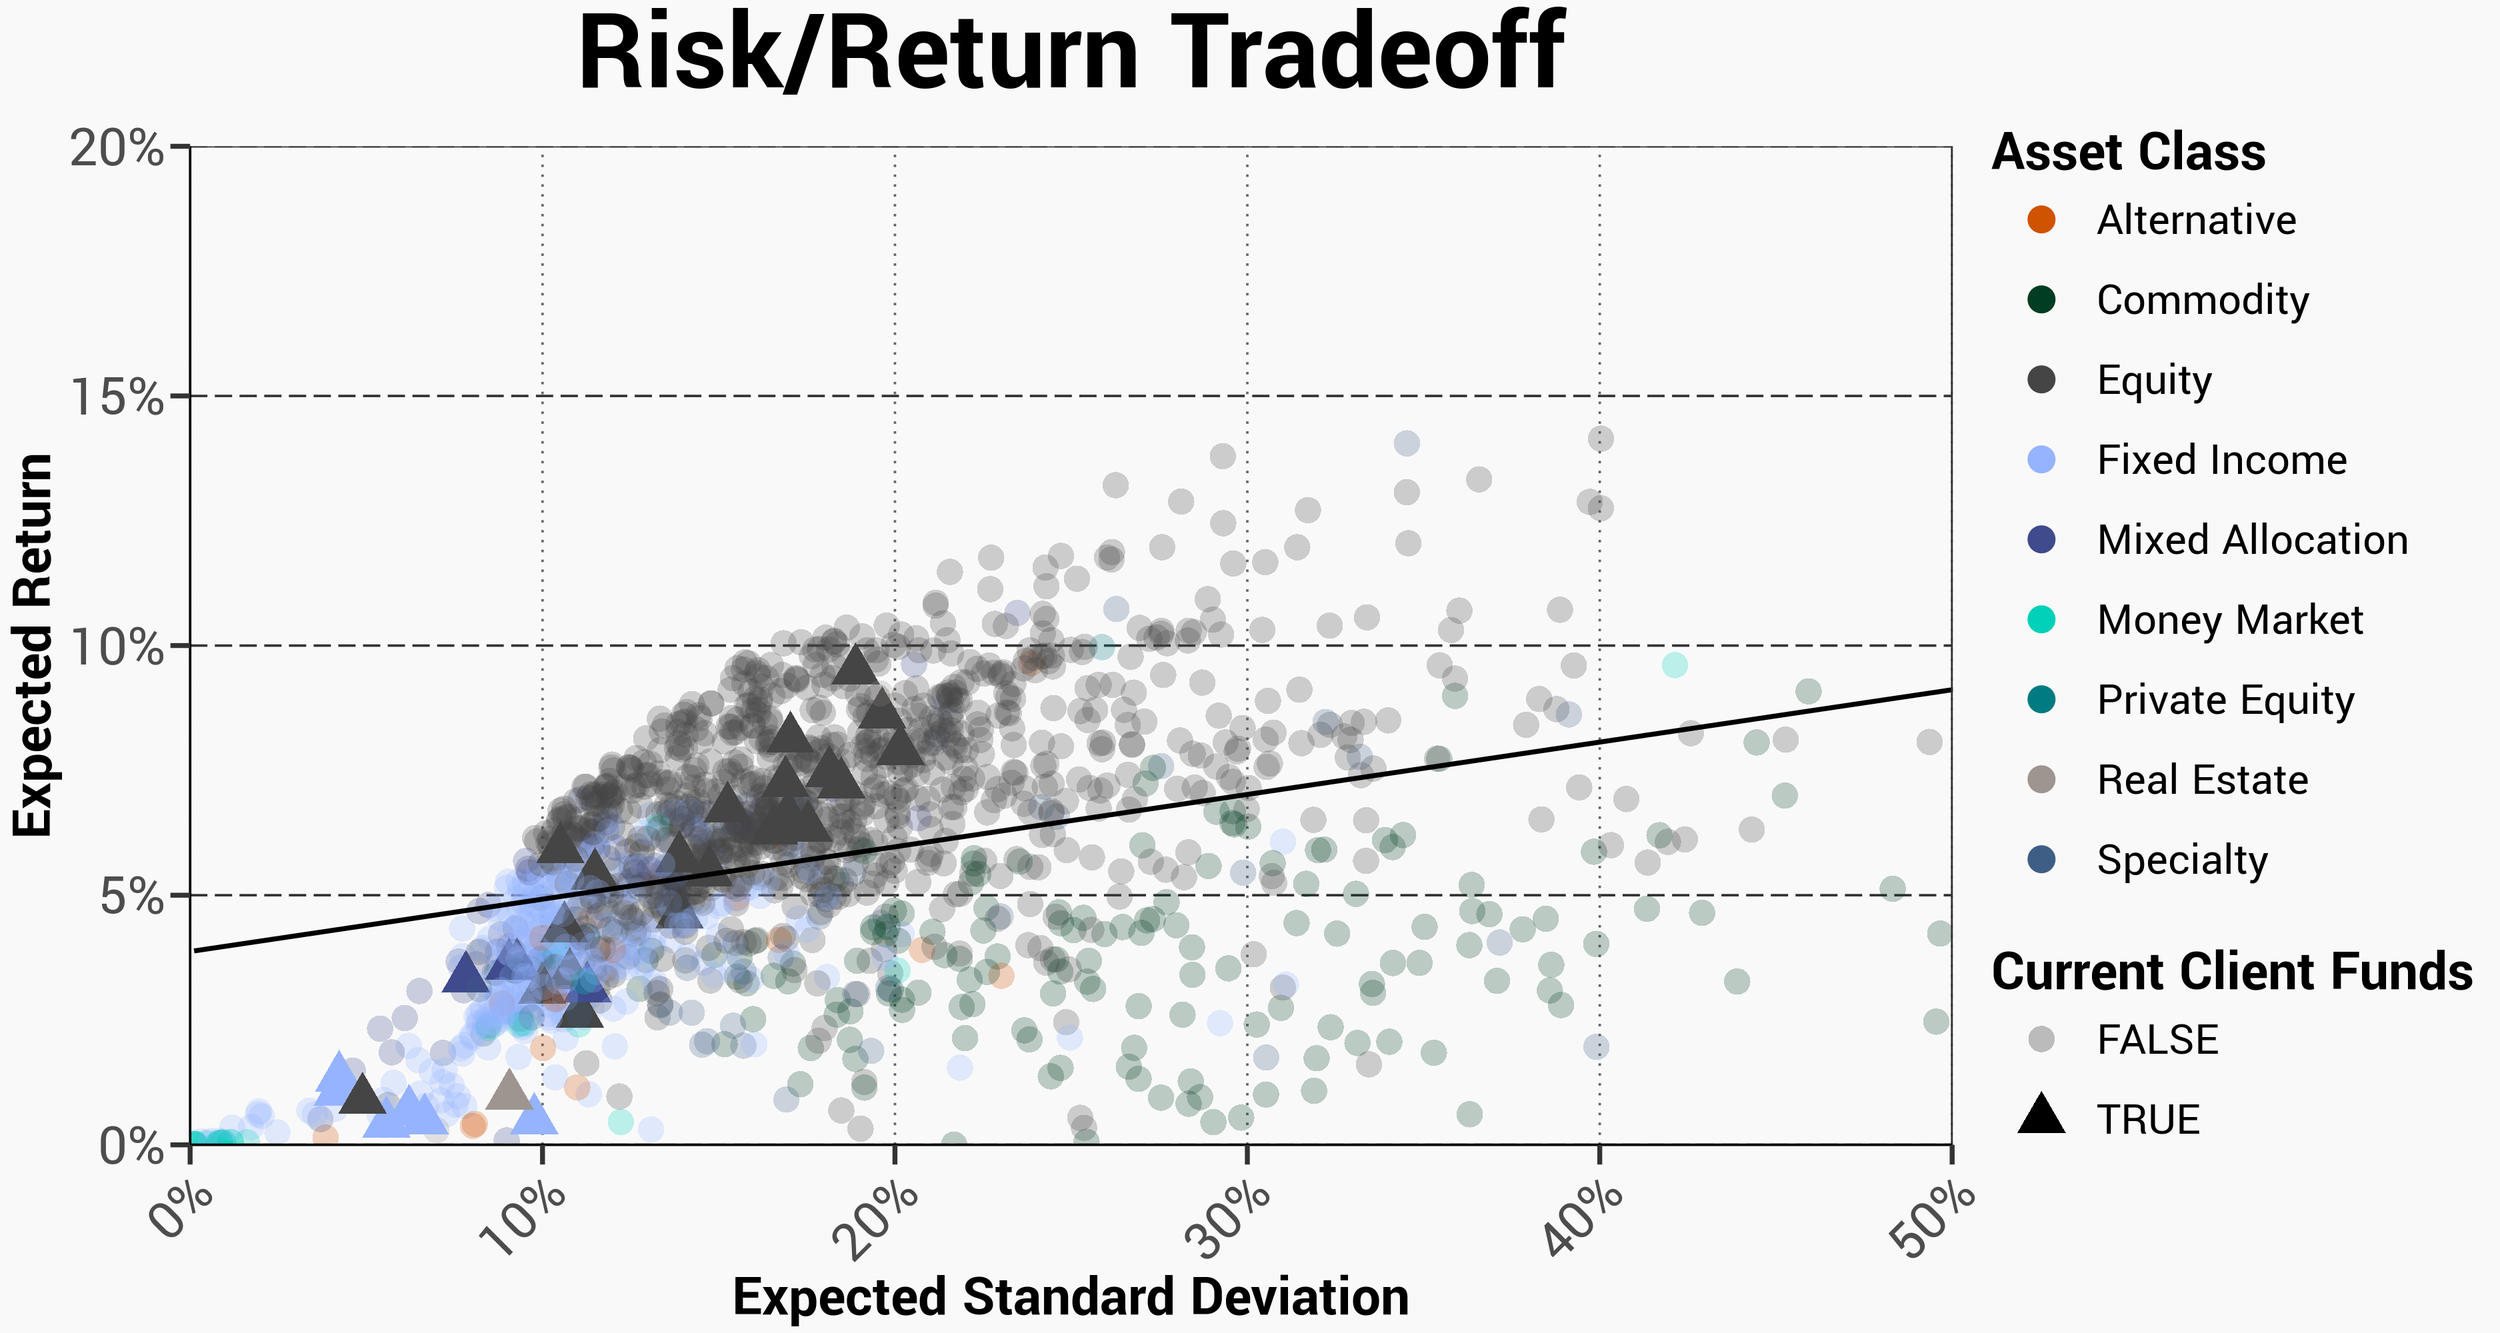
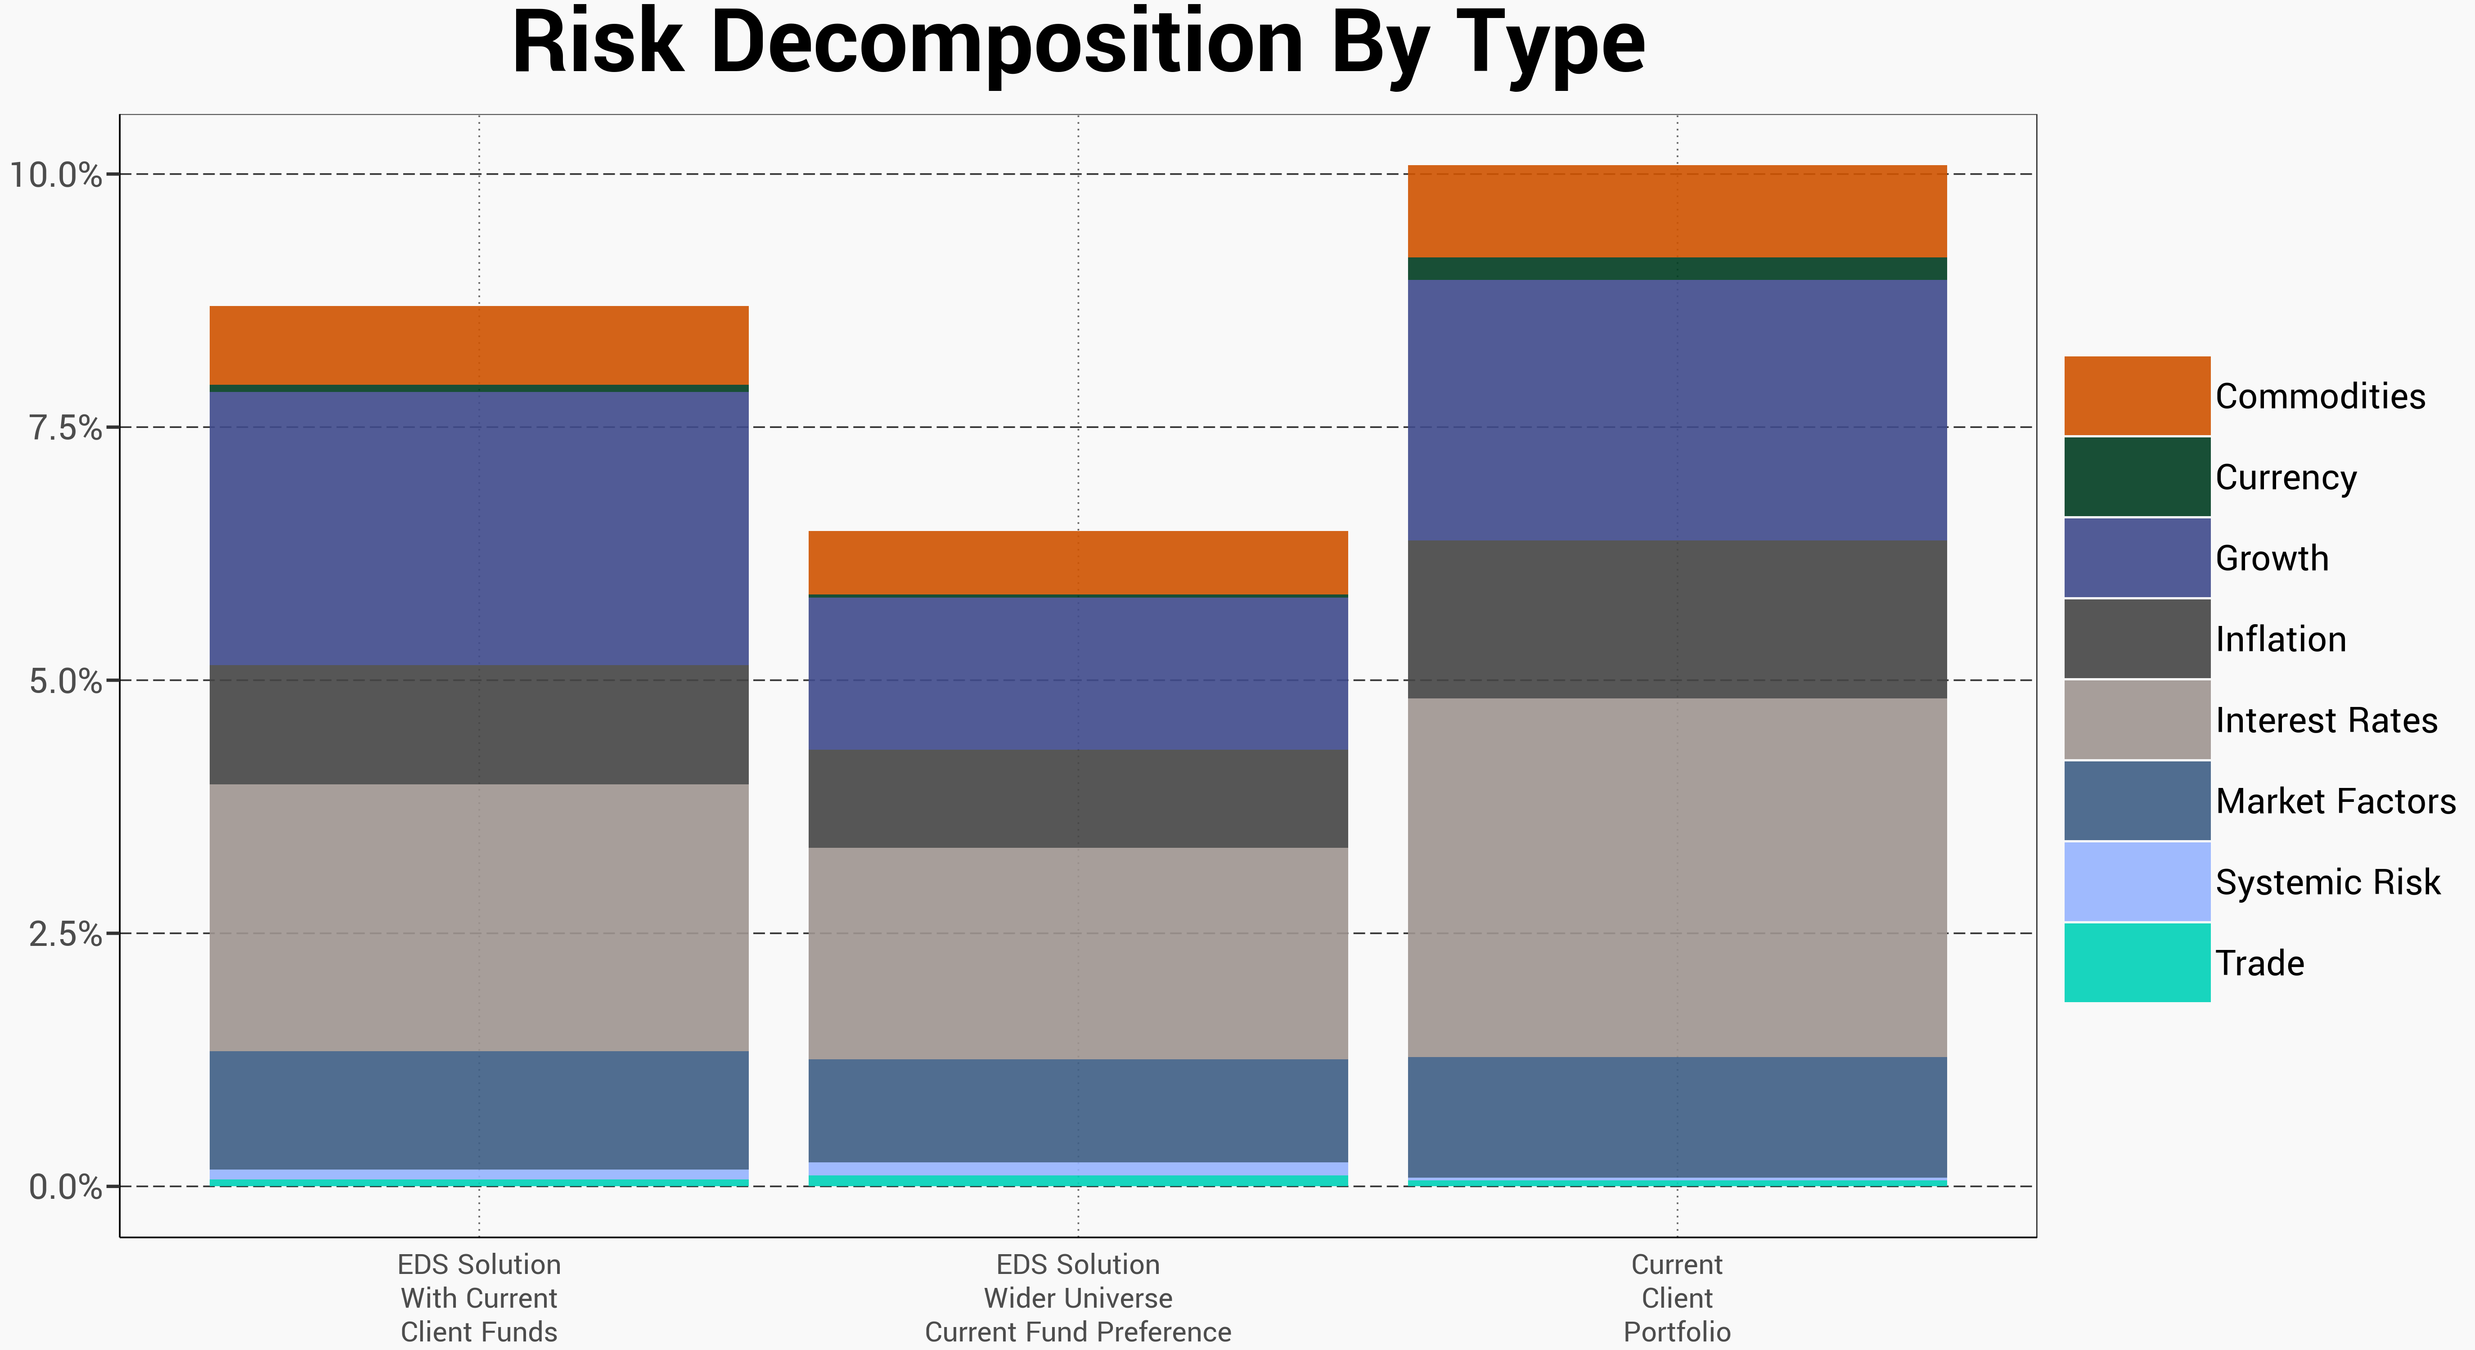
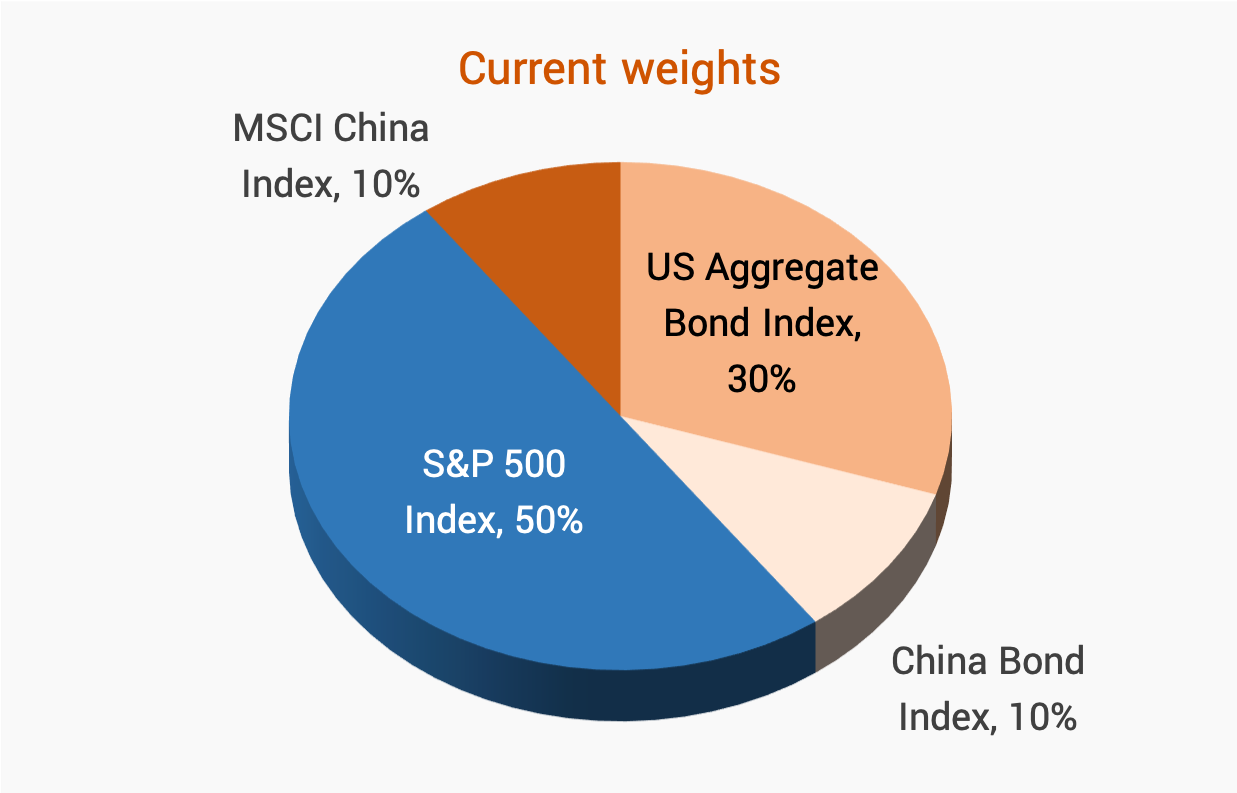
EDS was given a sample portfolio by a UK pension fund. Since only the asset weights were known, EDS tool deducted the investors' preferences and proceeded to analyze the holdings


The following preferences were deducted:

  1. Main focus was return
  2. Fees and volatility were less critical

Solution Using Client Universe

Universe included c.40 funds

©2019 Economic Data Sciences

EDS is expected to outperform existing allocation:

  • Higher expected return

  • Higher Sharpe Ratio

  • Lower volatility

Opening to External Funds

©2019 Economic Data Sciences

  • Expand possible investments beyond existing funds
    • Preference remains for approved client funds
  • Limit each fund to 20%
  • Focus on same preferences as the original portfolio

Results - Risk/Return

©2019 Economic Data Sciences

EDS tool reviewed 2,743 potential U.K. funds

  • Original portfolio allocation shows good asset selection
  • Broader universe allows for more targeted risk taking
  • The average mixed allocation fund expects a 6.1% annual return with 13.8% S.D.

Results Overview - Funds

©2019 Economic Data Sciences

EDS recommended the following holdings

  • Each fund is capped at 20%
  •  
  • 8 additions to original portfolio
  •  
  • Full flexibility around which funds and how many to include

Results Overview

©2019 Economic Data Sciences

Significant projected improvement using EDS tool

  • Higher expected return
    • With lower standard deviation
  • Lower management fees
  • Higher dividend yield
  • Client approved funds comprise 68% of the total
Every metric can be flexed and adjusted depending on individual preferences

Actual Results Since Recommendation

©2019 Economic Data Sciences

EDS recommendation delivered superior results

*Past performance is not a reliable indicator of future results

Results Overview - Risk

©2019 Economic Data Sciences

Where do these gains come from?

  • Lower risk exposure across most metrics
  • Significantly improved factor risk exposure and risk distribution

Case Study 2

Exposure to China vs. downside risk

Overview

©2019 Economic Data Sciences

Goal: Modify a 60-40 equity-fixed income portfolio to adjust risk

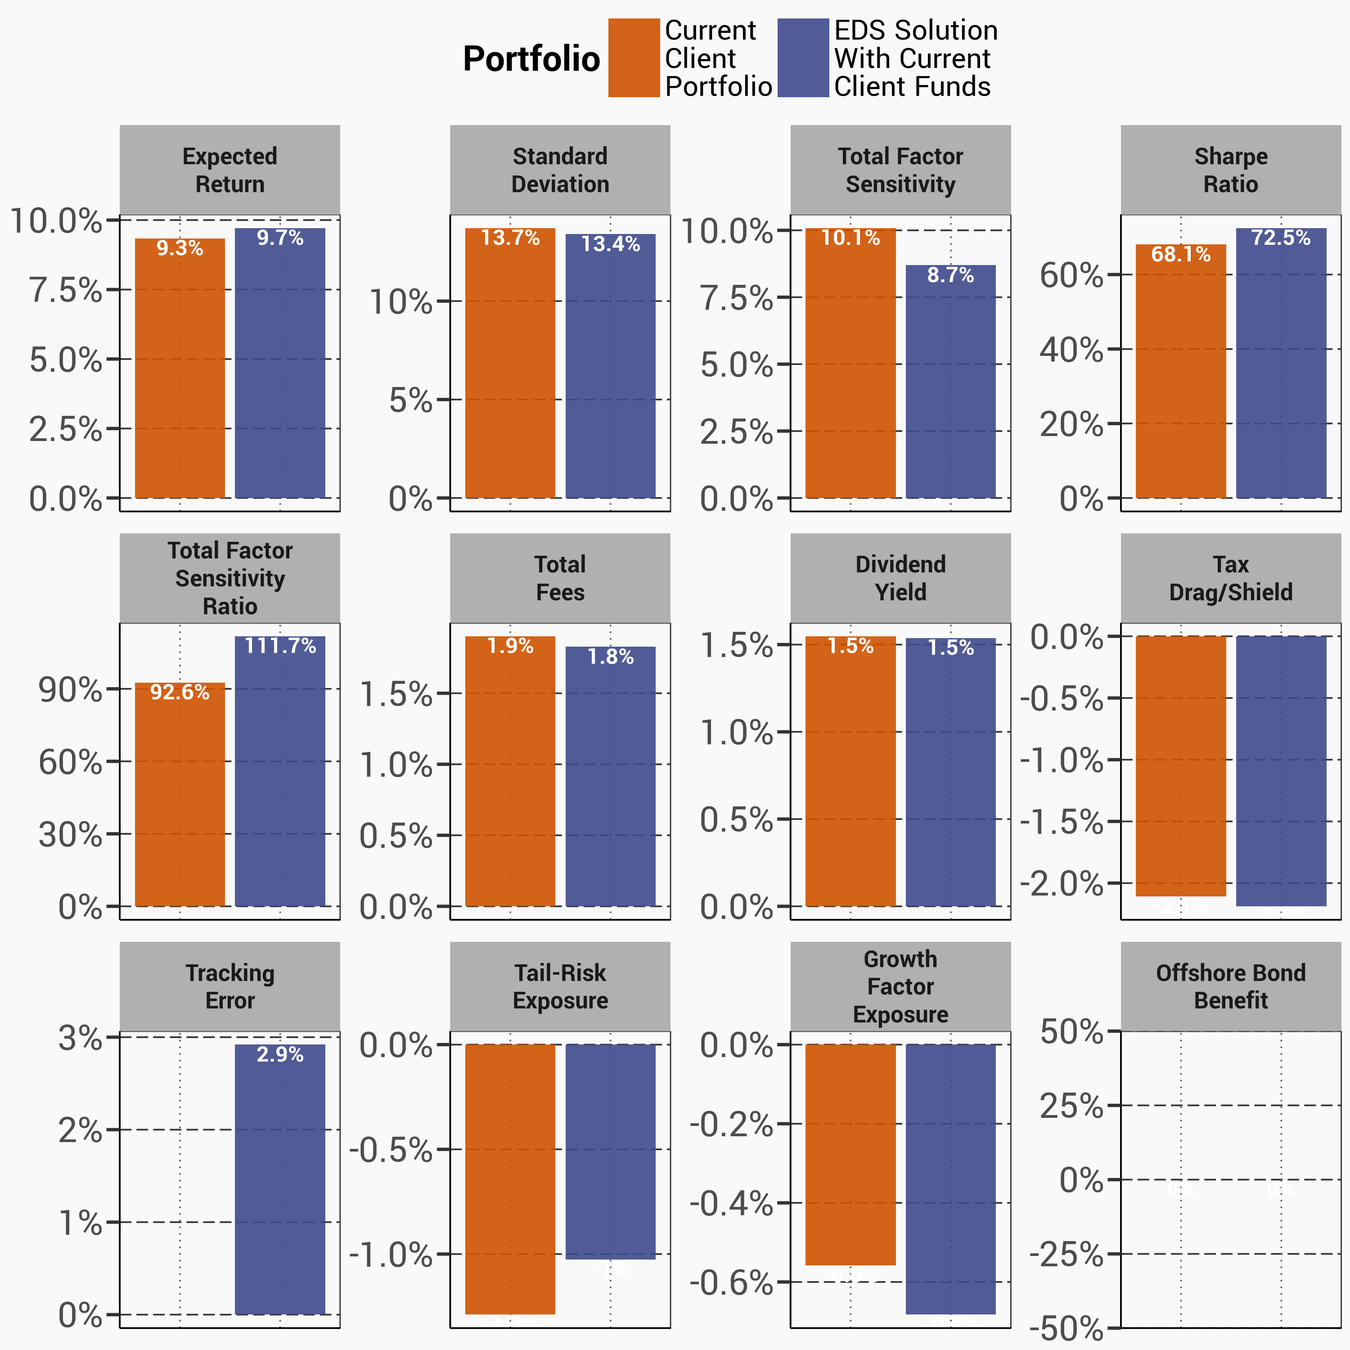
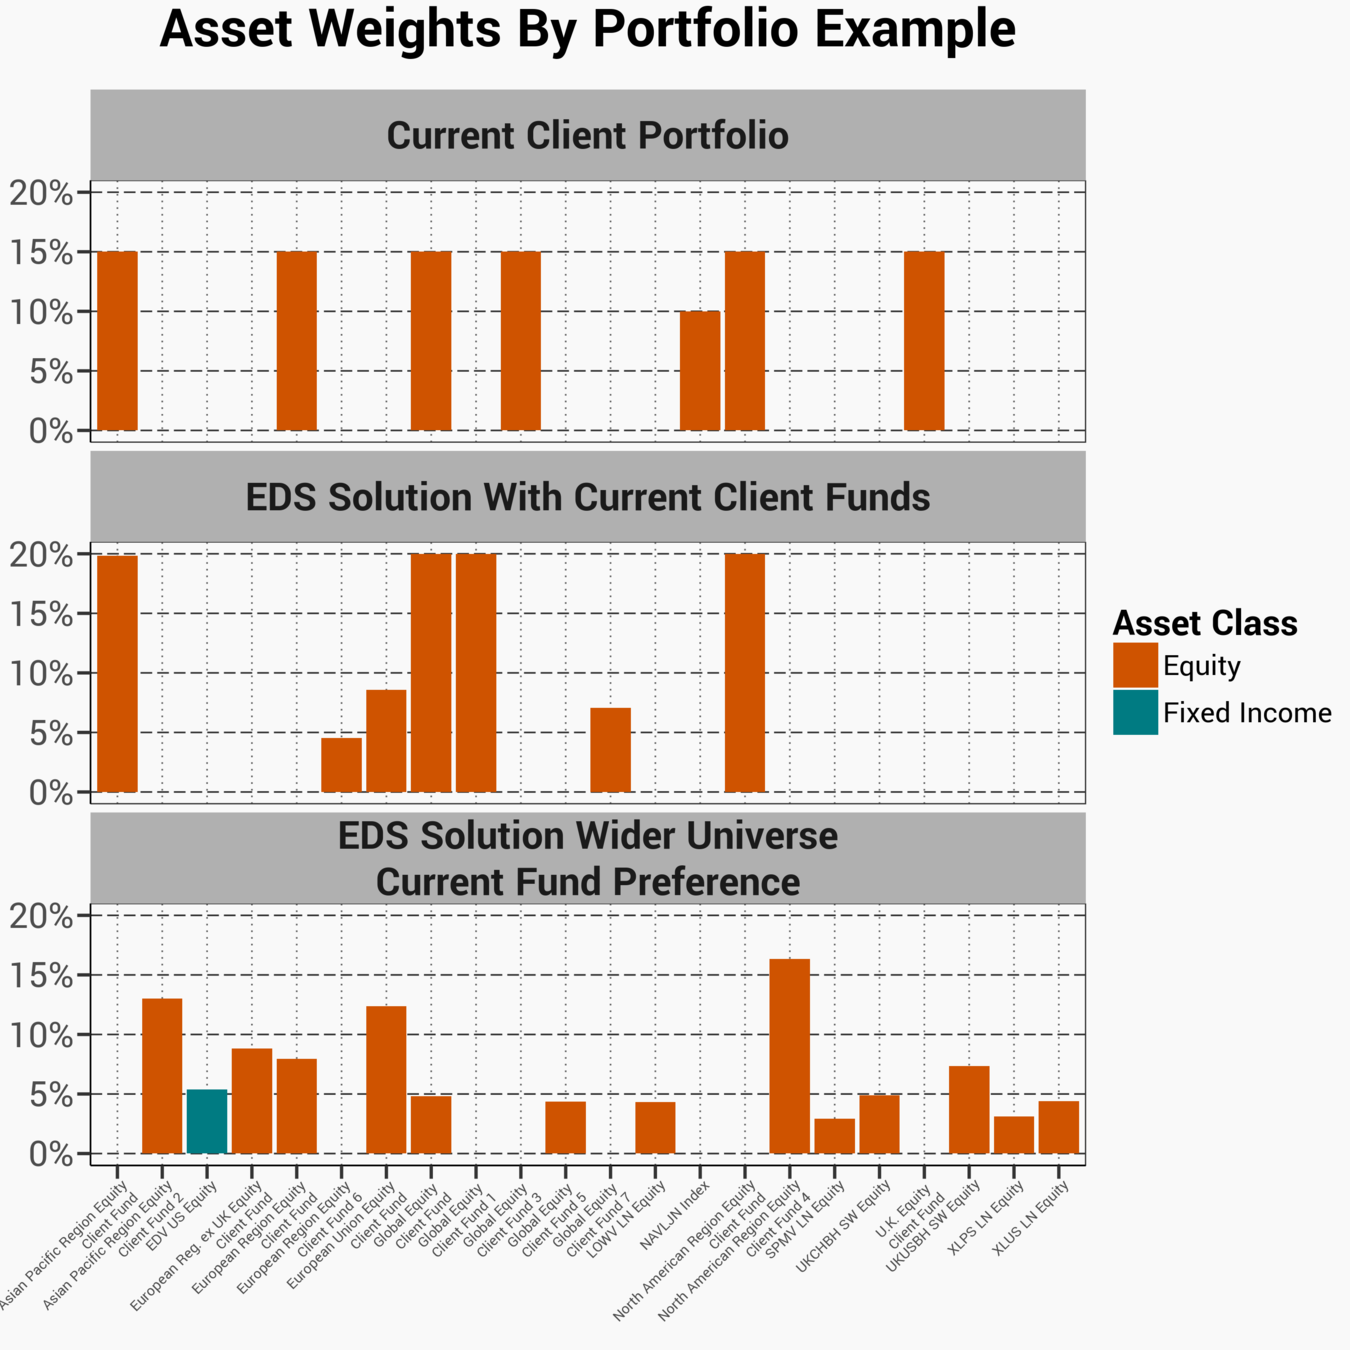
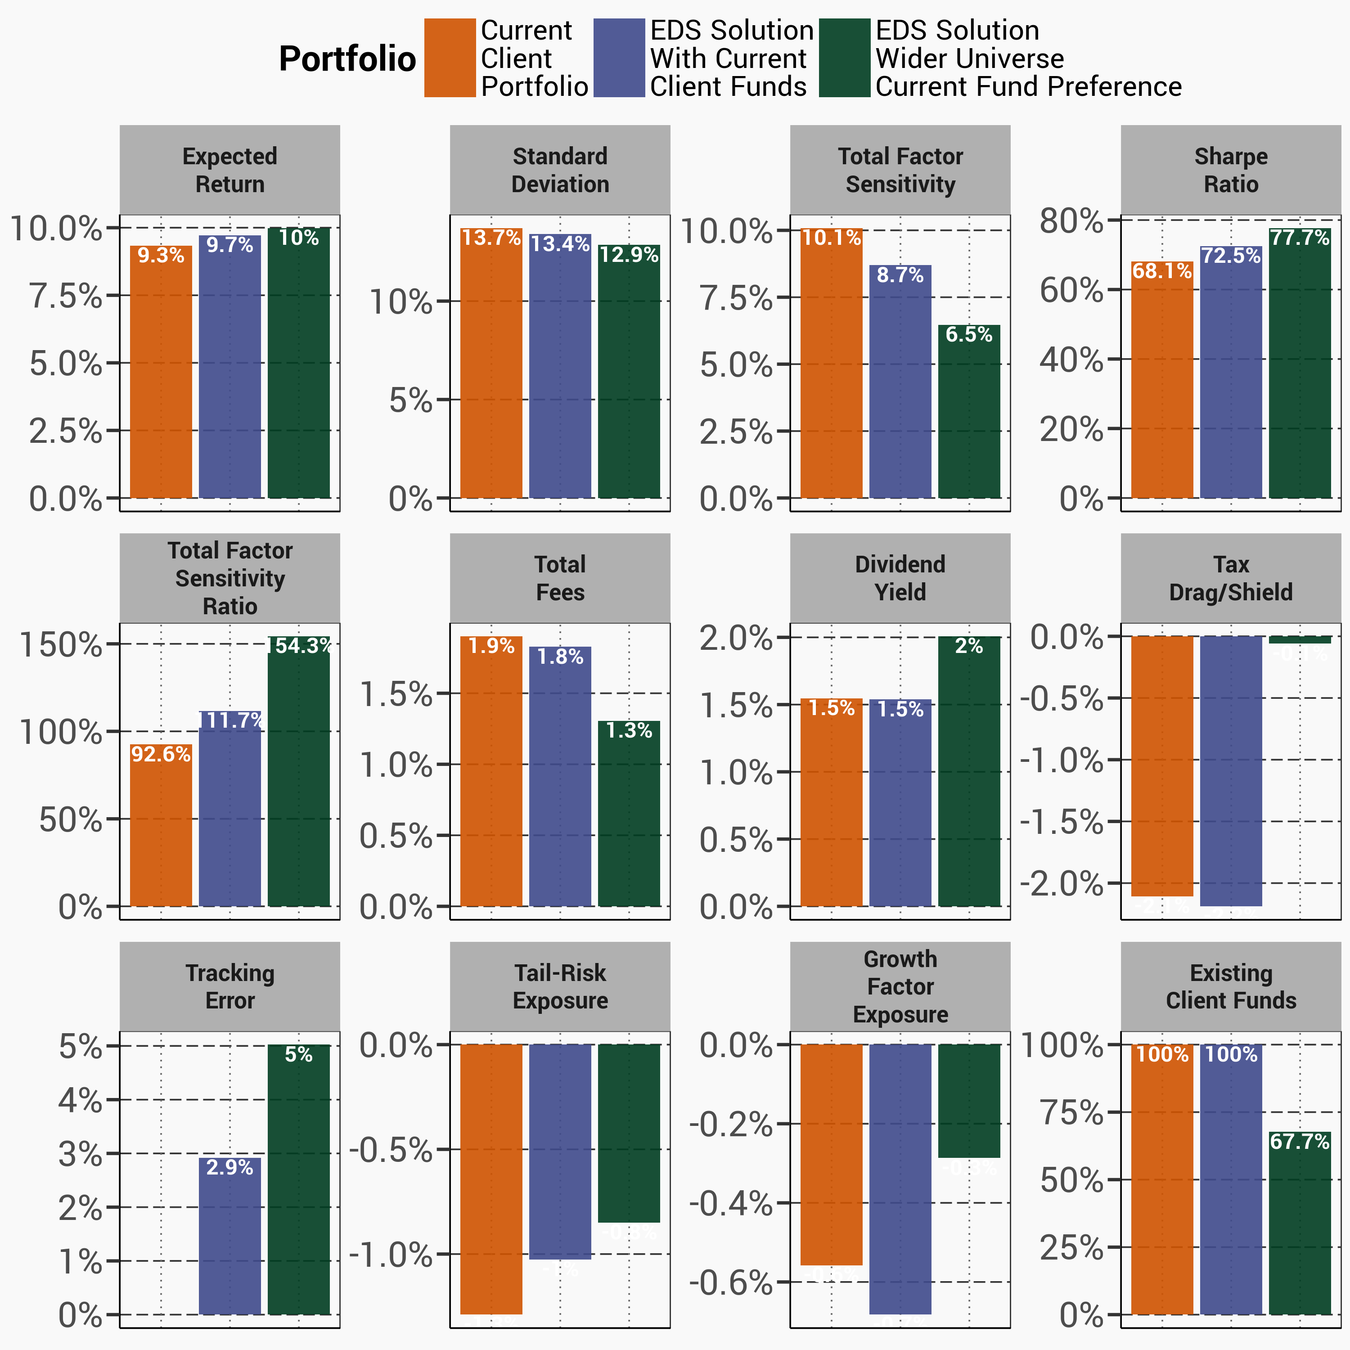
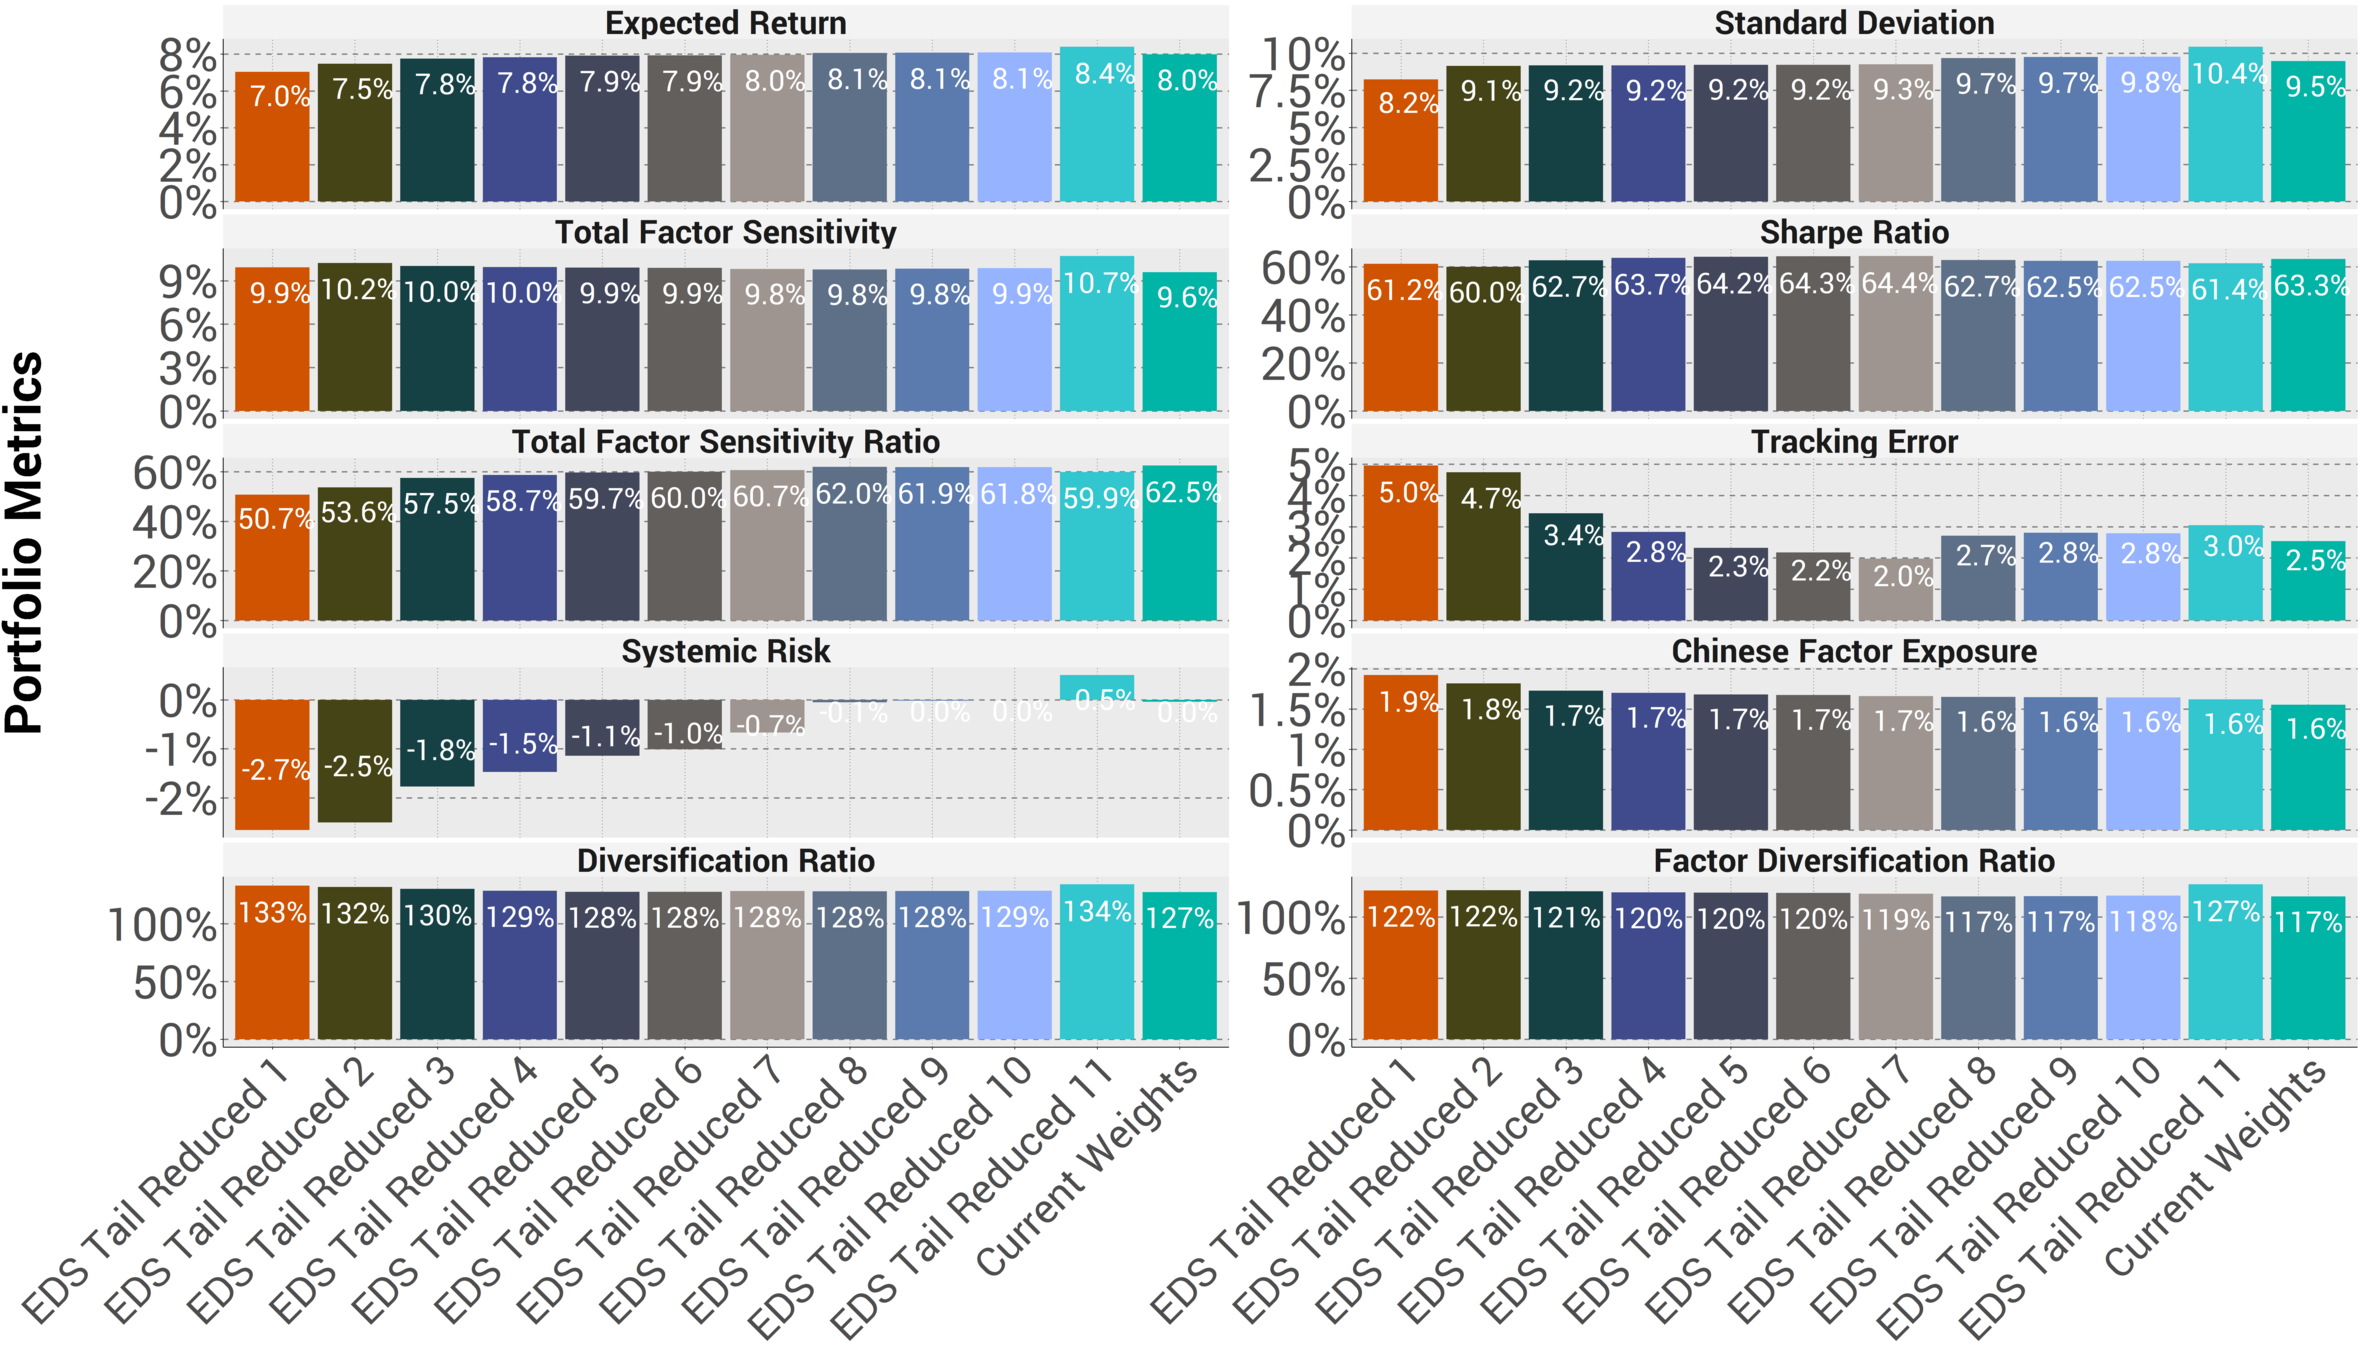
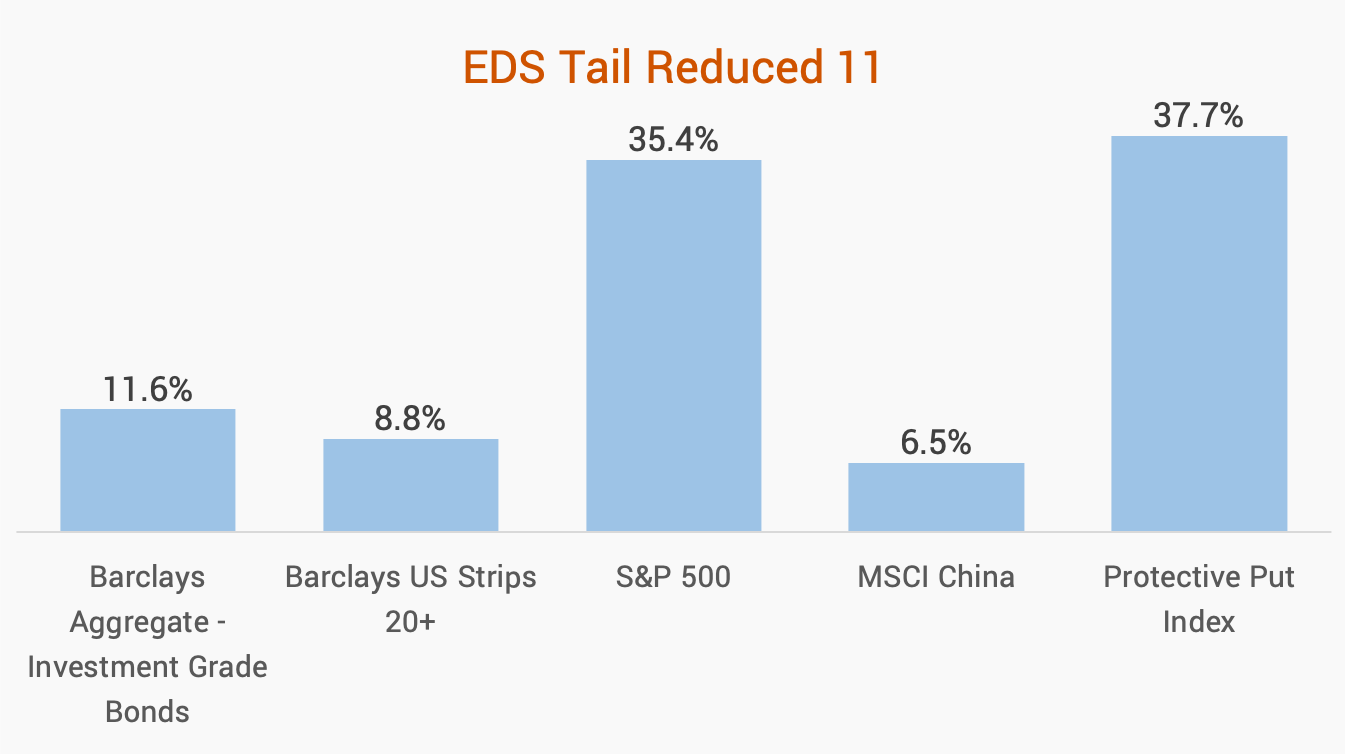
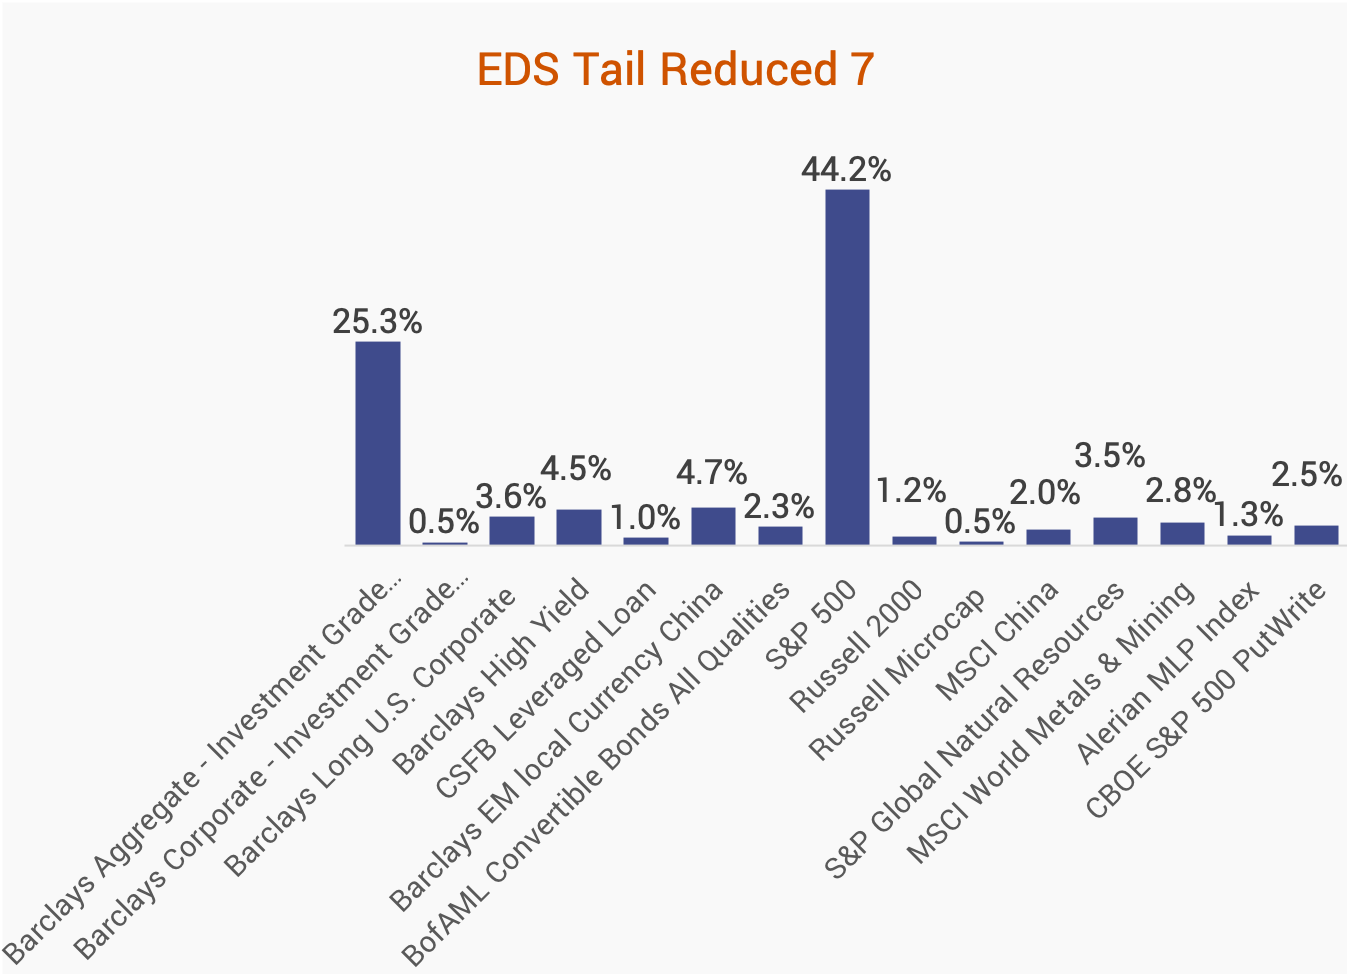
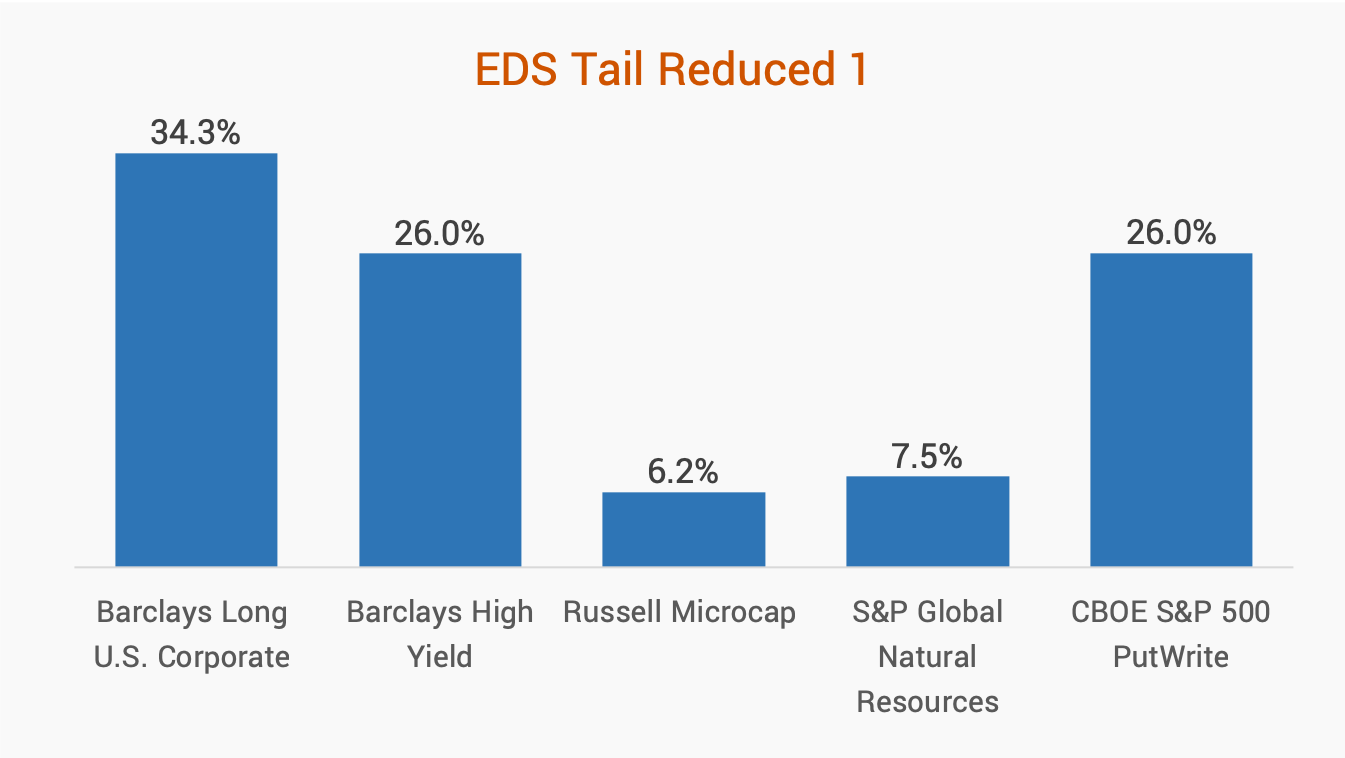
We show how the software iterates through portfolios and provides different options, depending on Client preferences

The Client had several simultaneous goals:

  1. Increase exposure to China
  2. Maintain all other factors relatively stable
  3. We assume Chinese benchmark has 0 tail risk

Results - Key Takeaways

©2019 Economic Data Sciences

  1. The analysis can be done in reverse as well:
    • We tested by how much tail risk would rise
    • With a less "generic" initial portfolio, we could do the opposite
  2. If desired, EDS software can increase hedge to China
  3. Exposure to China and tail risk are clearly related
  4. Each solution represents the best trade offs given these parameters
  5. Results were analyzed using monthly data going back to 2005

Results

©2019 Economic Data Sciences

Increasing exposure to China increase tail risk by 2.7%

List of Funds for 3 Select Portfolios

©2019 Economic Data Sciences

Portfolio 11 had the highest expected return and standard deviation

Number of funds or desired minimum/maximum fund weight can be modified

List of Funds for 3 Select Portfolios

©2019 Economic Data Sciences

Portfolio 7 had the highest expected Sharpe Ratio

List of Funds for 3 Select Portfolios

©2019 Economic Data Sciences

Portfolio 1 had the highest exposure to China

Recommendations

©2019 Economic Data Sciences

  1. Each portfolio represents optimal solution in its own right
  2. The "best" portfolio depends entirely on client preferences
  3. EDS believes that maximizing Sharpe Ratio is preferable, so would recommend portfolio #7

EDS advice based on the data:

Additional Examples

©2019 Economic Data Sciences

Click to learn more

Disclaimers

©2019 Economic Data Sciences

Please remember that past performance may not be indicative of future results. Different types of investments involve varying degrees of risk, and there can be no assurance that the future performance of any specific investment, investment strategy, or product made reference to directly or indirectly in this presentation, will be profitable, equal any corresponding indicated historical performance level(s), or be suitable for an individual's portfolio.

Our projections are based on current market conditions which can vary over the coming months and weeks. Additionally, our projections are based on historical market behavior which may vary unexpectedly. Using Machine Learning, our tool should adjust to new market fluctuations but we might not be able to avoid short term volatility.

info@EconomicDataSciences.com

EDS 2 Case Studies

By Economic Data Sciences

EDS 2 Case Studies

Quick Intro & 2 Case Studies

  • 803