Technology Update
Abdullah Fathi
(MAMPU)
Introduction to R

History
- R is a programming language
- An implementation over S language
- Designed by Ross Ihaka and Robert Gentleman at the University of Auckland in 1993
- Stable released on 31 October 2014 (7 years ago), by R Development Core Team Under GNU General Public License

Benefit of using R
- Open source
- Cross Platform compatible
- 12000+ extensions/packages
- Produce quality graph
- Large user community
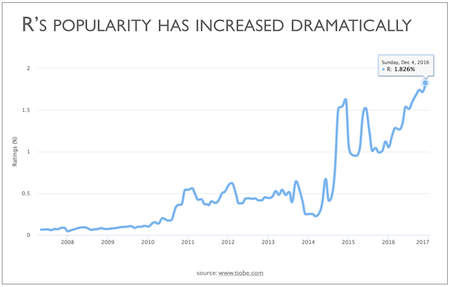
- One of the fastest growing programming language
- Connect with other languages
- Able to integrate with powerful BI and ETL tools
Top 10 Programming Language Ranking

What is R uses for?
- Statistical Inference
- Data Analysis
- Data Wrangling
- Visualization
- Machine Learning
R has the best mix of desirable attributes including high data science for business capability, low cost, growth, and has a massive ecosystem of powerful R libraries

R or Python?


These two titans can join forces through "reticulate" package which allows us to use Python and R together

Data Science Workflow Using R

R Stack
- R & R Packages
- RStudio
- Shiny
R Package
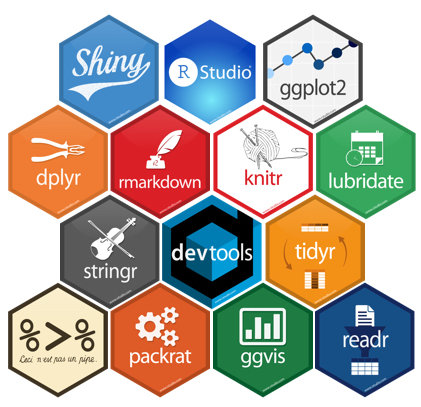
Packages to expand the feature of R

1. Import Data
- RDBMS (MySQL, MariaDB, MSSQL, Postgres, Oracle)
- Non-Relational DB (mongo, cassandra)
- File (csv, excel, txt, etc)
- HDFS (Hadoop)
- Web Scraping
- Many more...
2. Data Wrangling (Dplyr)


2. Data Wrangling (Dplyr)


2. Data Wrangling (Tidyr)

3. Data Exploration (DataExplorer)
Speed up data exploration process
create_report(df)
4. Data Visualization


4. Data Visualization

4. Data Visualization

4. Data Visualization

4. Data Visualization

4. Data Visualization

4. Data Visualization


4. Data Visualization

4. Data Visualization

4. Data Visualization (other)
-
Base R
-
d3r (d3.js)
-
rcharts
-
ggvis
-
rgl (3d plot)
-
patchwork (combine seperate ggplot into same graphic)
-
many more...
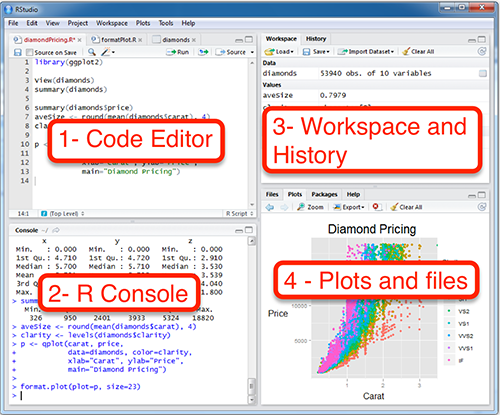
Integrated Development Environment
What is RStudio?
- Add-on to R
- User-friendly graphical interface
RStudio (IDE)

RStudio Edition
-
RStudio Desktop
- Premier IDE for R
-
RStudio Server
- RStudio anywhere using a web browser
-
RStudio Workbench
(Previously known as Rstudio Server Pro)- Enterprise edition
- Adds many enhancements to the open-source version of RStudio Server
RStudio Workbench Features
- Authentication (ActiveDirectory, LDAP, SAML, OpenID, or Google Accounts)
- High-Availability and Load Balancing
- Multiple versions of R
- Multiple R sessions per user
- Security features
- Support for Jupyter, JupyterLab, and VS Code editor sessions
- Project sharing for easy collaboration within workgroups
- Administrative dashboard that provides insight into active sessions, server health, and monitoring of system-wide and per-user performance and resource metrics
- Establish CPU priorities and memory limits for users or groups
Shiny Dashboard

Build an interactive web applications for visualizing data. Bring R data analysis to life.
Contains R functions for common HTML structures, UI Controls (Components/Widgets), and web framework tools. The framework is highly flexible, but require more knowledge of HTML & CSS
Schedule or Stream Data for Shiny Dashboard

RStudio Connect (Enterprise)
A push-button publishing from the RStudio to deploy Shiny applications, R Markdown reports, dashboards, plots, APIs, and more in one convenient place
RStudio Connect's Feature


Manage and Control Access
Easily Control Schedule and Stream Data
Shiny Themes & Dashboard
Argon Dash

Argon Dash (cont..)

Argon Dash (cont..)

Shiny.Semantic

bs4dash

bs4dash (mobile view)

ShinyMobile (Android, ios or Desktop)


Other Demo
THANK YOU
DRSA-Technology Update
By Abdullah Fathi
DRSA-Technology Update
Technology Update for DRSA. Focusing on R, Rstudio and Shiny


