R Programming Language
Abdullah Fathi
Introduction to R

History
- R is a programming language
- An implementation over S language
- Designed by Ross Ihaka and Robert Gentleman at the University of Auckland in 1993
- Stable released on 31 October 2014 (3 years ago), by R Development Core Team Under GNU General Public License

What is R?
- Open source
- Cross Platform compatible
- Numerical and graphical analysis
- Large user community
- 9000+ extensions
Why Learn R?
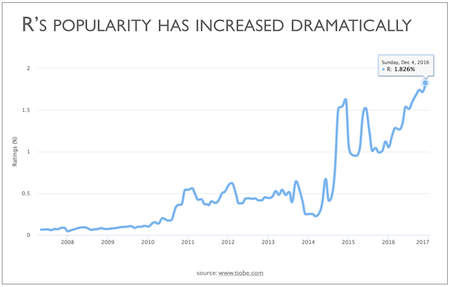
- One of the fastest growing programming language
-
R is widely used (statisticians, scientists, social scientists) and has the widest statistical functionality of any software
-
As a scripting language, R is very powerful, flexible, and easy to use
- Quality Graph
Programming Language Ranking

R Stack
- RStudio
- R Package
- Shiny

Integrated Development Environment
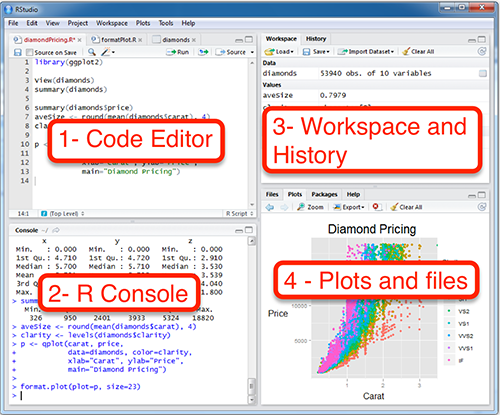
RStudio (IDE)

R Package
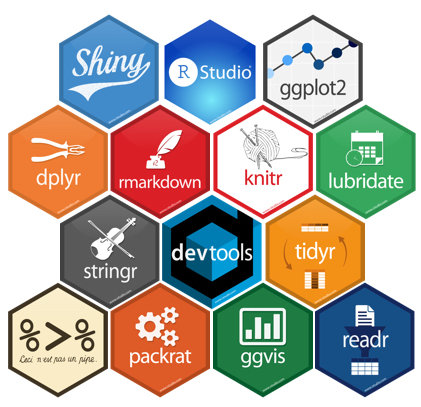
Packages to expand the feature of R
1. Load Data
- RDBMS (MySQL, Postgres, Oracle)
- Non-Relational DB (mongo, cassandra)
- File (csv, excel, txt, etc)
- HDFS (Hadoop)
2. Data Wrangling (Dplyr)


2. Data Wrangling (Dplyr)


2. Data Wrangling (Tidyr)

3. Data Visualization


3. Data Visualization

3. Data Visualization

3. Data Visualization

3. Data Visualization

3. Data Visualization

3. Data Visualization


3. Data Visualization (other)
-
Base R
-
d3r (d3.js)
-
rcharts
-
ggvis
4. Predictive Modelling
-
Regression
-
Decision Trees
-
Random Forest
-
Arima (Time series)
-
Times Series Forecast (Arima)
-
Statistical Test (t-test, chi-squared-test, correlation)
-
Text Mining/Sentiment Analysis (tidytext, syuzhet, tm)
-
Web Scraping (rvest)
-
Many more...
5. Other great features
Shiny Dashboard

Build an interactive web applications for visualizing data. Bring R data analysis to life.
R as a calculator
2 + 2 # add numbers
2 * pi # multiply by a constant
7 + runif(1) # add a random number
3^4 # powers
sqrt(4^4) # functions
log(10)
log(100, base = 10)
23 %/% 2
23 %% 2

# scientific notation
5000000000 * 1000
5e9 * 1e3
Assigning values to R objects
val <- 3
val
print(val)

Val <- 7 # case-sensitive!
print(c(val, Val))
A key action in R is to store values in the form of R objects, and to examine the value of R objects.
R Programming Language (Intro)
By Abdullah Fathi
R Programming Language (Intro)
R Introduction


