Data visualization with Tableau?
Tableau is...
a visual analytics platform transforming the way we use data to solve problems—empowering people and organizations to make the most of their data.
Creation
The company's founders, Christian Chabot, Pat Hanrahan and Chris Stolte, were researchers at the Department of Computer Science at Stanford University. They specialized in visualization techniques for exploring and analyzing relational databases and data cubes and started the company as a commercial outlet for research at Stanford from 1999 to 2002.

Chris Stolte
Christian Chabot
Pat Hanrahan
Gartner square
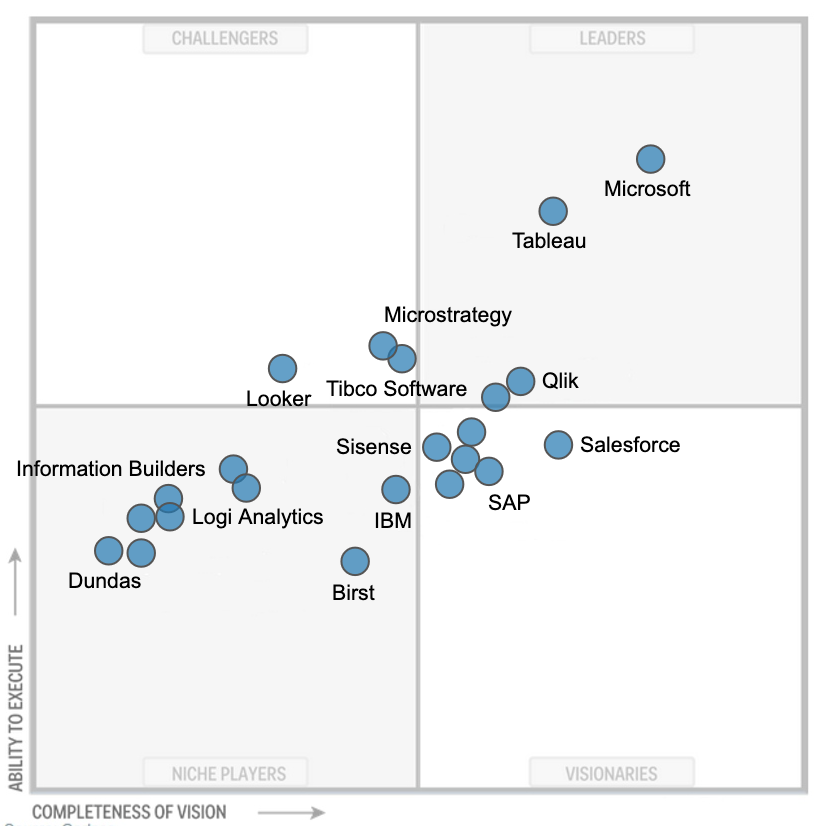
Gartner Magic Quadrant research methodology provides a graphical competitive positioning of four types of technology providers in fast-growing markets: Leaders, Visionaries, Niche Players and Challengers.
Tableau is a leader in the BI market alongside Microsoft.
Let's start
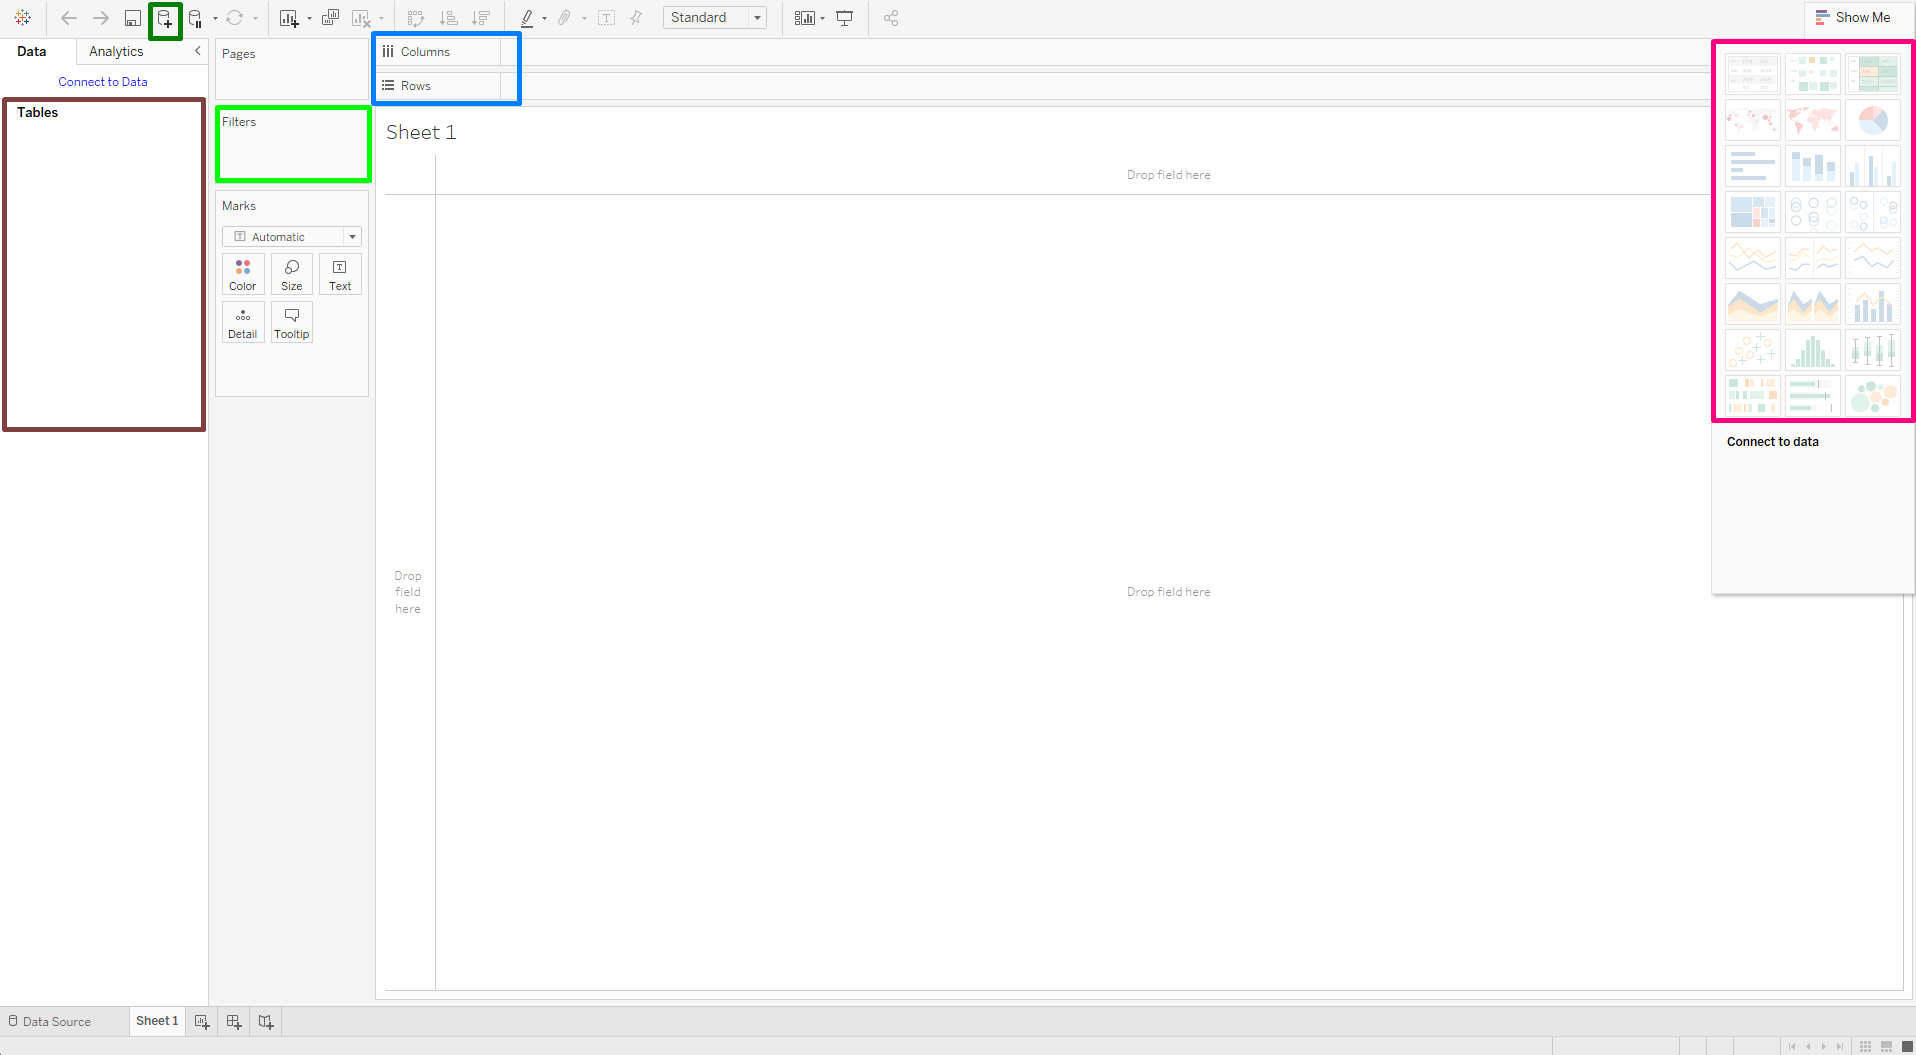
Components
A worksheet contains a single view along with shelves, cards, legends, and the Data and Analytics panes in its side bar.
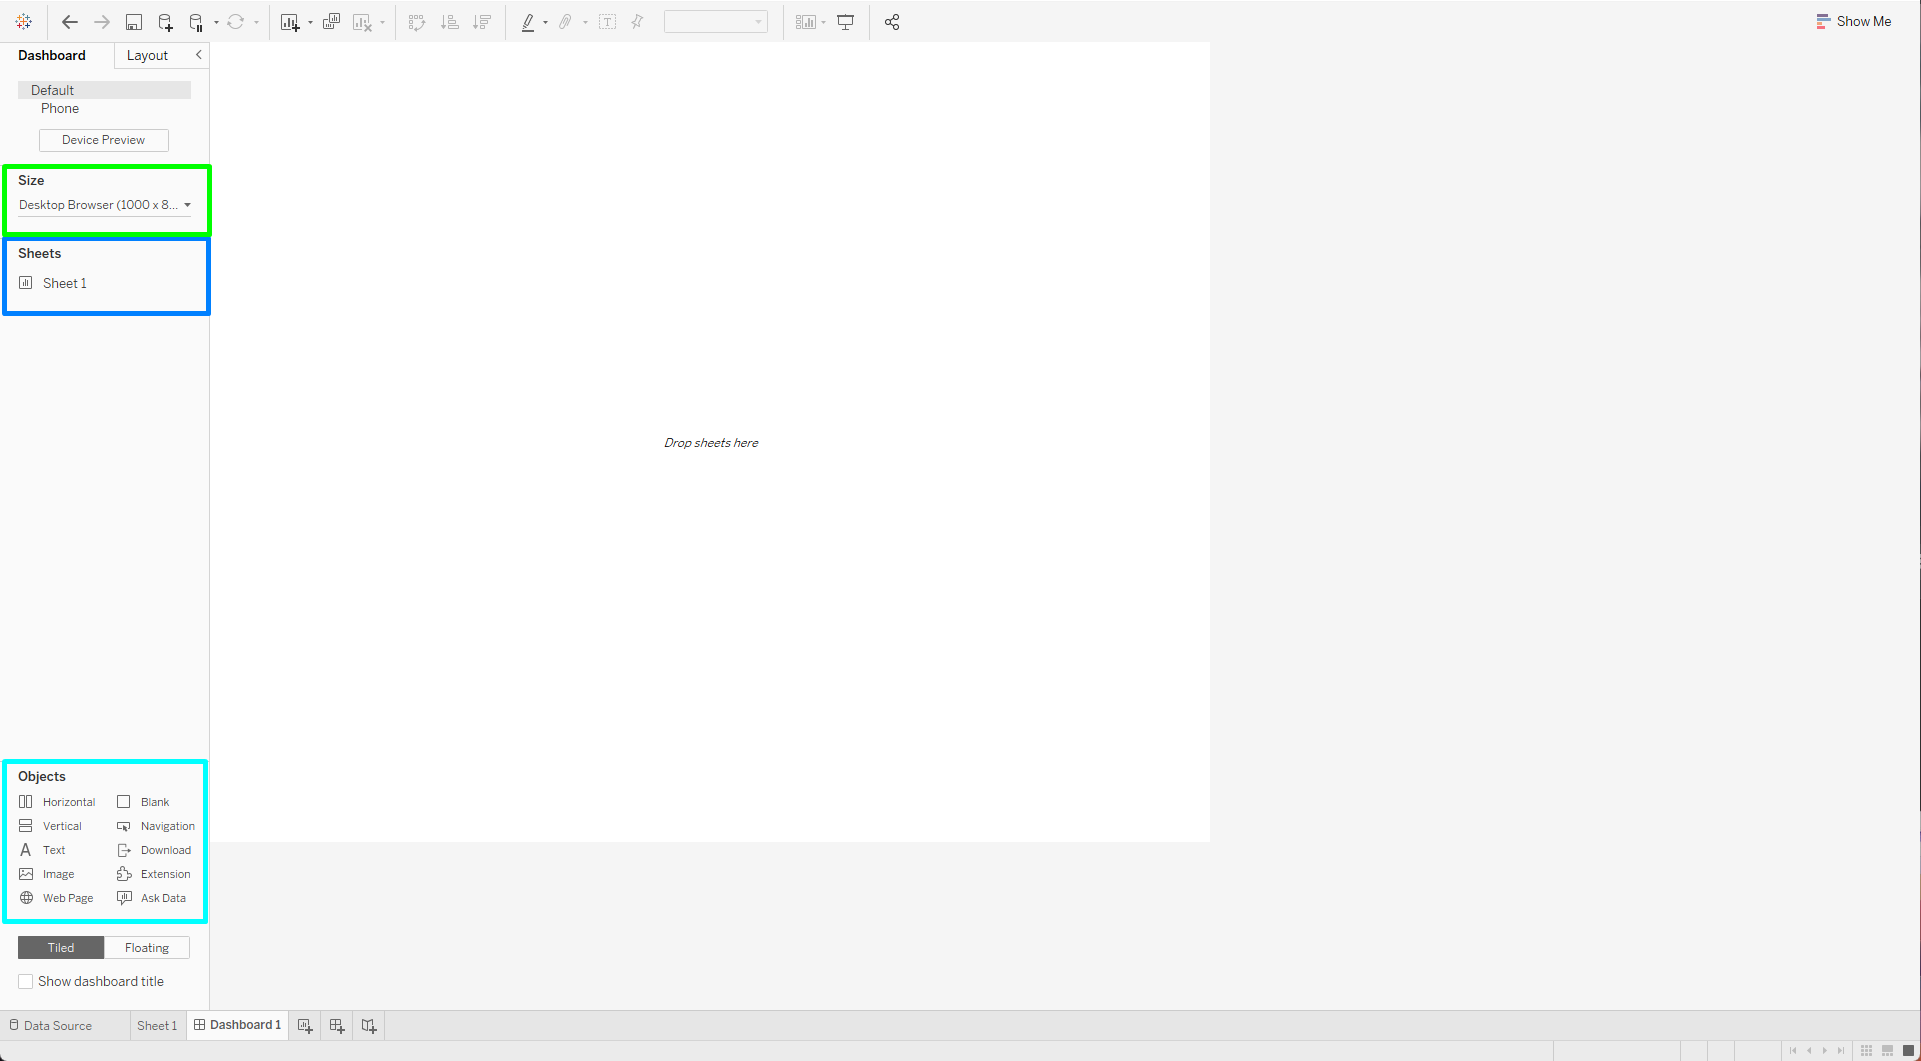
A dashboard is a collection of views from multiple worksheets. The Dashboard and Layout panes are available in its side bar.
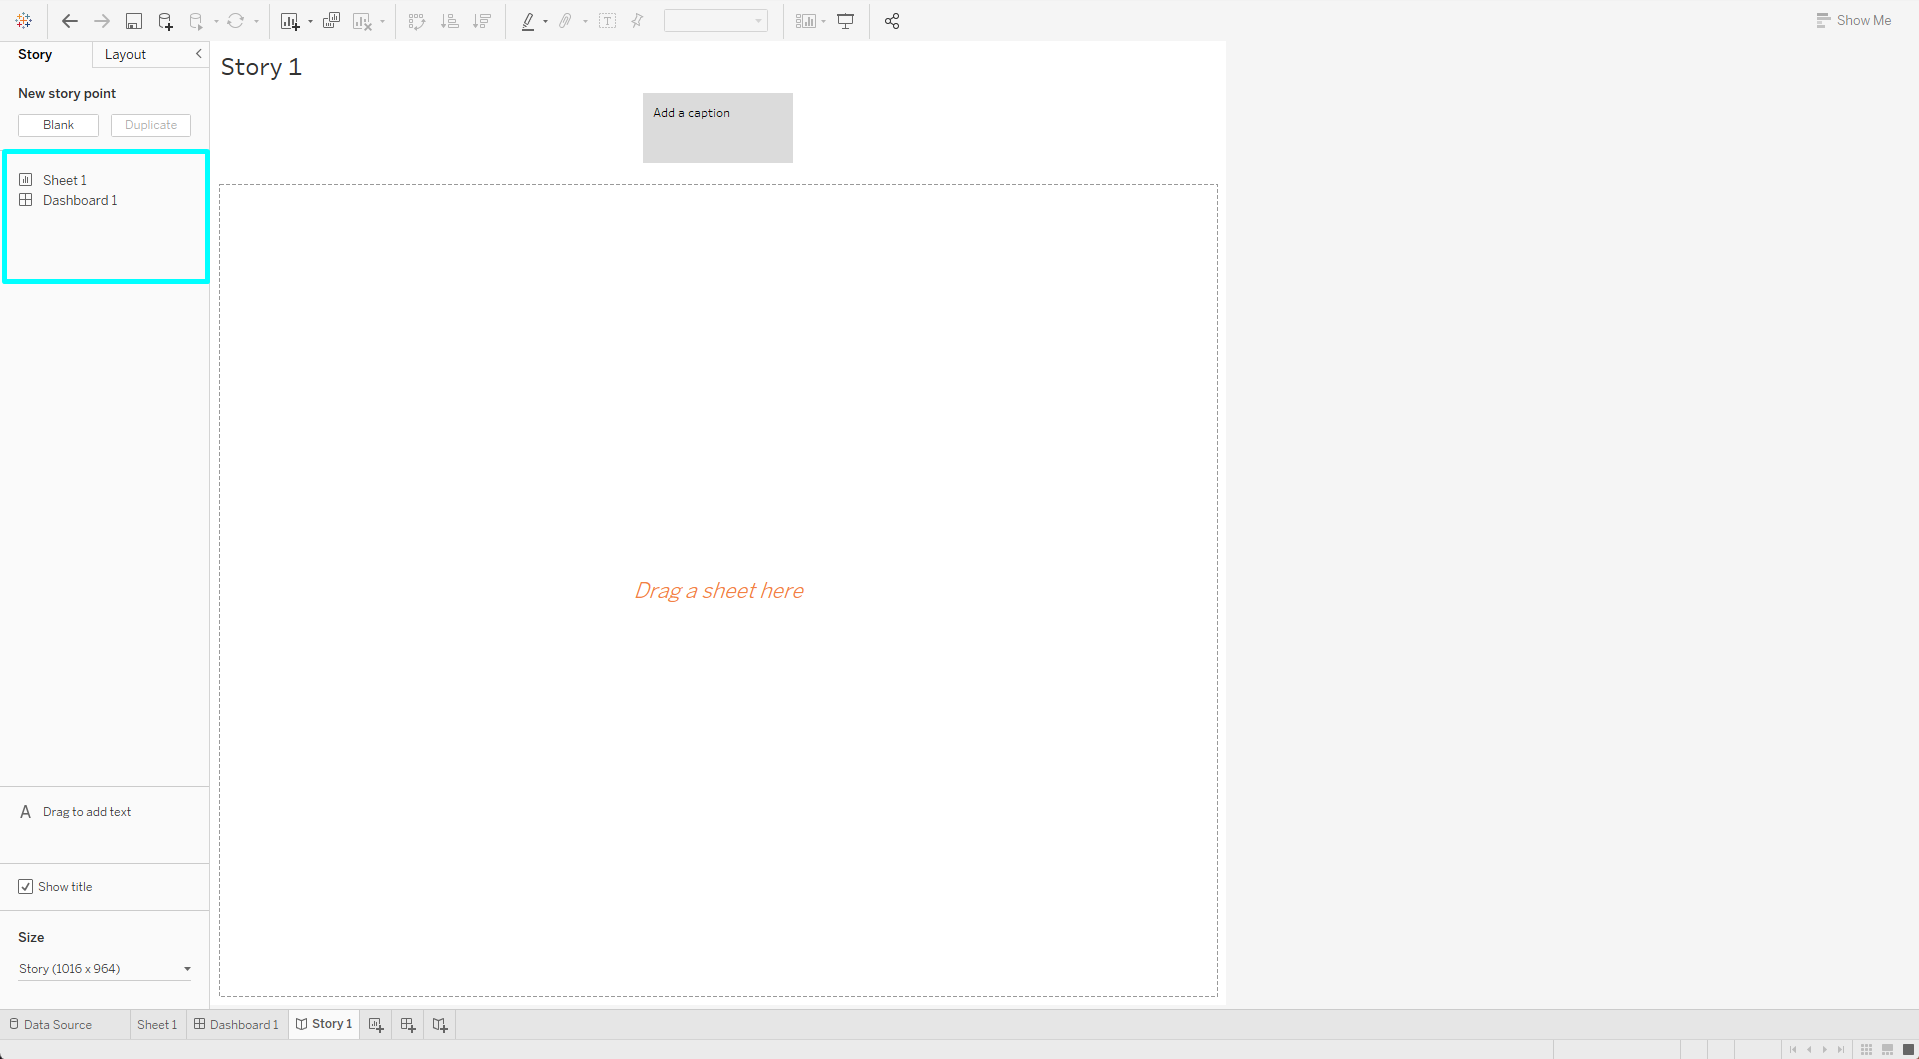
A story contains a sequence of worksheets or dashboards that work together to convey information. The Story and Layout panes are available in its side bar.
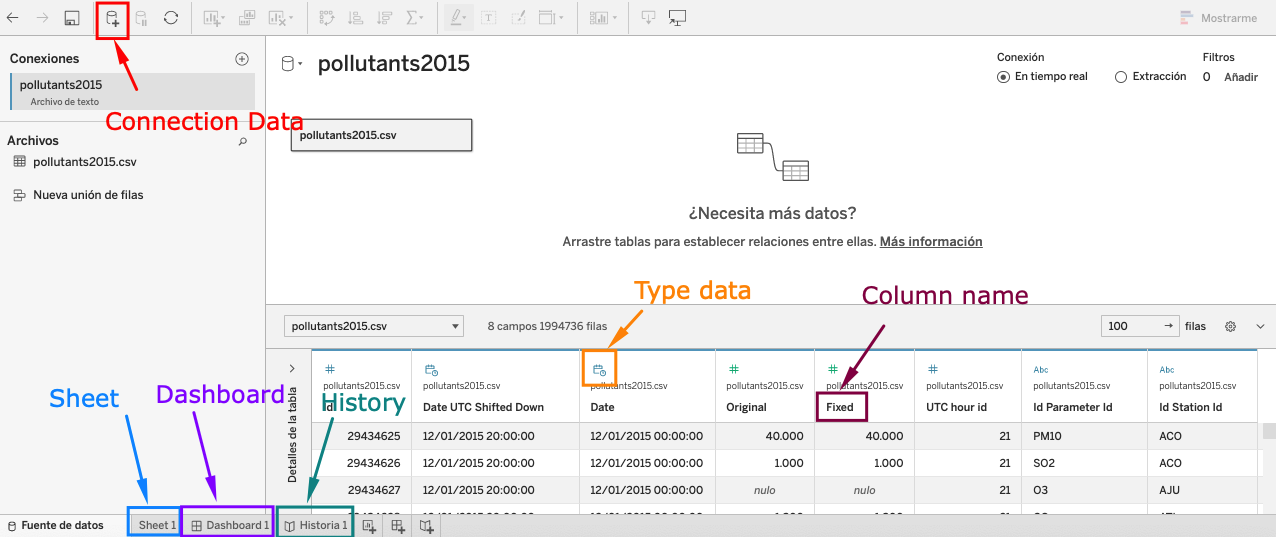
Type data
- Int
- Date and time
- Boolean
- Float
- String
- Geographic
Knowing the data
Data
- The data comes from the direction of atmospheric monitoring of Mexico City.
- The database has 40 stations, 10 pollution parameters, 5 meteorological parameters.
- A station is a physical place where contamination measurements are taken.
- There are more than 100 million records.
Pollutants
- CO, Carbon Monoxide
- SO2, Sulfur Dioxide
- NO, Nitrogen Oxides
- NO2, Nitrogen Dioxide
- O3, Ozone
- PM2.5, Particles of less than 2.5 Microns
- PM10, Particles of less than 10 Microns
Meteorology
- RH, Relative humidity
- WSP, Wind Speed
- WDR, Wind Direction
- TMP, Temperature
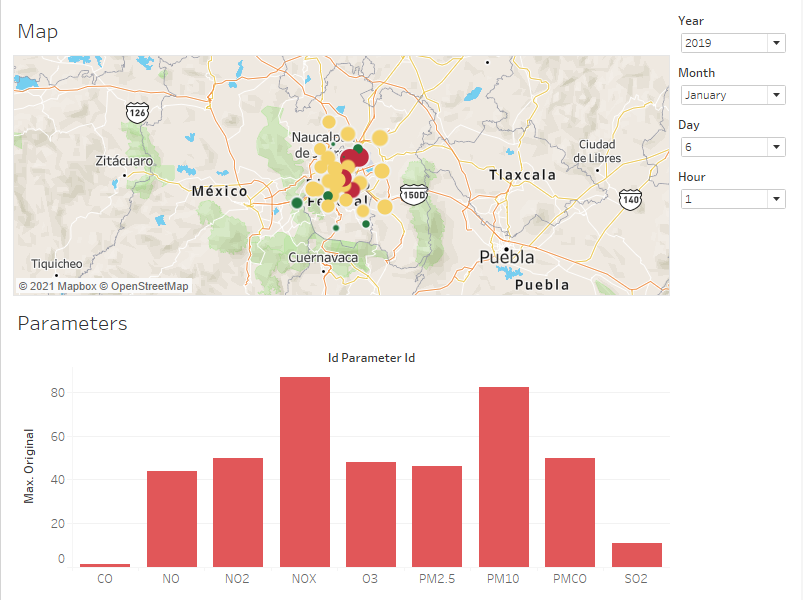
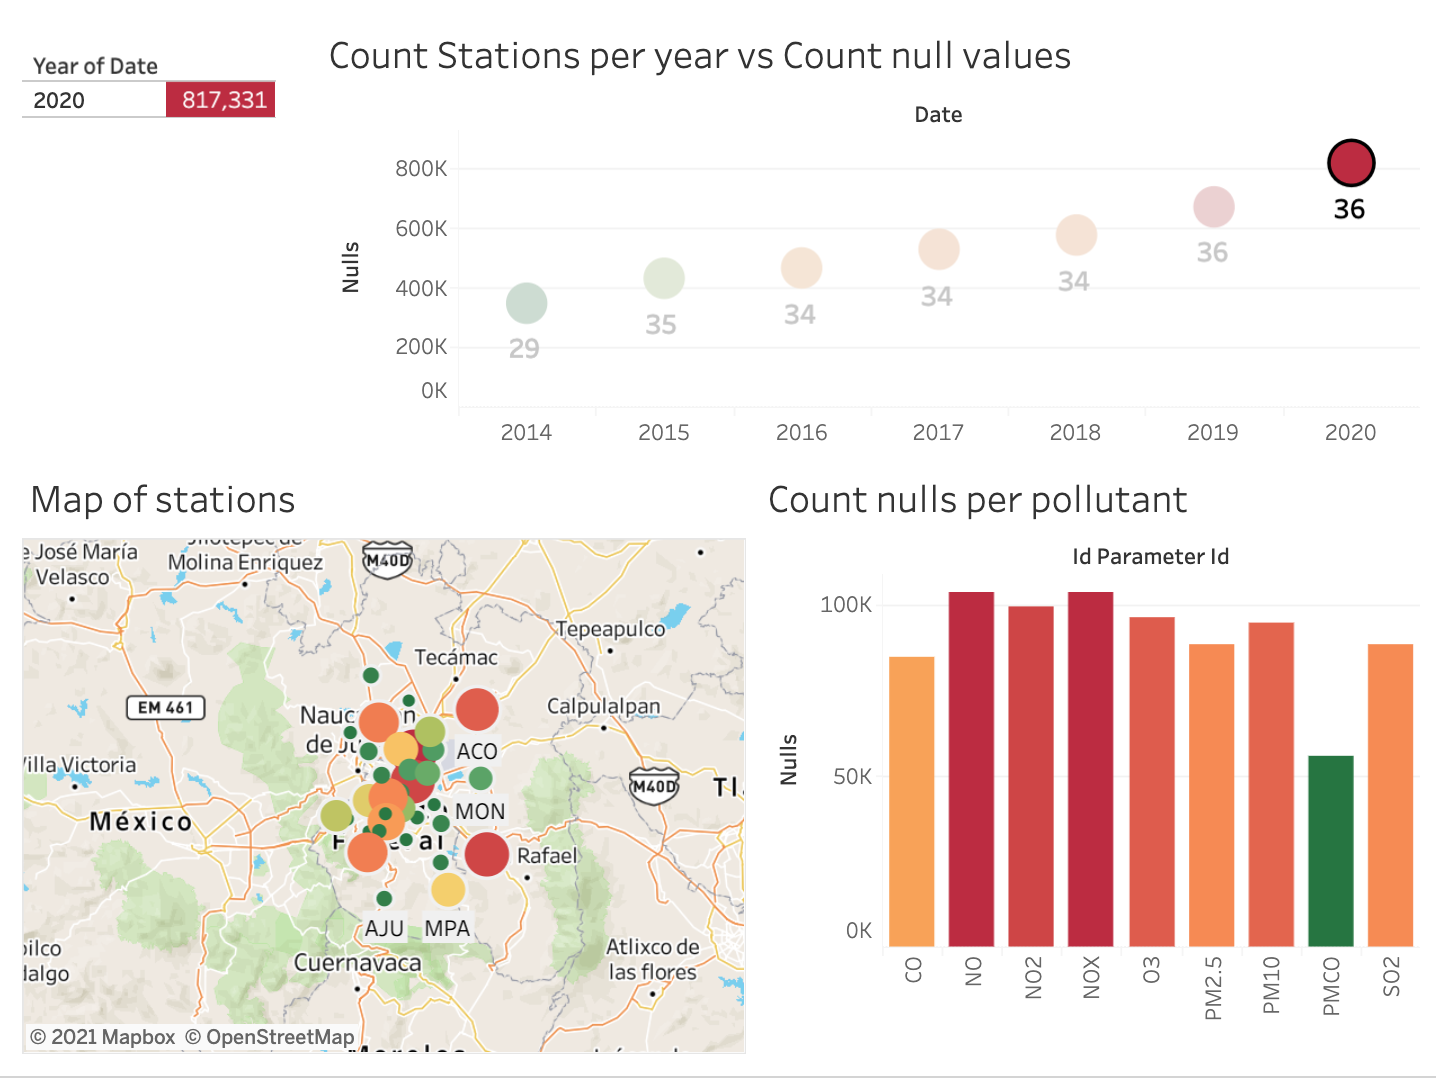
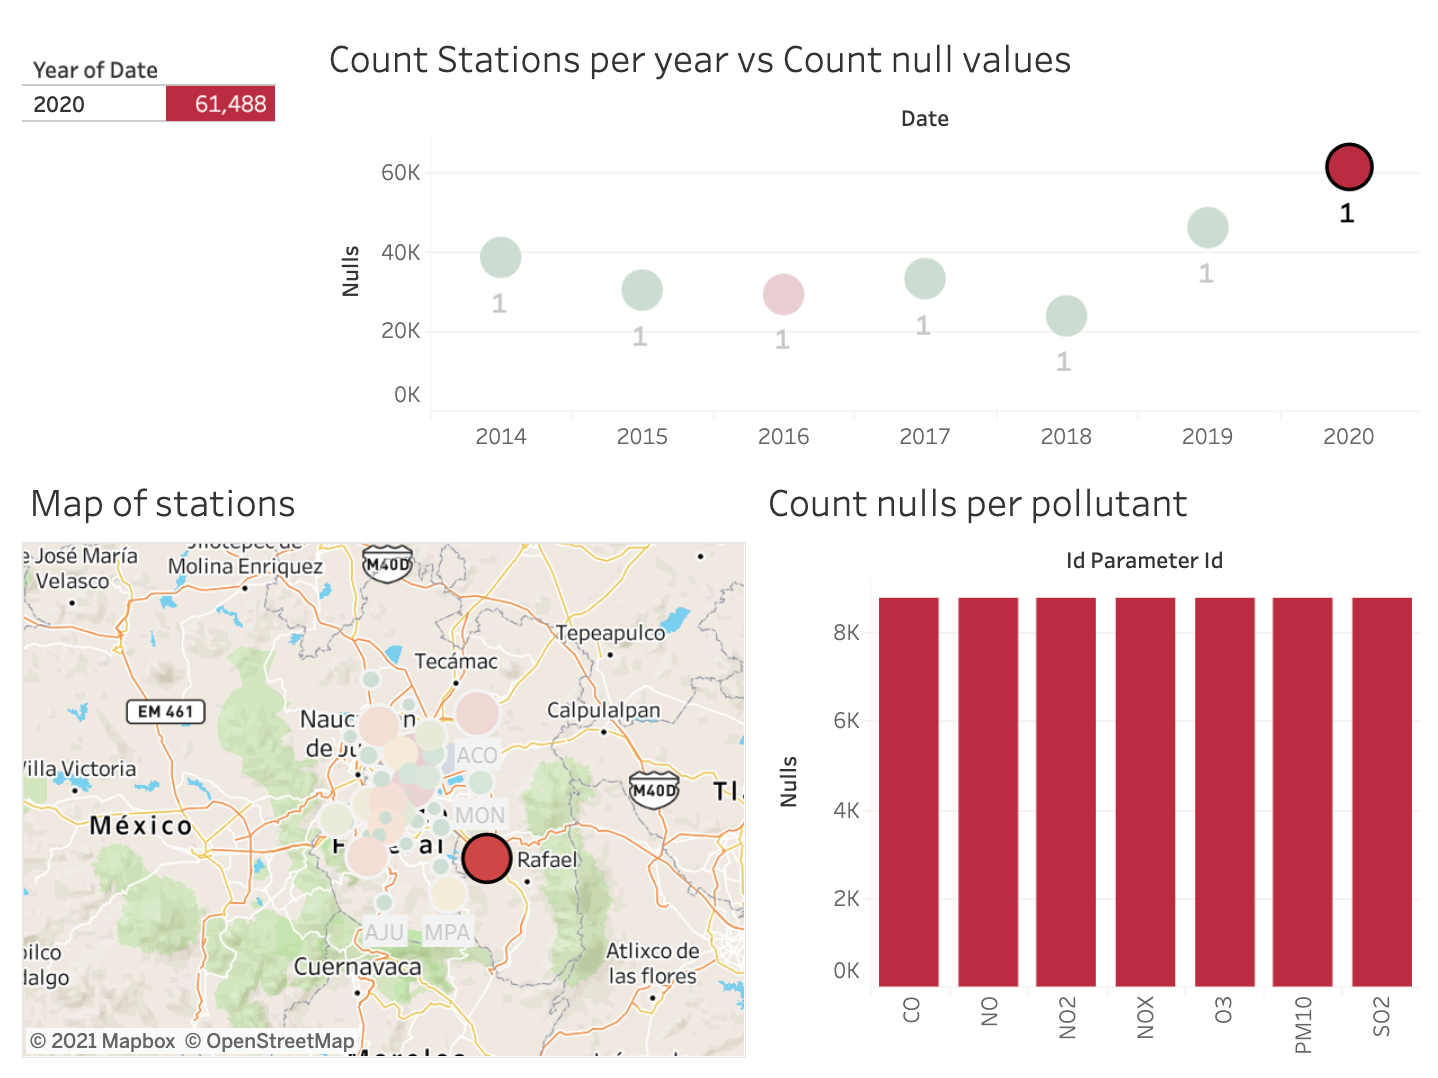
Creating our first dashboard
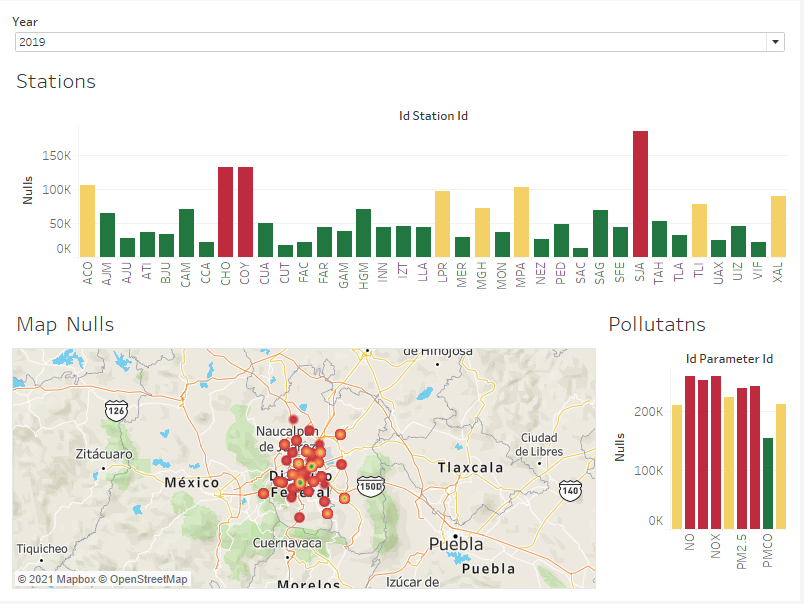
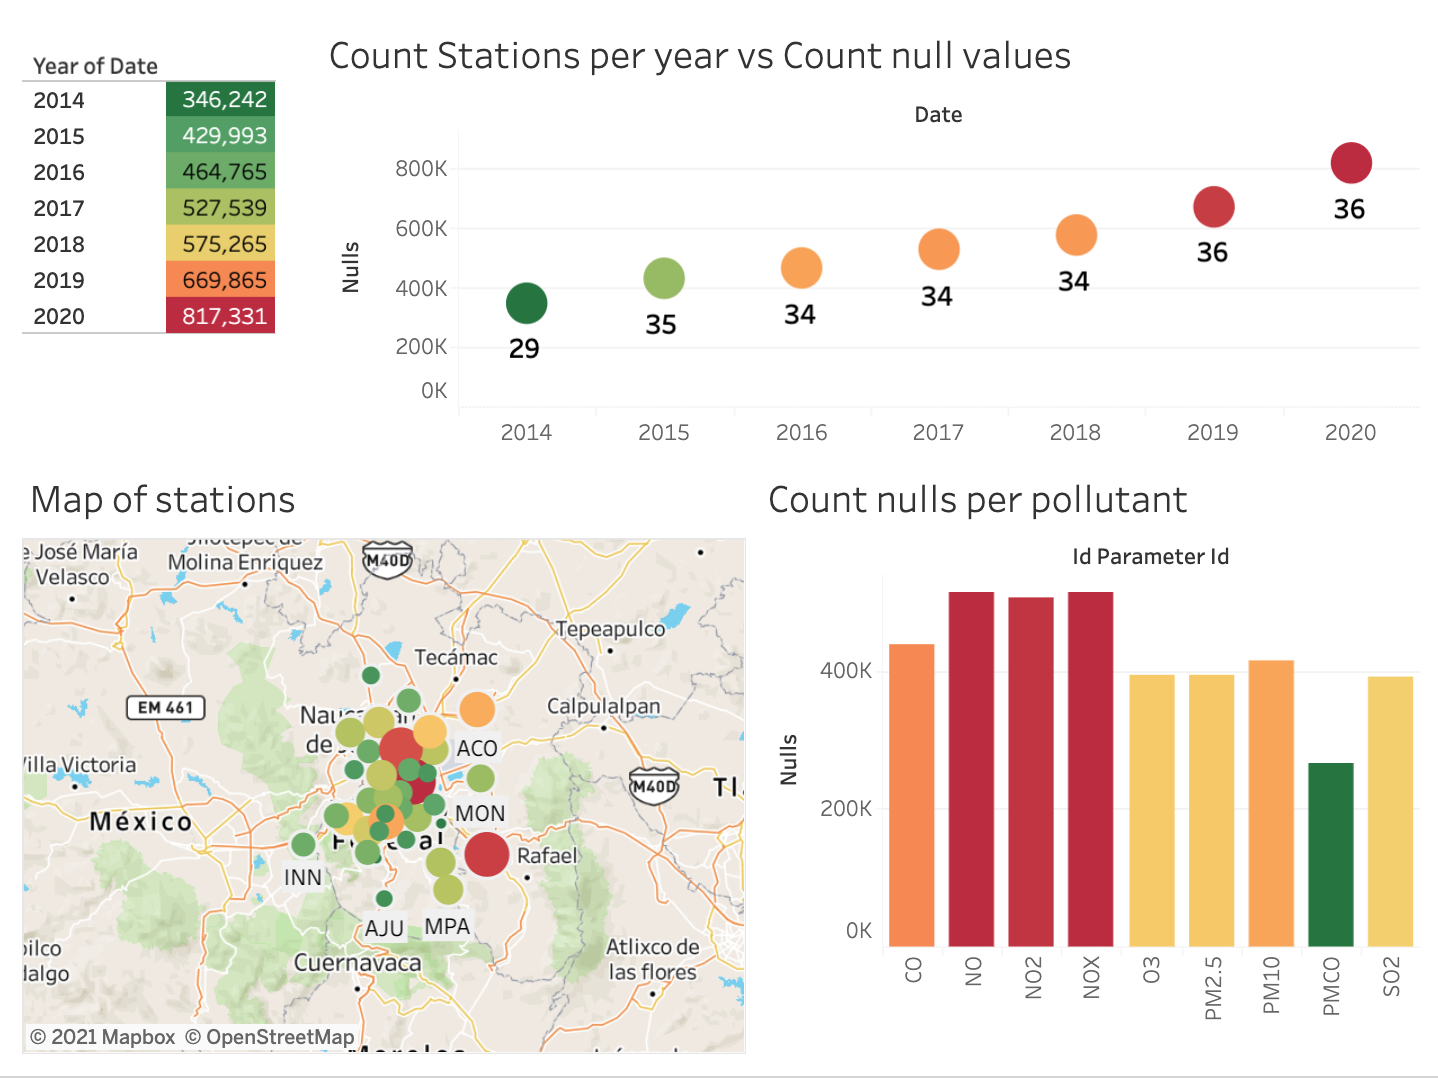
Null Count
What's Tableau?
By Fernando Moreno Gomez


