Finding a memory leak in Node.js
Gergely Nemeth, RisingStack
@nthgergo
RisingStack
is now a member of the
Node.js Foundation


Then....
TL;DR
there was no leak
About Memory
int * array = malloc(10 * sizeof(int));

if (NULL == array) {
  fprintf(stderr, "malloc failed\n");
  return(-1);
}

free(array);
Meet the Garbage Collector

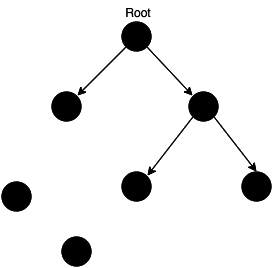
Before collection
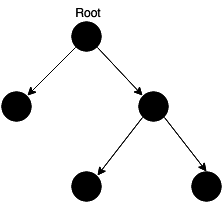
After collection
memory allocation is cheap
collection is expensive
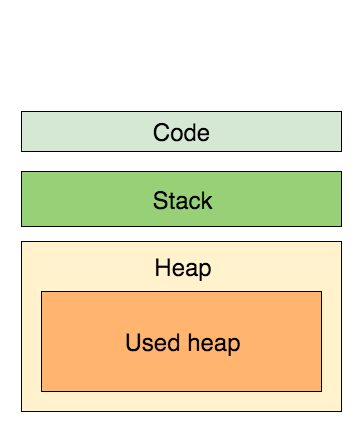
Definitions
resident set size
is the portion of memory occupied by a process that is held in the RAM, this contains the code itself, the stack and the heap
the stack
contains primitive types and references to objects
the heap
stores reference types, like objects, strings or closures
shallow size of an object
the size of memory that is held by the object itself
retained size of an object
the size of the memory that is freed up once the object is deleted along with its' dependent objects
GC in Node.js (v8)
new space
old space
and
New space
- new objects gets allocated here
- small in size (8mb tops)
- objects living here are called Young Generation
- collected using Scavenge collection
Old space
- objects that survived the Young Generation are moved here
- objects living here are called Old Generation
- collected using Mark-Sweep collection
- collection in the Old Space will only commence once it is getting exhausted (default size: 1.4Gb)
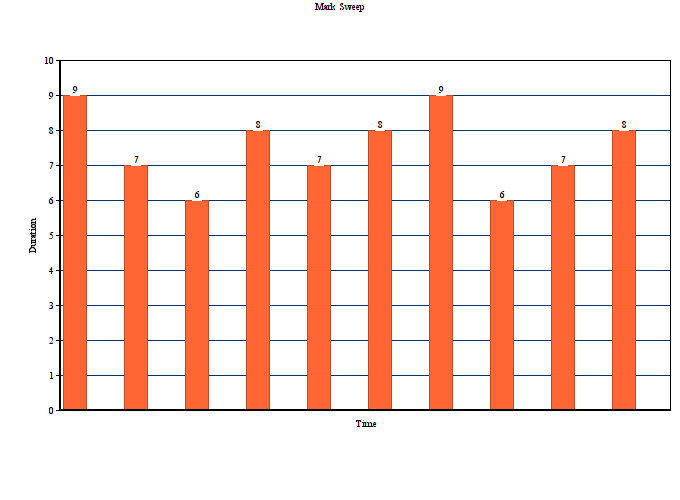
Scavenge Compact Runs
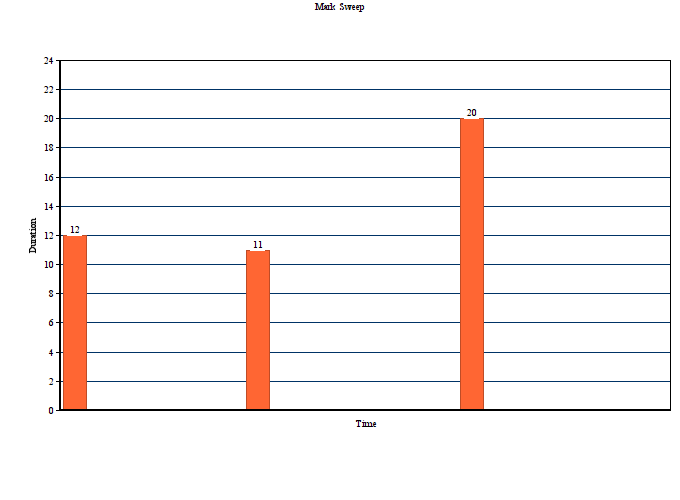
Mark Sweep Runs
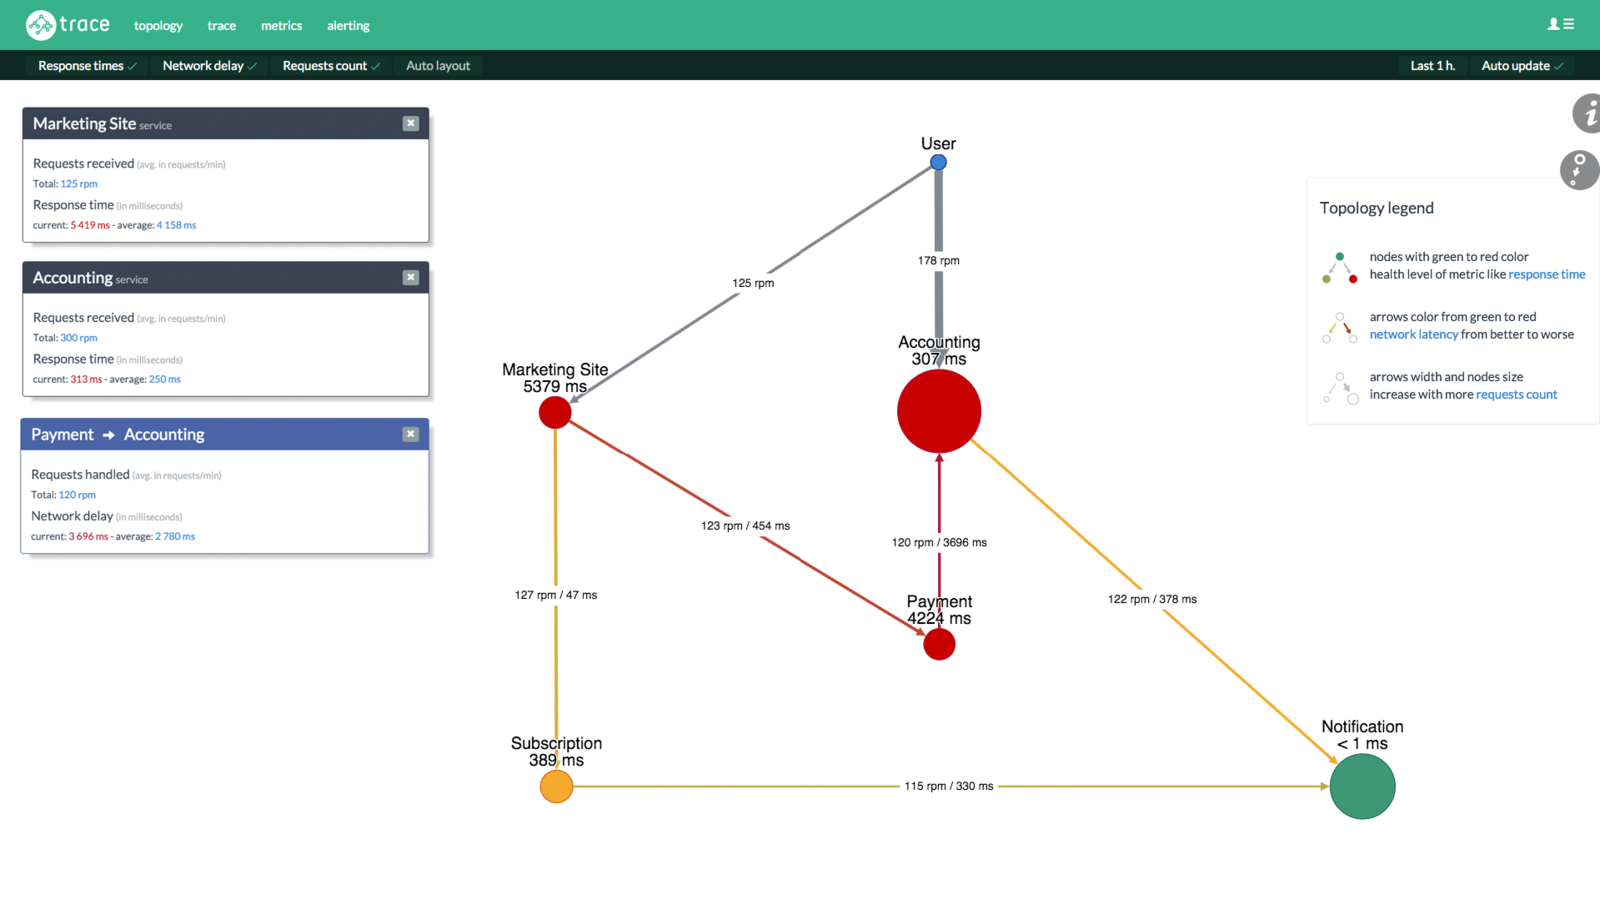
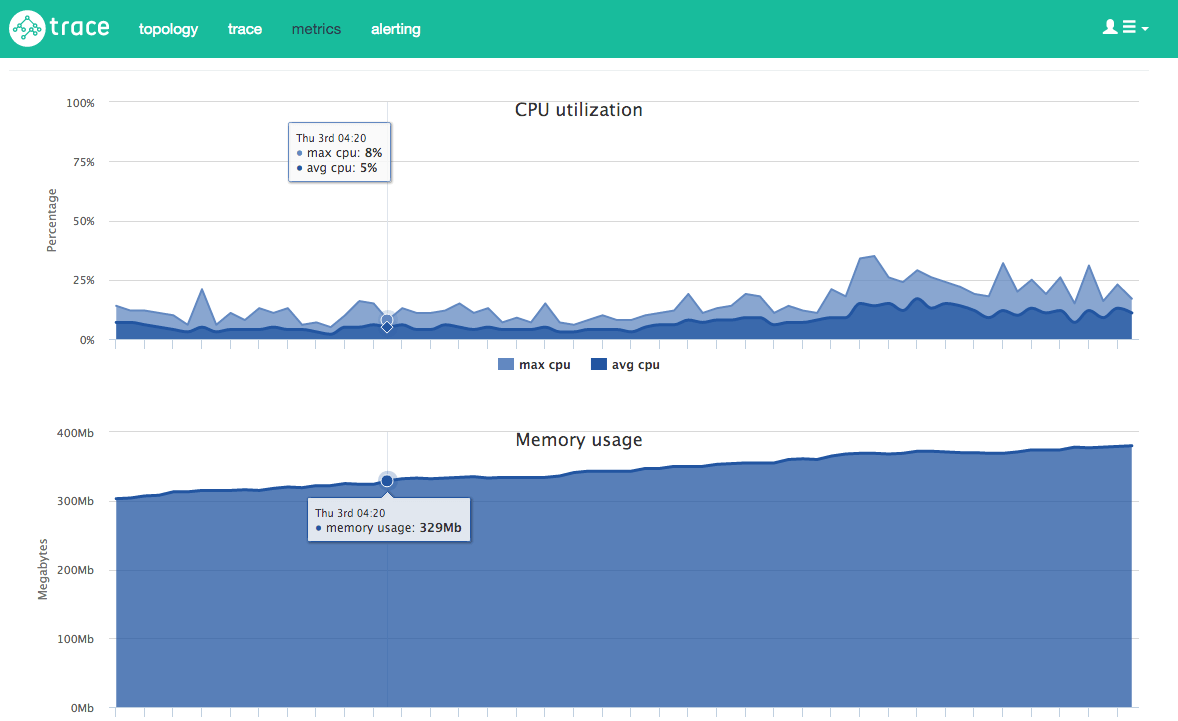
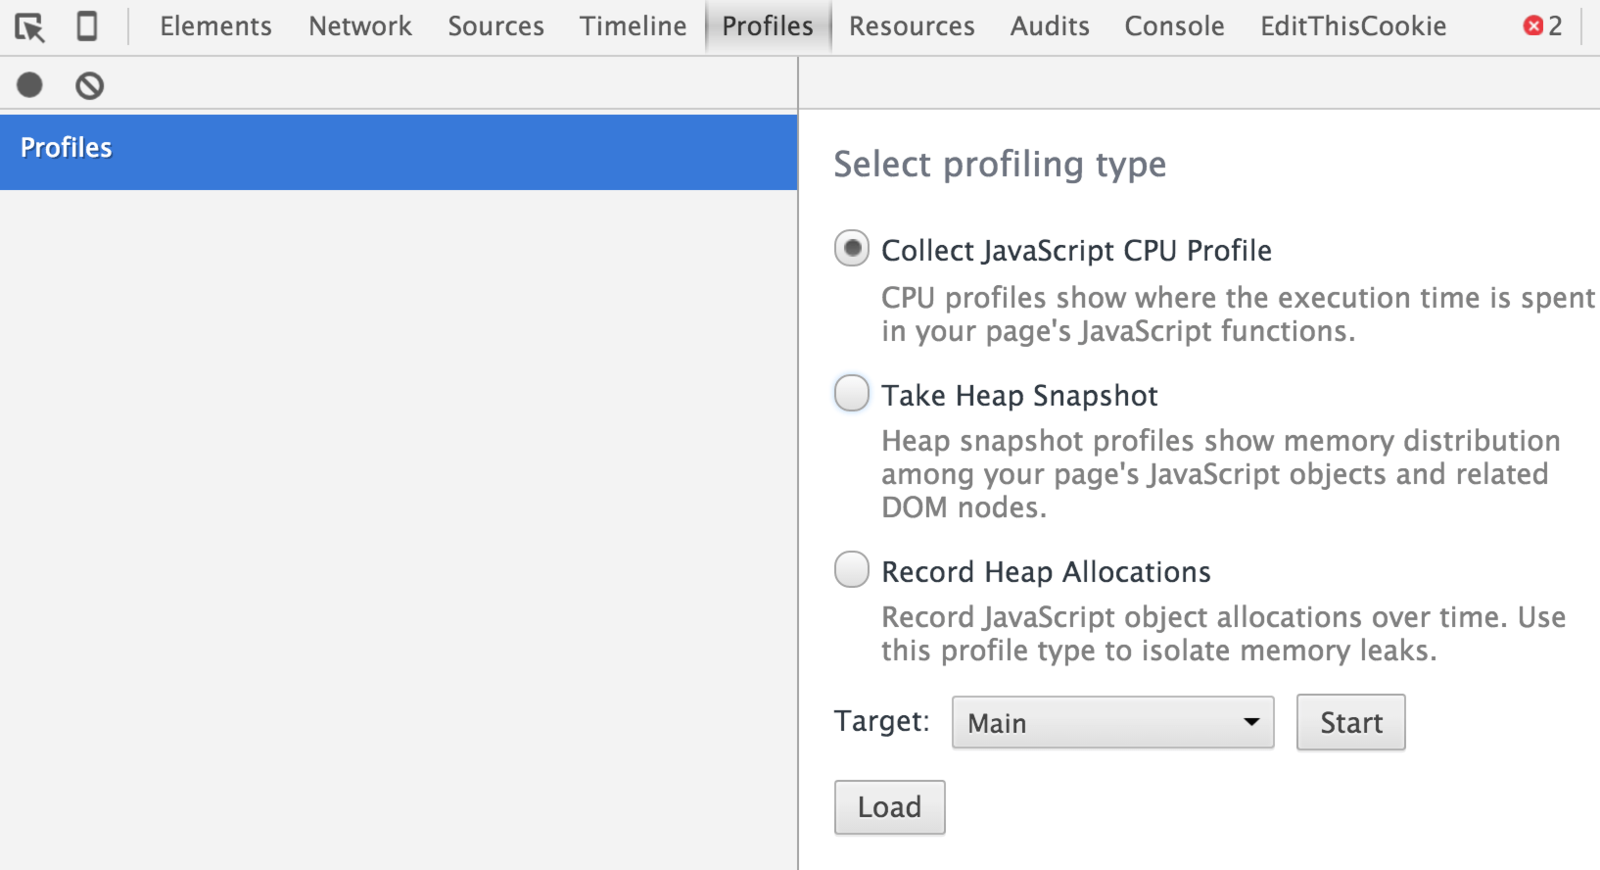
Tools to find leaks
npm install heapdumpvar heapdump = require('heapdump');
heapdump.writeSnapshot(function(err, filename) {
console.log('dump written to', filename);
});$ kill -USR2 <pid>or
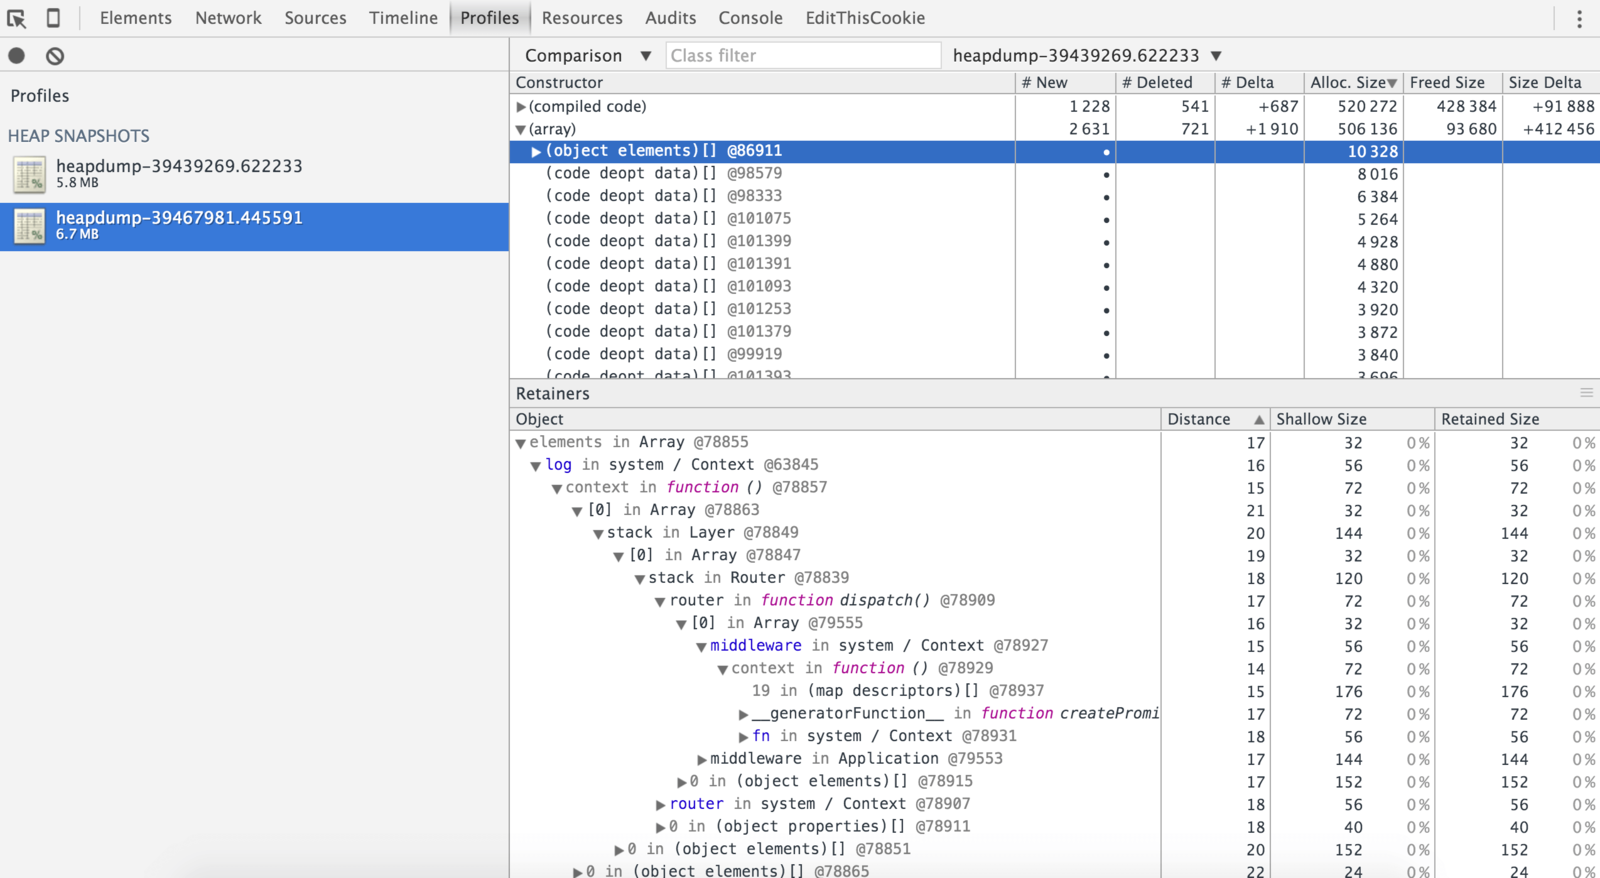
const heapdump = require('heapdump')
const app = require('koa')()
const router = require('koa-router')()

const log = [];

router.get('/', function *(next) {
  log.push(this.headers)
  this.body = {
    status: 'finding a leak'
  }
})

app
  .use(router.routes())
  .use(router.allowedMethods())

app.listen(process.env.PORT || 3000)
Low-level tools
mdb
extensible utility for:
- low-level debugging and editing of the live operating system
- operating system crash dumps
- user processes
- user process core dumps
gcore
generate a core dump of a running program with process ID pid.
# create core dump of the node process
gcore `pgrep node`

# search for the all the JS Objects on the heap
> ::findjsobjects

# analyze them using
object_id::jsprint

# find the retainer of the object
object_id::findjsobjects -r
Configuring Node.js memory management
for the brave ones
node --v8-options# expose gc extension
--expose_gc
# print one trace line following each garbage collection
--trace_gc
# Enables optimizations which favor memory size over execution speed.
--optimize_for_size
# max size of the old space (in Mbytes)
--max_old_space_size
# grow the new space based on the percentage of survivors
--experimental_new_space_growth_heuristicLearn Node.js from Zero to Hero
http://bit.ly/nodehero
https://slides.com/gergelyke
Gergely Nemeth, RisingStack
@nthgergo
Thanks!
Finding a memory leak in Node.js
By Gergely Nemeth