


Daniel Haehn PRO
Hi, I am a biomedical imaging and visualization researcher who investigates how computational methods can accelerate biological and medical research.
3/11 via Zoom!
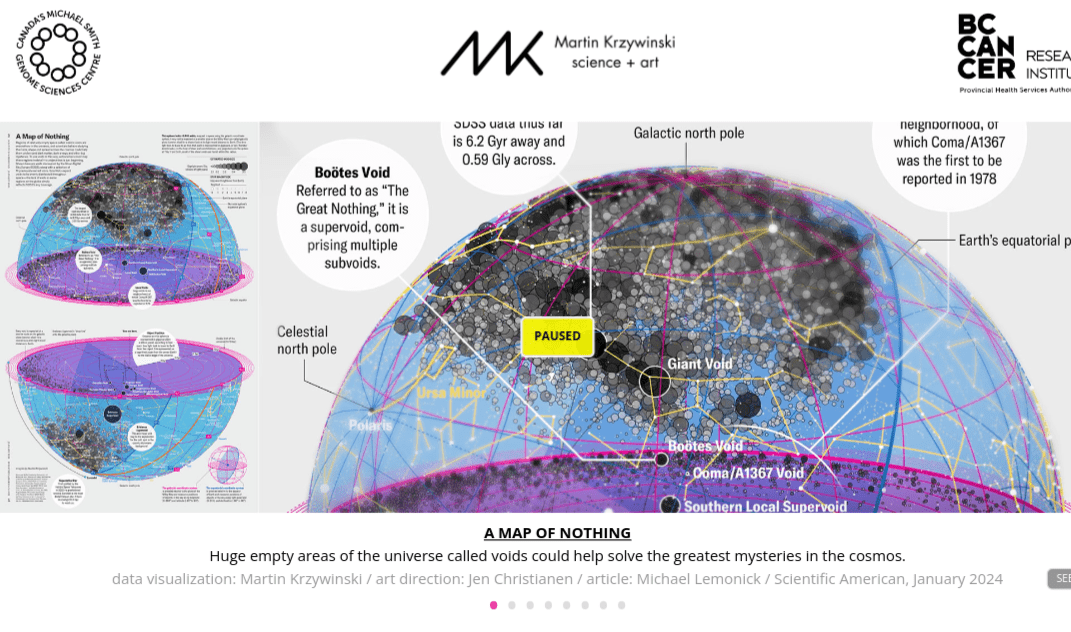
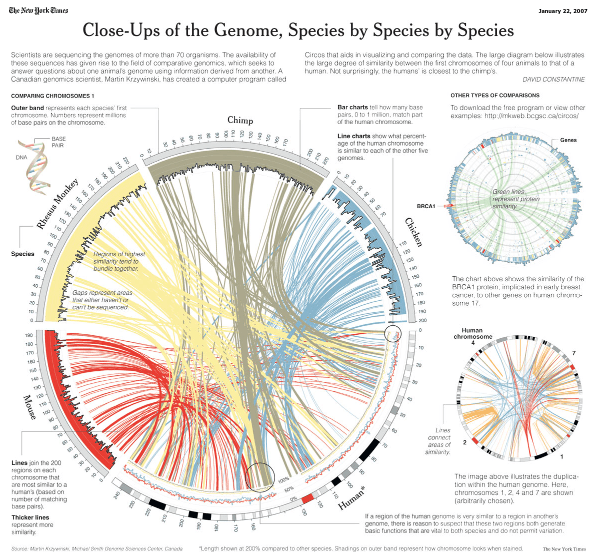
Martin Krzywinski
NEXT TIME!
<html>
 <head>
   <script src="https://cdn.plot.ly/plotly-latest.min.js"></script>
 </head>
 <body>
 <div id='p'></div>
 <script>

  var semesters = ['F17', 'Sp18', 'F18', 'Sp19', 'F19', 'Sp20', 'F20', 'Sp21', 'F21', 'Sp22', 'F22', 'Sp23', 'F23'];

  var s_count = [1085.0, 1005.0, 1145.0, 1042.0, 1171, 1089.0, 1192.0, 1114.0, 1237.0, 1194.0, 1490.0, 1359.0, 1686.0];

  var f_count = [22, 23, 23, 23, 24, 24, 24, 26, 25, 24, 23, 24, 25];

  var students = {
  x: semesters,
  y: s_count
};

var faculty = {
  x: semesters,
  y: f_count
};

  var data = [students, faculty];

  Plotly.newPlot('p', data);
</script>
 </body>
<html>
prep for Assignment 3!
<html>
 <head>
   <script src="https://cdn.plot.ly/plotly-latest.min.js"></script>
 </head>
 <body>
 <div id='p'></div>
 <script>

  var semesters = ['F17', 'Sp18', 'F18', 'Sp19', 'F19', 'Sp20', 'F20', 'Sp21', 'F21', 'Sp22', 'F22', 'Sp23', 'F23'];

  var s_count = [1085.0, 1005.0, 1145.0, 1042.0, 1171, 1089.0, 1192.0, 1114.0, 1237.0, 1194.0, 1490.0, 1359.0, 1686.0];

  var f_count = [22, 23, 23, 23, 24, 24, 24, 26, 25, 24, 23, 24, 25];

  var students = {
  x: semesters,
  y: s_count
};

var faculty = {
  x: semesters,
  y: f_count
};

  var data = [students, faculty];

  Plotly.newPlot('p', data);
</script>
 </body>
<html>
prep for Assignment 3!
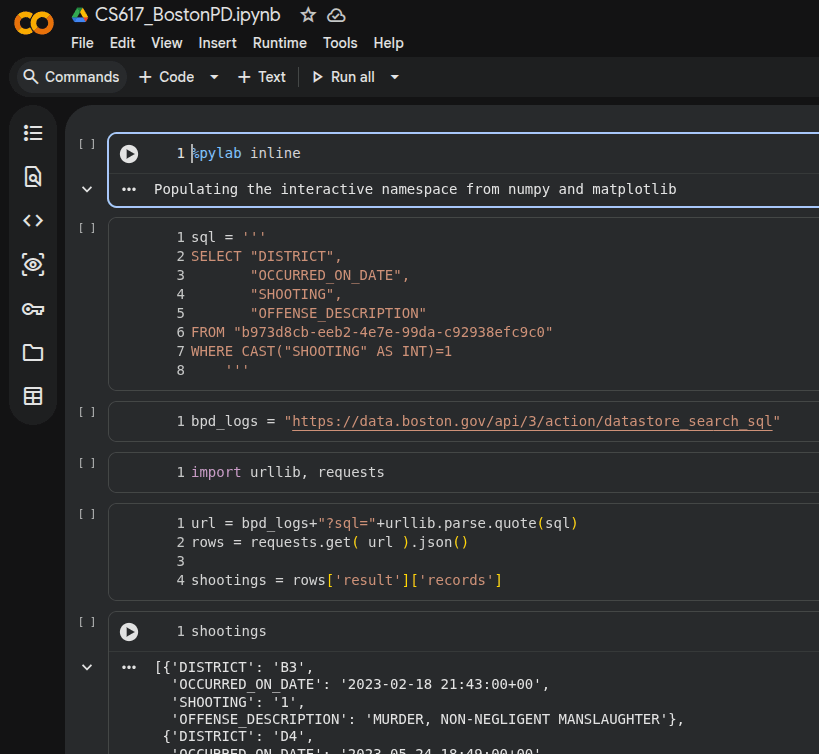
Crime API
SELECT "DISTRICT",
       "OCCURRED_ON_DATE",
       "SHOOTING",
       "OFFENSE_DESCRIPTION"
FROM "b973d8cb-eeb2-4e7e-99da-c92938efc9c0"
WHERE CAST("SHOOTING" AS INT)=1
Database
only shootings
District Code
Timestamp
Shooting yes/no
Type of Crime
Crime API
SELECT "DISTRICT",
       "OCCURRED_ON_DATE",
       "SHOOTING",
       "OFFENSE_DESCRIPTION"
FROM "b973d8cb-eeb2-4e7e-99da-c92938efc9c0"
WHERE CAST("SHOOTING" AS INT)=1
We will grab the data in Colab together!
create a plotly visualization as a team!
"""
Fetch Boston open data (CKAN) via the datastore_search_sql API.

- Robust handling of URL encoding
- Paginates with LIMIT/OFFSET
- Returns a pandas DataFrame (optional)
"""

from __future__ import annotations

import time
import urllib.parse
from typing import Dict, List, Optional, Tuple

import requests

try:
    import pandas as pd  # optional
except Exception:
    pd = None  # type: ignore


CKAN_SQL_ENDPOINT = "https://data.boston.gov/api/3/action/datastore_search_sql"


def ckan_sql(
    sql: str,
    *,
    max_records: Optional[int] = None,
    page_size: int = 5000,
    sleep_s: float = 0.1,
    timeout_s: int = 30,
    session: Optional[requests.Session] = None,
) -> List[Dict]:
    """
    Execute a CKAN SQL query with pagination.

    Args:
        sql: SQL string (WITHOUT URL encoding).
        max_records: Stop after this many records (None = fetch all pages).
        page_size: LIMIT per page (CKAN typically supports up to ~50k but be nice).
        sleep_s: Small pause between requests.
        timeout_s: HTTP timeout.
        session: Optional requests.Session for connection reuse.

    Returns:
        List of record dicts.
    """
    sess = session or requests.Session()

    # Ensure the SQL doesn't already have LIMIT/OFFSET; we will inject them.
    # If you prefer manual control, set max_records and page_size and include LIMIT/OFFSET yourself.
    base_sql = sql.strip().rstrip(";")

    records: List[Dict] = []
    offset = 0

    while True:
        # Compose paged SQL
        paged_sql = f"{base_sql} LIMIT {page_size} OFFSET {offset}"

        # Properly encode as query param
        params = {"sql": paged_sql}
        url = CKAN_SQL_ENDPOINT + "?" + urllib.parse.urlencode(params)

        resp = sess.get(url, timeout=timeout_s)
        resp.raise_for_status()
        payload = resp.json()

        if not payload.get("success", False):
            raise RuntimeError(f"CKAN query failed: {payload}")

        chunk = payload["result"].get("records", [])
        if not chunk:
            break

        records.extend(chunk)

        if max_records is not None and len(records) >= max_records:
            return records[:max_records]

        offset += page_size
        time.sleep(sleep_s)

    return records


def get_2026_shootings_rows(
    *,
    max_records: Optional[int] = 20000,
    page_size: int = 5000,
) -> List[Dict]:
    """
    Example: Shootings in 2026 from the 2023-to-present crime resource.

    NOTE: This will return empty if the portal has not yet ingested 2026 rows,
          or if SHOOTING is not populated for 2026 yet.
    """
    resource_id = "b973d8cb-eeb2-4e7e-99da-c92938efc9c0"

    sql = f"""
    SELECT
      "OCCURRED_ON_DATE",
      "DISTRICT",
      "OFFENSE_CODE_GROUP",
      "OFFENSE_DESCRIPTION",
      "Lat",
      "Long",
      "SHOOTING"
    FROM "{resource_id}"
    WHERE CAST("SHOOTING" AS INT) = 1
      AND CAST("OCCURRED_ON_DATE" AS TIMESTAMP) >= TIMESTAMP '2026-01-01 00:00:00'
    ORDER BY CAST("OCCURRED_ON_DATE" AS TIMESTAMP) DESC
    """

    return ckan_sql(sql, max_records=max_records, page_size=page_size)


def to_dataframe(records: List[Dict]):
    if pd is None:
        raise ImportError("pandas is not installed. Install it or use the raw list of dicts.")
    return pd.DataFrame.from_records(records)


if __name__ == "__main__":
    rows = get_2026_shootings_rows(max_records=10000, page_size=5000)
    print(f"Fetched {len(rows)} rows")

    # Optional: convert to DataFrame and inspect
    if pd is not None:
        df = to_dataframe(rows)
        print(df.head())
{"help": "https://data.boston.gov/api/3/action/help_show?name=datastore_search", "success": true, "result": {"include_total": true, "limit": 0, "records_format": "objects", "resource_id": "b973d8cb-eeb2-4e7e-99da-c92938efc9c0", "total_estimation_threshold": null, "records": [], "fields": [{"id": "_id", "type": "int"}, {"id": "INCIDENT_NUMBER", "type": "text"}, {"id": "OFFENSE_CODE", "type": "text"}, {"id": "OFFENSE_CODE_GROUP", "type": "text"}, {"id": "OFFENSE_DESCRIPTION", "type": "text"}, {"id": "DISTRICT", "type": "text"}, {"id": "REPORTING_AREA", "type": "text"}, {"id": "SHOOTING", "type": "text"}, {"id": "OCCURRED_ON_DATE", "type": "text"}, {"id": "YEAR", "type": "text"}, {"id": "MONTH", "type": "text"}, {"id": "DAY_OF_WEEK", "type": "text"}, {"id": "HOUR", "type": "text"}, {"id": "UCR_PART", "type": "text"}, {"id": "STREET", "type": "text"}, {"id": "Lat", "type": "text"}, {"id": "Long", "type": "text"}, {"id": "Location", "type": "text"}], "_links": {"start": "/api/3/action/datastore_search?limit=0&resource_id=b973d8cb-eeb2-4e7e-99da-c92938efc9c0", "next": "/api/3/action/datastore_search?limit=0&resource_id=b973d8cb-eeb2-4e7e-99da-c92938efc9c0&offset=0"}, "total": 248765, "total_was_estimated": false}}Crime API
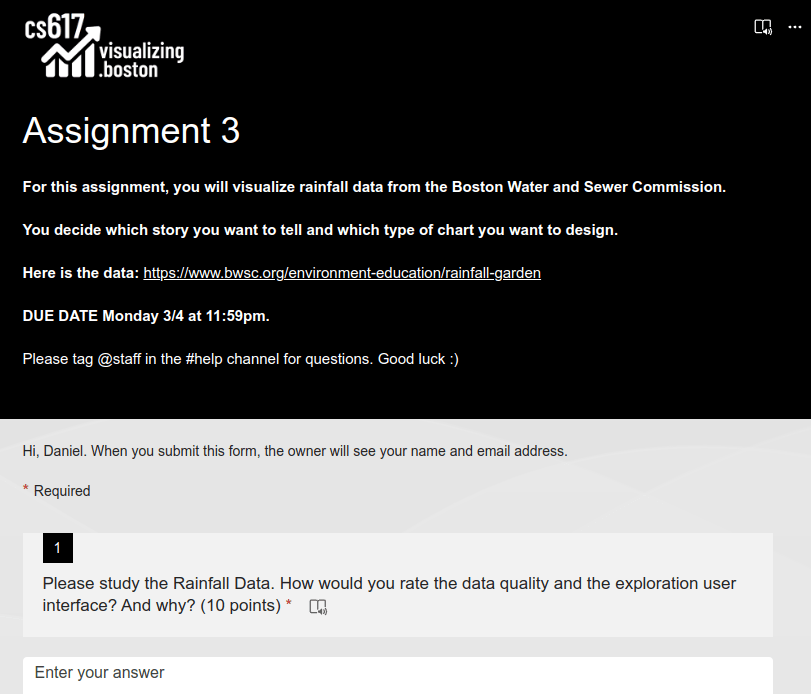
Coming soon as Assignment 3!
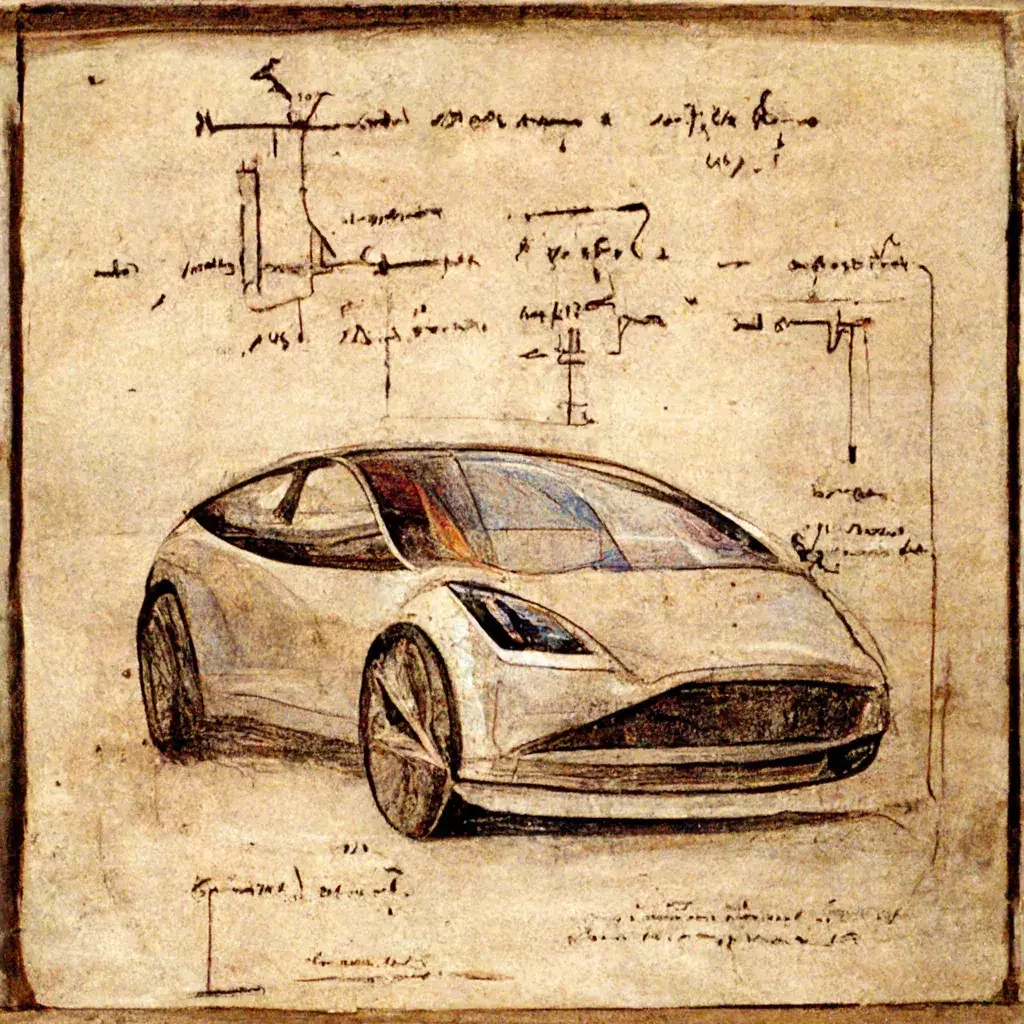
The Vitruvian Man
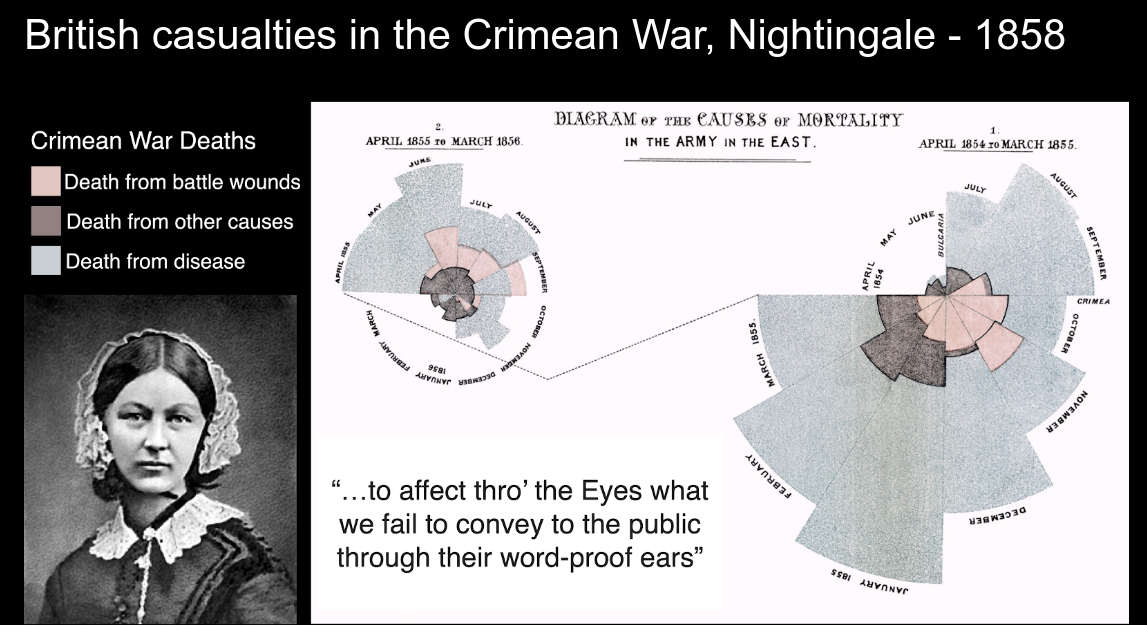
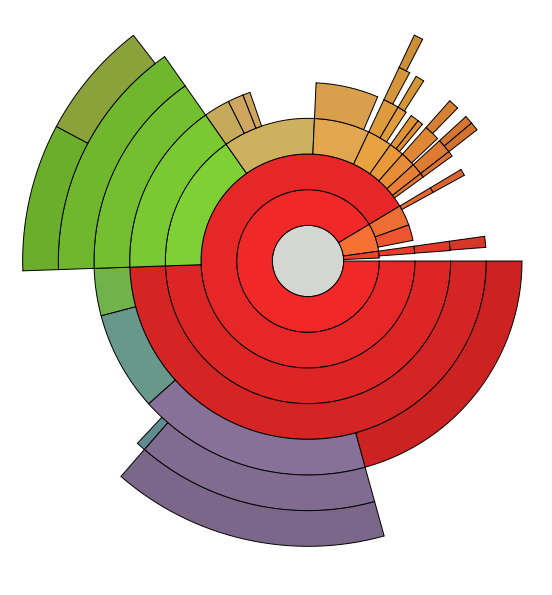
Coxcomb chart or polar area diagram, very popular today
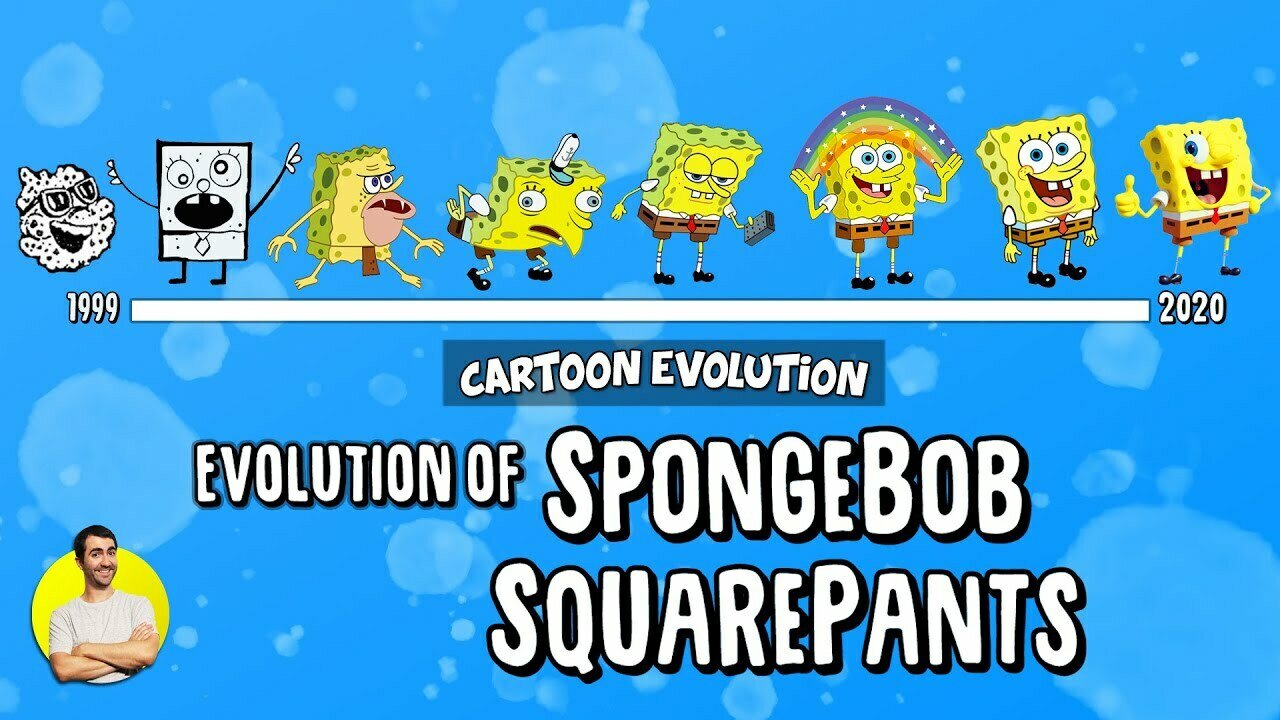
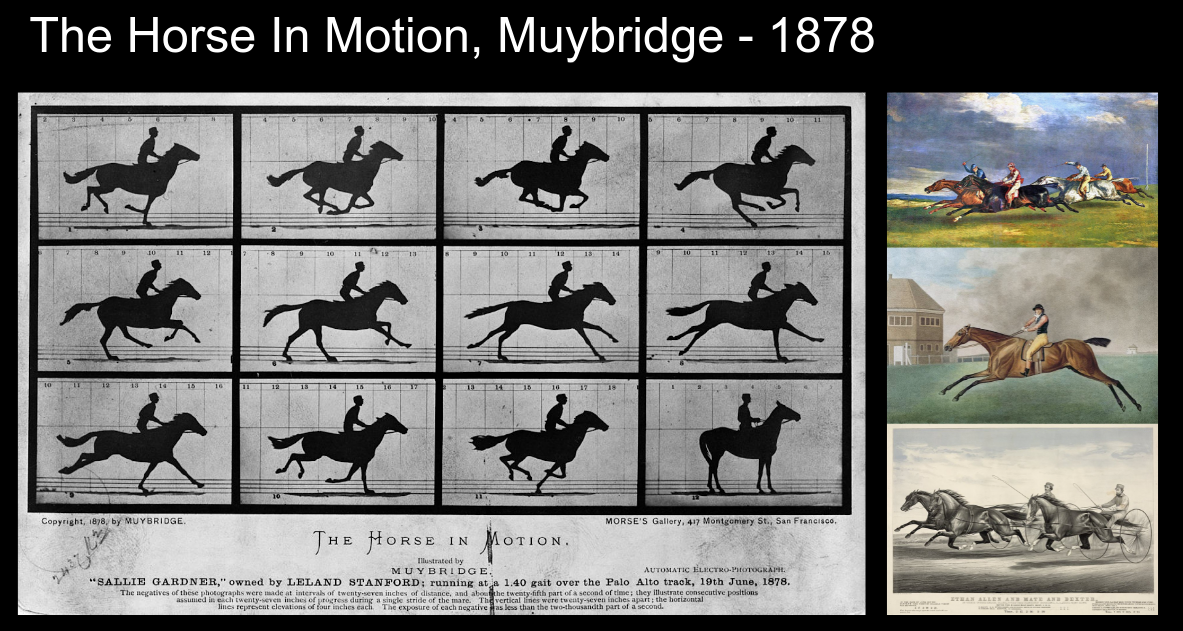
First example of chronophotography
<html>
<head>
<script src="https://d3js.org/d3.v7.min.js"></script>
</head>
<body>
<svg id='s' width="600" height="400"></svg>
<script>
// create data
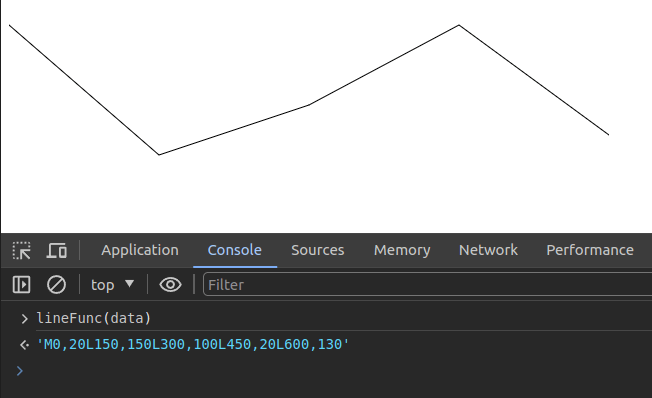
var data = [{x: 0, y: 20},
{x: 150, y: 150},
{x: 300, y: 100},
{x: 450, y: 20},
{x: 600, y: 130}]
// grab svg
var svg = d3.select("svg");
// prepare a helper function
var lineFunc = d3.line()
.x( function(d) { return d.x } )
.y( function(d) { return d.y } )
// Add the path using this helper function
svg.append('path')
.attr('d', lineFunc(data))
.attr('stroke', 'black')
.attr('fill', 'none');
</script>
</body>
</html>
<!DOCTYPE html>
<html>
<head>
<style>
body {
color: white;
background-color: black;
width: 100%;
height: 100%;
overflow: hidden;
}
svg {
position: absolute;
width: 100%;
height: 100%;
}
</style>
</head>
<body>
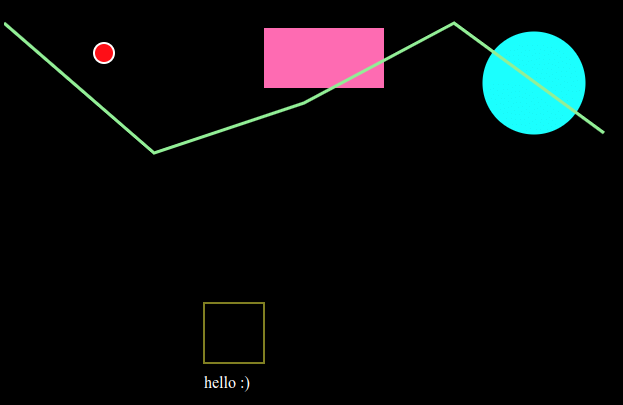
<svg>
<circle cx="530" cy="80" r="50" fill="cyan" stroke="cyan" stroke-width="3"></circle>
<circle cx="100" cy="50" r="10" fill="#ff0000" stroke="#fff" stroke-width="2"></circle>
<rect x="260" y="25" width="120" height="60" fill="hotpink"></rect>
<g transform="translate(200, 300)">
<rect x="0" y="0" width="60" height="60" fill="transparent" stroke="yellow" />
<text x="0" y="85" fill='white'>hello :)</text>
</g>
<path d="M 0,20 L 150,150 L 300,100 L 450,20 L 600,130" fill="none" stroke="lightgreen" stroke-width="3"></path>
</svg>
</body>
</html>Homework
Create a new circle every second until 100 randomly positioned circles are on the screen.
Homework
Create a new circle every second until 100 randomly positioned circles are on the screen with D3!
Due Monday 3/4 !
Homework
Read Enrico Bertini's take on Visualization Literacy!
By Daniel Haehn
Slides for CS617 VISUALIZING.BOSTON - See https://cs617.orghttps://cs617.org


