


Daniel Haehn PRO
Hi, I am a biomedical imaging and visualization researcher who investigates how computational methods can accelerate biological and medical research.
3/11 via Zoom!
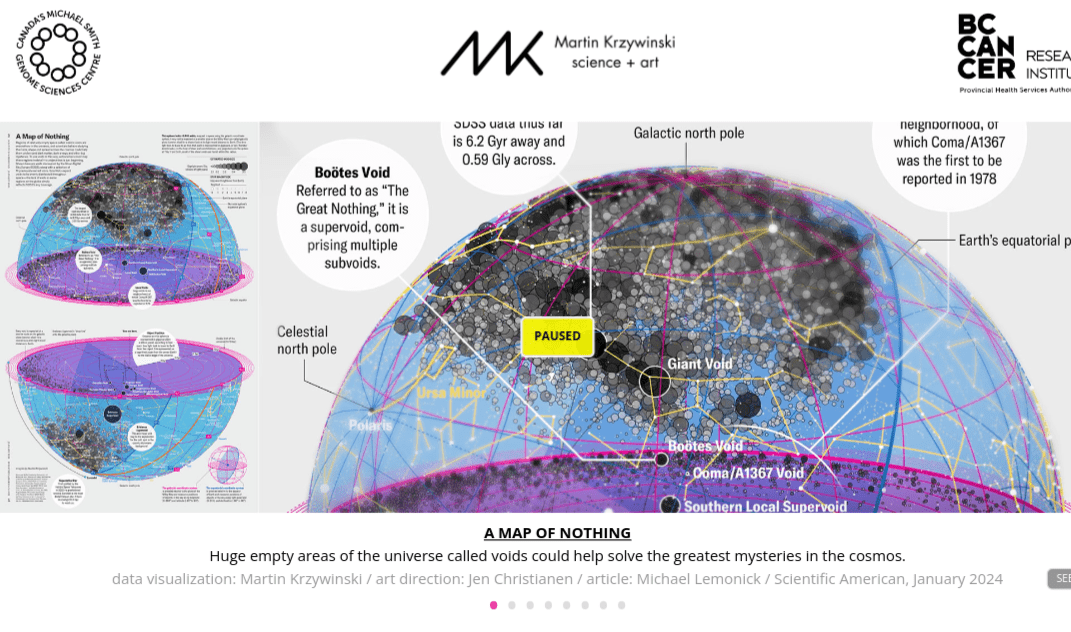
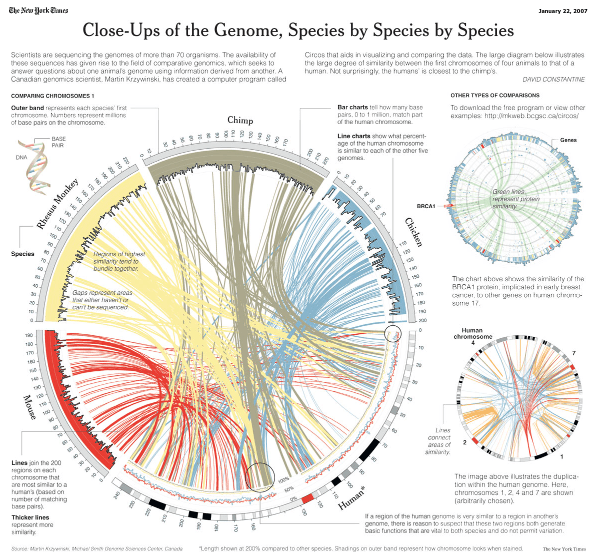
Martin Krzywinski
Fritz Lekschas
3/7 via Zoom!
Coming soon!
Crime API
SELECT "DISTRICT",
       "OCCURRED_ON_DATE",
       "SHOOTING",
       "OFFENSE_DESCRIPTION"
FROM "b973d8cb-eeb2-4e7e-99da-c92938efc9c0"
WHERE CAST("SHOOTING" AS INT)=1
We will grab the data in Colab together!
create a plotly visualization as a team!
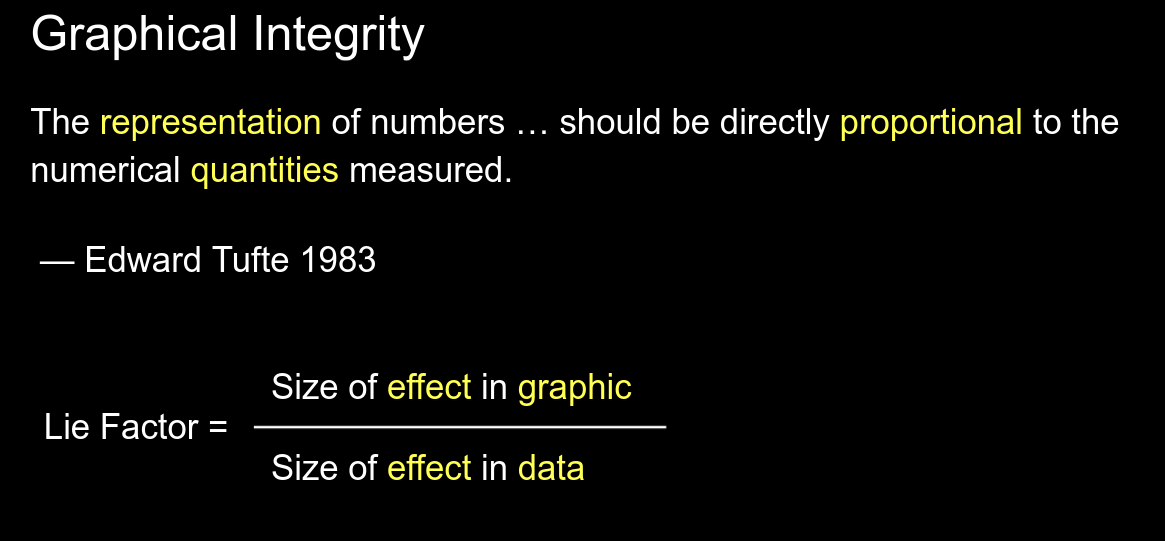
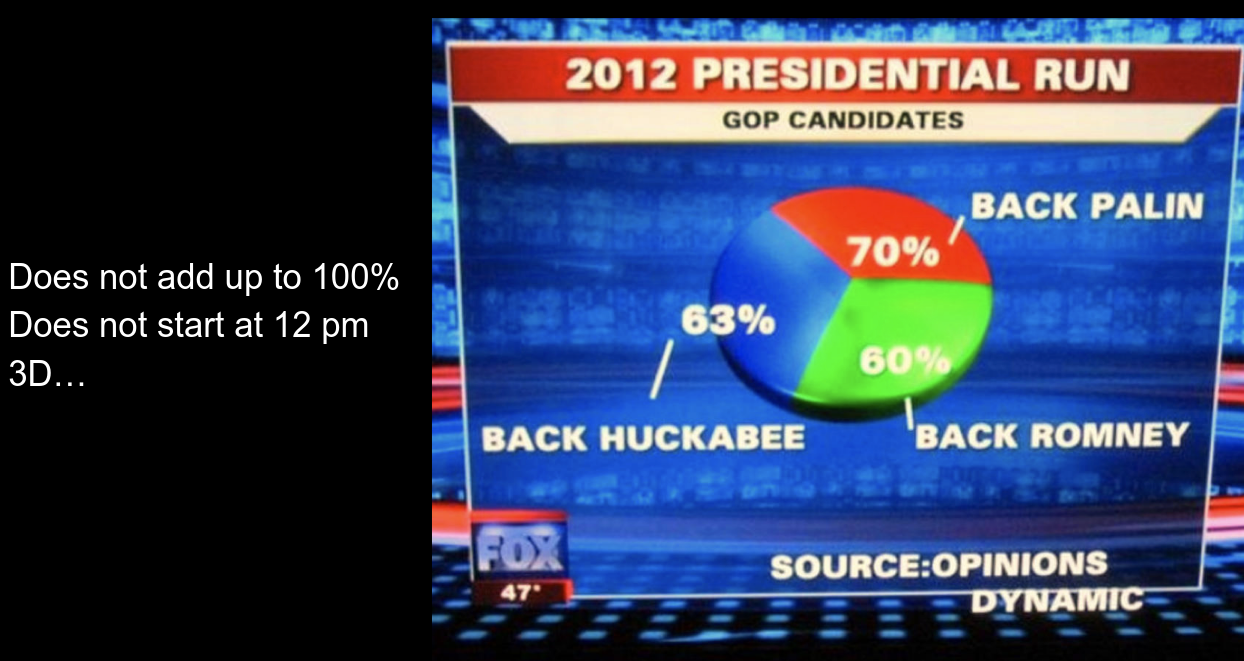
To ensure the Integrity of a graphic, its Lie Factor should have a value between 0.95 and 1.05.
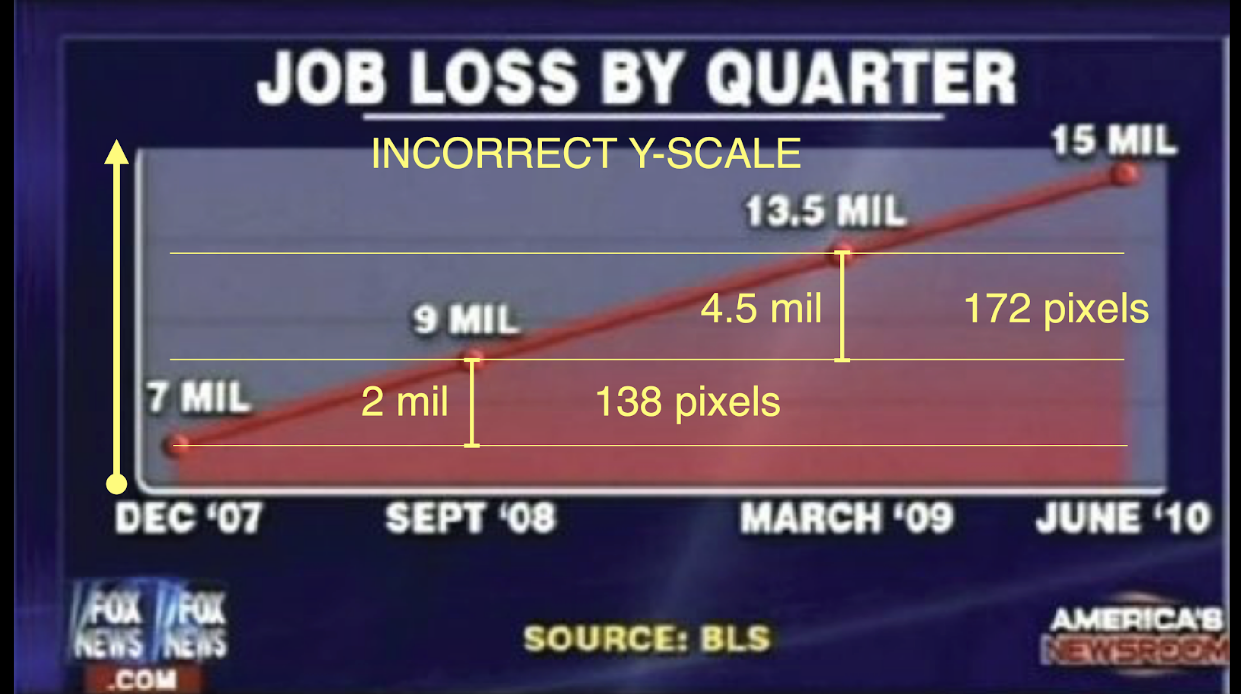
((172 - 138) / 138)
------------------
((4500000 - 2000000) / 2000000)
0.198
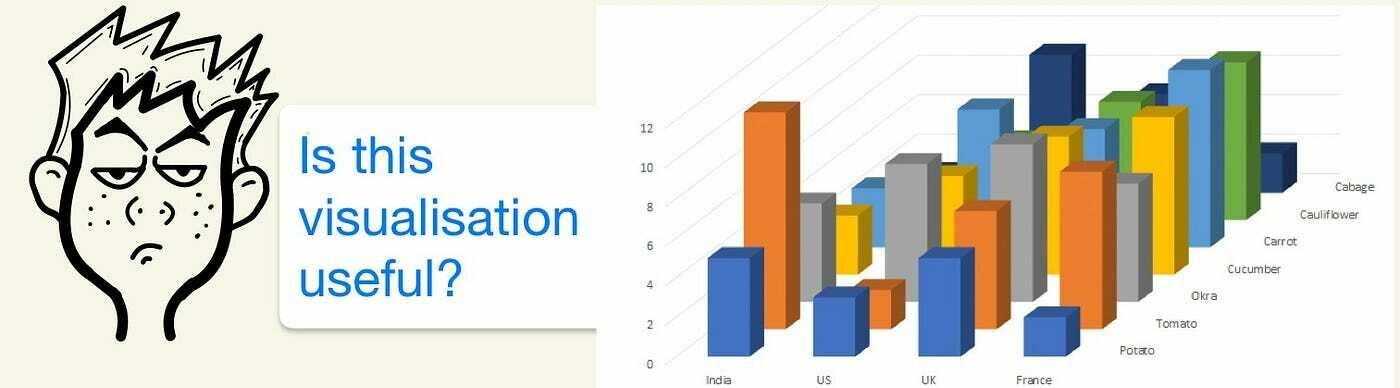
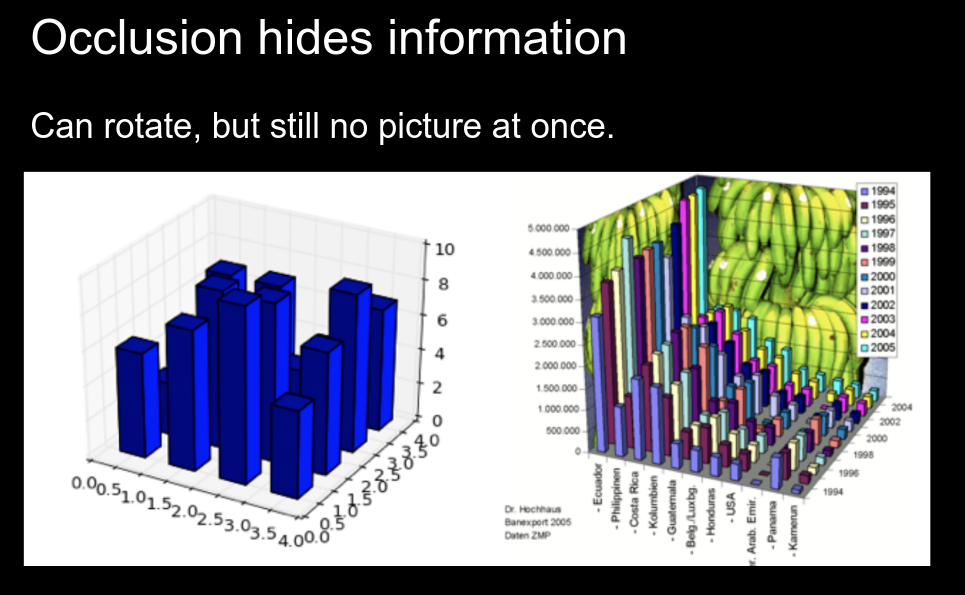
3D plots can lead to occlusion and confusion
and these are ugly colors!!
today or next time??
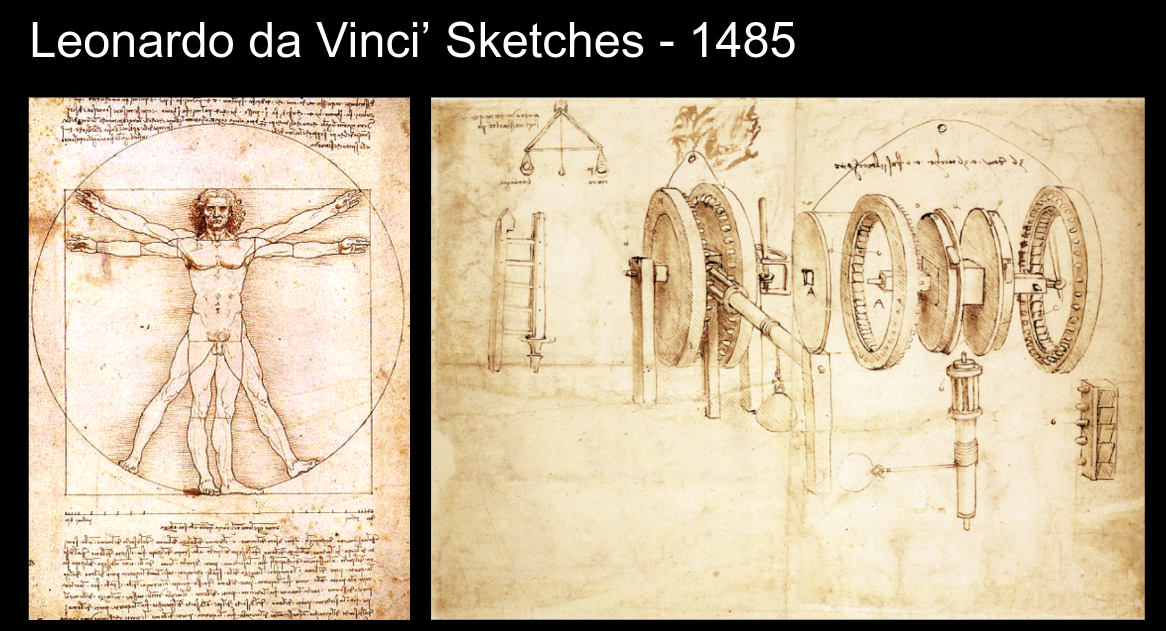
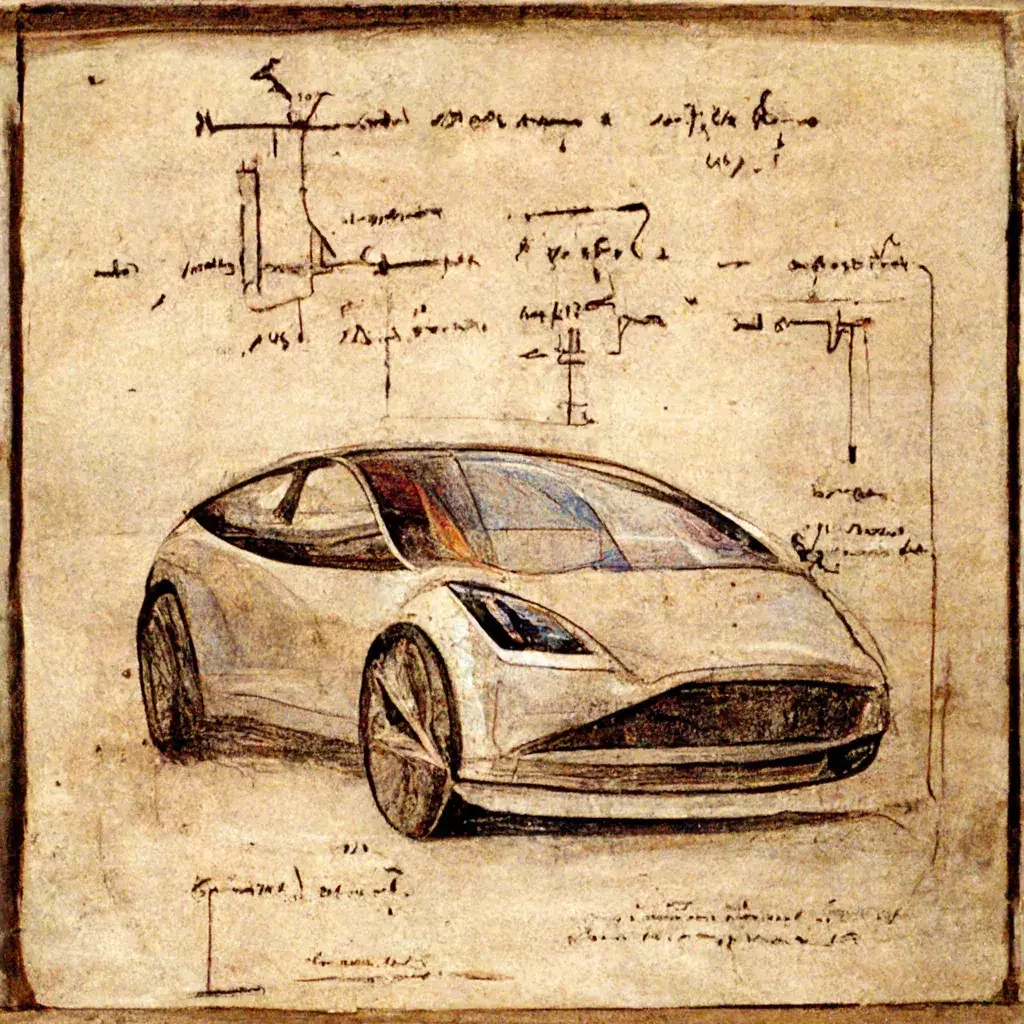
The Vitruvian Man
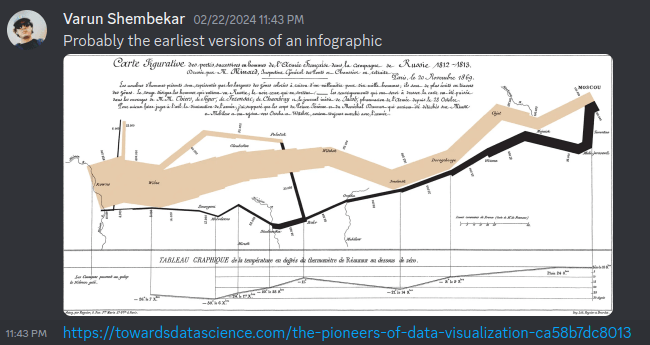
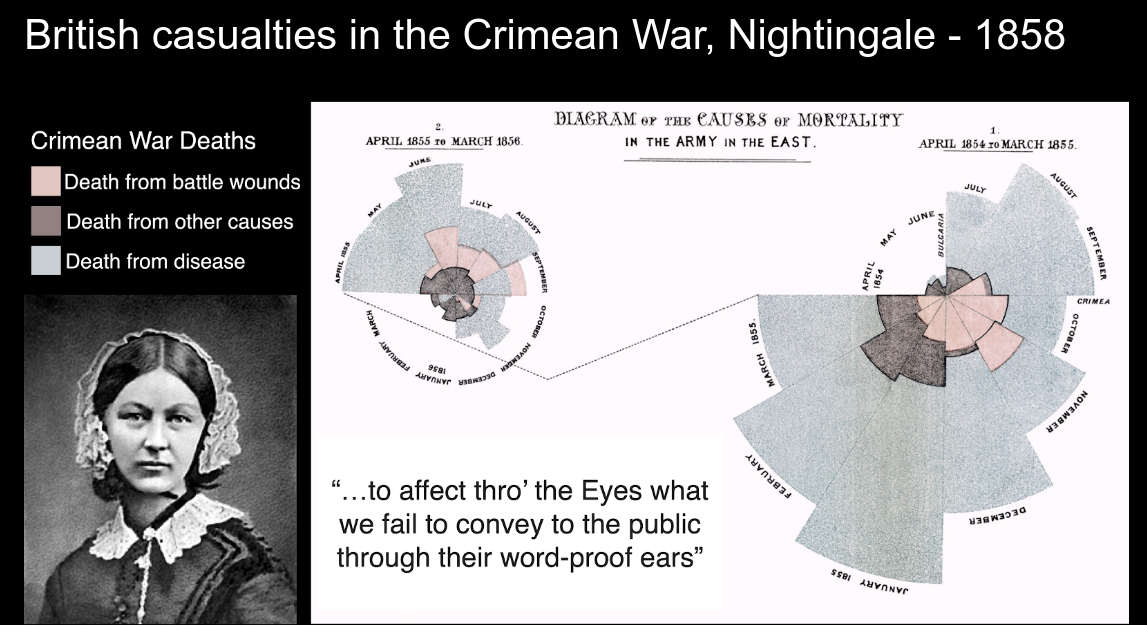
Coxcomb chart or polar area diagram, very popular today
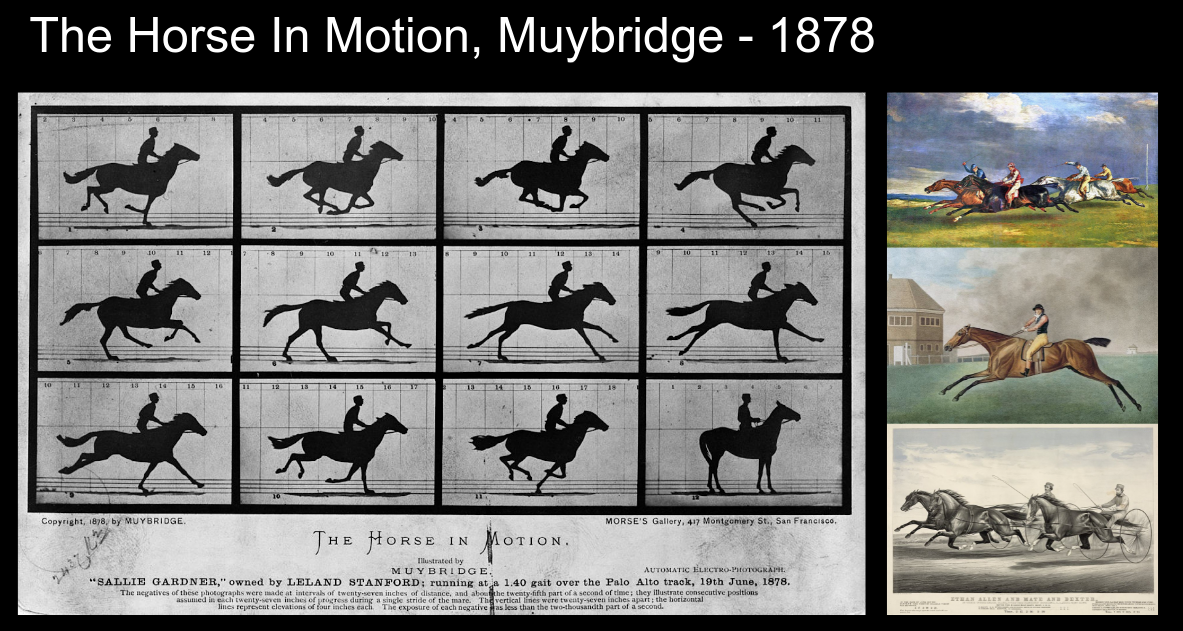
First example of chronophotography
<html>
<head>
<script src="https://d3js.org/d3.v7.min.js"></script>
</head>
<body>
<svg id='s' width="600" height="400"></svg>
<script>
// create data
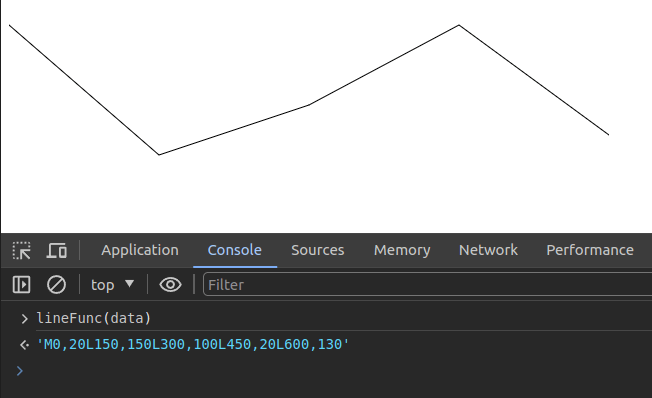
var data = [{x: 0, y: 20},
{x: 150, y: 150},
{x: 300, y: 100},
{x: 450, y: 20},
{x: 600, y: 130}]
// grab svg
var svg = d3.select("svg");
// prepare a helper function
var lineFunc = d3.line()
.x( function(d) { return d.x } )
.y( function(d) { return d.y } )
// Add the path using this helper function
svg.append('path')
.attr('d', lineFunc(data))
.attr('stroke', 'black')
.attr('fill', 'none');
</script>
</body>
</html>
<!DOCTYPE html>
<html>
<head>
<style>
body {
color: white;
background-color: black;
width: 100%;
height: 100%;
overflow: hidden;
}
svg {
position: absolute;
width: 100%;
height: 100%;
}
</style>
</head>
<body>
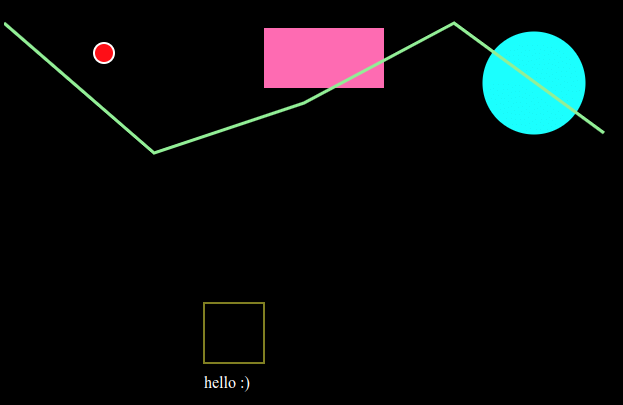
<svg>
<circle cx="530" cy="80" r="50" fill="cyan" stroke="cyan" stroke-width="3"></circle>
<circle cx="100" cy="50" r="10" fill="#ff0000" stroke="#fff" stroke-width="2"></circle>
<rect x="260" y="25" width="120" height="60" fill="hotpink"></rect>
<g transform="translate(200, 300)">
<rect x="0" y="0" width="60" height="60" fill="transparent" stroke="yellow" />
<text x="0" y="85" fill='white'>hello :)</text>
</g>
<path d="M 0,20 L 150,150 L 300,100 L 450,20 L 600,130" fill="none" stroke="lightgreen" stroke-width="3"></path>
</svg>
</body>
</html>Homework
Create a new circle every second until 100 randomly positioned circles are on the screen.
<!DOCTYPE html>
<html>
<head>

  <style>
    body {
      color: white;
      background-color: black;
      width: 100%;
      height: 100%;
      overflow: hidden;
      padding: 0px;
      margin: 0px;
    }

    svg {
      position: absolute;
      width: 100%;
      height: 100%;
    }
  </style>
  <script>

  window.onload = function() {


      s = document.getElementById('s');

      c = document.createElementNS("http://www.w3.org/2000/svg", "circle");
      c.setAttribute('r', 100*Math.random());
      c.setAttribute('cx', 1000*Math.random());
      c.setAttribute('cy', 1000*Math.random());
      c.setAttribute('fill', 'hotpink');

      s.appendChild(c);

    }

  </script>

</head>
<body>
  <svg id='s'>
  </svg>
</body>
</html>
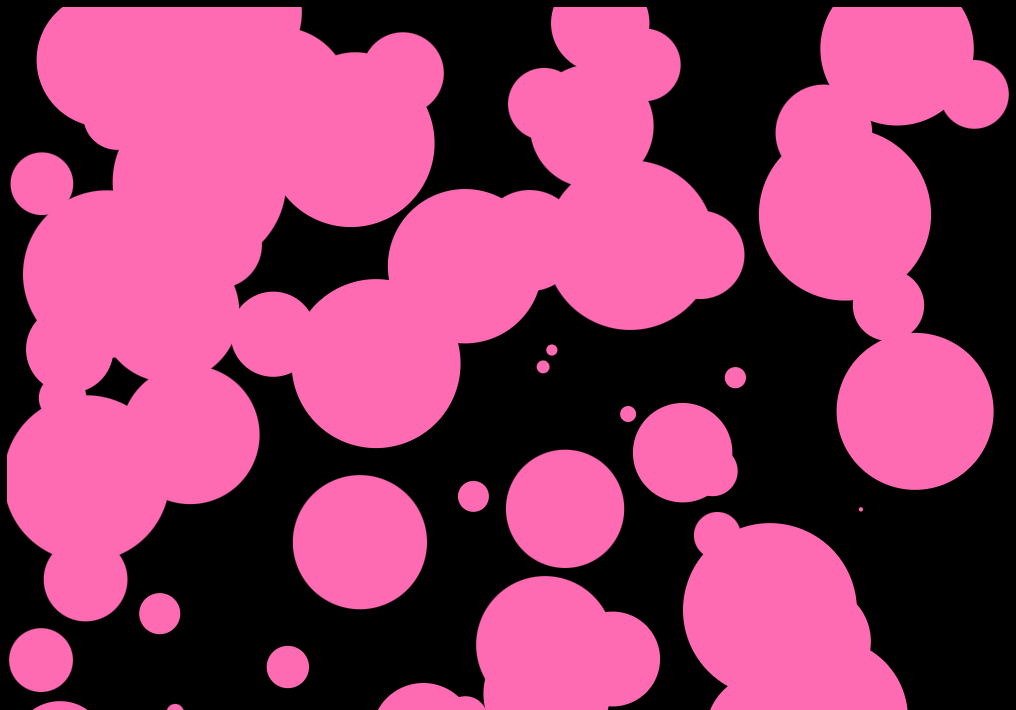
Homework
Create a new circle every second until 100 randomly positioned circles are on the screen with D3!
<!DOCTYPE html>
<html>
<head>

  <style>
    body {
      color: white;
      background-color: black;
      width: 100%;
      height: 100%;
      overflow: hidden;
      padding: 0px;
      margin: 0px;
    }

    svg {
      position: absolute;
      width: 100%;
      height: 100%;
    }
  </style>
  <script src="https://d3js.org/d3.v7.min.js"></script>
  <script>

  window.onload = function() {


    s = d3.select('#s');

    setInterval(function() {

      s.append('circle')
        .attr('cx', 1000*Math.random())
        .attr('cy', 1000*Math.random())
        .attr('r', 100*Math.random())
        .attr('fill', 'hotpink');

    }, 100);


      // s = document.getElementById('s');

      // c = document.createElementNS("http://www.w3.org/2000/svg", "circle");
      // c.setAttribute('r', 100*Math.random());
      // c.setAttribute('cx', 1000*Math.random());
      // c.setAttribute('cy', 1000*Math.random());
      // c.setAttribute('fill', 'hotpink');

      // s.appendChild(c);

    }

  </script>

</head>
<body>
  <svg id='s'>
  </svg>
</body>
</html>
Homework
Read Enrico Bertini's take on Visualization Literacy!
Homework
By Daniel Haehn
Slides for CS617 VISUALIZING.BOSTON - See https://cs617.orghttps://cs617.org


