Machine Learning Interpretability
through Contribution-Value Plots

Dennis Collaris, Jarke J. van Wijk
Eindhoven University of Technology


International Symposium on Visual Communication and Interaction (VINCI 2020)
Data
Black
Box
Subject
80% risk
Why?
ML is often applied as a black box.
How?
Pre-existing techniques as elementary building blocks.
Prediction (ŷ)
x
ŷ


How?
Pre-existing techniques as elementary building blocks.
[1] Friedman, J. H. "Greedy function approximation: a gradient boosting machine." Annals of statistics, 2001.
Prediction (ŷ)
Local PDP [1]
Sensitivity
analysis
x
ŷ


How?
Pre-existing techniques as elementary building blocks.
Prediction (ŷ)
Sensitivity
analysis
x
ŷ
[2] Goldstein, A., et al. "Peeking inside the black box: Visualizing statistical learning with plots of individual conditional expectation." Journal of Computational and Graphical Statistics, 2015.
Local PDP [1]
ICE plot [2]
Repeat
x
ŷ
How?
Pre-existing techniques as elementary building blocks.
[4] Lundberg, S. M., et. al.. "A unified approach to interpreting model predictions." Advances in neural information processing systems. 2017.
Feature 1
Feature 2
Feature 3
Feature 4
Feature 5
[3] Ribeiro, M. T., et. al. ""Why should i trust you?" Explaining the predictions of any classifier." Proceedings of the 22nd ACM SIGKDD, 2016.
How?
Pre-existing techniques as elementary building blocks.
Prediction (ŷ)
Sensitivity
analysis
x
ŷ
Local PDP [1]
ICE plot [2]
Repeat
β
How?
Pre-existing techniques as elementary building blocks.
Prediction (ŷ)
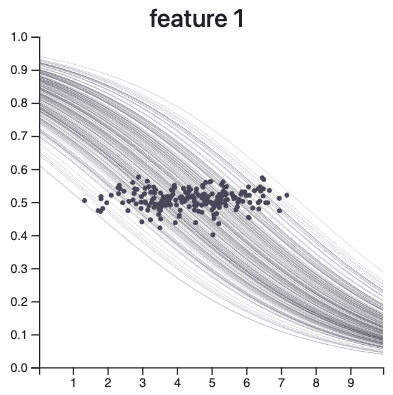
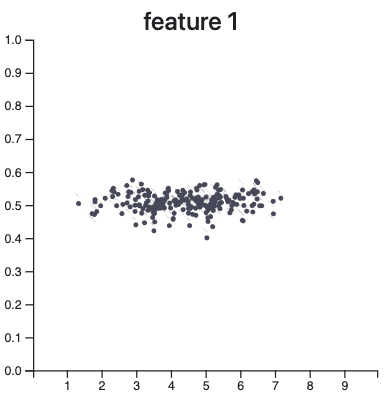
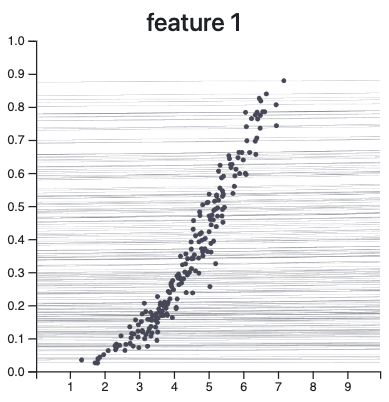
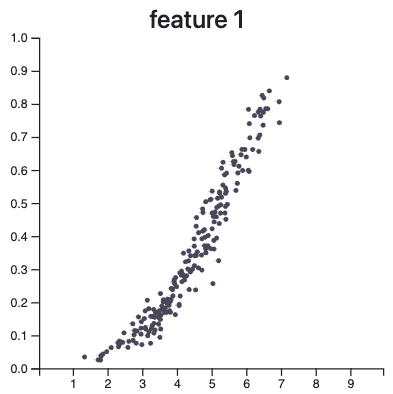
Local PDP
ICE plot
Contribution (β)
Sensitivity
analysis
Repeat
x
ŷ
β
x
β
How?
Pre-existing techniques as elementary building blocks.
Prediction (ŷ)
Local PDP
ICE plot
Contribution (β)
LCV plot
Sensitivity
analysis
Sensitivity
analysis
Repeat
x
ŷ
β
x
β
How?
Pre-existing techniques as elementary building blocks.
Prediction (ŷ)
Local PDP
ICE plot
Contribution (β)
LCV plot
GCV plot
Sensitivity
analysis
Sensitivity
analysis
Repeat
Repeat
x
ŷ
β
x
β

BACKUP
Pre-existing techniques as elementary building blocks.
[2] Goldstein, A., et al. "Peeking inside the black box: Visualizing statistical learning with plots of individual conditional expectation." Journal of Computational and Graphical Statistics, 2015.
[3] Ribeiro, M. T., et. al. ""Why should i trust you?" Explaining the predictions of any classifier." Proceedings of the 22nd ACM SIGKDD, 2016.
[1] Friedman, J. H. "Greedy function approximation: a gradient boosting machine." Annals of statistics, 2001.
Prediction
Local PDP
ICE plot
Contribution
LCV plot
GCV plot
Sensitivity
analysis
Sensitivity
analysis
Repeat
Repeat
x
ŷ
Contribution-Value plots
An exemplary data model exploration
VINCI 2020 (backup, not done)
By iamdecode


