Allianz visualization Challenge
04/10/2017
Giacomo Debidda
Cool... but wrong!

book_genres.tsv
| Satire | Romance | Drama | ... | |
| Satire | 3798 | 505 | 19 | ... |
| Romance | 505 | 65243 | 1572 | ... |
| Drama | 19 | 1572 | 3557 | ... |
| ... | ... | ... | ... | ... |
HTML
<!DOCTYPE html>
<html lang="en">
  <head>
    <meta charset="utf-8">
    <meta http-equiv="x-ua-compatible" content="ie=edge">
    <title>Data Visualization Challenge</title>
    <meta name="viewport" content="width=device-width, initial-scale=1.0">
    <!-- CSS bundle injected here by html-webpack-plugin -->
  <link rel="stylesheet"
        href="home.370bb5cb3969b9610455.bundle.css?3ca15c1ae9444dabc9a4">
  </head>
  <body>
    <div id="static-bar-chart"></div>
    <div id="dynamic-bar-chart"></div>
    <div id="comparison-chart"></div>
    <!-- JS bundles injected here by html-webpack-plugin -->
  <script type="text/javascript"
          src="commons.e0ffa94b1f6f4891ea2c.bundle.js?3ca15c1ae9444dabc9a4">
  </script>
  <script type="text/javascript"
          src="home.370bb5cb3969b9610455.bundle.js?3ca15c1ae9444dabc9a4">
  </script>
  </body>
</html>
Scaffolding
const computeLayout = (outerWidth, outerHeight, margin) => {
  const width = outerWidth - margin.left - margin.right;
  const height = outerHeight - margin.top - margin.bottom;
  return {
    width,
    height,
    margin,
  };
};

const createComponent = (nodeId, outerWidth = 1200, outerHeight = 600,
  margin = { top: 10, right: 10, bottom: 10, left: 10 }) => {
  const selection = d3.select(nodeId);
  const { width, height } = computeLayout(outerWidth, outerHeight, margin);

  const container = selection
    .append('div')
    .attr('class', 'container')
    .attr('width', width + margin.left + margin.right)
    .attr('height', height + margin.top + margin.bottom);

  const svg = container.append('svg')
    .attr('width', width + margin.left + margin.right)
    .attr('height', height + margin.top + margin.bottom);

  const chart = svg.append('g')
    .attr('transform', `translate(${margin.left}, ${margin.top})`);

  const coords = {
    width,
    height,
  };

  // not shown: header, footer, tooltip, defs

  const viz = {
    chart,
    coords,
    header,
    footer,
    tooltip,
  };
  return viz;
};

module.exports = {
  createComponent,
};
Prepare the DOM
let selectedGenre = 'Science fiction'; // it will change dynamically
const zScale = d3.scaleOrdinal(d3.schemeCategory20);
const outerWidth = 1300;
const outerHeight = 600;
const margin = { top: 0, right: 30, bottom: 20, left: 250 };

const staticBarChartViz = createComponent('#static-bar-chart',
  outerWidth, outerHeight, margin);

const dynamicBarChartViz = createComponent('#dynamic-bar-chart',
  outerWidth, outerHeight, margin);

const comparisonChartViz = createComponent('#comparison-chart',
  outerWidth, outerHeight, margin);

const drawStaticBarChart = (viz, dataset, genre) => {
  // first of all, get all the d3 selections we'll need
  const header = viz.header;
  const footer = viz.footer;
  const chart = viz.chart;
  const coords = viz.coords;
  const tooltip = viz.tooltip;

  // code that draws the static bar chart
};
Data
import * as d3 from 'd3';
const createComponent = require('./layout_manager').createComponent;
require('../sass/main.sass');
{
  // code for data visualizations here...
  const rowFunction = (d) => {
    /* there is no relationship between the number of books of a given genre,
    and the number of books of other genres (e.g. a single person could buy 1
    Satire book and: 10 Science Fiction books + 2 Drama books, etc...) */
    const genre = d[''];
    const obj = {
      genre,
    };
    const entries = Object.entries(d).filter(e => e[0] !== '');
    entries.forEach((e) => {
      const otherGenre = e[0];
      const numBooks = +e[1];
      obj[otherGenre] = numBooks;
    });
    return obj;
  };
  d3.tsv('../data/book_genres.tsv', rowFunction, (error, dataset) => {
    if (error) throw error;
    drawStaticBarChart(staticBarChartViz, dataset);
    drawDynamicBarChart(dynamicBarChartViz, dataset, selectedGenre);
    drawComparisonChart(comparisonChartViz, dataset, selectedGenre);
  });
}
Comparison Chart

SVG Pattern
<defs>
  <pattern id="diagonal-stripe-3" patternUnits="userSpaceOnUse"
           width="10" height="10">
    <image xmlns:xlink="base64 image here..."
           x="0" y="0" width="10" height="10">
    </image>
  </pattern>
  <pattern id="hash4_4" patternUnits="userSpaceOnUse"
           width="8" height="8" patternTransform="rotate(60)">
    <rect width="4" height="8" transform="translate(0,0)">
    </rect>
  </pattern>
</defs>
<rect class="ratioLeft"
x="506.2221212788406"
y="484"
width="3.777878721159425"
height="19"
style="fill: url("#hash4_4");
opacity: 0.75;">
</rect>SVG Pattern

<pattern id="diagonal-stripe-3" patternUnits="userSpaceOnUse" width="10" height="10">
  <image xmlns:xlink="base64 image here..." x="0" y="0" width="10" height="10">
  </image>
</pattern>
<defs>
const defs = svg.append('defs');

const patternImage = defs
  .append('pattern')
  .attr('id', 'diagonal-stripe-3')
  .attr('patternUnits', 'userSpaceOnUse')
  .attr('width', 10)
  .attr('height', 10)
  .append('image')
  .attr('xlink:href', 'base64 image here...')
  .attr('x', 0)
  .attr('y', 0)
  .attr('width', 10)
  .attr('height', 10);

const pattern = defs
  .append('pattern')
  .attr('id', 'hash4_4')
  .attr('patternUnits', 'userSpaceOnUse')
  .attr('width', 8)
  .attr('height', 8)
  .attr('patternTransform', 'rotate(60)')
  .append('rect')
  .attr('width', 4)
  .attr('height', 8)
  .attr('transform', 'translate(0,0)');
Good Stuff
Thanks!

Bonus: all JS code
import * as d3 from 'd3';
const createComponent = require('./layout_manager').createComponent;
require('../sass/main.sass');
{
let selectedGenre = 'Science fiction'; // it will change dynamically
const zScale = d3.scaleOrdinal(d3.schemeCategory20);
const outerWidth = 1300;
const outerHeight = 600;
const margin = { top: 0, right: 30, bottom: 20, left: 250 };
/* A visualization is an Object which contains a header, a footer, the chart, its coordinates
and a tooltip. We don't need to have the data ready to insert the visualization in the DOM */
// TODO: think about appending the axes in createComponent, instead of creating them here.
const staticBarChartViz = createComponent('#static-bar-chart', outerWidth, outerHeight, margin);
const staticBarChartXAxis = staticBarChartViz.chart
.append('g')
.attr('class', 'axis axis--x')
.attr('transform', `translate(0, ${staticBarChartViz.coords.height})`);
const staticBarChartYAxis = staticBarChartViz.chart
.append('g')
.attr('class', 'axis axis--y');
const dynamicBarChartViz = createComponent(
'#dynamic-bar-chart', outerWidth, outerHeight, margin);
const dynamicBarChartXAxis = dynamicBarChartViz.chart
.append('g')
.attr('class', 'axis axis--x')
.attr('transform', `translate(0, ${dynamicBarChartViz.coords.height})`);
const dynamicBarChartYAxis = dynamicBarChartViz.chart
.append('g')
.attr('class', 'axis axis--y');
const comparisonChartViz = createComponent(
'#comparison-chart', outerWidth, outerHeight, margin);
const comparisonChartXAxisLeft = comparisonChartViz.chart
.append('g')
.attr('class', 'axis axis--x')
.attr('transform', `translate(0, ${comparisonChartViz.coords.height})`);
const comparisonChartXAxisRight = comparisonChartViz.chart
.append('g')
.attr('class', 'axis axis--x')
.attr('transform',
`translate(${comparisonChartViz.coords.width / 2}, ${comparisonChartViz.coords.height})`);
const comparisonChartYAxis = comparisonChartViz.chart
.append('g')
.attr('class', 'axis axis--y');
const drawDynamicBarChart = (viz, dataset, genre) => {
const header = viz.header;
const footer = viz.footer;
const chart = viz.chart;
const coords = viz.coords;
const tooltip = viz.tooltip;
const obj = dataset.filter(d => d.genre === genre)[0];
const entries = Object.entries(obj).filter(d => d[0] !== 'genre' && d[0] !== genre);
const data = entries.map(d => ({ genre: d[0], customers: d[1] }));
data.sort((a, b) => d3.ascending(a.customers, b.customers));
const genres = data.map(d => d.genre);
const genre1 = genres[genres.length - 1];
const genre2 = genres[genres.length - 2];
const genre3 = genres[genres.length - 3];
const mouseover = (d) => {
const htmlTooltip = `<span>${d.genre}</span><br><span>${d.customers}</span>`;
tooltip.html(htmlTooltip)
.style('left', `${d3.event.layerX}px`)
.style('top', `${(d3.event.layerY - 10)}px`);
};
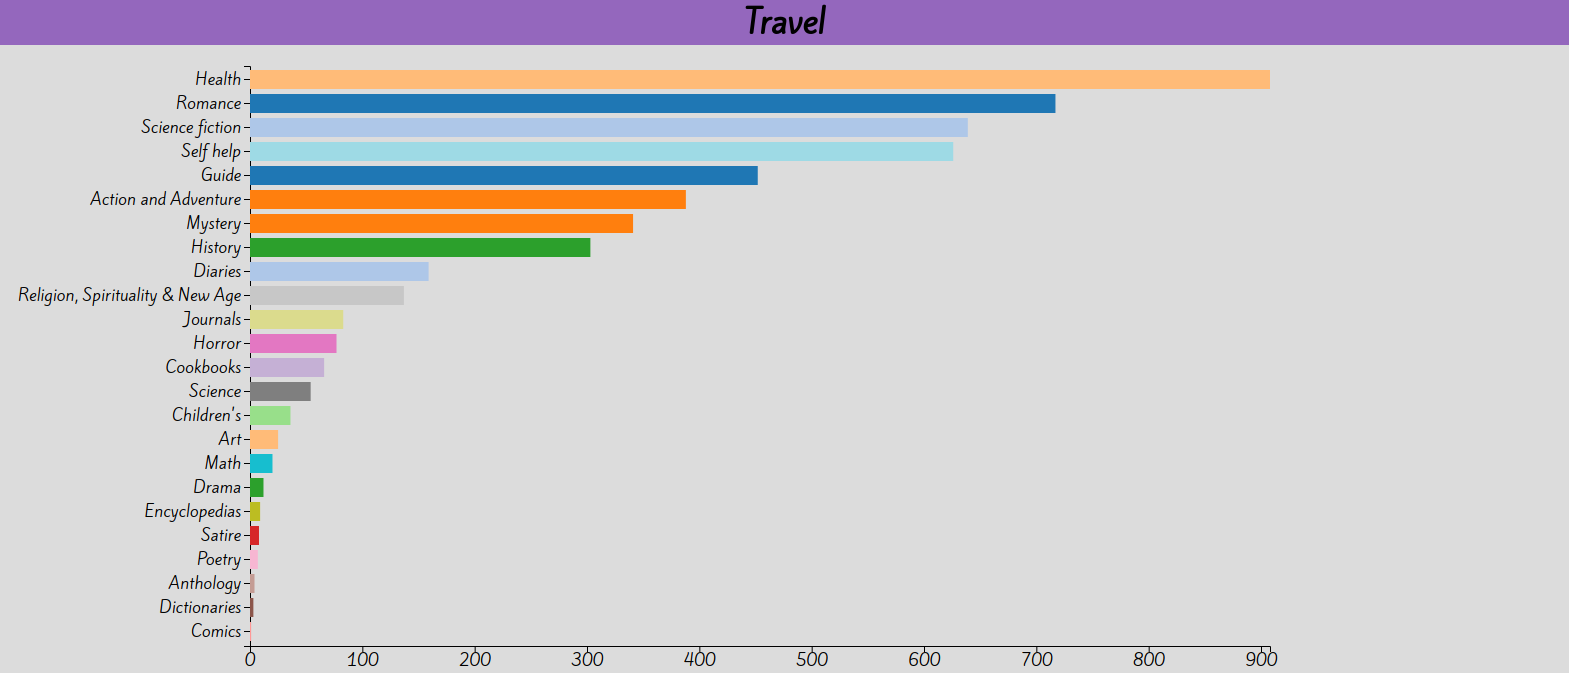
header
.style('background-color', zScale(genre))
.select('h1')
.text(`${genre}`);
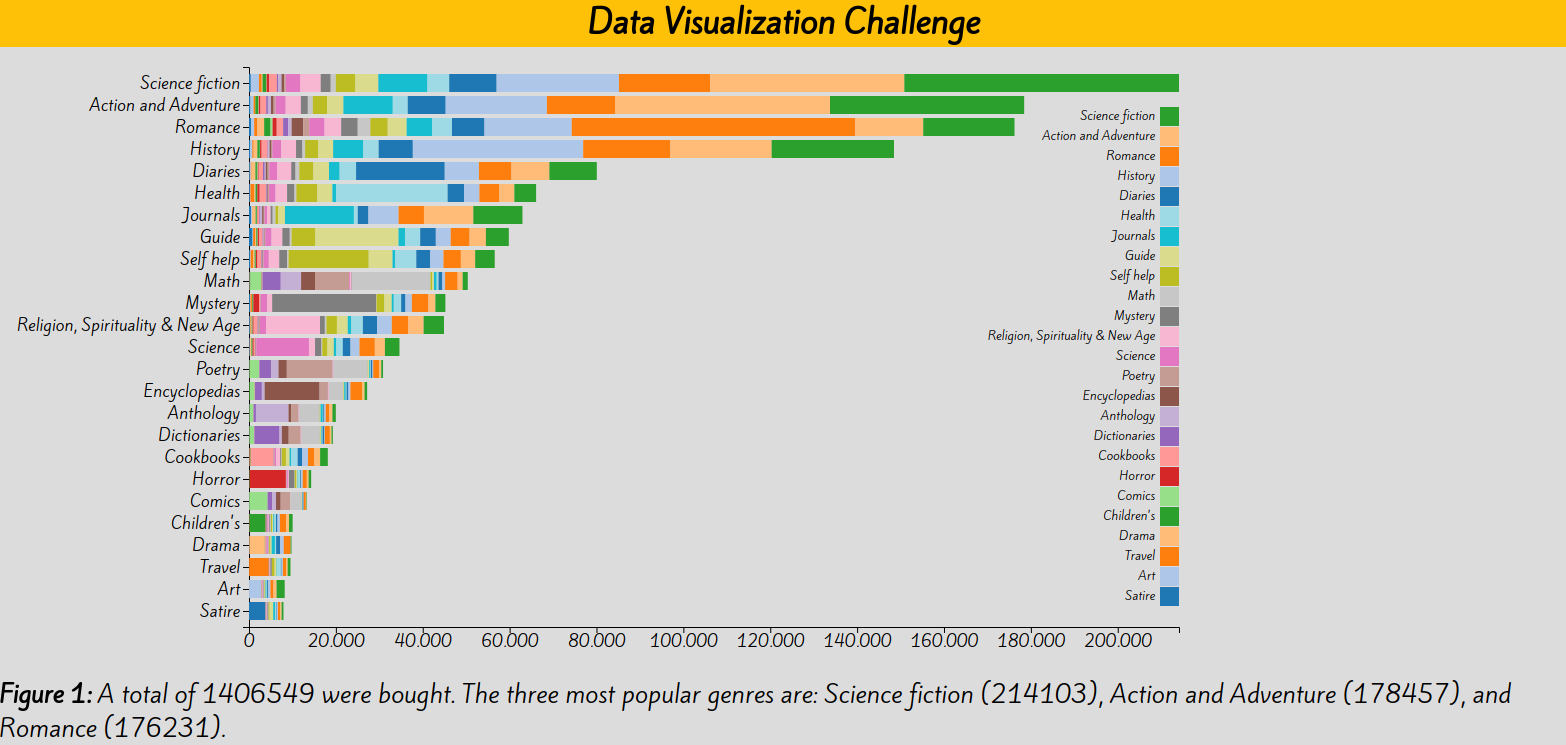
const spanFigure = '<span><strong>Figure 1: </strong></span>';
const spanGenre = `<span style="color: ${zScale(genre)};"><strong>${genre}</strong></span>`;
const span1 = `<span style="color: ${zScale(genre1)};"><strong>${genre1}</strong></span>`;
const span2 = `<span style="color: ${zScale(genre2)};"><strong>${genre2}</strong></span>`;
const span3 = `<span style="color: ${zScale(genre3)};"><strong>${genre3}</strong></span>`;
const htmlFooter = `${spanFigure}${obj[obj.genre]} customers bought at least 1 ${spanGenre} book.<br>
These customers also like ${span1}, ${span2} and ${span3}.`;
footer.select('p').html(htmlFooter);
const xScale = d3.scaleLinear()
.domain([0, d3.max(data.map(d => d.customers))])
.range([0, coords.width]);
const yScale = d3.scaleBand()
.domain(genres)
.range([coords.height, 0])
.round(true)
.paddingInner(0.2); // space between bars (it's a ratio)
const xAxis = d3.axisBottom()
.scale(xScale);
const yAxis = d3.axisLeft()
.scale(yScale);
dynamicBarChartXAxis
.call(xAxis);
dynamicBarChartYAxis
.call(yAxis);
const rects = chart.selectAll('rect')
.data(data);
// enter + update section (merge is new in D3 v4)
rects
.enter()
.append('rect')
.merge(rects)
.attr('x', 0)
.attr('y', d => yScale(d.genre))
.attr('width', d => xScale(d.customers))
.attr('height', yScale.bandwidth())
.style('fill', d => zScale(d.genre))
.on('mouseover', mouseover)
.on('mouseout', () => tooltip.transition().duration(500).style('opacity', 0));
};
const drawComparisonChart = (viz, dataset, genre) => {
const header = viz.header;
const footer = viz.footer;
const chart = viz.chart;
const coords = viz.coords;
const tooltip = viz.tooltip;
header
.style('background-color', zScale(genre))
.select('h1')
.text(`${genre} across all genres`);
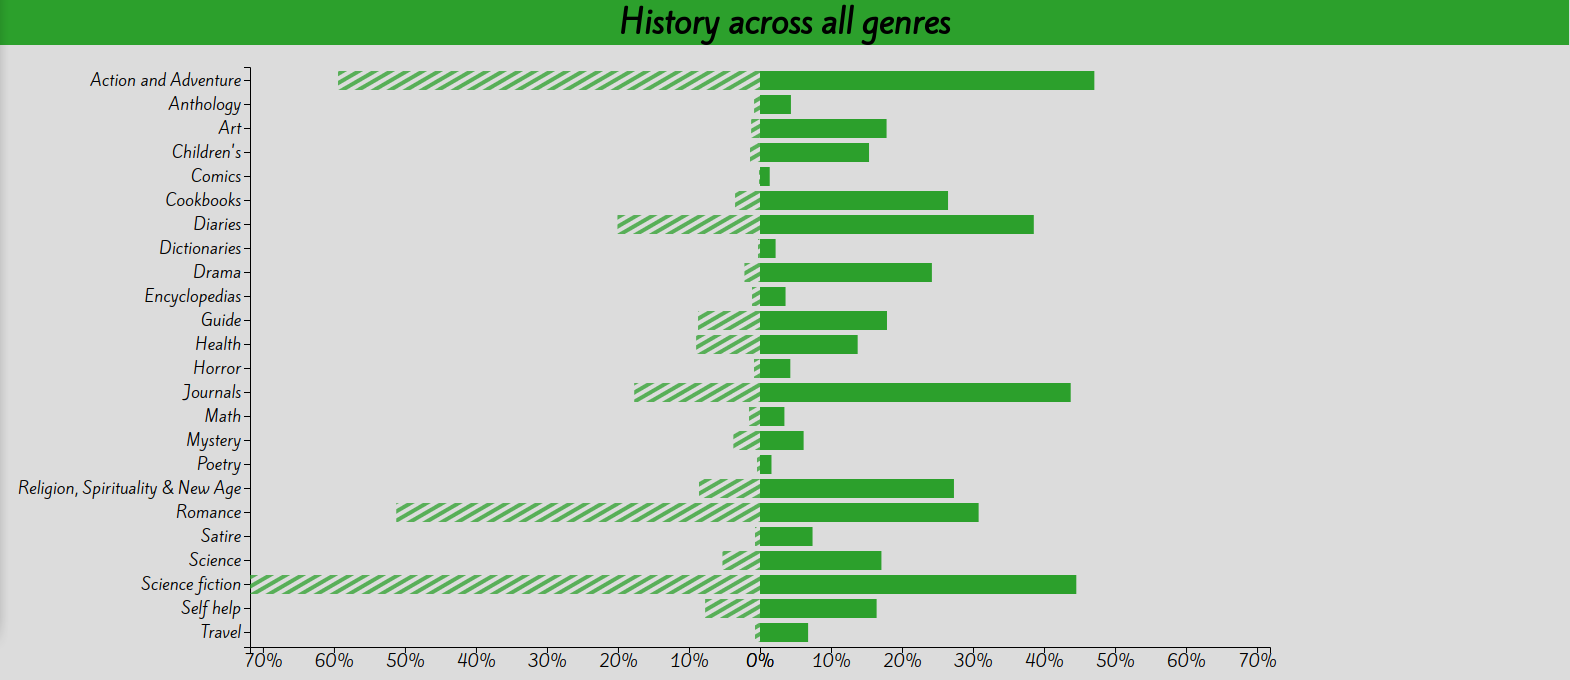
const spanFigure = '<span><strong>Figure 2: </strong></span>';
const spanGenre = `<span style="color: ${zScale(genre)};"><strong>${genre}</strong></span>`;
const htmlFooter = `<p>${spanFigure}Comparative analysis of ${spanGenre} across all genres.<br>
On the left, percentage of customers that, given that they bough (at least) 1 ${spanGenre}
book, bought (at least) 1 book of the genre indicated on the Y axis.<br>
On the right, percentage of customers that, given that they bough (at least) 1 book of the
genre indicated on the Y axis, bought (at least) 1 ${spanGenre} book.</p>`;
footer.select('p').html(htmlFooter);
const objGenre = dataset.filter(d => d.genre === genre)[0];
const objectsOtherGenres = dataset.filter(d => d.genre !== genre);
const genres = objectsOtherGenres.map(d => d.genre);
/*
'genre' is the genre we are interested in analyzing (e.g. Art) across all genres.
'otherGenre' is the current genre we are comparing with 'genre'.
E.g. Art is 'genre', and 'otherGenre' is 'Science'.
We are interested in 2 ratios (or percentages):
1) ratioRight: % of customers who bought at least 1 'genre' book (e.g. Art), GIVEN that
they bought at least one 'otherGenre' book (e.g. Science);
2) ratioLeft: % of customers who bought at least 1 'otherGenre' book (e.g. Science), GIVEN
that they bought at least one 'genre' book (e.g. Art).
*/
const data = genres.map((otherGenre) => {
const objOtherGenre = dataset.filter(d => d.genre === otherGenre)[0];
const ratioRight = objOtherGenre[genre] / objOtherGenre[otherGenre];
const ratioLeft = objGenre[otherGenre] / objGenre[genre];
return {
genre: otherGenre,
ratioRight,
ratioLeft,
};
});
// sort alphabetically (in place)
genres.sort((a, b) => d3.descending(a, b));
const mouseoverRight = (d) => {
tooltip.transition().duration(200).style('opacity', 0.9);
const html = `${d3.format('.0%')(d.ratioRight)} customers who bought a ${d.genre} book,
bought a ${genre} book too`;
tooltip.html(html)
.style('left', `${d3.event.layerX}px`)
.style('top', `${(d3.event.layerY - 10)}px`);
};
const mouseoverLeft = (d) => {
tooltip.transition().duration(200).style('opacity', 0.9);
const html = `${d3.format('.0%')(d.ratioLeft)} customers who bought a ${genre} book, bought
a ${d.genre} book too`;
tooltip.html(html)
.style('left', `${d3.event.layerX}px`)
.style('top', `${(d3.event.layerY - 10)}px`);
};
const maxPercentage = d3.max(
[d3.max(data.map(d => d.ratioLeft)), d3.max(data.map(d => d.ratioRight))]);
const xScaleLeft = d3.scaleLinear()
.domain([0, maxPercentage])
.range([coords.width / 2, 0]);
const xScaleRight = d3.scaleLinear()
.domain([maxPercentage, 0])
.range([coords.width / 2, 0]);
const yScale = d3.scaleBand()
.domain(genres)
.range([coords.height, 0])
.round(true)
.paddingInner(0.2); // space between bars (it's a ratio)
const xAxisLeft = d3.axisBottom()
.scale(xScaleLeft)
.ticks(6)
.tickFormat(d3.format('.0%'));
const xAxisRight = d3.axisBottom()
.scale(xScaleRight)
.ticks(6)
.tickFormat(d3.format('.0%'));
const yAxis = d3.axisLeft()
.scale(yScale);
comparisonChartXAxisLeft
.call(xAxisLeft);
comparisonChartXAxisRight
.call(xAxisRight);
comparisonChartYAxis
.call(yAxis);
// TODO: currently I inject #hash4_4 in every svg (so there are duplicate ids in the DOM)
// const pattern = d3.select('#comparison-chart').select('#hash4_4')
// update the fill color of the pattern dynamically
d3.select('#hash4_4').style('fill', zScale(genre));
const rectsLeft = chart.selectAll('.ratioLeft')
.data(data);
// no need for a key function in the data binding (not sure why)
// .data(data, d => d.genre);
// .data(data, function (d) { return d.genre; });
rectsLeft
.enter()
.append('rect')
.attr('class', 'ratioLeft')
.merge(rectsLeft)
.order(rectsLeft)
.attr('x', d => xScaleLeft(d.ratioLeft))
.attr('y', d => yScale(d.genre))
.attr('width', d => (coords.width / 2) - xScaleLeft(d.ratioLeft))
.attr('height', yScale.bandwidth())
// .style('stroke', d => zScale(d.genre))
// .style('stroke', d => zScale(d.genre))
// .style('fill', 'url(#diagonal-stripe-3)')
.style('fill', 'url(#hash4_4)')
.style('opacity', 0.75)
.on('mouseover', mouseoverLeft)
.on('mouseout', () => tooltip.transition().duration(500).style('opacity', 0));
// the exit section is required
rectsLeft.exit().remove();
const rectsRight = chart.selectAll('.ratioRight')
.data(data);
rectsRight
.enter()
.append('rect')
.attr('class', 'ratioRight')
.merge(rectsRight)
.attr('x', coords.width / 2)
.attr('y', d => yScale(d.genre))
.attr('width', d => xScaleRight(d.ratioRight))
.attr('height', yScale.bandwidth())
.style('fill', zScale(genre))
.on('mouseover', mouseoverRight)
.on('mouseout', () => tooltip.transition().duration(500).style('opacity', 0));
// the exit section is required
rectsRight.exit().remove();
};
const drawStaticBarChart = (viz, dataset) => {
const header = viz.header;
const footer = viz.footer;
const chart = viz.chart;
const coords = viz.coords;
const tooltip = viz.tooltip;
const data = dataset.map((d) => {
const obj = { genre: d.genre, customers: d[d.genre] };
return obj;
});
// sort in ascending order (in place). The bar at the bottom (lowest value) is drawn first
// data.sort((a, b) => a.customers - b.customers);
data.sort((a, b) => d3.ascending(a.customers, b.customers));
const genres = data.map(d => d.genre);
const genre1 = genres[genres.length - 1];
const genre2 = genres[genres.length - 2];
const genre3 = genres[genres.length - 3];
const mouseover = (d) => {
const htmlTooltip = `<span>${d.genre}</span><br><span>${d.customers}</span>`;
tooltip.html(htmlTooltip)
.style('left', `${d3.event.layerX}px`)
.style('top', `${(d3.event.layerY - 10)}px`);
selectedGenre = d.genre;
drawDynamicBarChart(dynamicBarChartViz, dataset, selectedGenre);
drawComparisonChart(comparisonChartViz, dataset, selectedGenre);
};
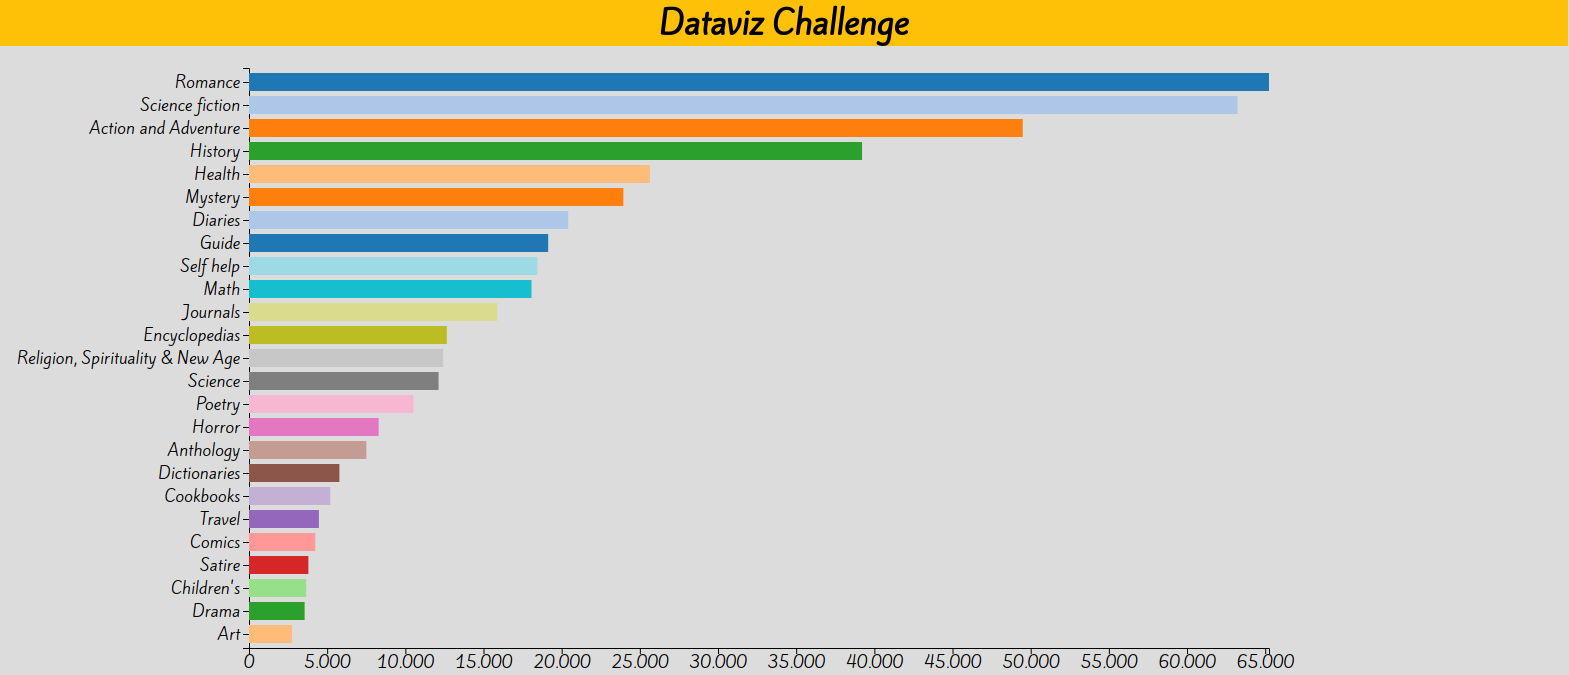
header.select('h1')
.text('Dataviz Challenge');
const spanFigure = '<span><strong>Figure 1: </strong></span>';
const span1 = `<span style="color: ${zScale(genre1)};"><strong>${genre1}</strong></span>`;
const span2 = `<span style="color: ${zScale(genre2)};"><strong>${genre2}</strong></span>`;
const span3 = `<span style="color: ${zScale(genre3)};"><strong>${genre3}</strong></span>`;
const htmlFooter = `${spanFigure}Customers who bought at least 1 book of these genres.<br>
The three most popular genres are: ${span1}, ${span2} and ${span3}.<br>
<em>Note: hover on the bars to update the visualizations below.</em>`;
footer.select('p').html(htmlFooter);
const xScale = d3.scaleLinear()
.domain([0, d3.max(data.map(d => d.customers))])
.range([0, coords.width]);
const yScale = d3.scaleBand()
.domain(genres)
.range([coords.height, 0])
.round(true)
.paddingInner(0.2);
const xAxis = d3.axisBottom()
.scale(xScale);
const yAxis = d3.axisLeft()
.scale(yScale);
staticBarChartXAxis
.call(xAxis);
staticBarChartYAxis
.call(yAxis);
const rects = chart.selectAll('rect')
.data(data);
// enter + update section (merge is new in D3 v4)
rects
.enter()
.append('rect')
.merge(rects)
.attr('x', 0)
.attr('y', d => yScale(d.genre))
.attr('width', d => xScale(d.customers))
.attr('height', yScale.bandwidth())
.style('fill', d => zScale(d.genre))
.on('mouseover', mouseover)
.on('mouseout', () => tooltip.transition().duration(500).style('opacity', 0));
};
const rowFunction = (d) => {
/* there is no relationship between the number of books of a given genre,
and the number of books of other genres (e.g. a single person could buy 1
Satire book and: 10 Science Fiction books + 2 Drama books, etc...) */
const genre = d[''];
const obj = {
genre,
};
const entries = Object.entries(d).filter(e => e[0] !== '');
entries.forEach((e) => {
const otherGenre = e[0];
const numBooks = +e[1];
obj[otherGenre] = numBooks;
});
return obj;
};
d3.tsv('../data/book_genres.tsv', rowFunction, (error, dataset) => {
if (error) throw error;
drawStaticBarChart(staticBarChartViz, dataset);
drawDynamicBarChart(dynamicBarChartViz, dataset, selectedGenre);
drawComparisonChart(comparisonChartViz, dataset, selectedGenre);
});
}Dataviz Challenge
By Giacomo Debidda


