Debugging

In the browser
using Google Chrome
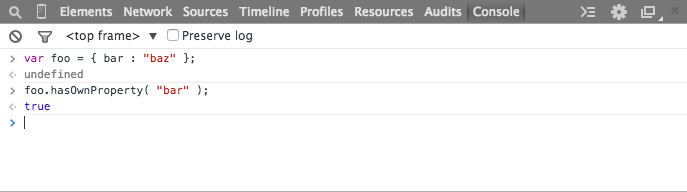
JavaScript console
REPL in Google Chrome
Breakpoints
stops execution and starts debugger tool
click on the gutter to the left of where you want to add a breakpoint
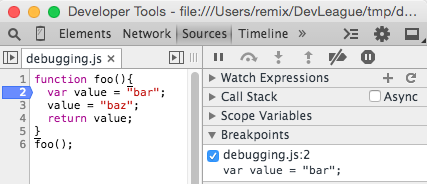
refresh the browser
debug()
debug( functionName );
>  function foo(){ return "bar"; }
<- undefined
>  debug(foo);
<- undefined
>  foo();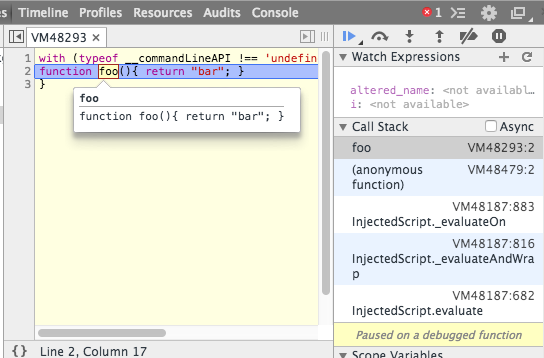
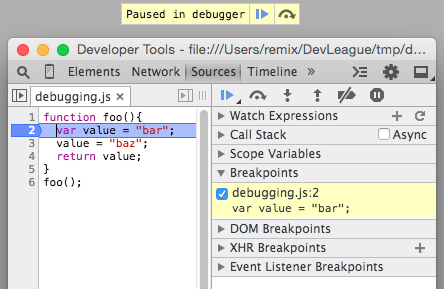
debugger;
pauses execution and begins the debugging session
function foo(){
  var value = "bar";
  debugger;
  value = "baz";
  return value;
}
foo();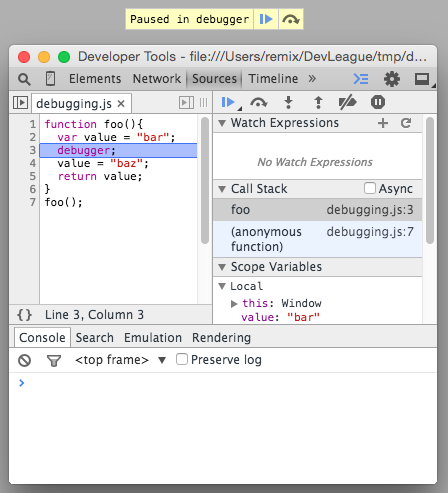
Debugging Console Controls
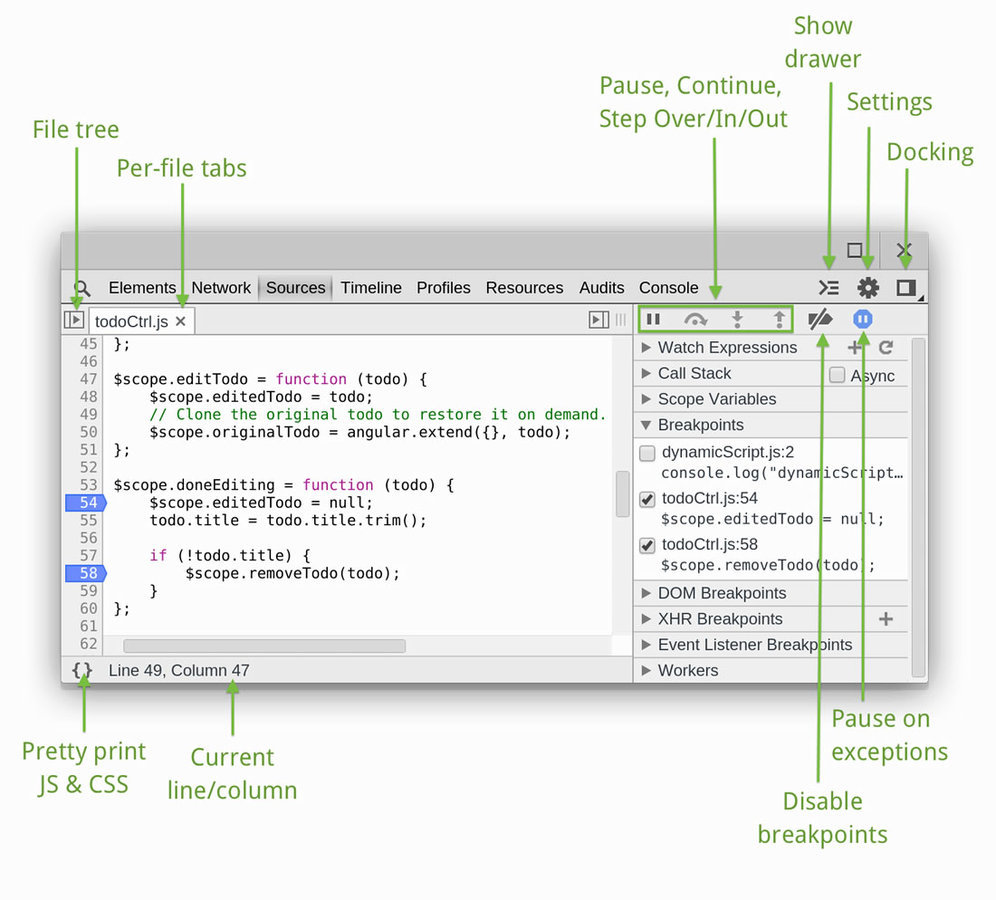
Stepping through
step by step execution
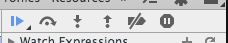
1 2 3 4 5 6
- Pause / Continue / Long continue
- Step Over
- Step In
- Step Out
- Disable Breakpoints
- Pause on Exceptions
Watch Expressions
displays the value of an expression while you step through
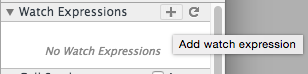
Click the [+] button to add a watch expression
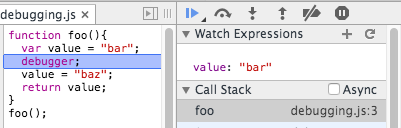
add the variable named value
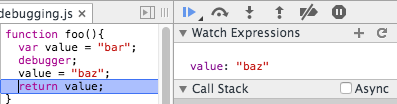
the value is updated while stepping through the program
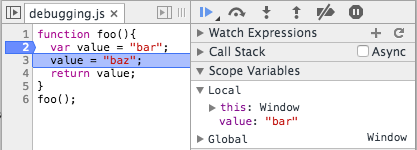
Scope Variables
displays what variables are visible in the current scope
deck
By Jason Sewell


