Using Global Metagenomes to Quantify PCR Primer Coverage and Integrating 3-Domain Amplicon Data with Models
Jesse McNichol1, Paul M. Berube2, Steven J. Biller2,3,
Sallie W. Chisholm2, Jed A. Fuhrman1
1University of Southern California
2Massachusetts Institute of Technology
3Wellesley College

-
Universal Ribosomal PCR Primers target the SSU rRNA of (almost) everything:
- Quantify the whole cellular community from A-Z (Archaea + Bacteria + Organelles + Protists + Zooplankton)
- 16S and 18S on same scale - ratios meaningful
- Low cost (~$8/sample, 200,000 sequences/ea)
- Amplicon sequence variant (ASV) methods allow intercomparison and mapping
Universal primers as a mapping tool
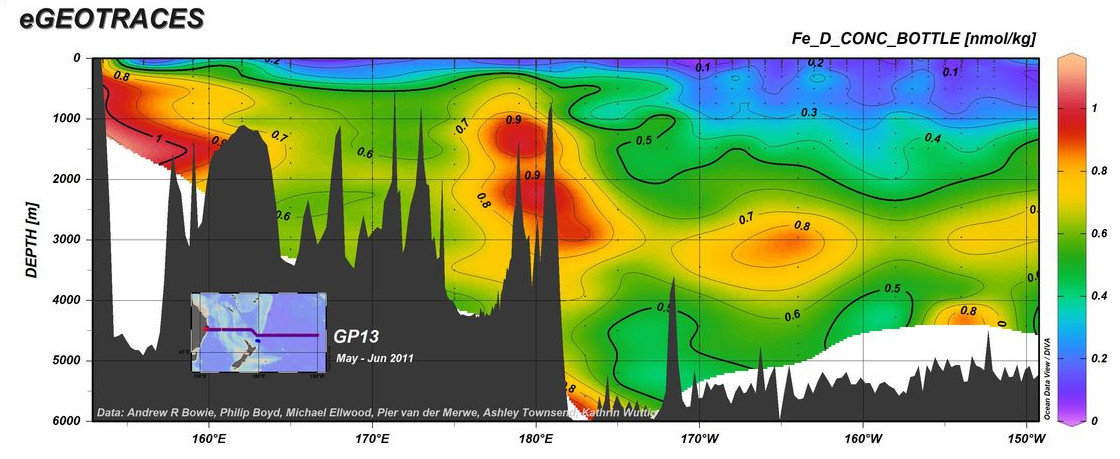
https://www.egeotraces.org/sections/GP13_Fe_D_CONC.html
-
Detailed protocols available on https://fuhrman-lab.github.io
- Lab protocol
-
in-silico workflow:
- Splits 16S and 18S automatically (analyzed separately)
- Denoises with DADA2/deblur in qiime2 => ASVs
- Splits data automatically into categories (e.g. chloroplasts)
- Step-by-step guide on protocols.io
Universal primers are easy to analyze!


Universal primers complement existing techniques

Universal primers complement existing techniques

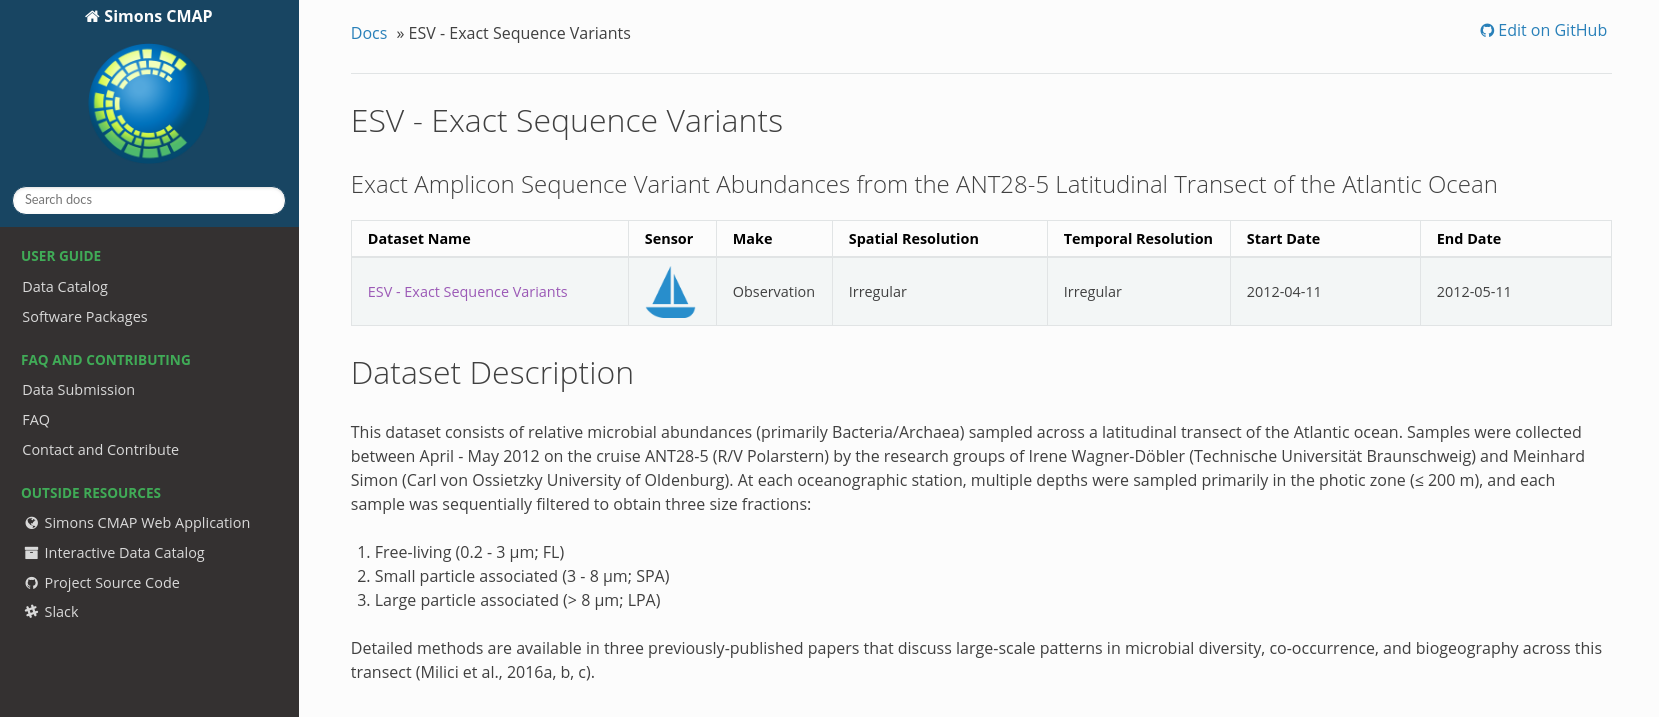
- Simons Collaborative Marine Atlas Project (cmap.readthedocs.io)
- Unify data retrieval and co-localization
- ASVs are stable, and make sense in database
Universal primers as a mapping tool - CMAP!

- Metagenomic validation of universal primer quantification and environmental coverage
- Use cases for universal primer data (with BioGEOTRACES data)
- Future work
Talk Outline
https://www.egeotraces.org/sections/GP13_Fe_D_CONC.html
Mock communities show PCR can be quantitative
True also for 18S mocks
biorxiv.org/content/
10.1101/866731v1


Similarly quantitative "in the wild"
Metagenome
abundances
(16S)
PCR amplicon
abundances (16S)
Similarly quantitative "in the wild"; 18S less so
Metagenome
abundances
(18S)
PCR amplicon
abundances (18S)

Similarly quantitative "in the wild"; 18S less so
Metagenome
abundances
(18S)

PCR amplicon
abundances (18S)
What about primer bias?

Inspired by this paper, we are using metagenomes to determine theoretical primer performance across ecosystems
MGPrimerEval : a reproducible snakemake pipeline
- Compares primers to unassembled MG reads
- Reproducible by conda/docker integration
- tinyurl.com/titus-workflow-philosophy
- github: tinyurl.com/MGPrimerEval
https://www.physalia-courses.org

Sorting, aligning, subsetting

Primer-MG comparisons, data summary

QC, SSU rRNA sifting, repeat removal
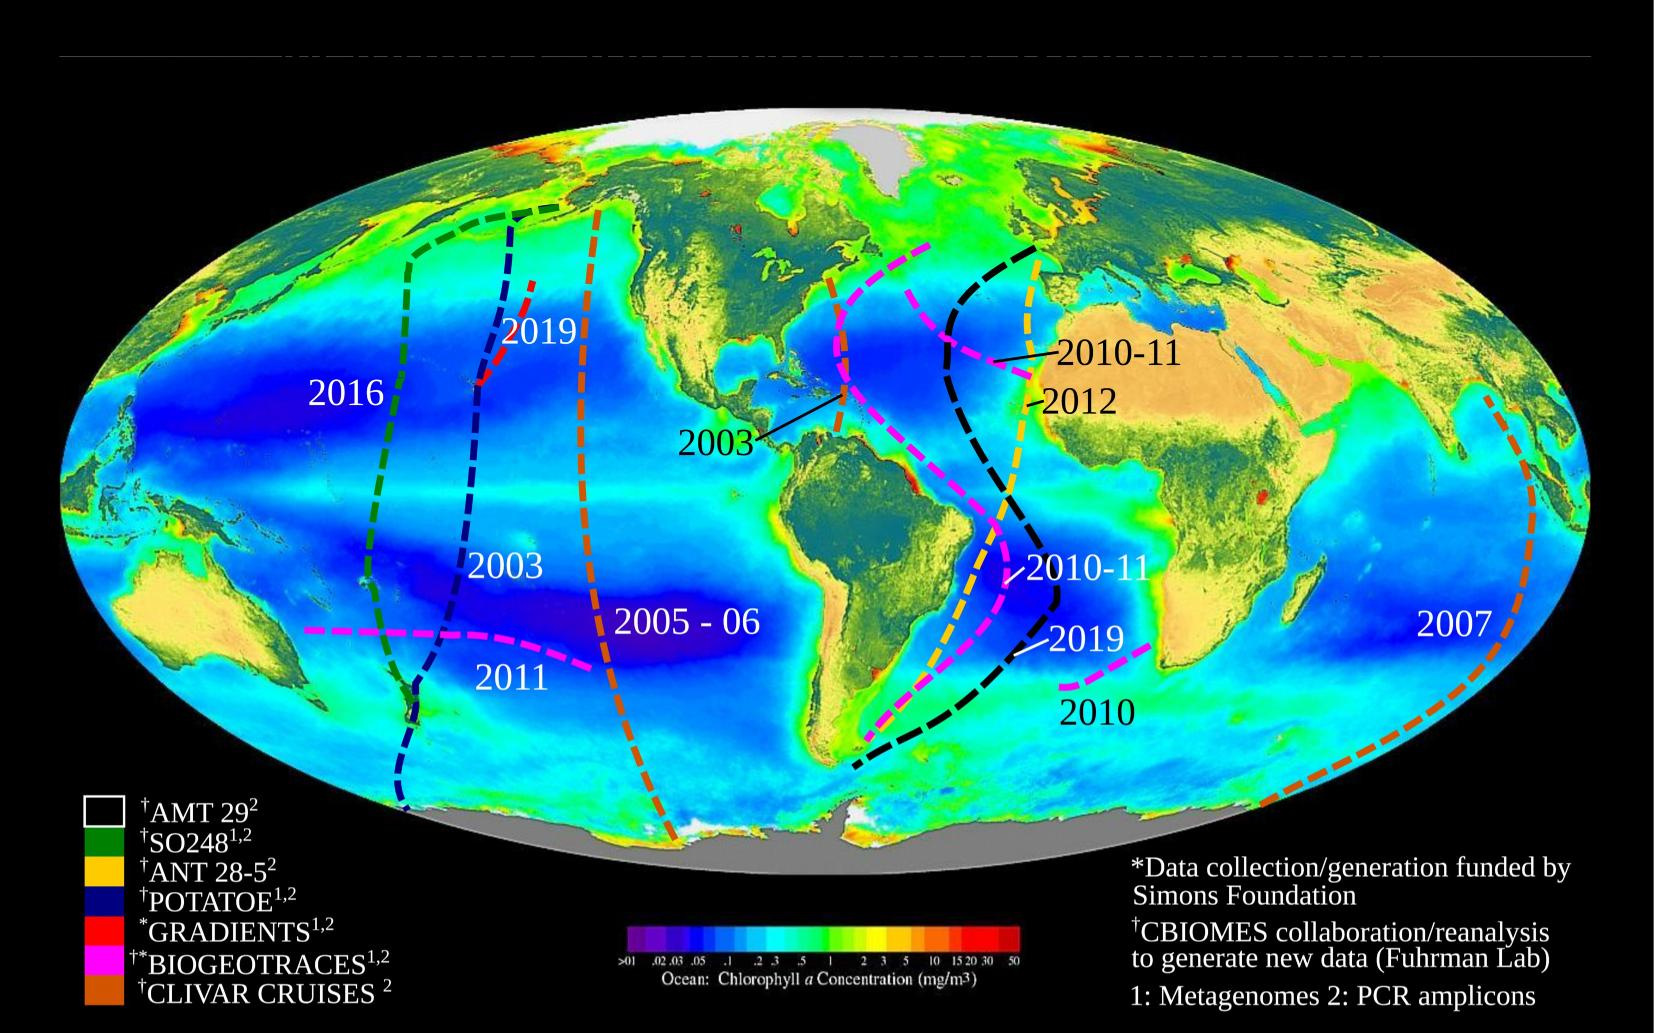
MGPrimerEval : datasets
-
TARA oceans (458), BioGEOTRACES (610), MBARI bloom MG (84), Malaspina FL/PA samples (58), SPOT/Catalina MG (8)
- Total = 1,218 metagenomes
- Globally distributed, mostly oxic, pelagic samples

Pesant et al., 2015

Sieradzki et al., 2019

Acinas et al., 2019

Nowinski et al., 2019

Biller et al., 2018
MGPrimerEval : predicted coverage (0-mismatch)

0.0 0.5 1.0
0.5 1.0
0.5 1.0
0.5 1.0
MGPrimerEval : conclusions
- 515Y/926R universal primers have best coverage overall
- Nearly 100% for 16S, ~90% for 18S
- 18S has similar coverage vs. Euk-specific primers
- Will provide accurate community profiles across pelagic ocean regions
- Some rare taxa have low coverage
- Nearly 100% for 16S, ~90% for 18S
- Some other primers have unexpectedly low coverage
- Improvements can be made to any primer to:
- Maximize overall coverage across diverse environments
- Optimize to a particular environment
Use cases: BioGEOTRACES amplicons


Will present new data from these transects
These are "whole water" samples (>0.2uM)
Universal primers + whole water samples =
comprehensive profile
NB: 18S usually small fraction of total
Will be a smaller % for amplicons
# of 18S sequences recovered will be limited for some regions

Most metagenomes have < 20% 18S
3. Use cases:
Resolution
- Are short amplicons (~373 bp) enough to resolve ecologically-relevant subgroups of Prochlorococcus?
Sensitivity (detection limit)
Modelling
Majority of ASVs consistent with genome phylogeny and associated with a particular ecotype
*Berube et al. eLife 2019;8:e41043.
3. Resolution: Prochlorococcus ASVs


ASV hits to clade
3. Resolution: Prochlorococcus ASVs

HLII clade ASV
Higher abundance in warmer waters

HLI clade ASV
Abundance increases as temperature drops
Both distributions consistent with physiological data from pure cultures and field data
3. Resolution: Prochlorococcus ASVs

Biller et al., 2015 Nat. Rev. Microbio.
3. Use cases:
Resolution
- Are short amplicons (~373 bp) enough to resolve ecologically-relevant subgroups of Prochlorococcus?
Sensitivity (detection limit)
- Can we sequence deeply enough to find rare, but biologically-relevant organisms like diazotrophs?
Modelling
3. Sensitivity: Diazotrophs
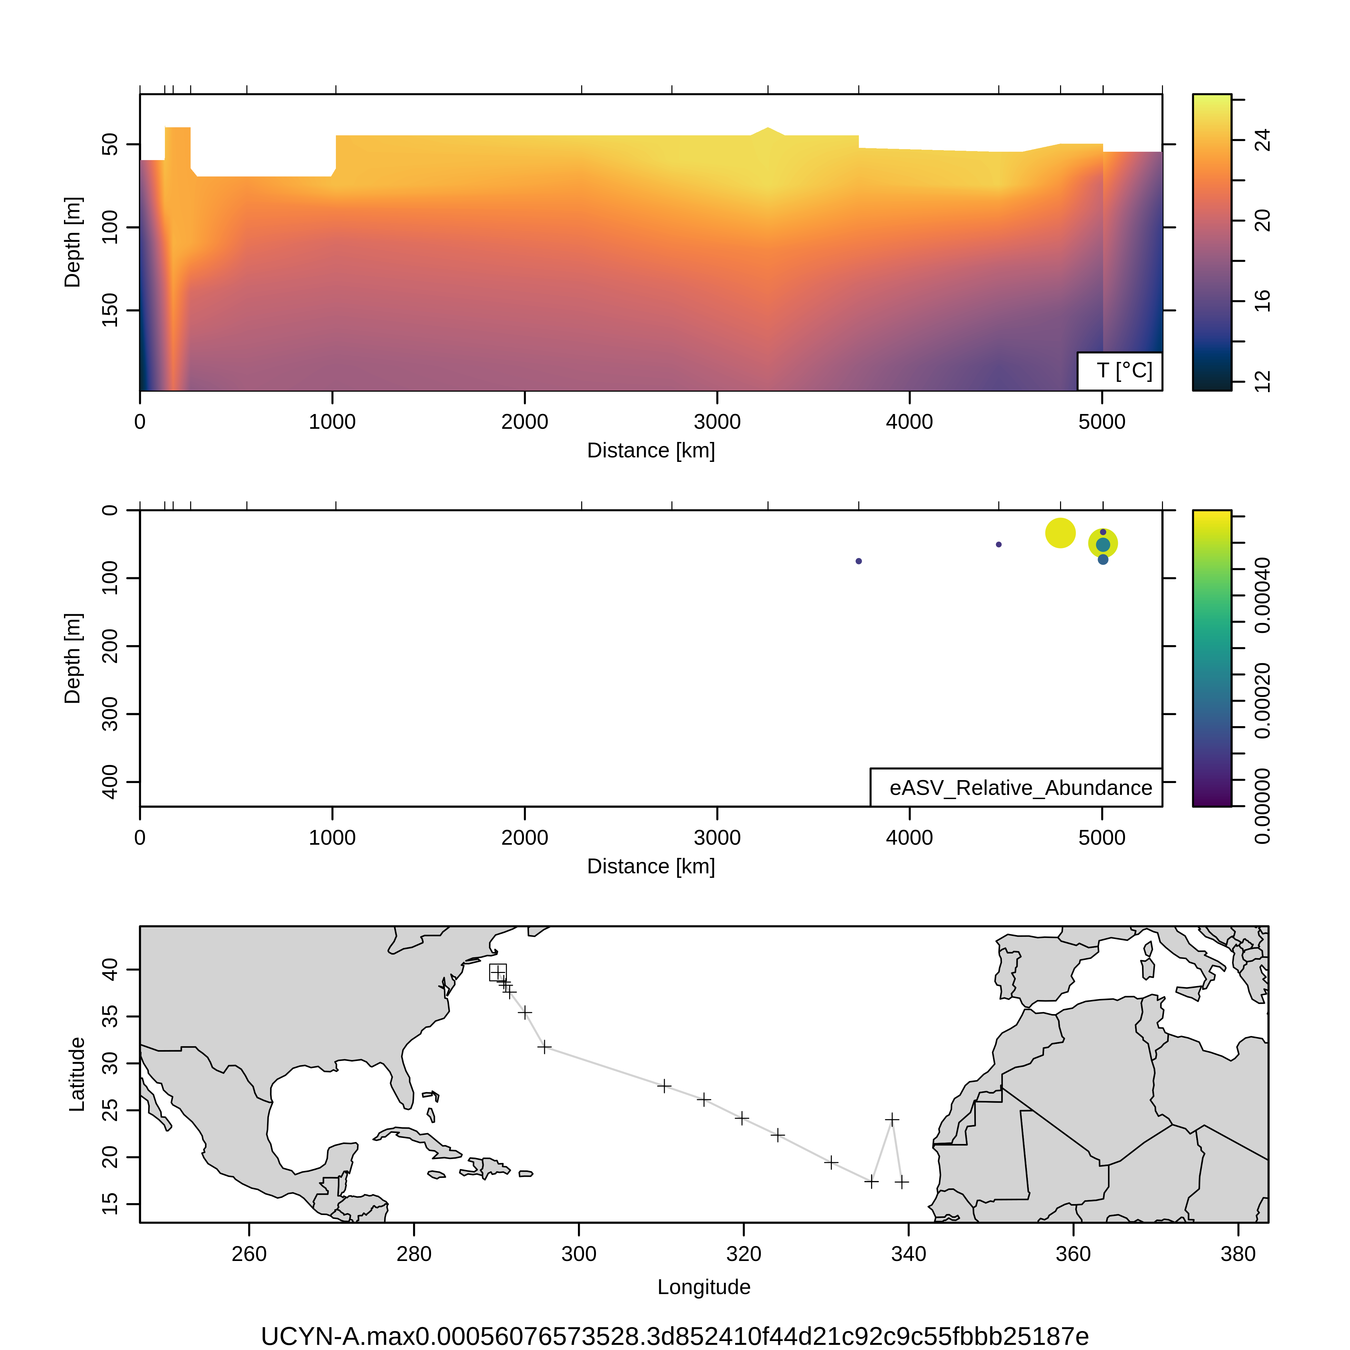
UCYN-A (diazotroph)
Braarudosphaera chloroplast (putative host)
1/2000
to
1/13,000
Zeroes meaningful
No UCYN-A observed out of
~50,000 reads
3. Sensitivity: Diazotrophs
UCYN-A (diazotroph)
Braarudosphaera chloroplast (putative host)

qPCR (nifH) data
3. Sensitivity: Diazotrophs
UCYN-A - Braarudosphaera correlation
UCYN-A (diazotroph)
Braarudosphaera chloroplast (putative host)

3. Use cases:
Resolution
- Are short amplicons (~373 bp) enough to resolve ecologically-relevant subgroups of Prochlorococcus?
Sensitivity (detection limit)
- Can we sequence deeply enough to find rare, but biologically-relevant organisms like diazotrophs?
Modelling
- How can data be used to improve modelling efforts?
3. Modelling: Rationale
- Microorganisms process up to 50% of PP
- Not yet included in trait-based models such as DARWIN
-
Amplicons can potentially constrain microorganism:
- Biogeography
- Depth distributions
- Use to inform and test modelling approaches?

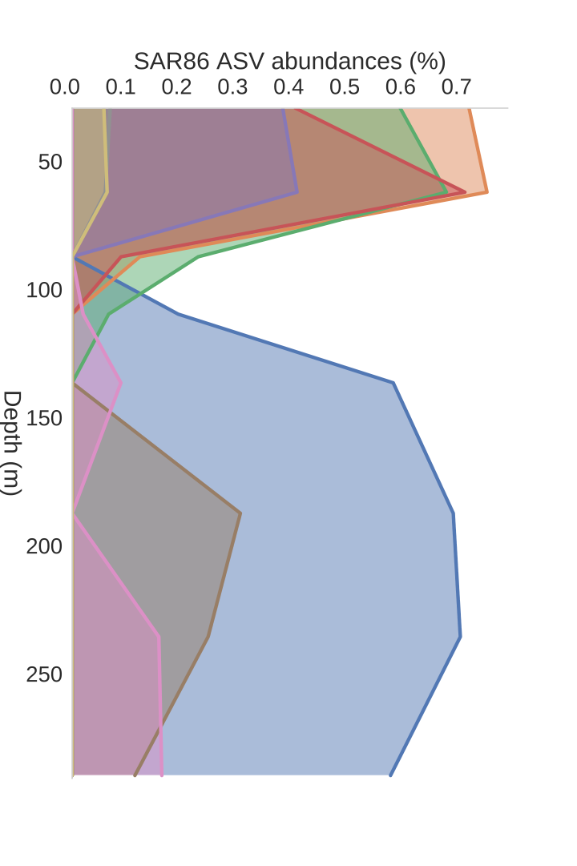
Depth profiles from KN204-stn3
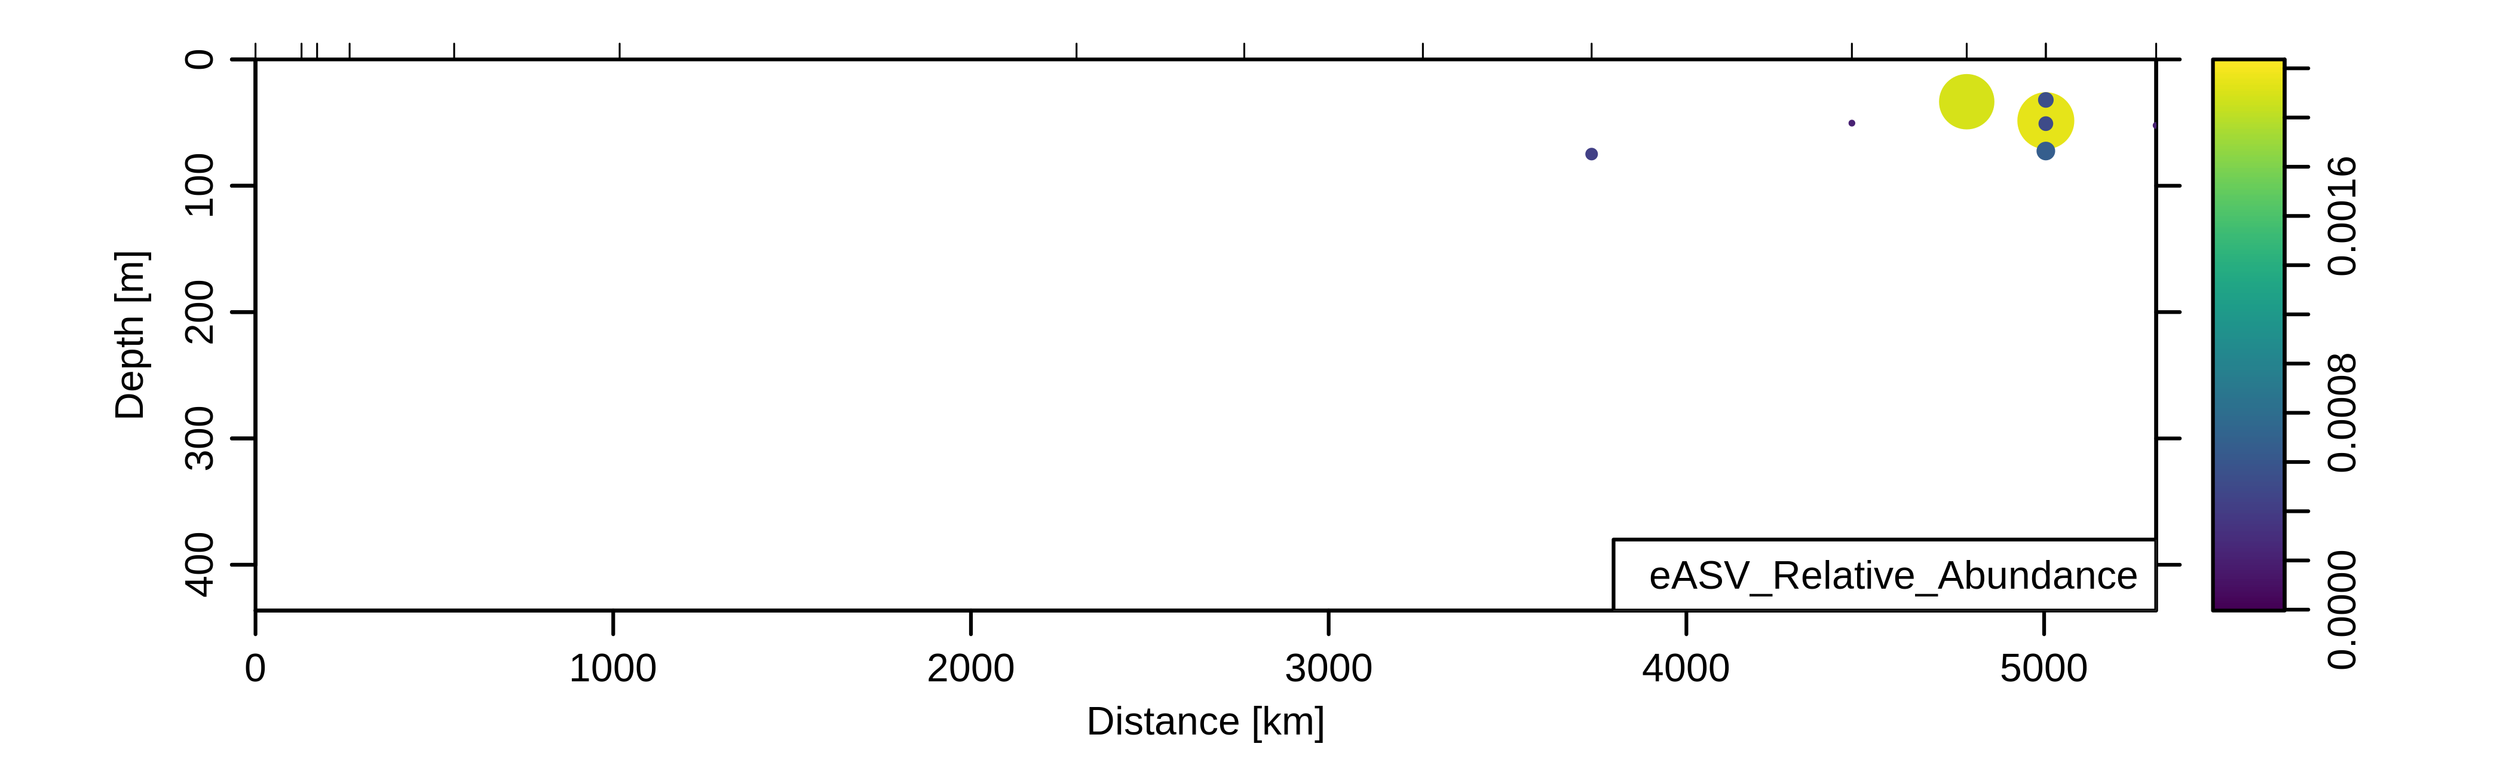
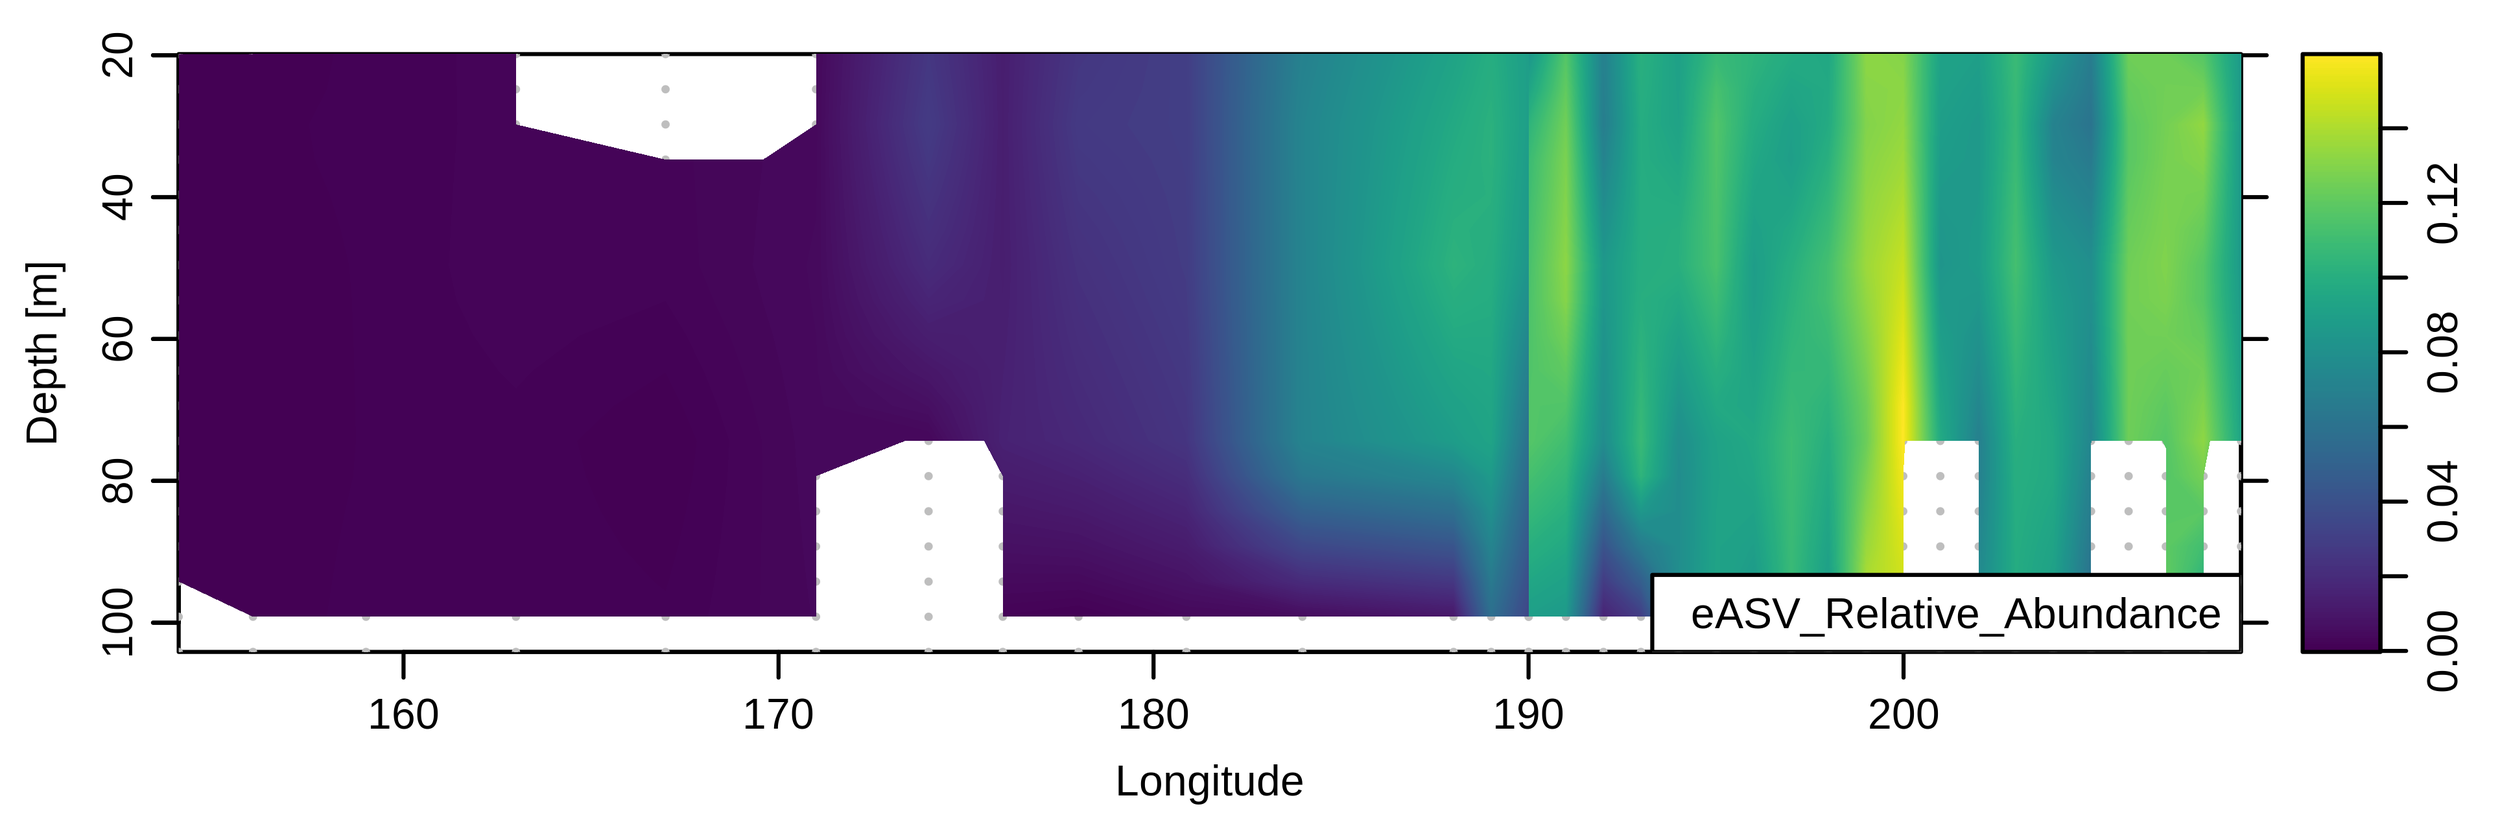
3. Modelling: ASV (~species) depth profiles
Marine actinobacterium
Extreme oligotroph
Very small size

SAR86, uncultured
Lipid/protein degrader?
Deep/shallow ecotypes?

Marine group II archaea
Also lipid protein/degrader?
Particle attached?

3. Modelling: Aggregated profiles


3. Modelling: Expanding ocean coverage
3. Modelling: Expanding ocean coverage
3. Modelling: Defining traits
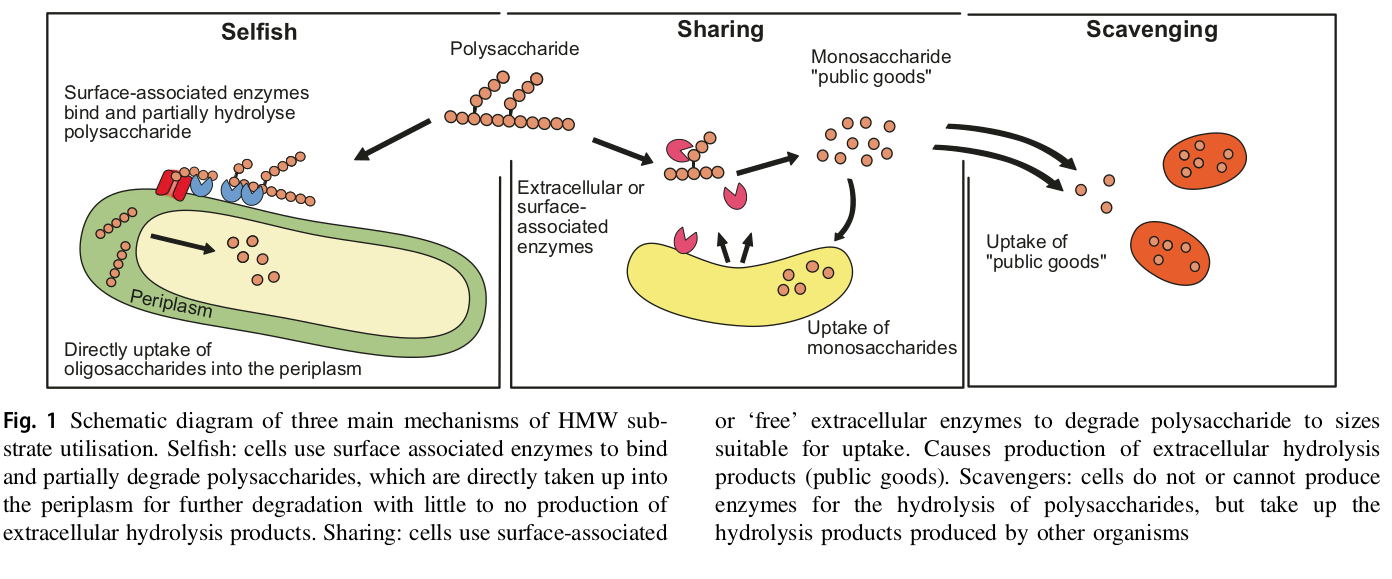
Reintjes et al., 2018, ISME doi.org/10.1038/s41396-018-0326-3

Flavobacteria
Alteromonas
SAR11
3. Modelling: Integrating different data types
Biogeography
(e.g. GA03)
Meta'omics (e.g. Iverson et al 2012, Pachiadaki et al., 2019)

Models (e.g. Emily Zakem's work on heterotrophs)
Conclusions: Universal Primers
-
Cost-effective tool to map whole cellular community from A-Z (Archaea + Bacteria + Organelles + Protists + Zooplankton)
- Chloroplast data more quantitative vs. 18S
- Can guide to where we want to concentrate more focused studies of same DNA (e.g. meta'omics)
- Straightforward to process and interpret
- Can provide guideposts for modelling efforts
https://www.egeotraces.org/sections/GP13_Fe_D_CONC.html
Acknowledgements
- Yi-Chun Yeh (for collaboration on amplicon analysis)
- Shengwei Hou (for help and inspiration on computational analyses)
- Clark Richards (for help with R "oce")
- Ken Youens-Clark (for help with C-microbe-MAP)
- Emily Zakem (for helping me understand modelling)
- Mike Lee (for help separating 16S and 18S in silico)
-
Fuhrman lab crew
- fuhrman-lab.github.io
- tinyurl.com/MGPrimerEval


% Eukaryotic amplicons
-
GP13 (mostly oligotrophic surface waters)
- AVG = 3.2% (range: ~1-28%)
- For 200,000 sequences = 6400 18S sequences (2000 - 56,000)
-
GA03 (mostly oligotrophic, more deep-sea sampling)
- AVG = 2.7% (range: 0.17-17%)
DADA2 vs deblur (ASVs vs. MG)

DADA2 vs deblur (ASV vs. ASV)

Scripps e-seminar
By jcmcnch
Scripps e-seminar
Zoom seminar to SIO community June 17th 2020


