DevTools
Tools & tricks

⚙️
Hello!
Im Jon Rojí
Frontend at Sngular
🦄 🖌️ 🍺

Disclaimer!
DETECT, TOOLS AND TIPS, NOT FIX


✏️ DOM & styles
▶️ Console Master
📂 Sources
✋ Debuggers & Breakpoints
🌐 Network
📈 Coverage
🧙♀️ Tools & tricks

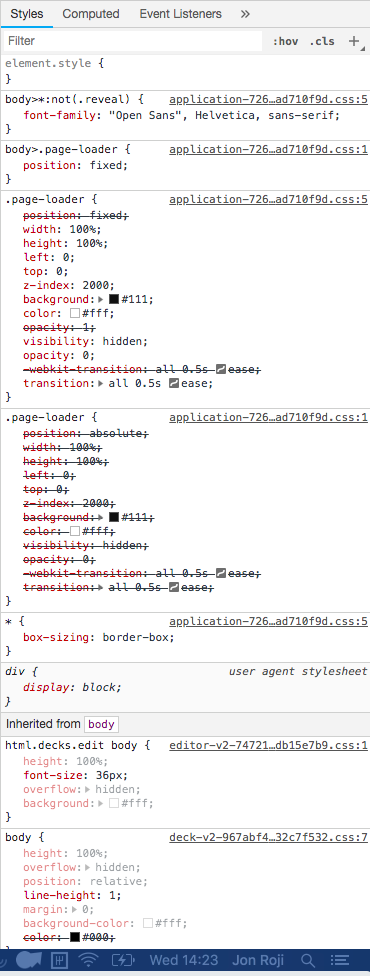
Elements
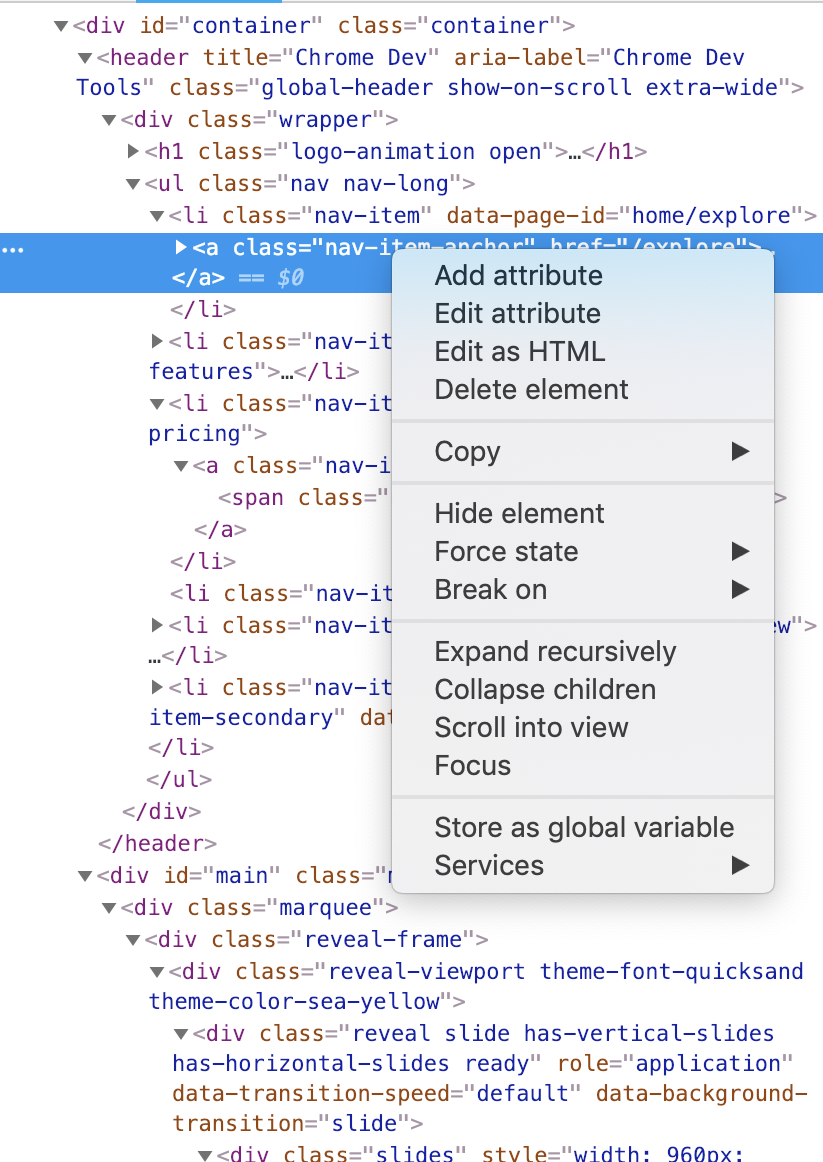


store the element as temp1 ... temp
copy css/xpath selectors
QA


element state modifier
element state modifier
classes toggle
element state modifier
classes toggle
class adition
hold to change the file
Deactivate Ancestors check in order to avoid info overflow
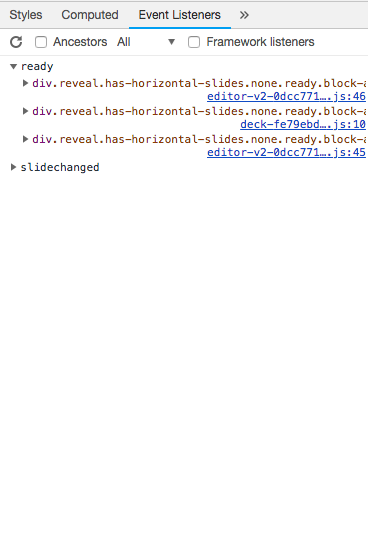
Event listeners of the element
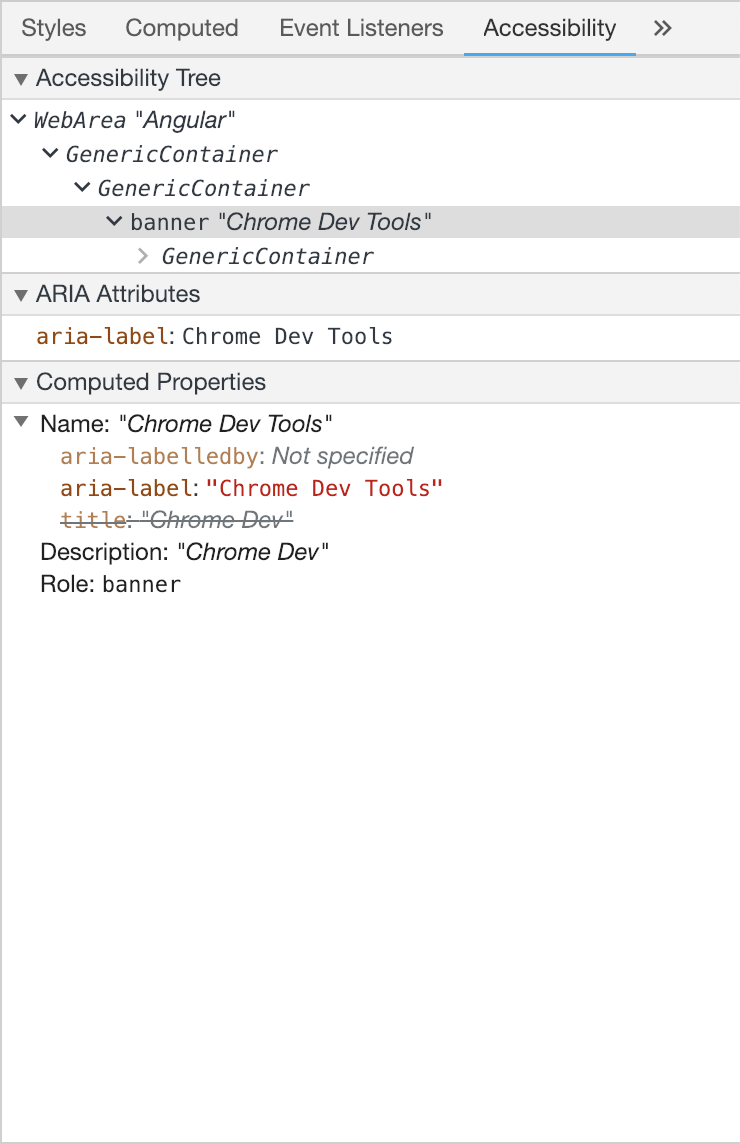
Accessibility
Check the role attribute in order to check what people expects from the element
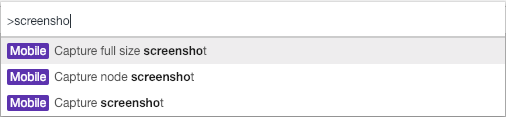
cmd + shift + P
Console
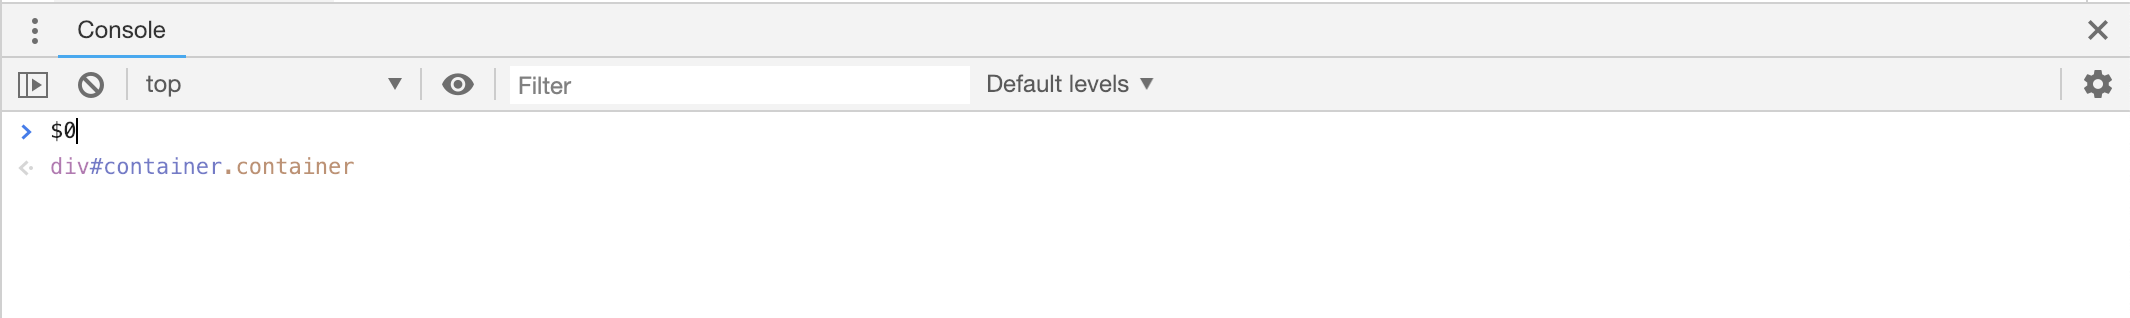
$0 - References the selected HTML element
Execution context from the debugger
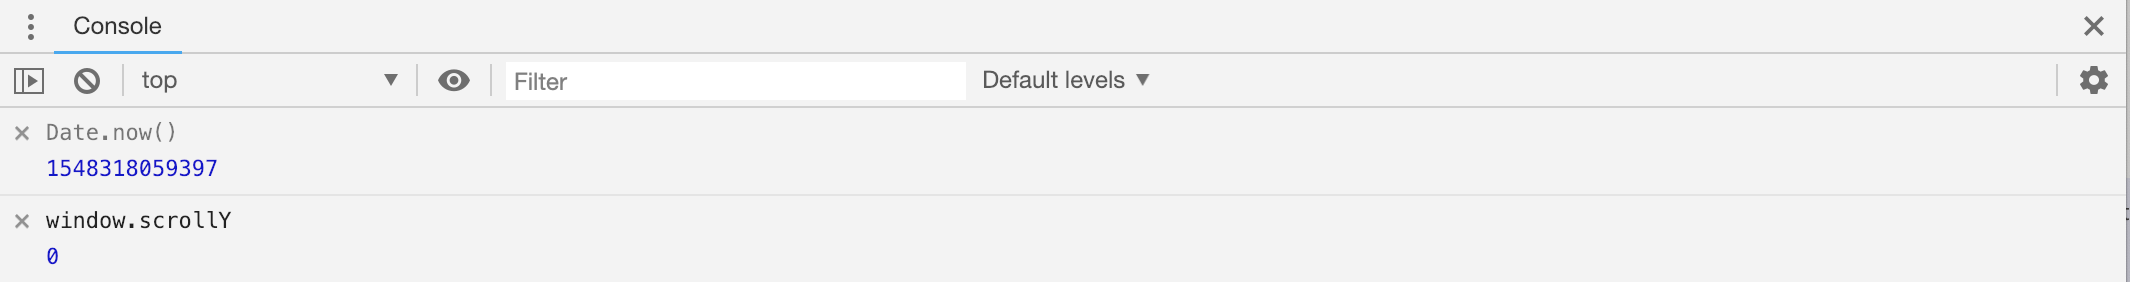
Live expressions!
JS statements that executes every 250ms

console.log({ myProp });
console.assert(NaN == NaN)
console.table([{a:1, b:2}, {a:2, b:3}]);
console.log("%cStop", "color:red;font-family:system-ui;font-size:4rem;-webkit-text-stroke: 1px black;font-weight:bold" );
Sources
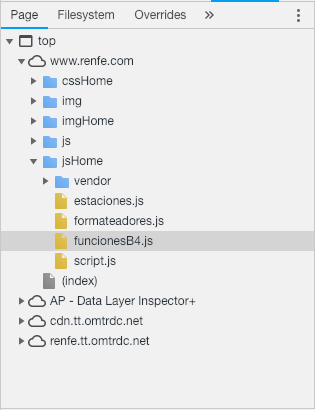
One of the most important and complex areas on DevTools
Show loaded files
Allow us to set breakpoints (not only on js)
Allow us to override entire files!
Blackbox scripts!
Sources

Use search tool

Show scope of the detected source
Page
Filesystem
We can link the served content with our files,
and save the edited content!
❤️ Great editing styles
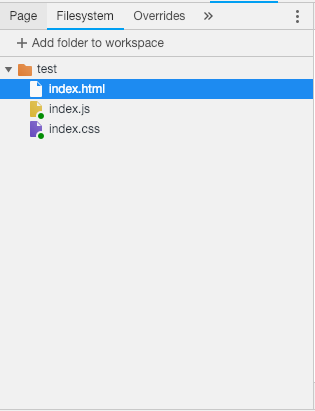
Look for the green point
❤️ Awesome for local development
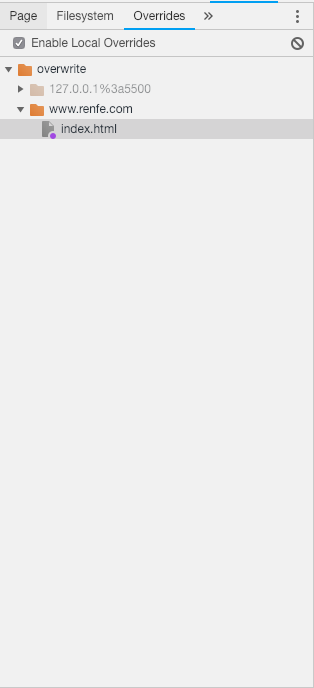
Overrides
We can replace a served file
with a custom and editable file!
- active Enable Local Overrides
- Select the file on network and save for override
❤️ Great for testing new solutions
Look for the purple point
❤️ Awesome for "before push" testing
Overrides
We can replace a served file
with a custom and editable file!
- active Enable Local Overrides
- Select the file on network and save for override
❤️ Great for testing new solutions
Look for the purple point
❤️ Awesome for "before push" testing

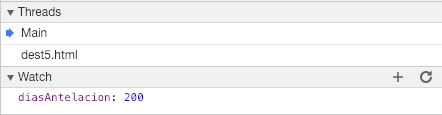
Threads & Watch
Threads
Useful working with web workers
Can pause both threads at the same time
Threads & Watch
Threads
Useful working with web workers
Can pause both threads at the same time
Watch
Show info about variables values
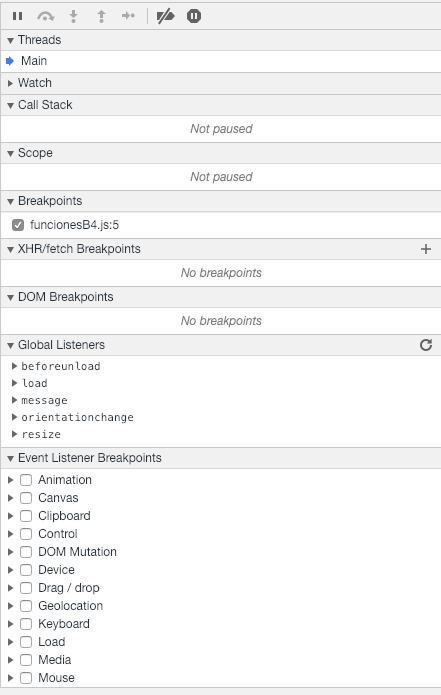
Breakpoints!
JS breakpoint
Stop JS execution on the selected line or debugger


Breakpoints!
Pause
Next statement
Jump into/out of function
Next statement (including functions)


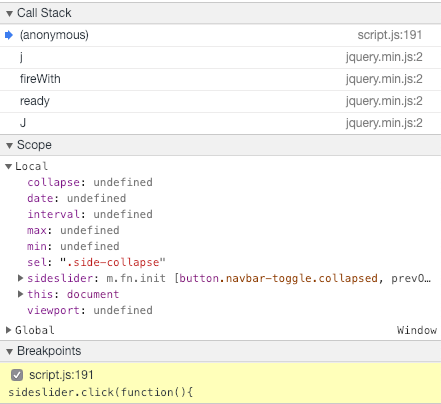
Breakpoints!
Call Stack
Show us all the functions called from the breakpoint
Blackbox the libraries
and frameworks!
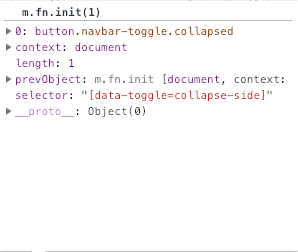
Scope
Show us the local and global context in the moment of the execution pause so we dont need to hover all props on the source file
Console context becomes the local!
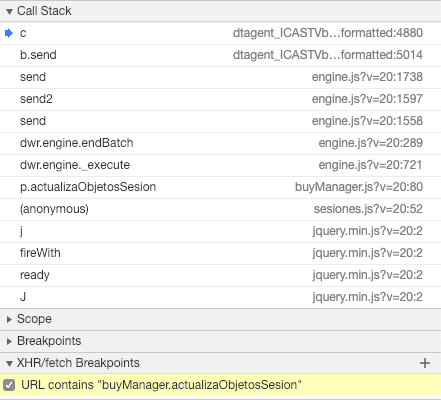
Breakpoints!
XHR Breakpoints
Type a url fragment to stop on xhr request
The Call Stack will show where the request is initiated, allowing us to navigate there
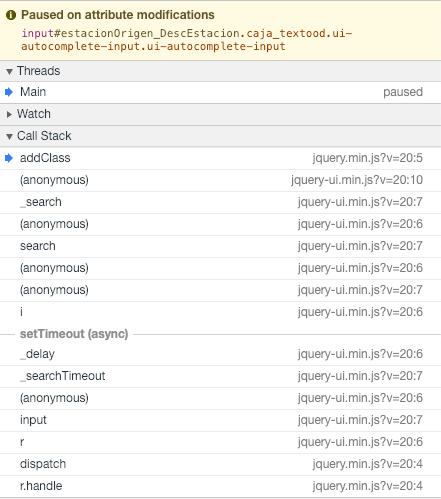
Breakpoints!
DOM elements Breakpoints
Select a HTML Element and select Break on
The Call Stack will show where the modification is requested, useful using events or toggling attributes
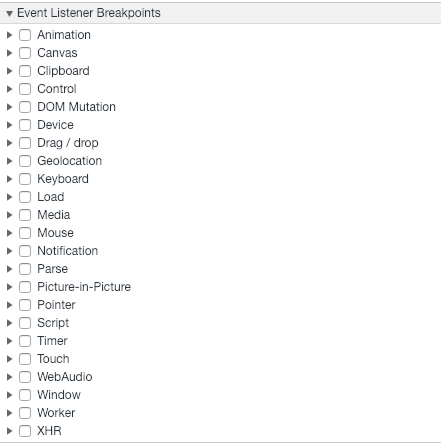
Breakpoints!
Event Listener Breakpoints
You can activate breakpoints for any kind of event, in order to analize where the application is listening for
You can see the Global listeners setted too
Network
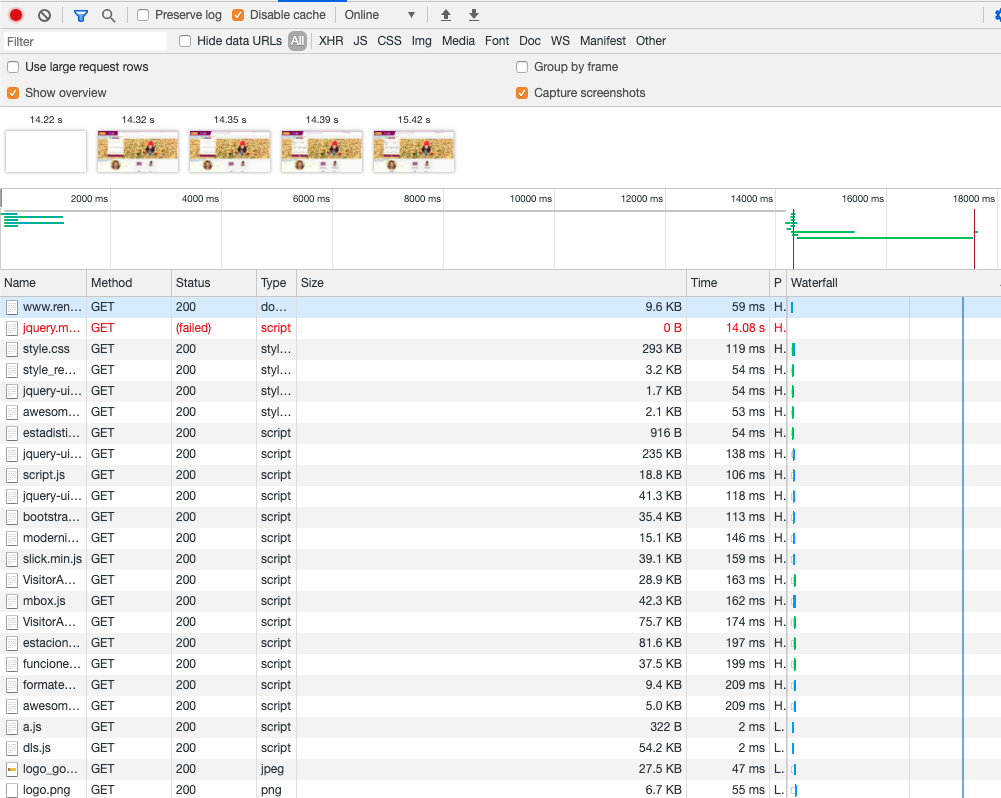
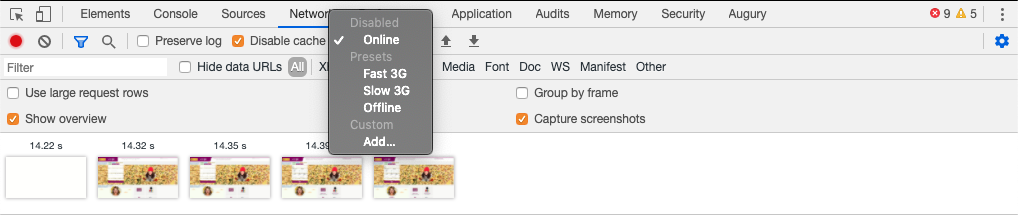
One of the best tools on DevTools
Allow us to limit the connection speed
Test like a 3g network or Offline (nice for PWA)
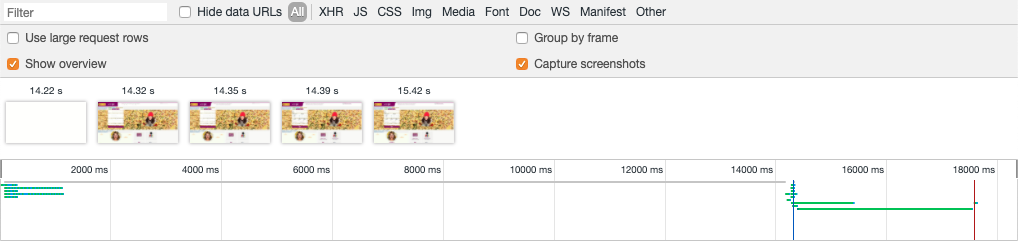
Great for look into the waterfall graph

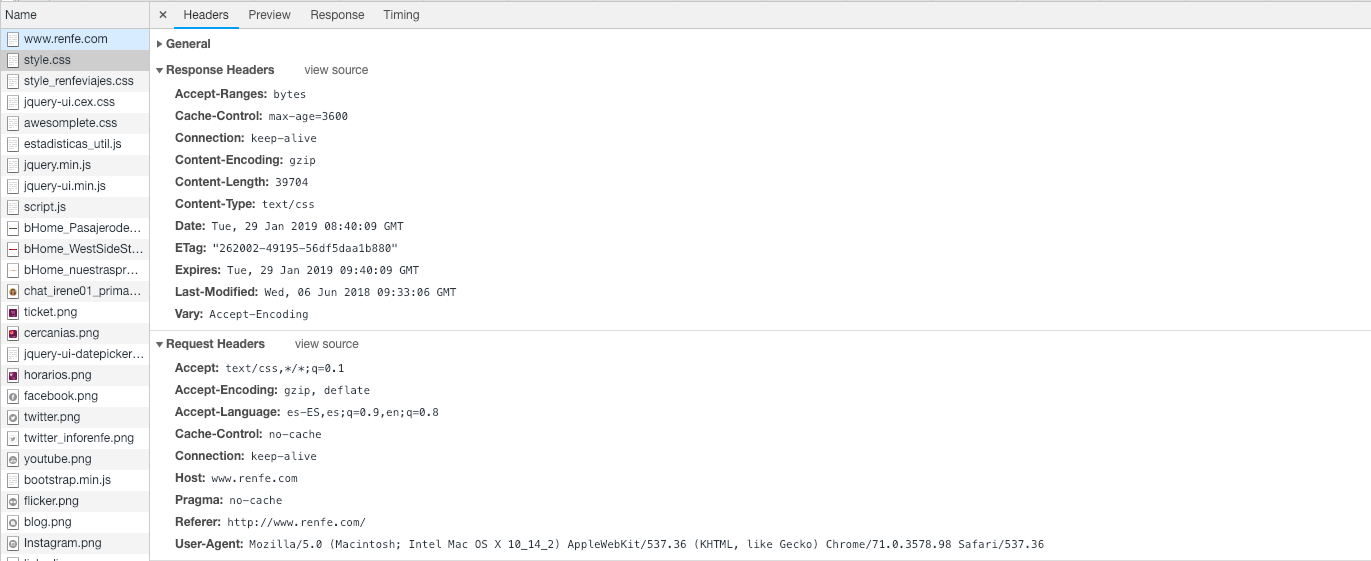
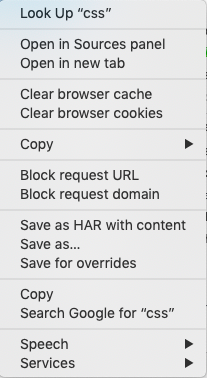
Block requests by URL or Domain
Allow us to check the web behaviour without the blocked resource
Save for overrides
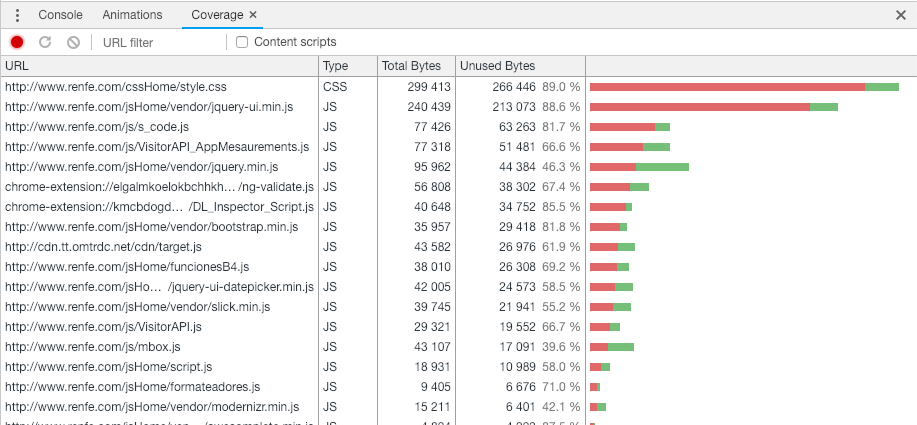
Magic
More tools > Coverage
(cmd + shift + p)
Check unused CSS & JS
Performance

The worse config, the better
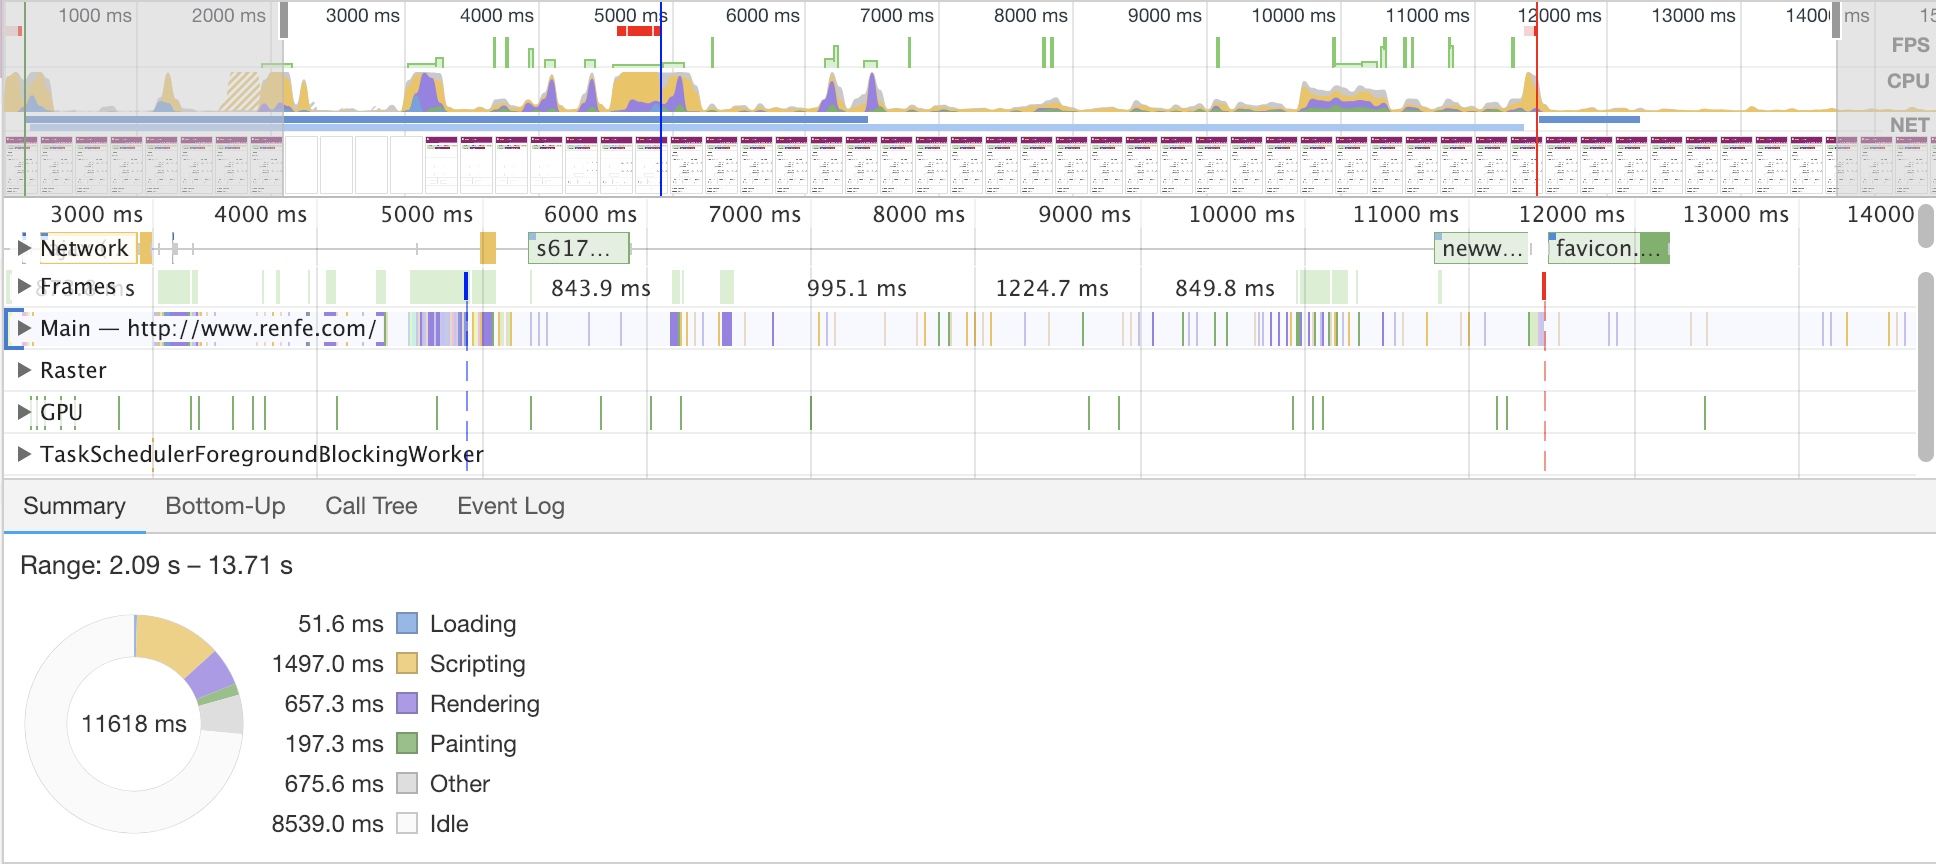
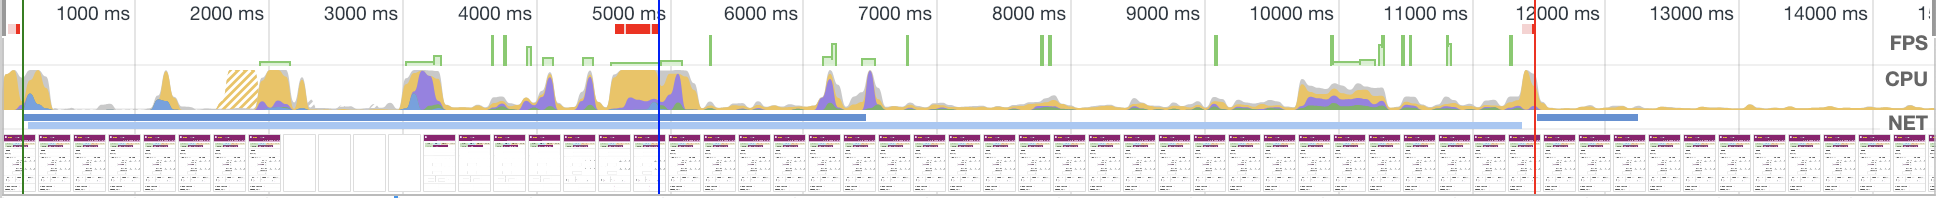

The redpoints shows bottlenecks or fps problems

Shows CPU use. Discover critical points
Screenshots will help identifying the critical points
Performance is the art of doing less
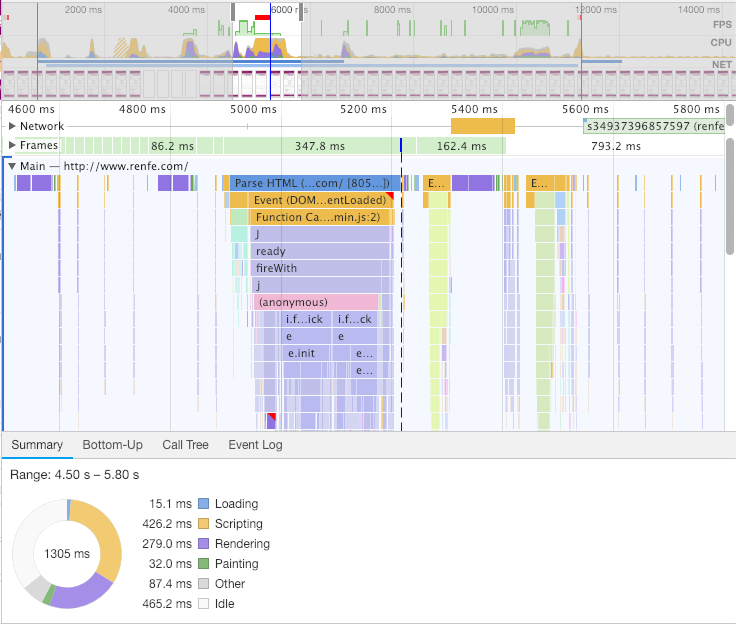
Scripting and Rendering
426.2 ms + 279.0 ms
Check colors for info!
requestIdleCallback
requestAnimationFrame
scripting main enemy
blocking the thread
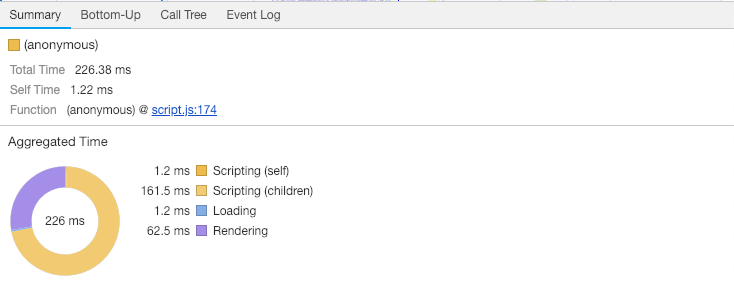
Select a problematic stack call, and analyze
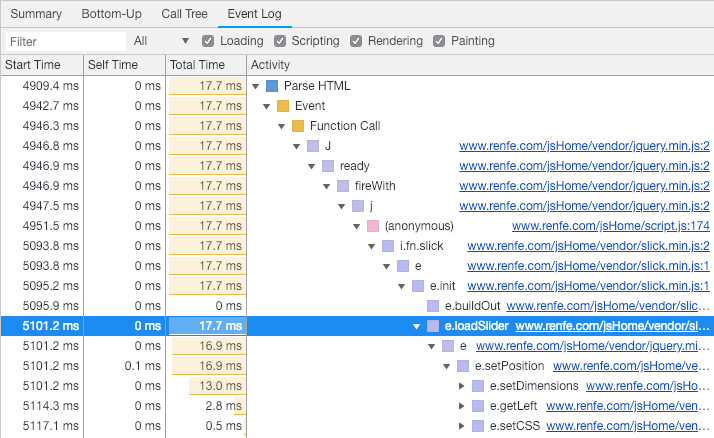
Navigate on stack call to detect problematic points

More tools > Rendering
(cmd + shift + p)
FPS meter 🧭
Paint flashing 🖼️
Scrolling performance issues 🧶

On CI!
lighthouse-ci
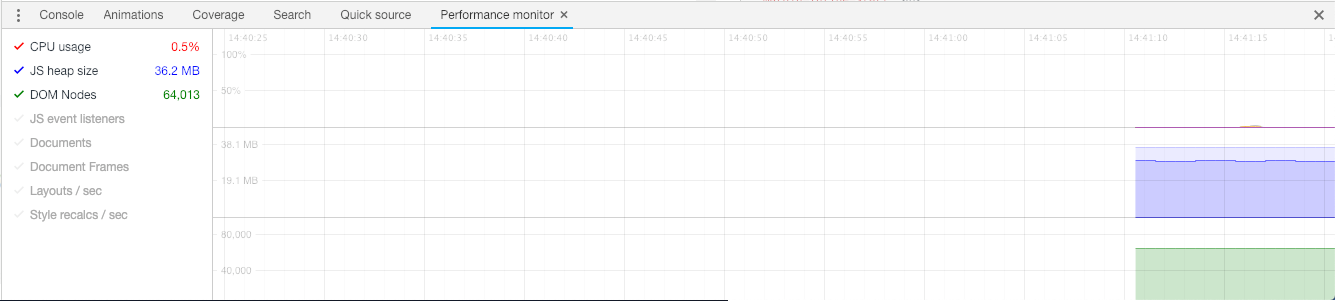
More tools > Performance monitor
(cmd + shift + p)

@jnroji
DevTools
By Jon Rojí


