Digital Cartography
a.k.a. How to make maps for journalism
Jacopo Ottaviani – @JacopoOttaviani
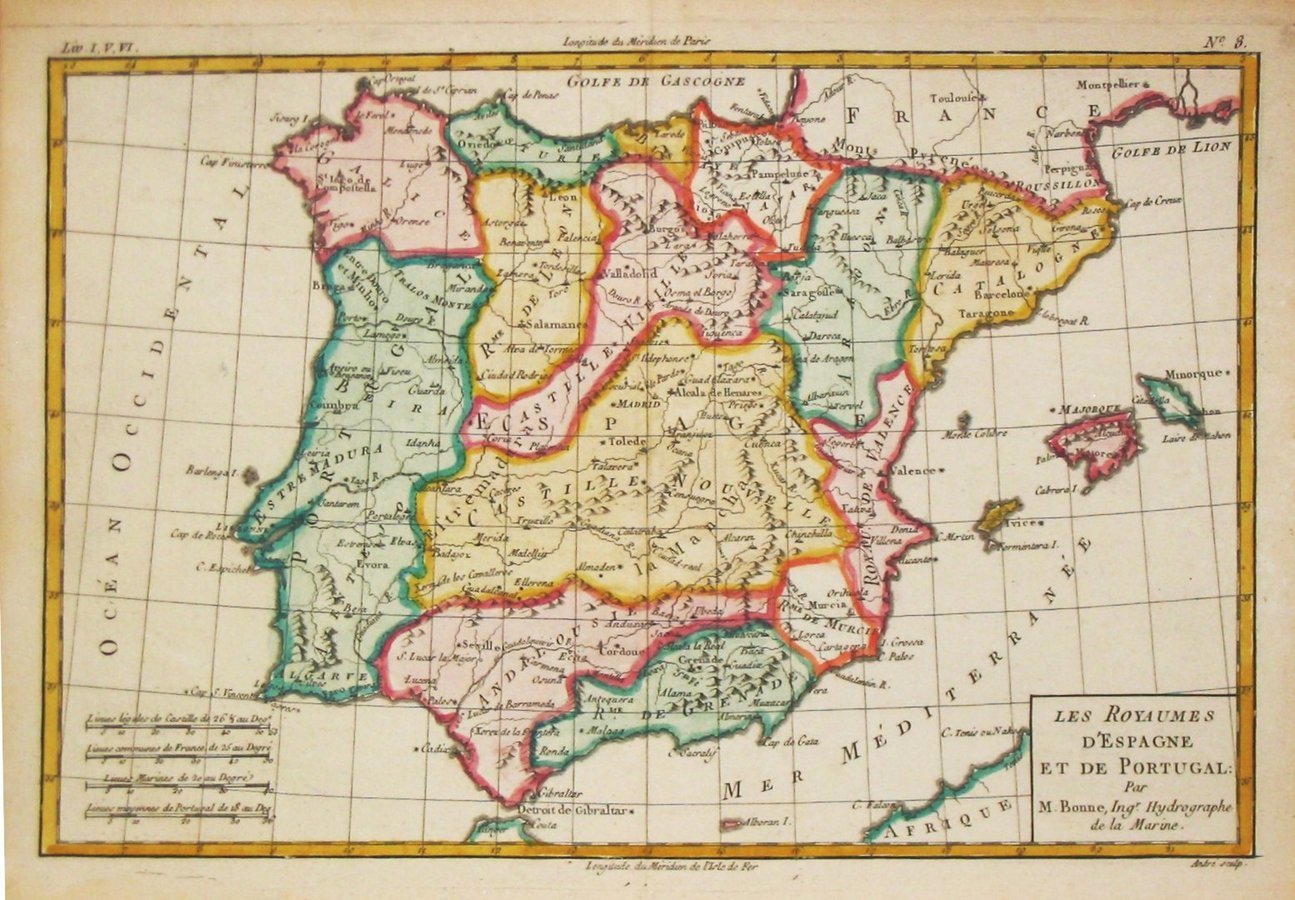
Bonne, R. – Antique map of Spain and Portugal
We will make maps.
From «conception» to «publication»
Feel free to interact, ask, experiment... and enjoy

The Fra Mauro map, "considered the greatest memorial of medieval cartography", is a map of the world made around 1450 by the Italian cartographer Fra Mauro. The map is a map of the world and includes Asia, the Indian Ocean, Africa, Europe and the Atlantic. The map is oriented with south at the top.
Let's begin.
The role of data
Data should be seen as a force multiplier in the newsroom (cit. Aron Pilhofer, The Guardian)
Data empowers existing storytelling processes.
It can help to engage with readers.

It's about questions:
- Keep questions brief
- Include data in your story if questions are clear in your mind
- Break questions down
- Bear in mind that all questions will need (at least) a data source
- e.g. How many students abandon high schools in Italy?
- In Italian provinces?
- In professional schools?
- Before the 5° year?

courtesy of Queen Elizabeth II
Data can be zoomed in/out:
- Big picture vs. Local detail
- Localize discussions
- Let people have insights
- Foster comparisons
- Engage users
- Trigger debates

Early school leaving in Italy, 2015 (Internazionale)
Wait a second.
Why am I talking about data?

As behind every dataviz there is a table...


...so behind every map there is a table
(and a table is actually «data»)


In order to be transformed into a map, a table needs...
Location column(s)

Location column(s)
Location column(s)
Other column(s)
Data formats

The data formats you need to know
- String: 'Hola', '2323abc', '23'
- Number: 54
- Date: 10/09/2015 (2015-09-10T00:00:00Z)
-
Location:
- Addresses
- Geographic coordinates (lat, lon)
- Comunidades autónomas
- European countries
- World countries
- etc.
Ingredients to make a map
- A topic
- Some research questions
- Some data sources that respond to your research questions
- Table with some columns and rows
- One column is a location column
- Every column has data of one type

Questions?
Exercise. Go here:
http://bit.ly/e-waste-data
- Download the above dataset in CSV
- Load it into Carto
- Make a choropleth map
- Change colors and basemap
- Set up infoboxes
- Copy embed code and link
Well done, you have created your first geographic dataset.
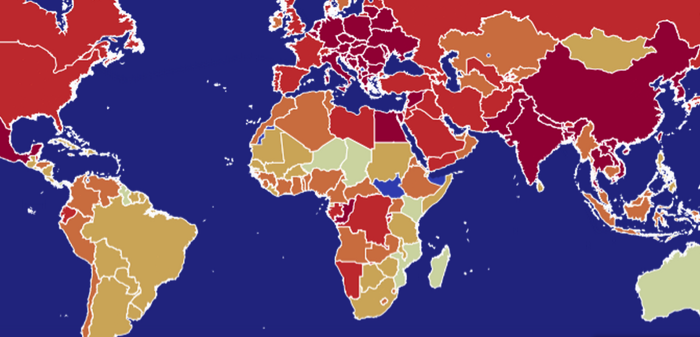
We are ready to visualise it on something like this.
Copy of #1 - Digital Cartography
By jottaviani


