


Julián Duque
Developer and Educator
node --inspect
node --inspect-brk
Go to
chrome://inspect
kill -USR1 <pid>
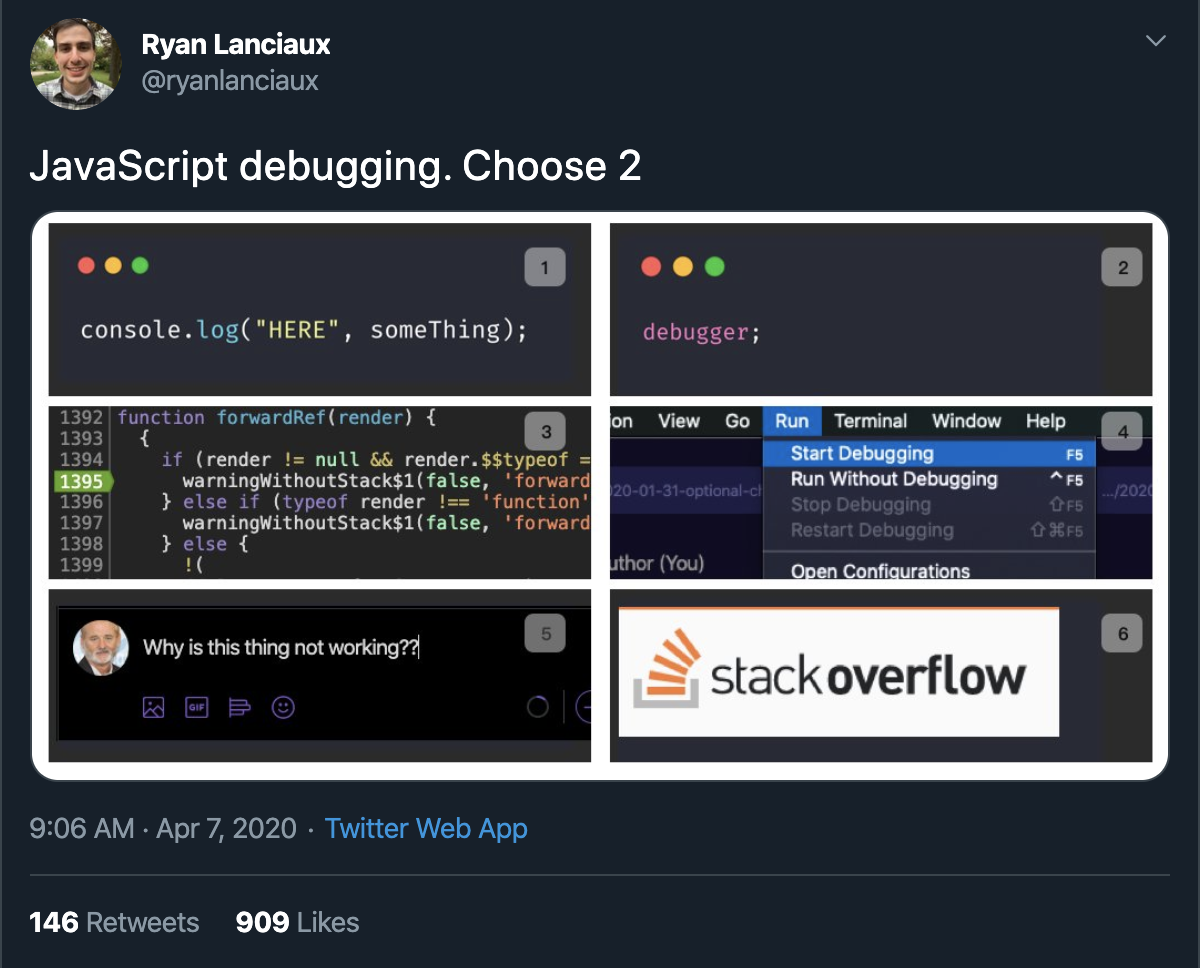
debugger;
Visual Studio Code supports the Node.js Debug protocol and it is a great tool for local and remote debugging.
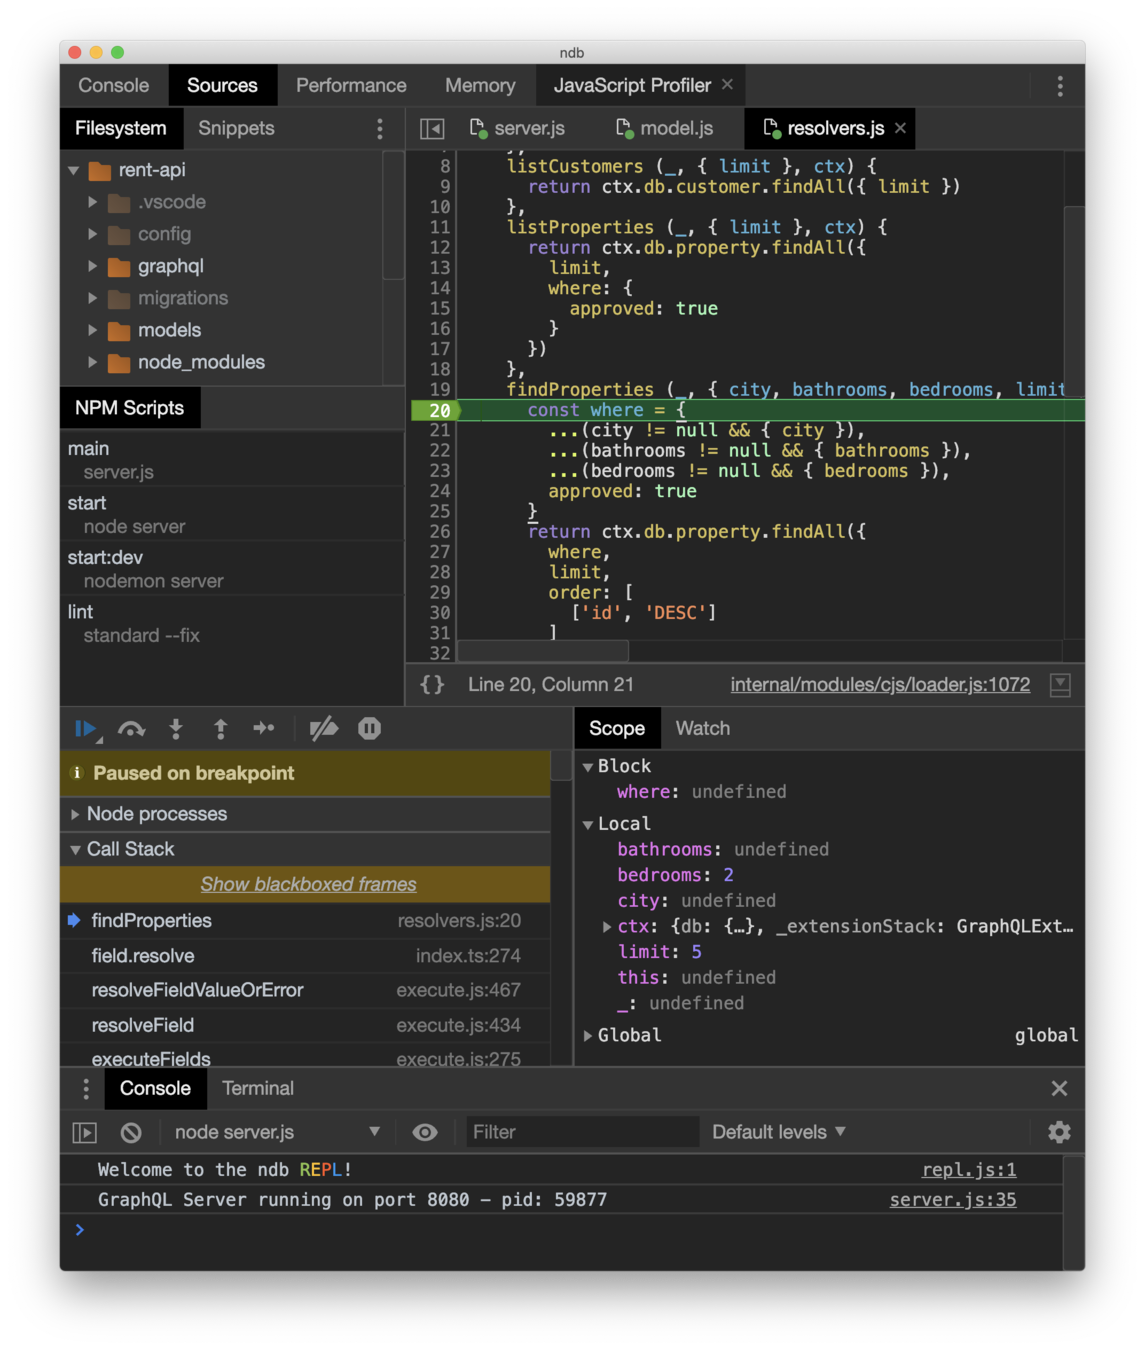
It is a Chromium-based, standalone Node.js debugger by the ChromeLabs team with extra features that Chrome Inspector doesn't support out of the box
$ npm install -g ndb
npm install -g llnode
llnode `which node` -c core.dump
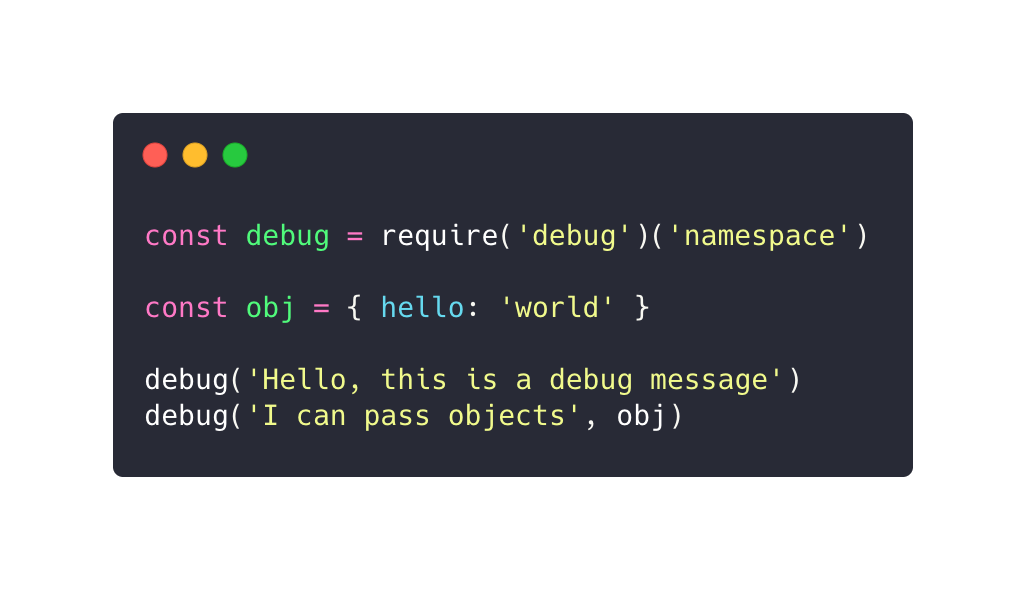
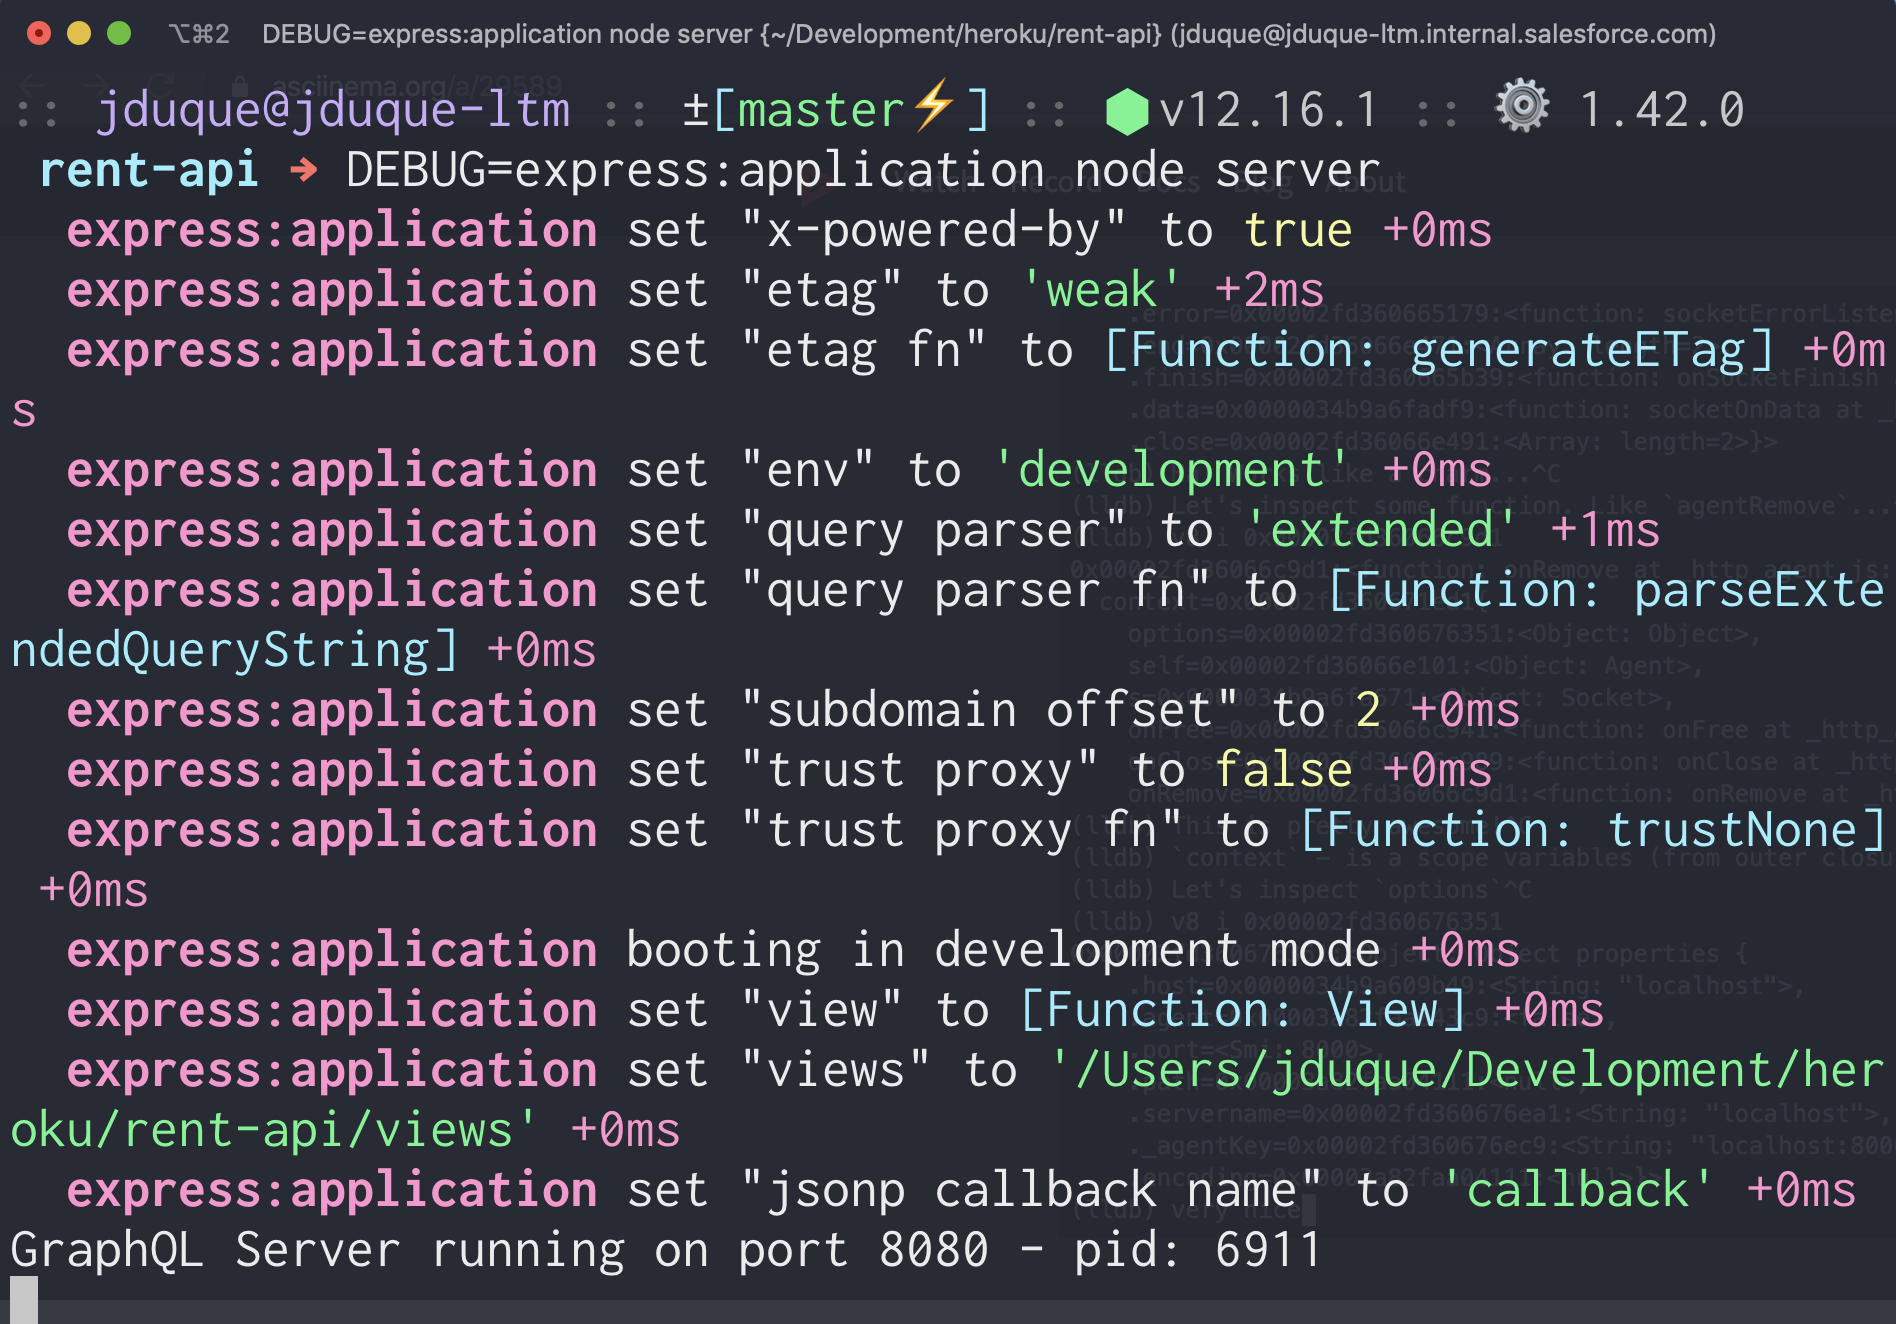
Allows you to have a console-based debugger that can be enabled by using an environment variable
$ npm install debug
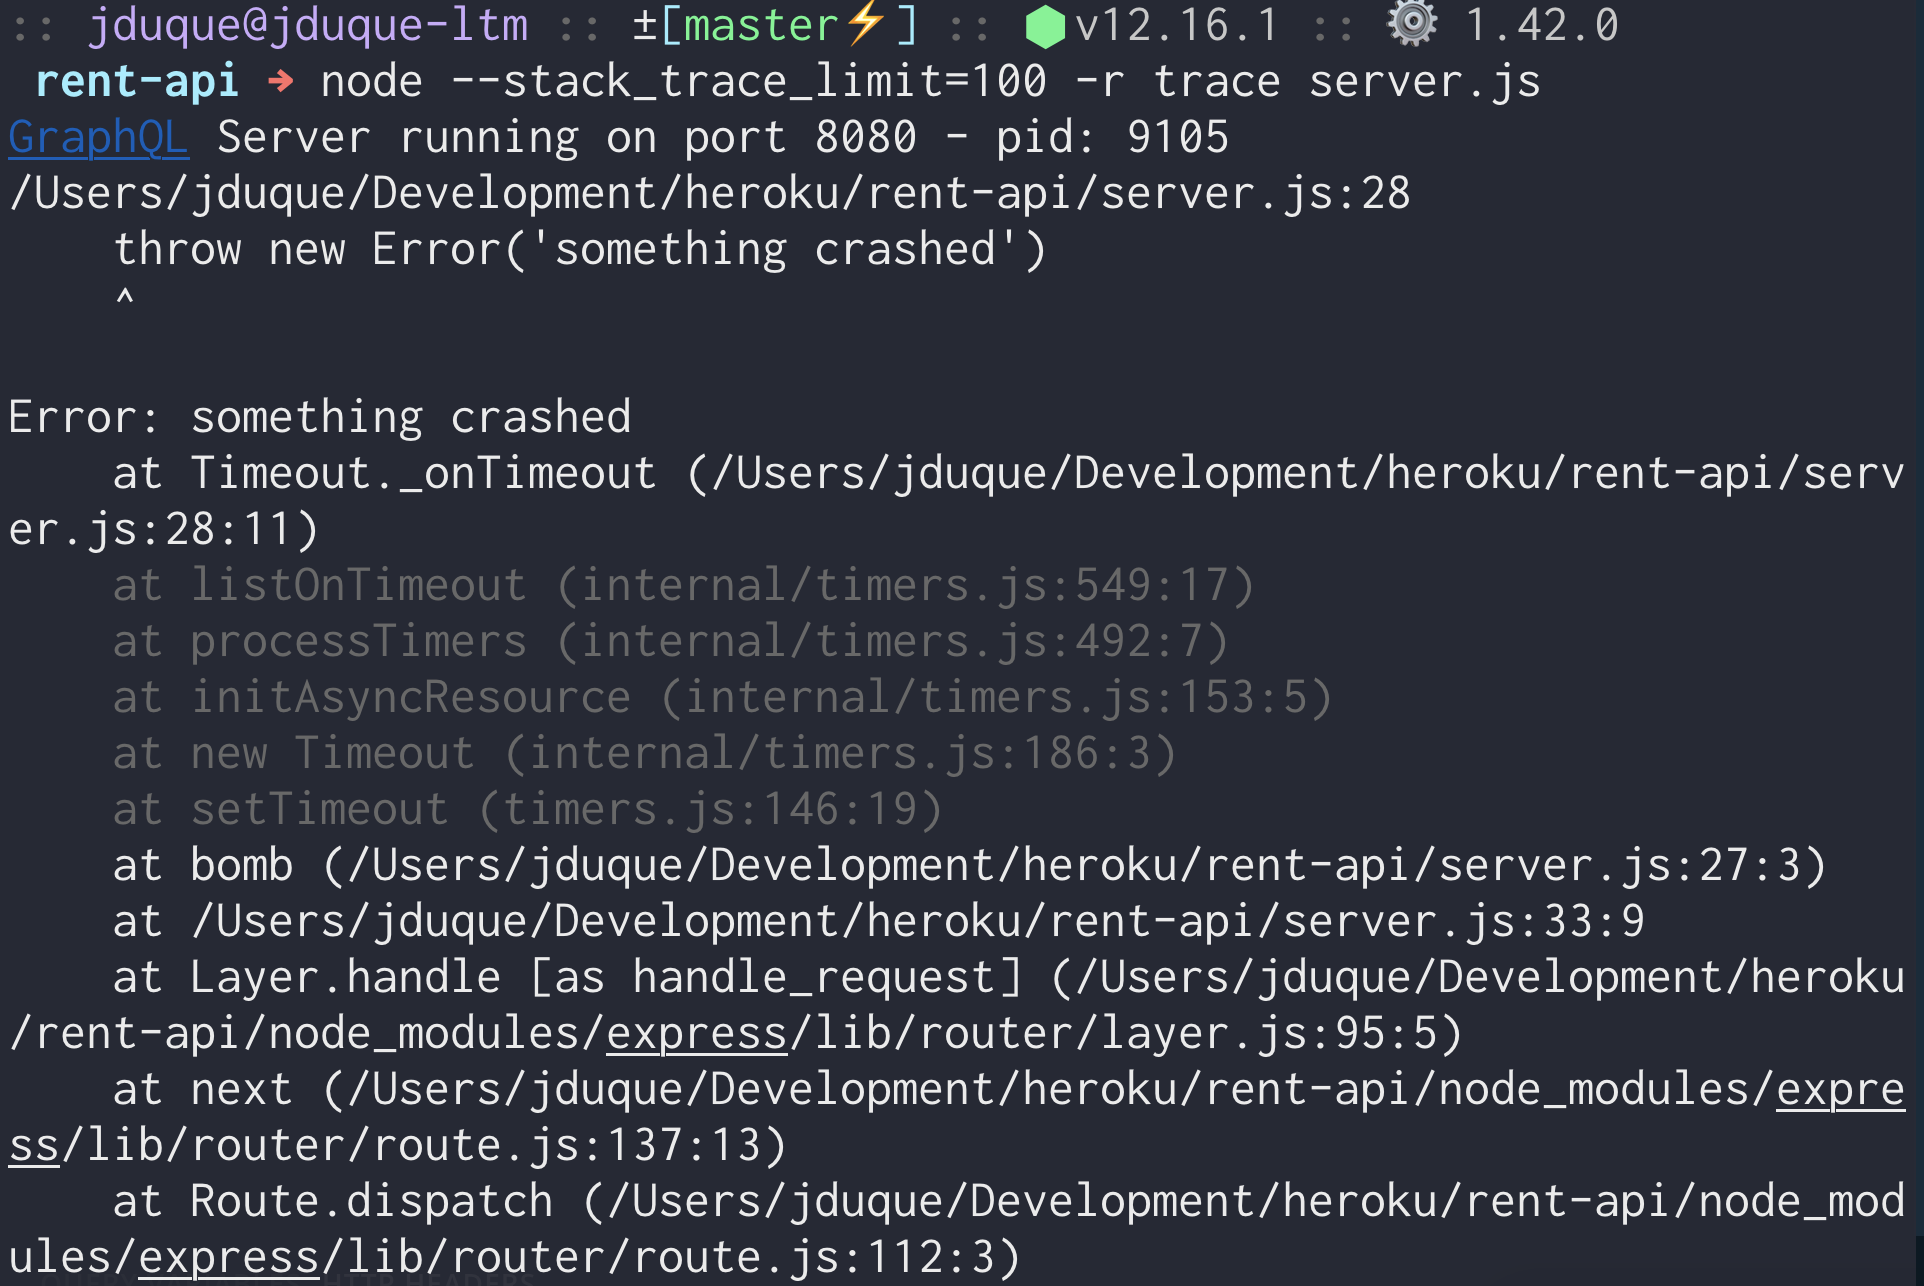
trace: Augment your async stack traces
clarify: Removes node internals
$ npm i --save trace clarify

$ node --stack_trace_limit=100 -r trace server.js

$ node --stack_trace_limit=100 -r trace -r clarify server.js
By Julián Duque
Introduction to Node.js Debugging


