Framework for empirical analysis of graph metric robustness
Juraj Micko, jm2186
University of Cambridge
- Graph
G \in \mathbb{V} \times \mathbb{E}
- Metric
f : (\mathbb{V} \times \mathbb{E}) \rightarrow ( \mathbb{V} \Rightarrow \mathbb{R} )
- Robustness
r : \mathbb{F} \times (\mathbb{V} \times \mathbb{E}) \rightarrow \mathbb{R}^n
Framework for empirical analysis of graph metric robustness
- Empirical analysis
\overline{r} (f, G)
- Framework
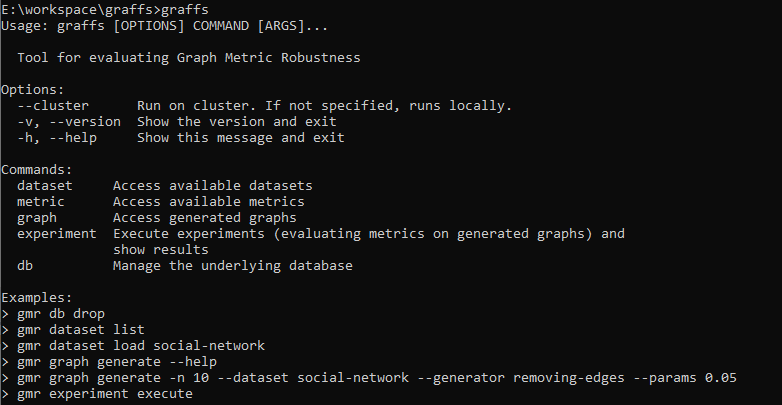
Inspired by:
- Protein interaction networks (edges have weights of certainty)
My goals:
- verify the results of the paper
- generalise to any graph
+ prediction
Implementation
-
loading graphs
- generating new graphs by randomly deleting edges
-
evaluating certain metrics on the graphs
-
storing the result
-
visualise generated graphs
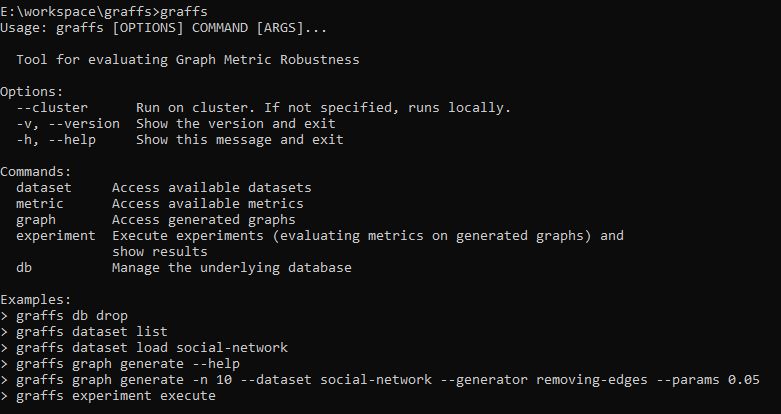
Social network dataset
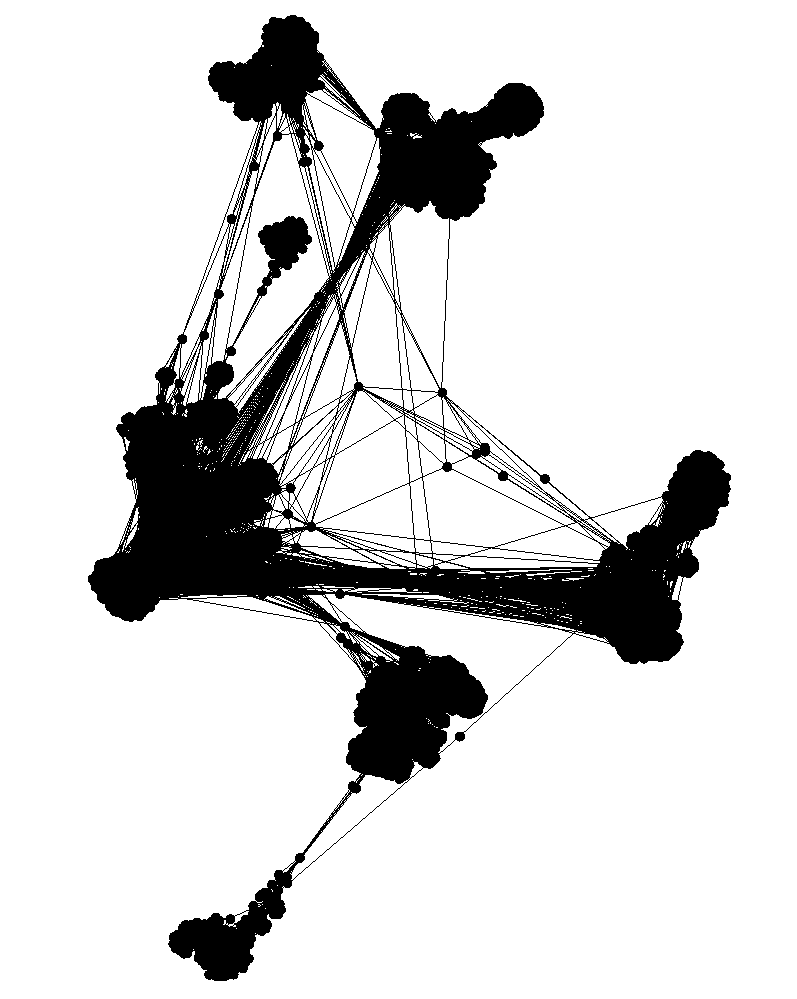

randomly deleting
10% of edges
$ graffs dataset viz social-network
$ graffs graphs generate -n 100 --dataset social-network --params 0.1
$ graffs graphs viz 1
Rank continuity
Similar highest-ranked proteins at consecutive thresholds
Rank instability
How the rank of the 1% most important nodes changes over various thresholds
Measuring robustness
Rank identifiability
Recovering the set of the highest-ranked nodes at different thresholds
Implementation
- Project management:

- Graph operations:
- Language:
- Database:
- High-performance computing:
Next steps
- Implement robustness functions
- Run evaluations, observe
- Writing dissertation
Thank you!
Part II Progress report
By Juraj Mičko


