Social and Political Data Science: Introduction

Taiwan COVID Resilience:

A Global Perspective

Karl Ho
University of Texas at Dallas

Prepared for presentation at the Trilateral Relationship between Taiwan, the United States, and China: The Past, Present, and Future Conference, October 22-23, 2022, St. Thomas University, Houston, TX

  • This study starts with an investigation of COVID using global cases. 

  • Using novel methods such as isotonic regression and automated machine learning, we identify important factors in determining impacts of COVID, comparing all the countries and regions in the world.

  • We attempt to address the following questions:

    • What lessons can we learn from the global patterns about COVID?

    • What implications for Taiwan?

  • We then discuss the possible policy directions for Taiwan

Motivation

  • We introduce novel machine learning techniques to traditional isotonic regression models to analyze COVID data.

    • First proposed by Barlow and Brunk and popularized by Tibshirani, isotonic regression builds on a monotonic relationship assuming

      • \(E(y|x)\) is non-decreasing or non-increasing in \(x\) for an independent variable \(x\) and dependent variable \(y\) (Barlow and Brunk, 1972; Tibshirani 1996; see also Tutz and Leitenstorfer, 2007).

Methods

  • Machine learning techniques allow modeling big data with a large number of predictors, which could be highly collinear and resulting in high variance in predicting outcome.   

  • We employ automatic machine learning (AML) methods to select the best algorithm and predictors, then apply such in isotonic regression models.   This approach effectively identifies the most important feature(s) for estimating the dependent variable. Instead of isolating the best function or smoothed solution, we target partitioning or grouping in the covariate, which in turn provides information for developing group-specific solutions.

Methods

Why AML?

  • Answer: Machine learning methods can test and compare large number of algorithms taking into account regularized models with highly correlated features.  This approach focuses on predicting outcome instead of individual hypothesis-testing process.  It sheds light on features and model selection, which provides fast and important information on more effective modeling.

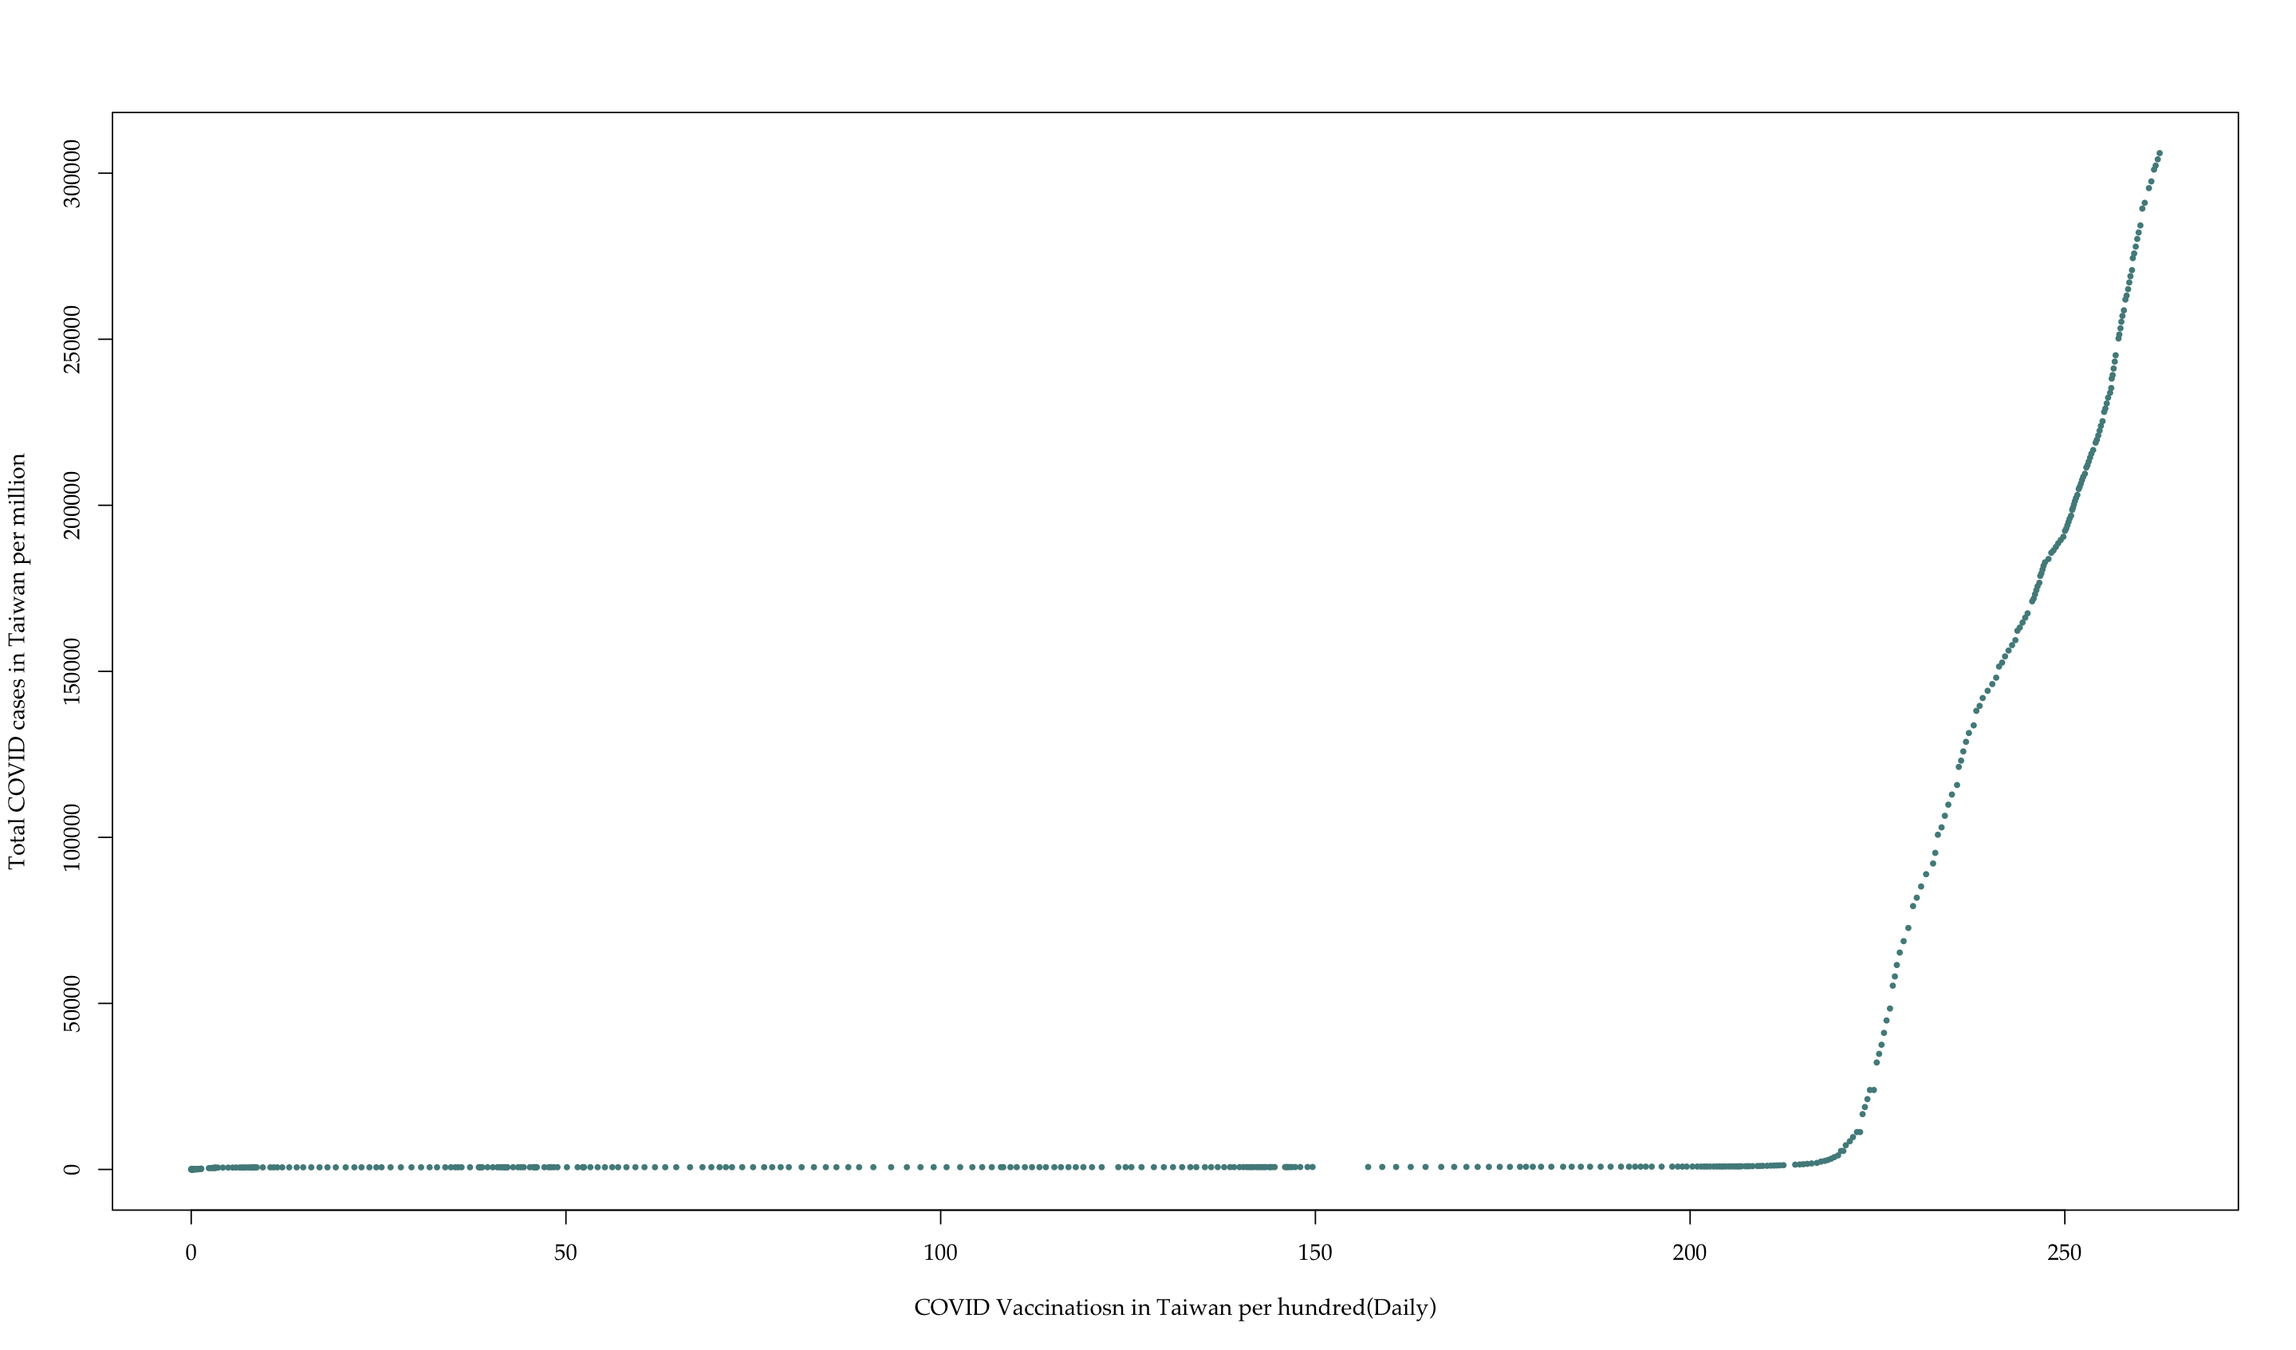
Why isotonic regression?

  • Answer: our goal is not to detect effects of individual covariate but instead what groups in the distribution of such variable are most different.  The groups identified can help developing more surgical group-specific solutions.  For instance, decision of discharge based on stages of prognosis (Satyadev et al. 2022), targeted treatment for certain group of patients, etc.

Methods

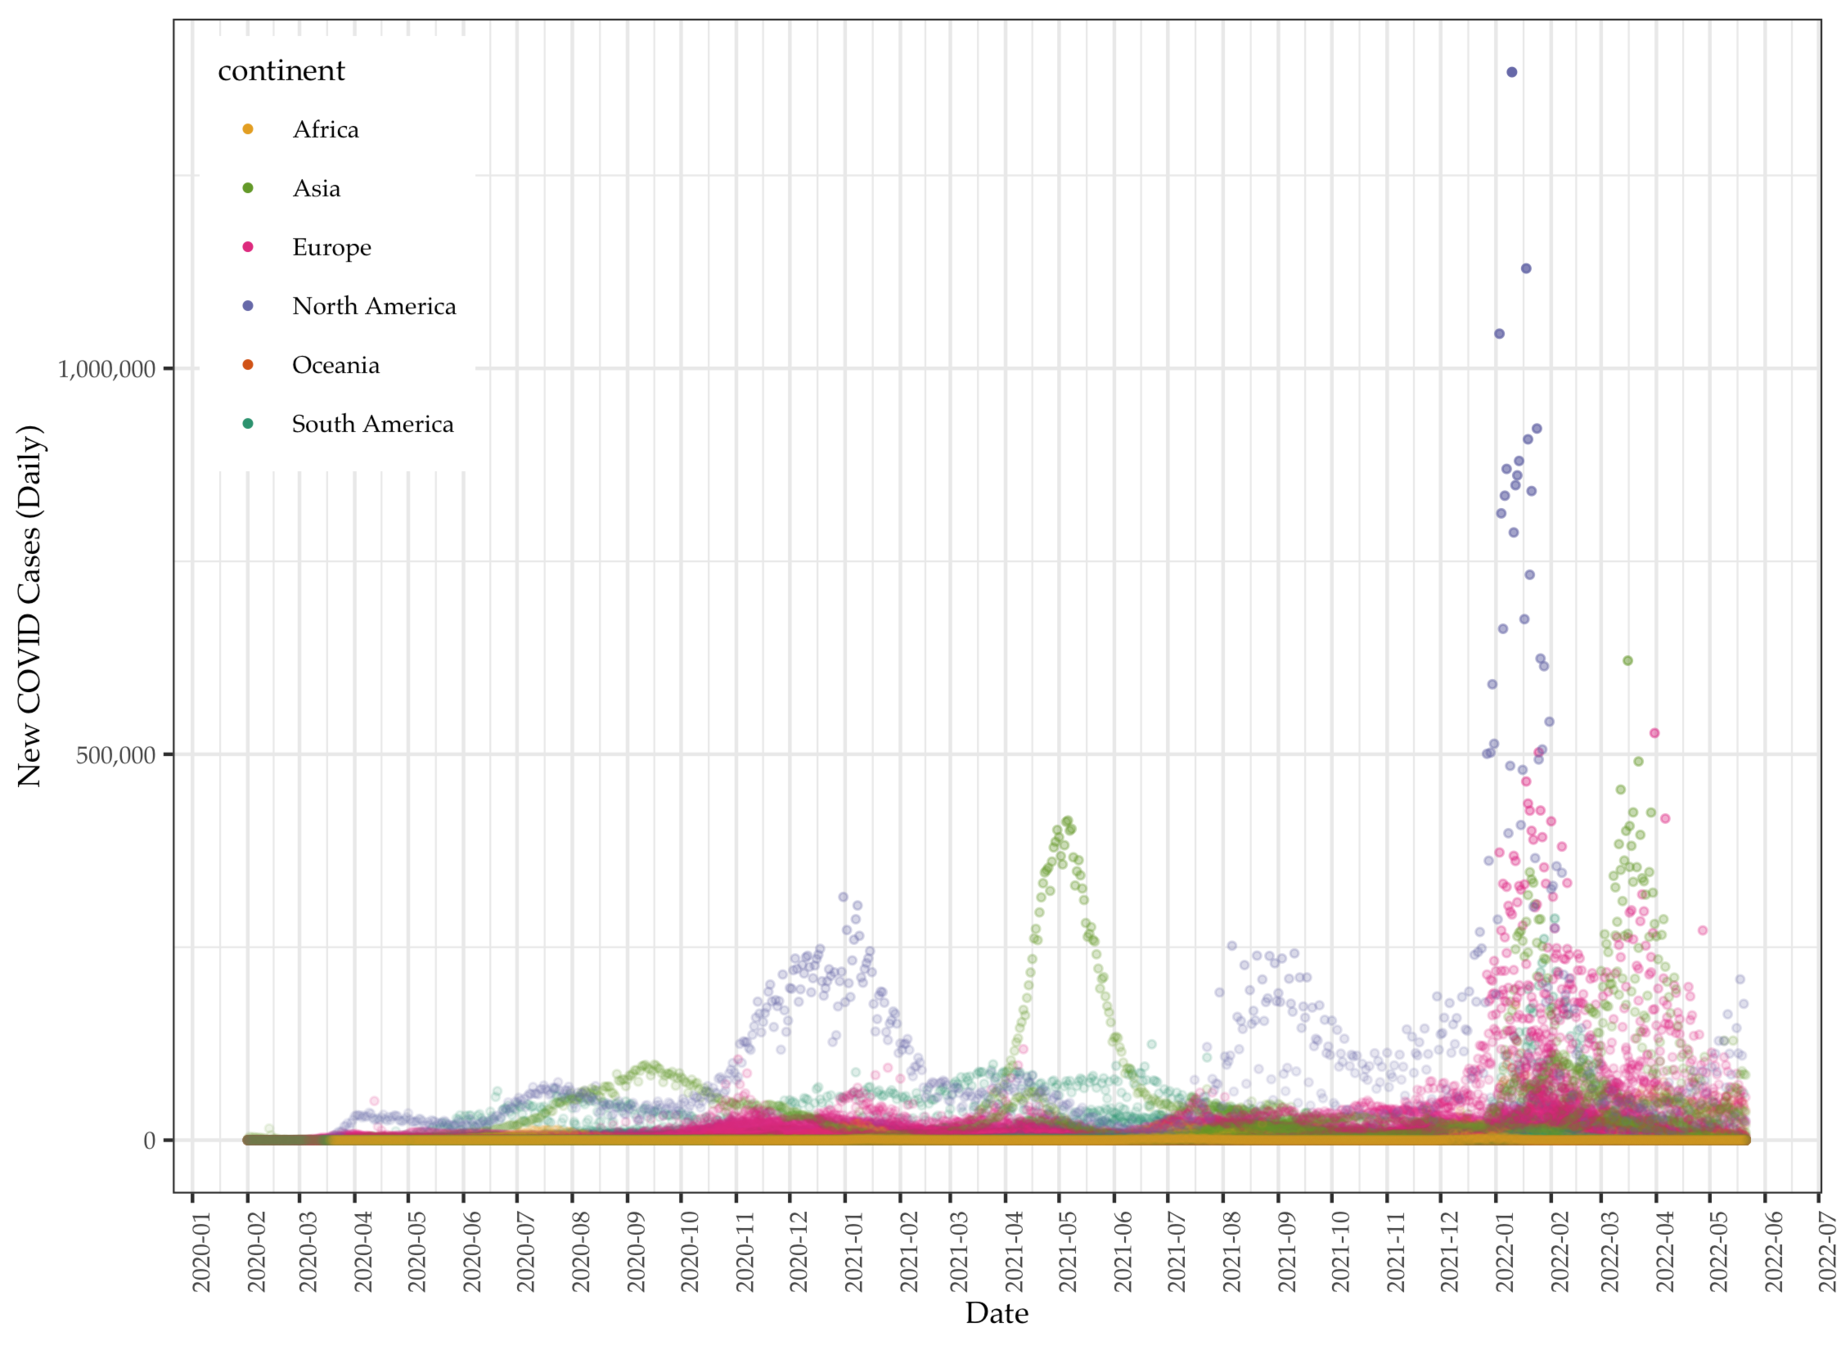
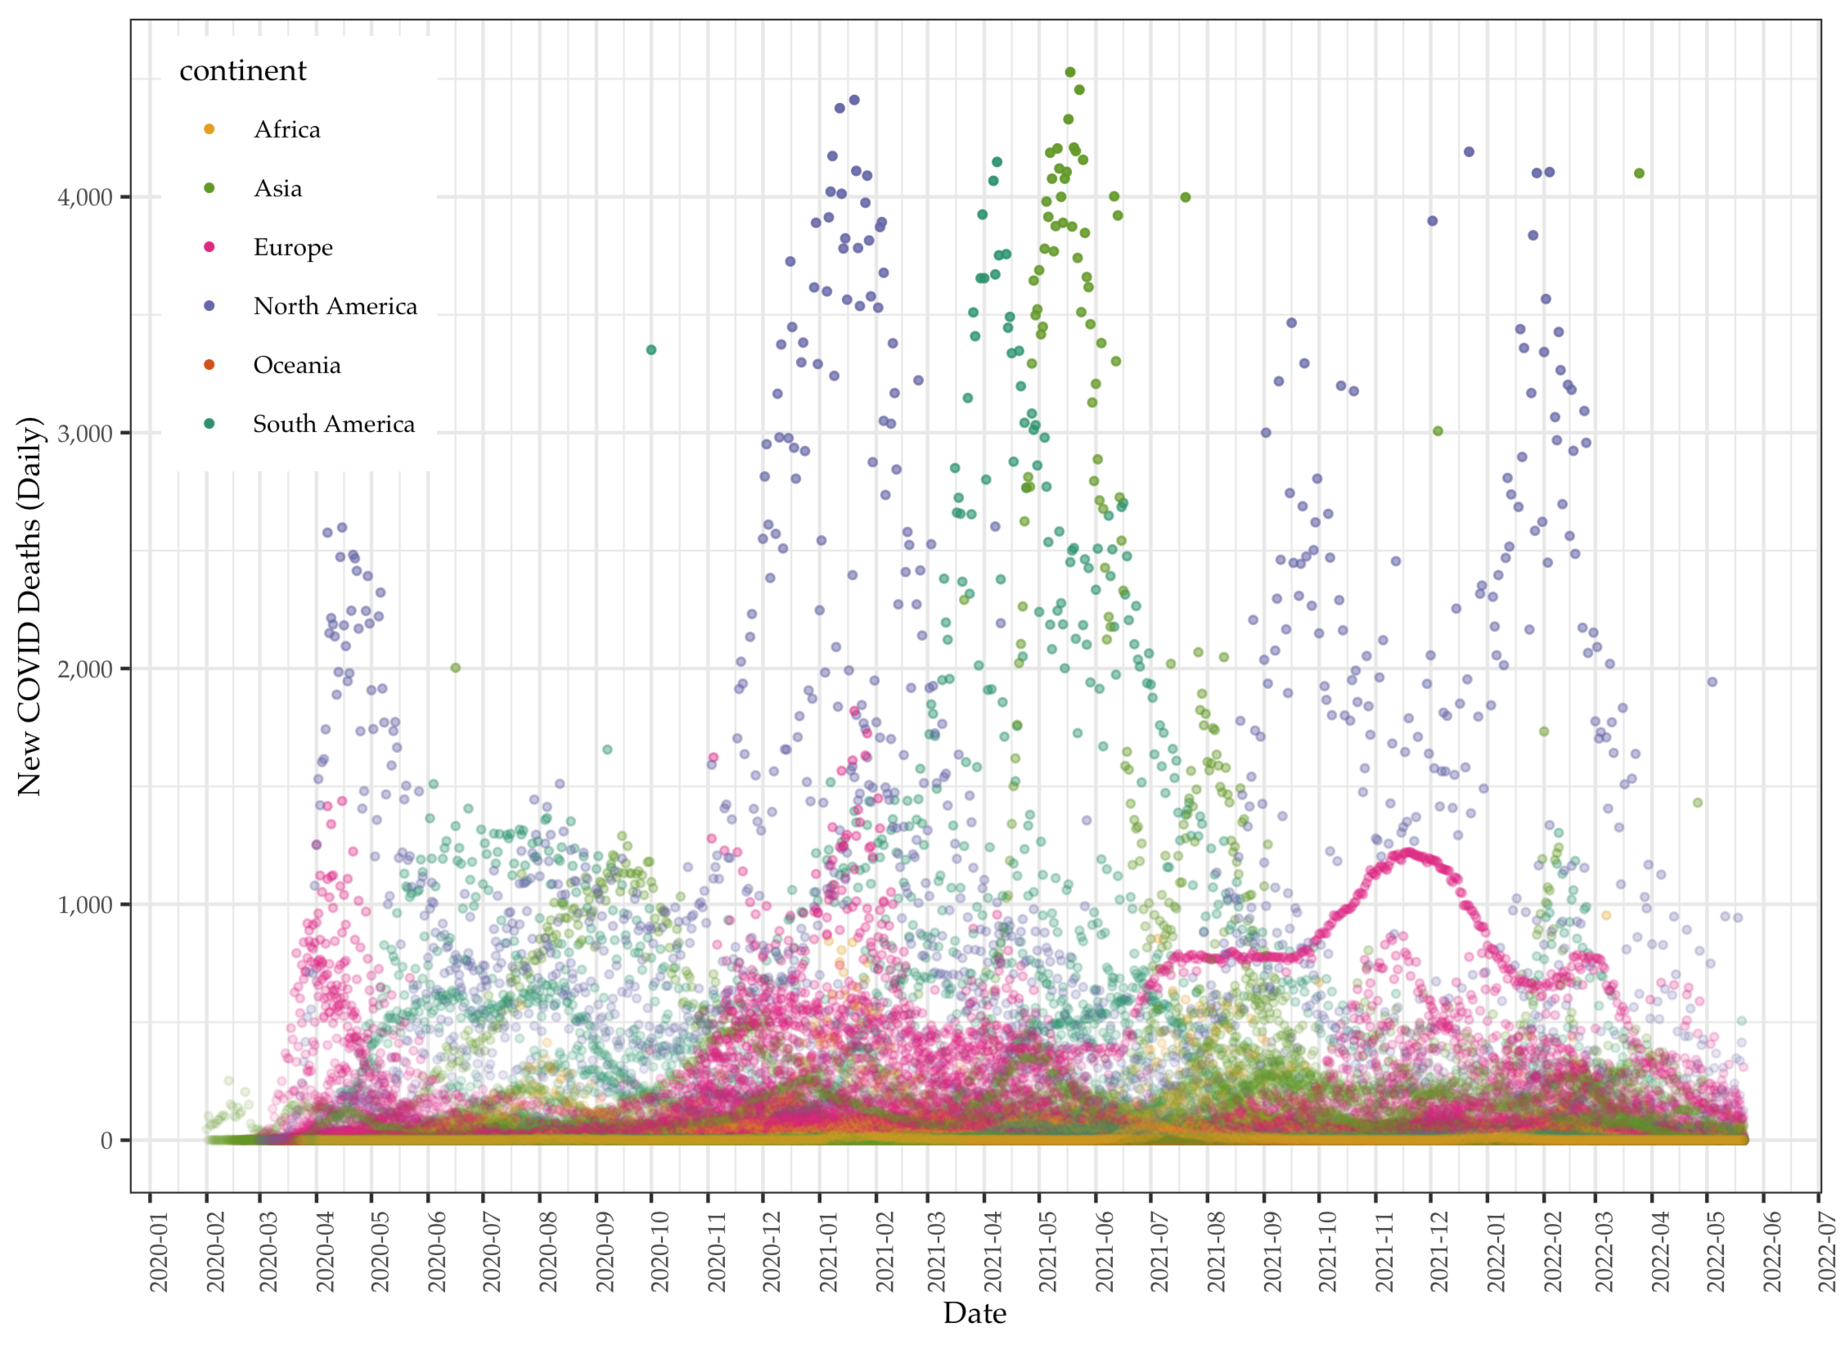
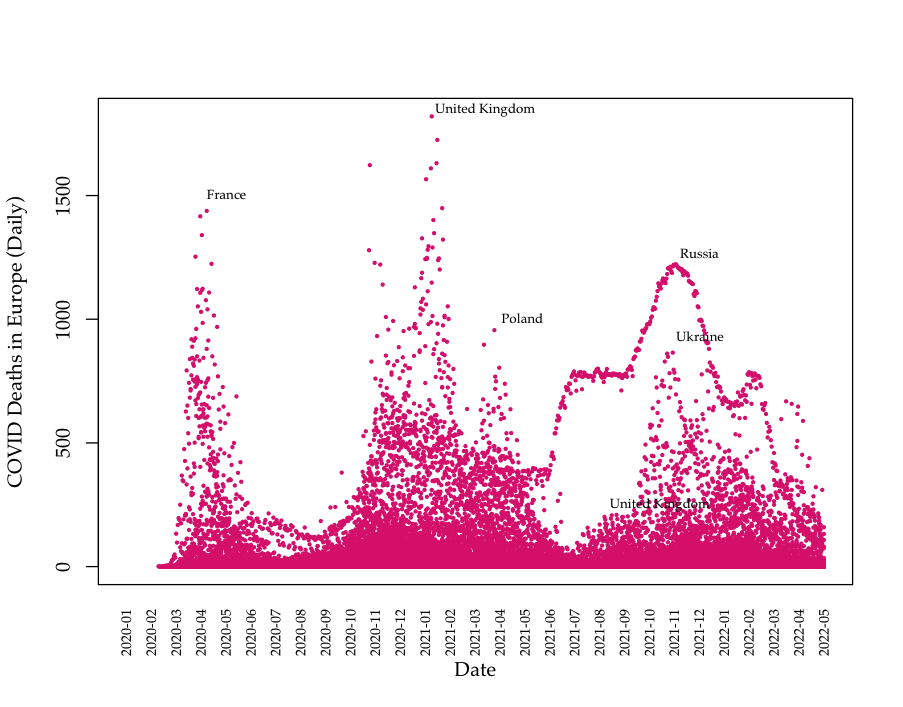
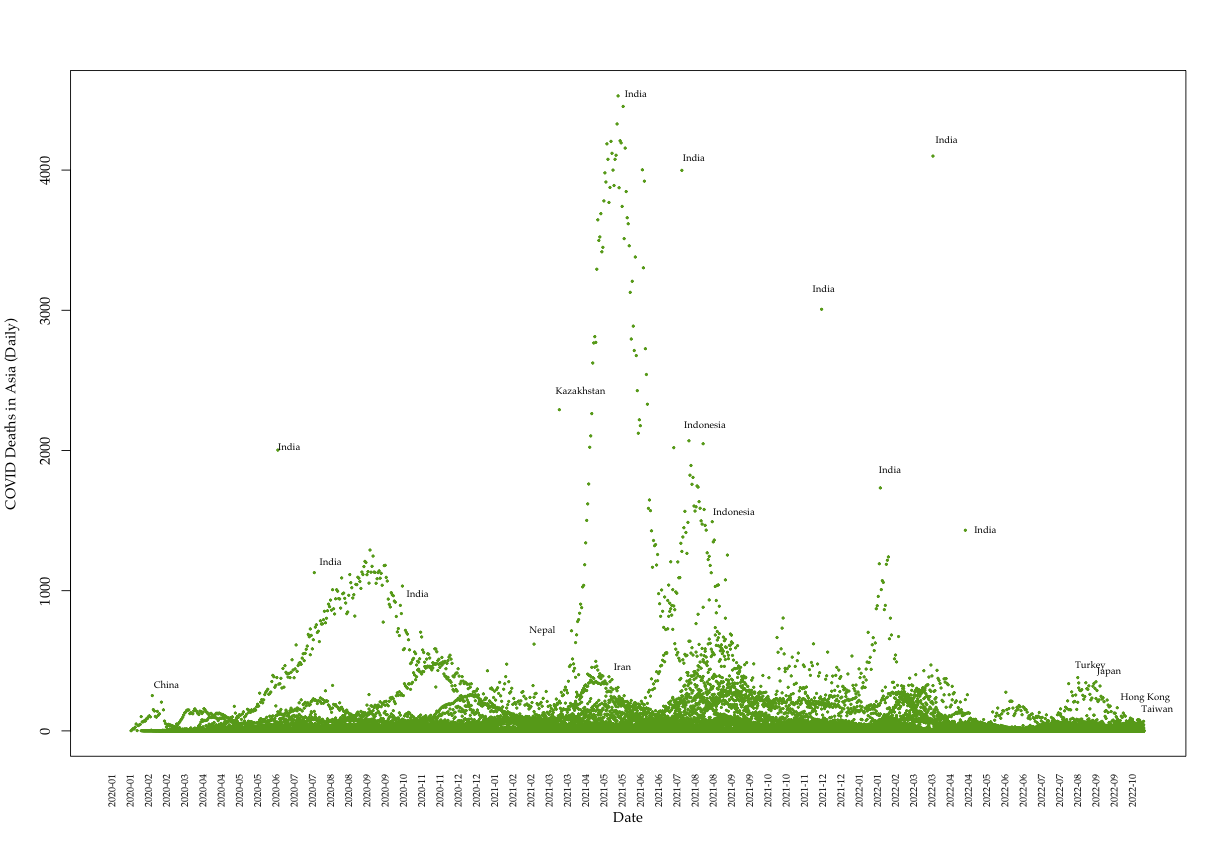
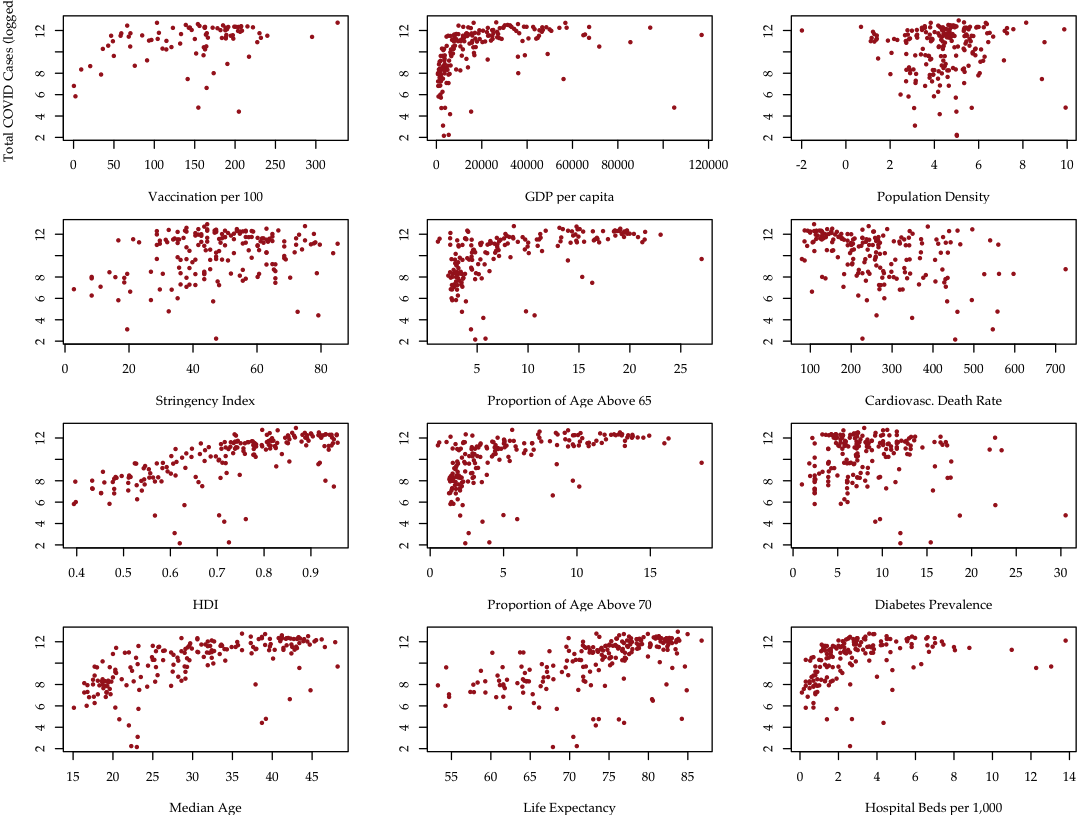
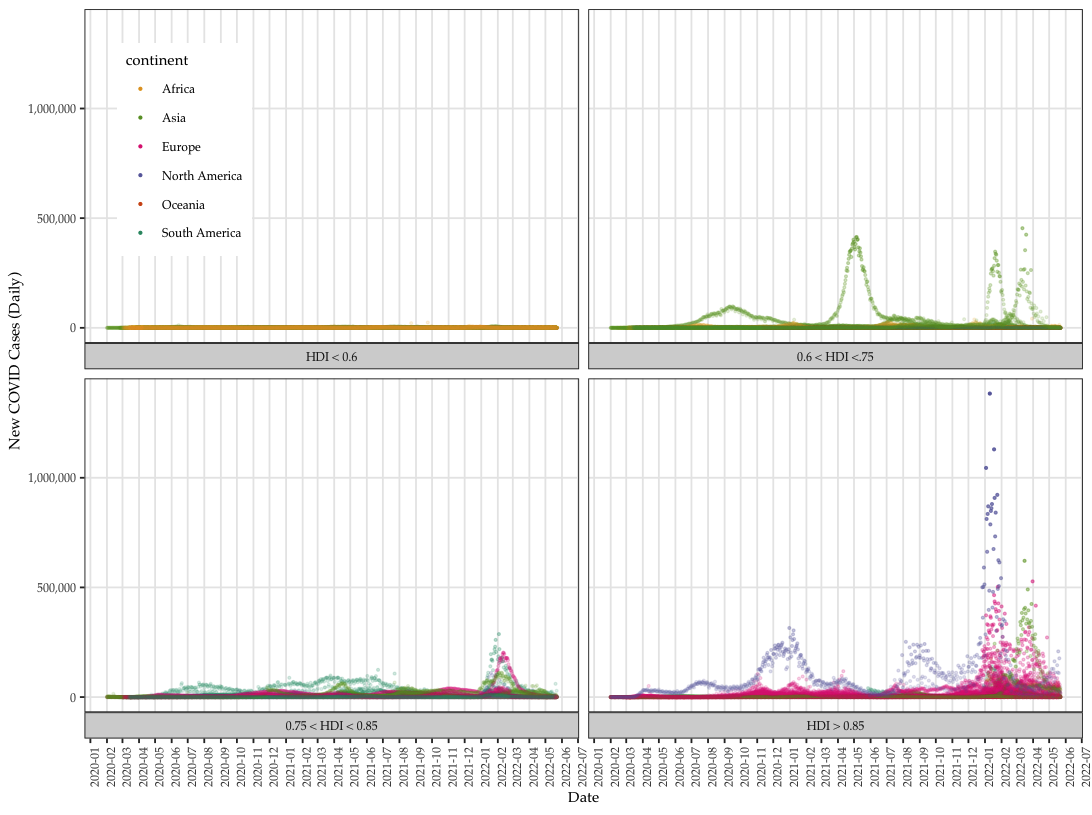
We collect global COVID data from the Our World in Data project, which makes daily pandemic data from all countries available in real time. 
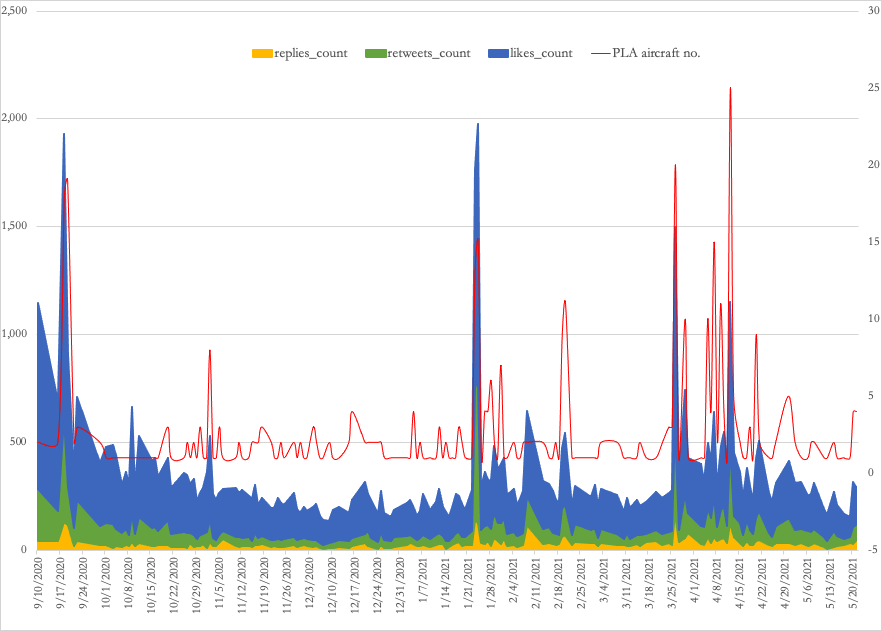
  • The data set comes with a series of daily variables including total (cumulative) and new cases (per million), deaths (per thousand), vaccination and other longer term variables such as GDP per capita, proportion of aged 65 or above, human development index (HDI), etc.
  • There are a total of 225 units, with 228,749 cases and 67 variables.
  • Data period starts from 1/1/2020 to 10/20/2022
  • We use the peak day data, which is on 1/20/2022.

Data

Data: Total cases per million

Data: Daily COVID deaths

Data

Data

  • We focus on aggregate instead of daily data to identify predictors of total cases of COVID (per million).
  • COVID data vary tremendously over countries and time.  Singling out cumulative or total cases to regress on country-level variables allows modeling the COVID data per individual countries' characteristics
  • OWID data point to one direction: how developed the country is and the number of COVID cases and death.
  • The general trend is the more developed the countries are the more affected by COVID.

Data: Death data (Europe)

Data: Death data (Asia)

Most recent Data: Deaths (Asia)

Most recent Data: Deaths (Asia)

Data: COVID cases~predictors

Data: COVID cases~predictors

Automated Machine Learning 

  • Automated machine learning applies multiple algorithms and modeling methods including:
    • validation
    • training and testing data partitioning
    • pruning for tree models
    • constraints application
  • The process compares model efficacy using a series of metrics to determine stopping and selection recommendations including MSE, AUC and RMSE.
  • We use \(H_2O.ai\) to model the COVID cases with 13 predictors. 

Automated Machine Learning 

Automated Machine Learning 

Automated Machine Learning 

Automated Machine Learning 

Isotonic Regression

Isotonic Regression

Isotonic Regression

Isotonic Regression

Findings and discussion

  • COVID data presents tremendous heterogeneity across over 200 countries/areas and time (from January 2020 to present).

  • The aggregate data provides an opportunity to examine the big picture of the pandemic's impact and related features.

  • Interestingly, the more developed countries suffer more than their developing counterparts, even controlling for the better public health systems and medical technologies such as fast development and effective vaccine applications.

  • The higher the Human Development Index or more developed the country is, the more it is prone to pandemic damage.

  • This is in line with earlier findings in Khazaei et al. 2020.

  • The real culprit could be the higher proportion of elderly population.  The second best predictor is proportion of those aged 70 or above in the population.  

  • The other possible suspect is the generally free and democratic system, which makes implementation of highly stringent measures difficult compared to authoritarian regimes.

  • With a closer look at most recent data, is Taiwan doing better than other countries?

Findings and discussion

Data: Taiwan and the world

Data: Taiwan and the world

Implications for Taiwan

  • Taiwan has a moderately high elderly population.  in 2021, one out of six (16.85%) of the population is aged 65 or above.  This proportion will grow to over 30 percent in less than 20 years.

  • Taiwan's fast growth in development (HDI ranked 23) and health care (ranked No. 1 according to Numbeo survey) must be factored in.

  • Taiwan delayed the pandemic start at the price of prolonging the tail:

    • Vaccine development necessitates own testing bed and patient pool.  Medigen could have missed the best timing for development despite its quality.

    • The sooner metaphor: not about how fast, but how soon one starts.

Implications for Taiwan

  • Taiwan must attend to the negative externalities of high stringencies in order to raise resilience:

    • Reform long-term care with AI predictions (e.g. AML)

      • Taiwan has one of the best big public health data

      • Why big data?

        • It scales!

          • startup could be expensive, but payoff will be far-reaching.

  • The "China Example"?

    • Lessons

Data: Taiwan and the world

Data: Taiwan and the world

Implications for Taiwan

  • Taiwan must attend to the negative externalities of high stringencies in order to raise resilience:

    • Reform long-term care with AI predictions (e.g. AML)

      • Taiwan has one of the best big public health data

      • Why big data?

        • It scales!

          • startup could be expensive, but payoff will be far-reaching.

  • The "China Example"?

    • Lessons

  • The "China Factor"

Figure 2.  Sample tweet posted by Taiwan Ministry of Defense Official Twitter account

Figure 3. Taiwan public responses to PLA aircraft intrusions

Table 1. Ingredients in Successful Amphibious Assaults (O'Hanlon 2000).

Days (6/9/2020 - 5/21/2021) 346
Total dispatch 455
No. of operations 167
Max aircraft count 25
Min aircraft count 1
Average aircraft count 2.72
Average interval (days) 1.53
Average daytime 5:53:55 AM

Implications for Taiwan

  • Taiwan must attend to the negative externalities of high stringencies in order to raise resilience:

    • Reform long-term care with AI predictions (e.g. AML)

      • Taiwan has one of the best big public health data

      • Why big data?

        • It scales!

          • startup could be expensive, but payoff will be far-reaching.

  • The "China Example"?

    • Lessons

  • The "China Factor"

  • Does initial success delay long-term results? (Kim et al. 2022)

Findings: How about vaccinations?

Barlow, R. E., and H. D. Brunk. 1972. “The Isotonic Regression Problem and Its Dual.” Journal of the American Statistical Association 67(337): 140–47.

Dougherty, Michael R. et al. 2015. “An Introduction to the General Monotone Model with Application to Two Problematic Data Sets.” Sociological Methodology 45(1): 223–71.

Henzi, Alexander, Johanna F. Ziegel, and Tilmann Gneiting. 2021. “Isotonic Distributional Regression.” Journal of the Royal Statistical Society: Series B (Statistical Methodology) 83(5): 963–93.

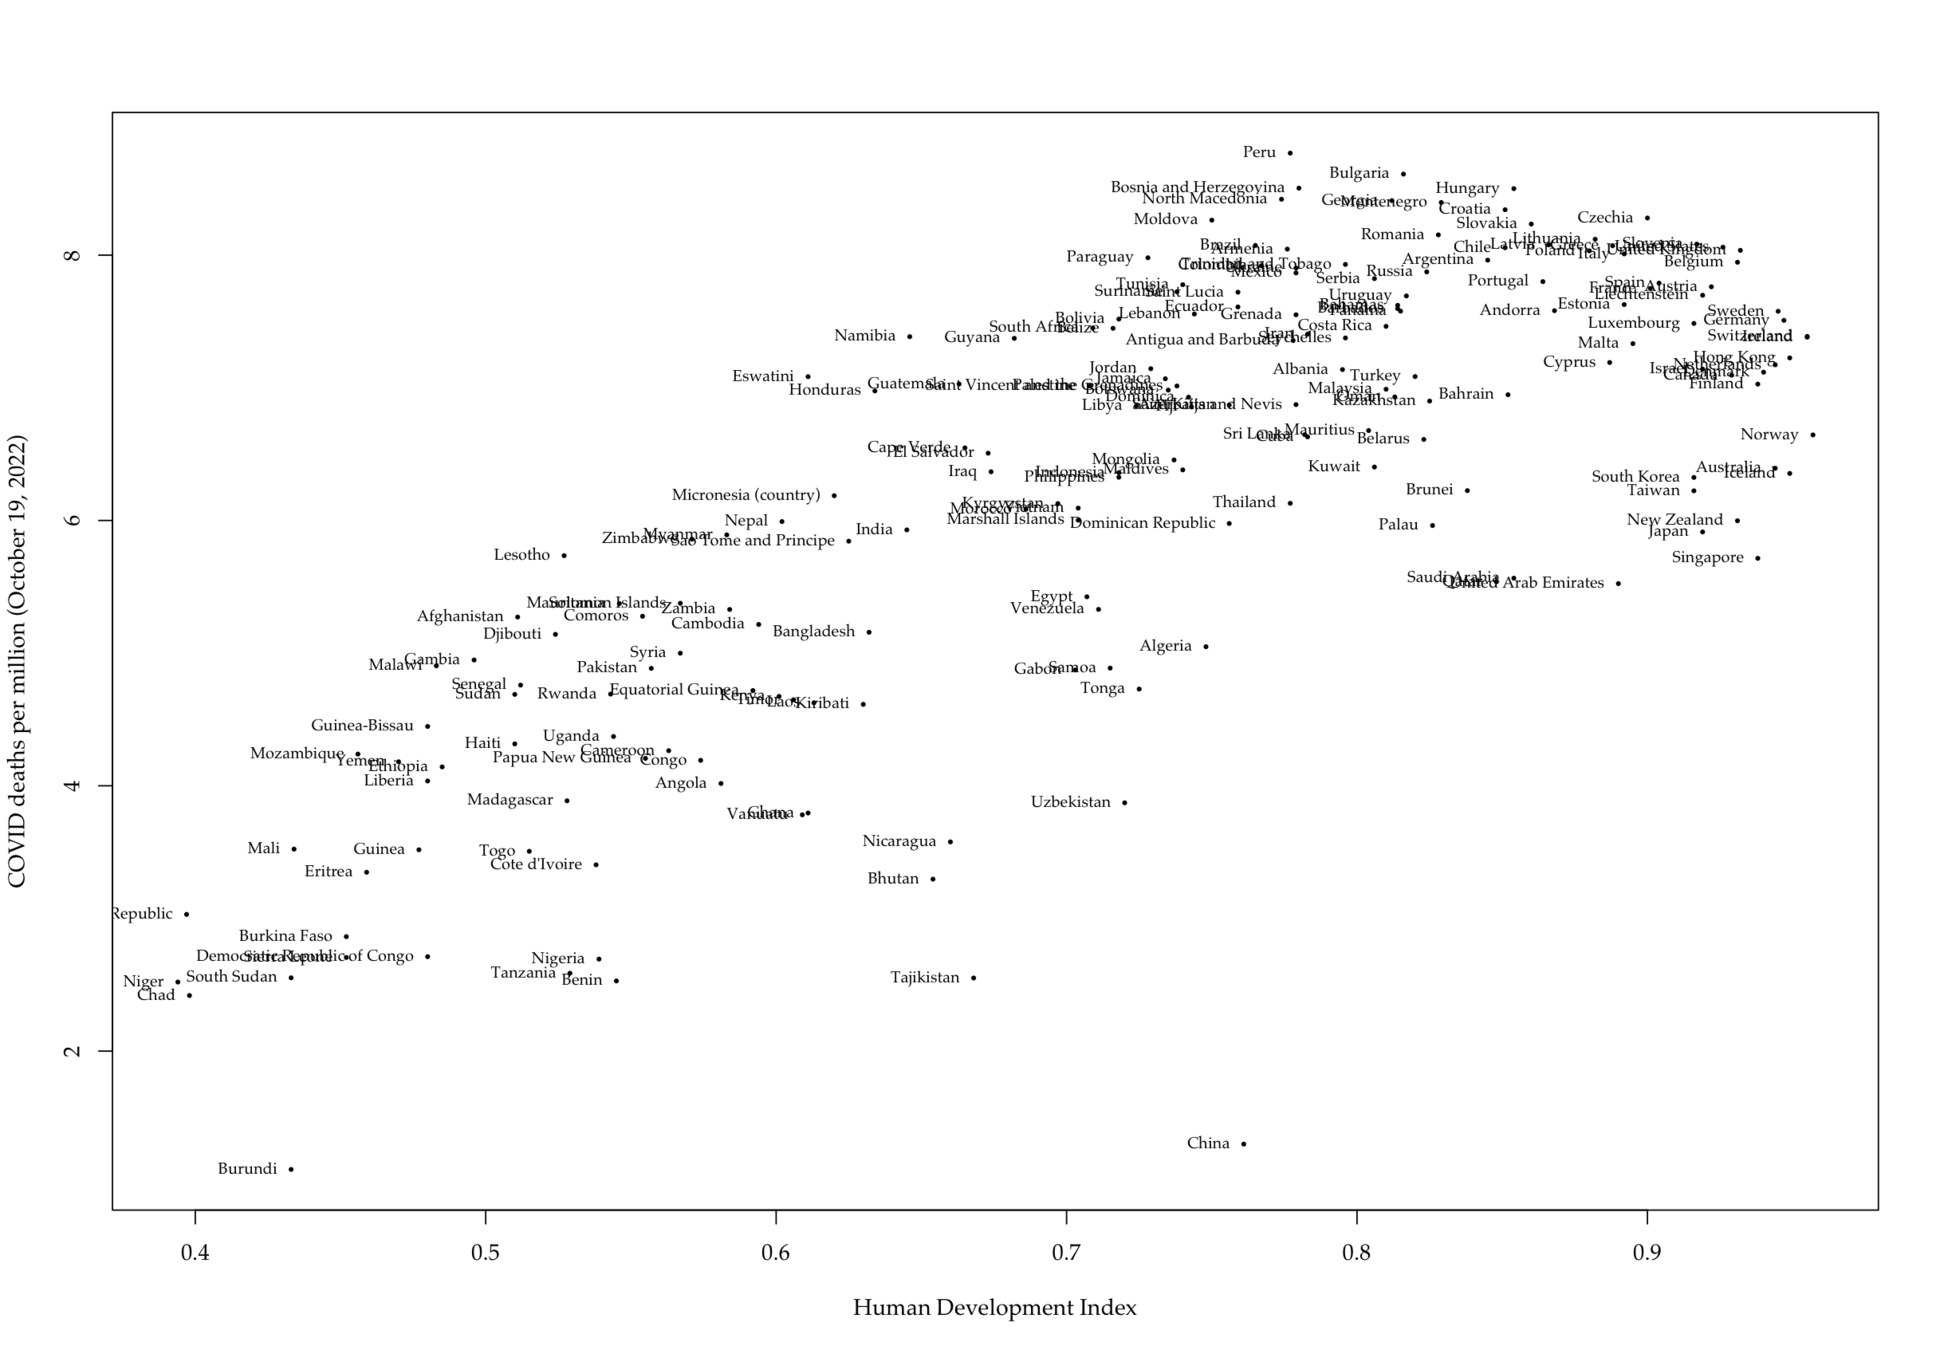
Khazaei, Zaher et al. 2020. “COVID-19 Pandemic in the World and Its Relation to Human Development Index: A Global Study.” Archives of Clinical Infectious Diseases 15(5). https://brief.land/archcid/articles/103093.html (May 25, 2022).

Leeuw, Jan de, Kurt Hornik, and Patrick Mair. 2009. “Isotone Optimization in R : Pool-Adjacent-Violators Algorithm (PAVA) and Active Set Methods.” Journal of Statistical Software 32(5). http://www.jstatsoft.org/v32/i05/ (April 10, 2022).

Satyadev, Nihal et al. 2022. “Machine Learning for Predicting Discharge Disposition After Traumatic Brain Injury.” Neurosurgery 90(6): 768–74.

Tibshirani, Robert. 1996. “Regression Shrinkage and Selection Via the Lasso.” Journal of the Royal Statistical Society: Series B (Methodological) 58(1): 267–88.

Tibshirani, Ryan J., Holger Hoefling, and Robert Tibshirani. 2011. “Nearly-Isotonic Regression.” Technometrics 53(1): 54–61.


References

Barlow, R. E., and H. D. Brunk. 1972. “The Isotonic Regression Problem and Its Dual.” Journal of the American Statistical Association 67(337): 140–47.

Zelazo, P. R., Zelazo, N. A., & Kolb, S. (1972). " Walking" in the Newborn. Science, 176(4032), 314-315.

Silvapulle, M. J., & Sen, P. K. 2011. Constrained statistical inference: Order, inequality, and shape constraints (Vol. 912). John Wiley & Sons.
Robertson, T., & Wright, F. T., Dykstra, R. L 1988. Order restricted statistical inference. Wiley Series in Probability and Mathematical Statistics: Probability and Mathematical Statistics. John Wiley & Sons, Ltd., Chichester.


References

Conclusion and discussion

  • The other possible suspect is the generally free and democratic system, which makes implementation of highly stringent measures difficult compared to authoritarian regimes.

  • This study employs isotonic regression with machine learning methods to identify possible distinct types of countries in terms of COVID vulnerability and development index.  

  • This grouping practice works better than other smoothed methods to make monotonic predictions in mid range of the predictor distribution, which could present higher level of variability.

  • This grouping concept and method can be useful for agencies and IGO's to design and implement more effective, group-specific policy and epidemiological measures.

Future research

  • We start off this research using a new combination of methods (AML and Isotonic regression).

  • For the next steps, a fuller set of models segregating three different groups of countries for analysis is warranted.  

  • More work can be done on estimating time series models of trajectory of the COVID cycle in each group of countries.  In that case, we can delve further into how COVID vaccine's efficacy can help in each country's recovery from the pandemic. 

  • Other variables such as economic and demographic can be considered.

Isotonic regression: Motivation

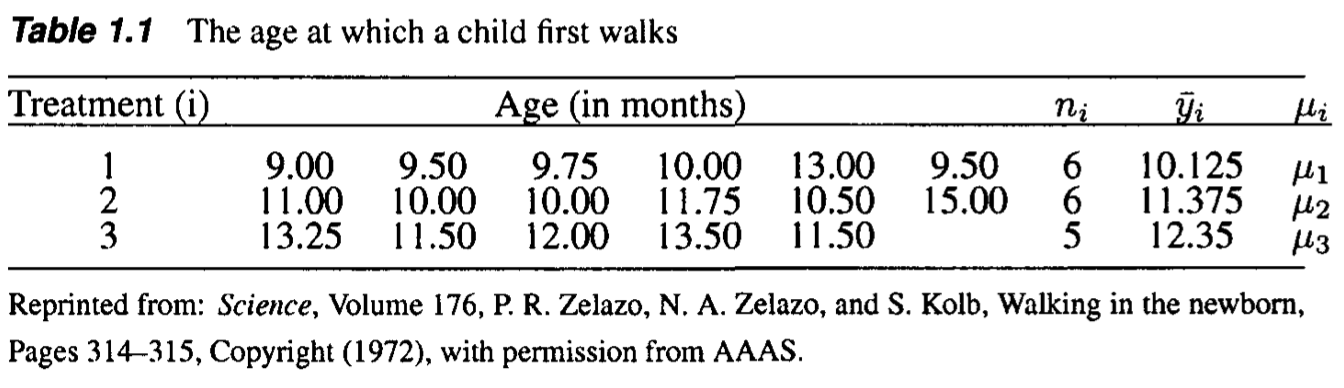
Evaluate the effect of exercise on the age at which a child starts to walk.

  1. The first treatment group received a special walking exercise for 12 minutes per day
  2. The second group received daily exercises but not special exercises.
  3. Control group. They did not receive any exercises or other treatments.

Q: \(\mu_1=\mu_2=\mu_3\)

holds assuming \(\mu_1\leq \mu_2 \leq \mu_3\)?

Isotonic regression: MLE (WLS)

The traditional ANOVA does not work because the maximum likelihood estimators (sample means) say \(\hat{\mu}_1 = \overline{Y}_1, \hat{\mu}_2=\overline{Y}_2,\) and \(\hat{\mu}_3 = \overline{Y}_3\), do not have to satisfy the trend \(\mu_1\leq\mu_2\leq\mu_3\). One should take the natural trend into account in the MLE (least-squares equivalently), that is, 

\[(\tilde{\mu}_1, \tilde{\mu}_2, \tilde{\mu}_3 ) = \arg\min_{\mu_1\leq \mu_2\leq\mu_3}\sum_{i=1}^3\sum_{j=1}^{n_i} (Y_{ij} -\mu_i)^2 \]

where \(Y_{ij}\stackrel{iid}{\sim} N(\mu_i,\sigma^2)\) for \(j=1,\ldots,n_i\). Then \(\tilde{\mu}_1\leq \tilde{\mu}_2 \leq \tilde{\mu}_3\) (hurestically, equal means will be rejected when  the overall mean \(\overline{Y}_\cdot\) under \(\mu_1=\mu_2=\mu_3\) are too different from \(\tilde{\mu}_1, \tilde{\mu}_2, \tilde{\mu}_3\).)

If \(\sigma^2\) varies, consider the weighted least squares (WLS):

\[(\tilde{\mu}_1, \tilde{\mu}_2, \tilde{\mu}_3 ) = \arg\min_{\mu_1\leq \mu_2\leq\mu_3}\sum_{i=1}^3\sum_{j=1}^{n_i} (Y_{ij} -\mu_i)^2 w_i \]

where \(Y_{ij}\stackrel{iid}{\sim} N(\mu_i,\sigma_i^2)\), \(w_i = n_i/\sigma_i^2\), and \(\tilde{\mu}_1\leq \tilde{\mu}_2 \leq \tilde{\mu}_3\), too. 

Isotonic regression: Computation

In fact, in the weighted least squares, it suffices to optimize

\[(\tilde{\mu}_1, \tilde{\mu}_2, \tilde{\mu}_3 ) = \arg\min_{\mu_1\leq \mu_2\leq\mu_3}\sum_{i=1}^3(\overline{Y}_i -\mu_i)^2 w_i\]

where \(\overline{Y}_i\stackrel{iid}{\sim} N(\mu_i,\sigma_i^2/n_i)\) and \(w_i = n_i/\sigma_i^2\), i=1,2,3. 

  1. If \( \overline{Y}_1\leq\overline{Y}_2\leq\overline{Y}_3 \),  satisfying the increasing constrain, then \( (\tilde{\mu}_1, \tilde{\mu}_2, \tilde{\mu}_3) \) =  \( (\overline{Y}_1, \overline{Y}_2, \overline{Y}_3)\). 
  2. If \(\overline{Y}_2\leq \overline{Y}_1 \leq \overline{Y}_3\), where \(\overline{Y}_1\) and \(\overline{Y}_2\) violate the constrain, then \[\tilde{\mu}_1 = \tilde{\mu}_2 = \frac{\overline{Y}_1w_1 + \overline{Y}_2w_2}{w_1 + w_2}, \tilde{\mu}_3 = \overline{Y}_3,\] such that \(\tilde{\mu}_1\leq \tilde{\mu}_2\leq \tilde{\mu}_3\). 
  3. For other cases, repeatedly averaging means with weights until satisfying the increasing constrain. 

Above algorithm is the Pool Adjacent Violators Algorithm (PAVA)

Isotonic regression with covariates

Consider a conditional mean function \(\mu\) with \(\mu_i = \mu(x_i)\), and \(\mu(x)\) is increasing in \(x\), we can include the covariate \(x_i\) in isotonic regression model. For example, assume that \(Y_{ij}\stackrel{iid}{\sim} N(\mu(x_i),\sigma_i^2)\), where \(x_1\leq\ldots\leq x_n\),  the MLE of \(\mu_i = \mu(x_i)\) is given by 

\[(\tilde{\mu}_1, \ldots, \tilde{\mu}_n ) = \arg\min_{\mu_1\leq\ldots\leq\mu_n}\sum_{i=1}^n(\overline{Y}_i -\mu_i)^2 w_i\]

where \(w_i = n/\sigma_i^2\). In this case, 

  1. the estimator function \(\tilde{\mu}\) satisfying that \(\tilde{\mu}(x_i) = \tilde{\mu}_i\);
  2. the function \(\tilde{\mu}\) does not have to be linear;
  3. assume that \(\tilde{\mu}\) is a step function to fill up the gaps between \(x_i\);
  4. \(\tilde{\mu}\) and only jumping at some \(x_i\); 
  5. some \(x_i\) and corresponding intervals share the same mean \(\tilde{\mu}(x_i)\). 

Isotonic regression: Bernoulli Dist.

When \(Y_{ij}\stackrel{iid}{\sim}\) Bernoulli\((p(x_i))\), or \(\sum_{j=1}^{n_i}Y_{ij}\sim\)Binomial\( (n_i, p(x_i)) \) with \(0\leq p(x_i) \leq 1\) and \(p\) is increasing with \(p_i=p(x_i)\), the likelihood can be optimized similarly because

\[(\tilde{p}_1, \ldots, \tilde{p}_n ) = \arg\max_{p_1\leq \ldots\leq p_n}\prod_{i=1}^n p_i^{\sum_{j=1}^{n_i} Y_{ij}}(1-p_i)^{n_i-\sum_{j=1}^{n_i} Y_{ij}}\]

\[ = \arg\min_{p_1\leq \ldots\leq p_n}\sum_{i=1}^n (\overline{Y}_i - p_i)^2 n_i. \]

  1. the estimator function \(\tilde{p}\) satisfying that \(\tilde{p}(x_i) = \tilde{p}_i\) for all \(i\);
  2. the function \(\tilde{p}\) does not have to be linear (logistic regression);
  3. assume that \(\tilde{p}\) is a step function to fill up the gaps between \(x_i\);
  4. \(\tilde{p}\) only jumps at some \(x_i\); 
  5. some \(x_i\) and corresponding intervals share the same probability \(\tilde{p}(x_i)\). 

Isotonic regression: Poisson Dist.

When \(Y_i\sim\) Poisson\((\lambda(x_i)T_i)\), \(\lambda(x_i) > 0\), where \(Y_i\) is the number of occurences in a Poisson process within time \([0,T_i]\) and hazard rate \(\lambda(x)\) is increasing in \(x\), then 

\[(\tilde{\lambda}_1, \ldots, \tilde{\lambda}_n ) = \arg\max_{\lambda_1\leq \ldots\leq\lambda_n}\prod_{i=1}^n \left\{ \frac{(\lambda_i T_i)^{Y_i}\exp(-\lambda_i T_i)}{Y_i !} \right\}\]

\[ = \arg\min_{\lambda_1\leq \ldots\leq\lambda_n}\sum_{i=1}^n (g_i - \lambda_i)^2 w_i , \]

  1. the estimator function \(\tilde{\lambda}\) satisfying that \(\tilde{\lambda}(x_i) = \tilde{\lambda}_i\) for all \(i\);
  2. the function \(\tilde{\lambda}\) does not have to be linear (Poisson regression);
  3. assume that \(\tilde{\lambda}\) is a step function to fill up the gaps between \(x_i\);
  4. \(\tilde{\lambda}\) only jumps at some \(x_i\); 
  5. some \(x_i\) and corresponding intervals share the same hazard \(\tilde{\lambda}(x_i)\). 

where \(w_i = T_i\) and \(g(x_i) = Y_i/T_i\), for \(i=1,\ldots,k\). 

Isotonic regression: Summary

In summary,

  1. one can apply isotonic regression with covariates to some exponential families, for example, normal, binomial, and Poisson distributions;
  2. PAVA algorithm is usually faster than traditional quadratic programming; 
  3. step functions are applied to fill up the gaps of mean, probability, or hazard between covariates;
  4. covariates with the same estimated mean, probability, or hazard are naturally groped.

Isotonic regression in ML

The last point motivates this study: if a natural tendency of the target function, such as mean, probability, or hazard, is expected, the isotonic regression provides naive options of partitioning or grouping of covariates in terms of the relationship between the target function and the covariates, which will be helpful in classifying and clustering (this cannot be achieved by linear regression or other smoothed models.) 

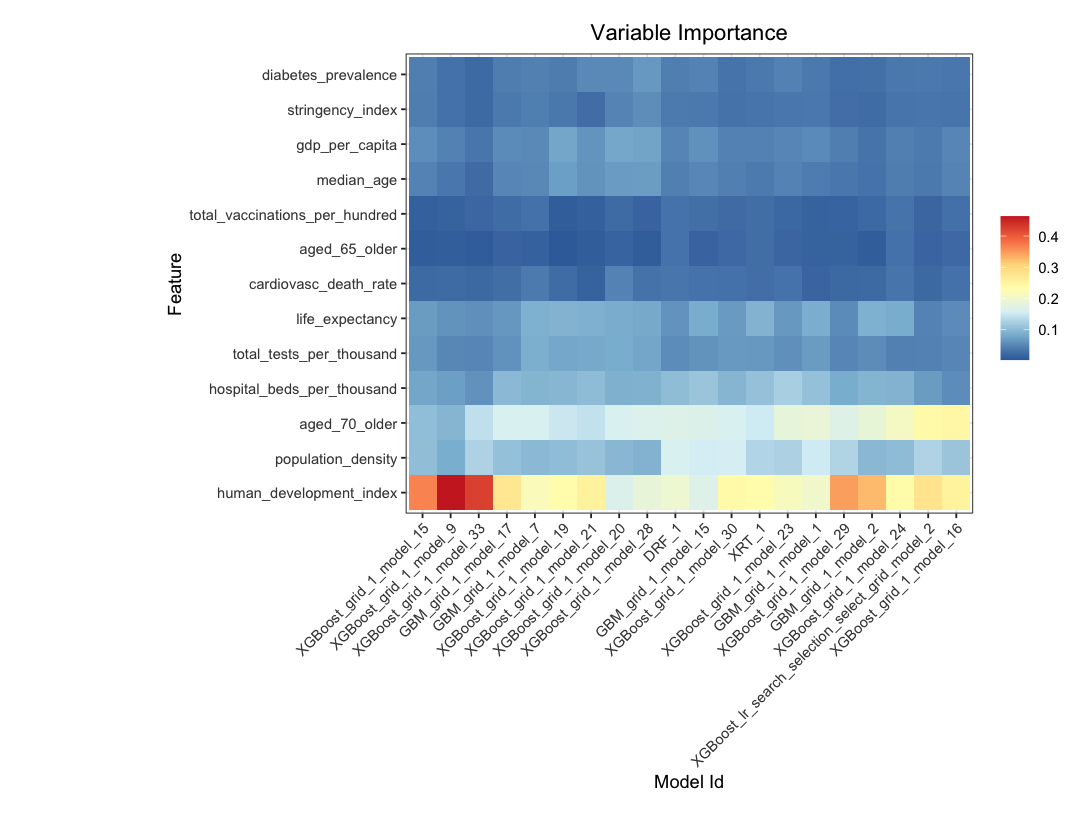
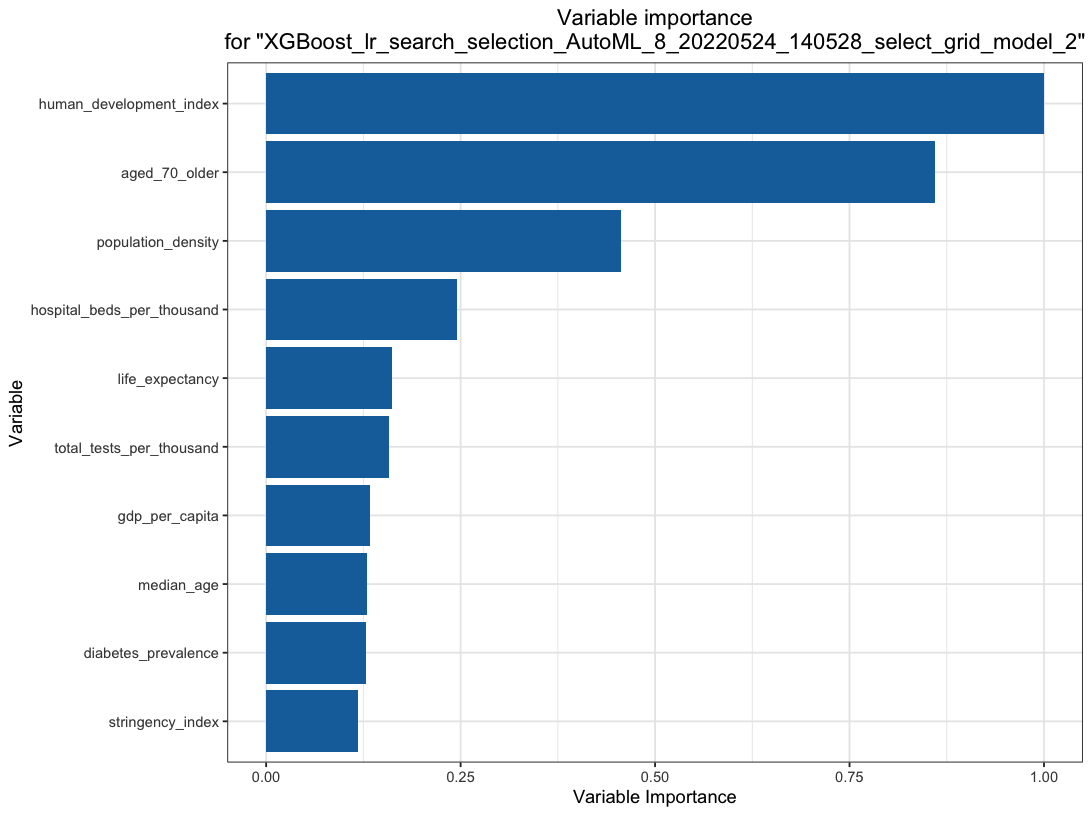
Q: What are the important covariates corresponding to the target function?
Machine learning can help! 

Trilateral Relationship: COVID: Taiwan and the World

By Karl Ho

Trilateral Relationship: COVID: Taiwan and the World

  • 157