Economic Consequences of Unrecognized States
Evidence from Nagorno-Karabakh in Azerbaijan
Masayuki Kudamatsu
15 June 2018

Unrecognized states in former Soviet Union (1/5)

When Soviet Union broke up into 15 republics in 1991...
4 wars of secession broke out in 3 newly independent republics
Unrecognized states in former Soviet Union (2/5)

Image source: http://www.economist.com/node/3110979
Secessionists won the war, declaring independence
Unrecognized states in former Soviet Union (3/5)
What are the "frozen conflicts"? (4/5)
But...
not a single country around the world
recognized them as sovereign states
Image source: http://www.economist.com/node/3110979
They remain unrecognized until today
(Russia recognized Abkhazia & South Ossetia in 2008)
Unrecognized states in former Soviet Union (5/5)
What is the impact
of being unrecognized as a state
on economic activities?
Research question
Lack of data
Empirical challenge

DHS Survey areas
for Moldova in 2005

Solution
Use of satellite images

Estimation strategy
Spatial Regression Discontinuity
Why should we care?
Reason #1 for why we should care
Unrecognized states are not uncommon
Not recognized by any
Transnistria (1991-present)
Nagorno-Karabakh (1994-present)
Somaliland (1991-present)
Recognized by a few
Taiwan (1971-present)
Northern Cyprus (1974-present)
South Ossetia (1992-present)
Abkhazia (1993-present)
Recognized by many but not all
Kosovo (1999-present)

Since 2014, two more unrecognized states in Ukraine
Interest appears to be slowly emerging even in Japan


What aspect of states
promote development?
Recent literature's focus:
State Capacity
Besley and Persson (2009, 2011)
Acemoglu, Garcia-Jimeno, and Robinson (2015)
etc.
This study:
International recognition
Reason #2 for why we should care
Unrecognized states = A result of civil wars
But so far ignored
in the (emerging) academic literature
on the impact of civil wars
It's an ignorable part
of the impact of civil wars
Reason #3 for why we should care
We have two contributions to this literature...
Contribution #1: Deal with sample selection bias
Literature finds that output loss is temporary
Davis and Weinstein (2002) on bombs in Hiroshima & Nagasaki
Miguel and Roland (2011) on Vietnam wars
Cerra and Saxena (2008) on cross-country panel regressions
These findings may be due to sample selection bias (Blattman and Miguel 2010)
Unrecognized states
is an example of out-of-the-sample cases
Unrecognized states
is a political "institution" relevant for post-conflict recovery
Contribution #2:
Role of Political Institutions
in post-conflict recovery
cf. Casey et al. (2012) on post-conflict Sierra Leone

Road Map
Potential Consequences of non-recognition
Background on Nagorno-Karabakh
Data
Empirical Strategy
Validity Checks
Main Results
Potential consequences
of non-recognition
Cost of Non-recognition
Foreign direct investment
& International NGOs' support
Military expenditure
Kolsto (2006)
65 soldiers per 1,000 inhabitants
in Nagorno-Karabakh (International Crisis Group 2005)
e.g.
For Kosovo to be recognized as a state,
the UN introduced the "Standards before status" policy.
2003
Incentive for other unrecognized states
to build a functional state
Benefit of Non-recognition
e.g.
In 2016, Freedom House ranks
Nagorno-Karabakh
Azerbaijan
as Not Free
as Partly Free
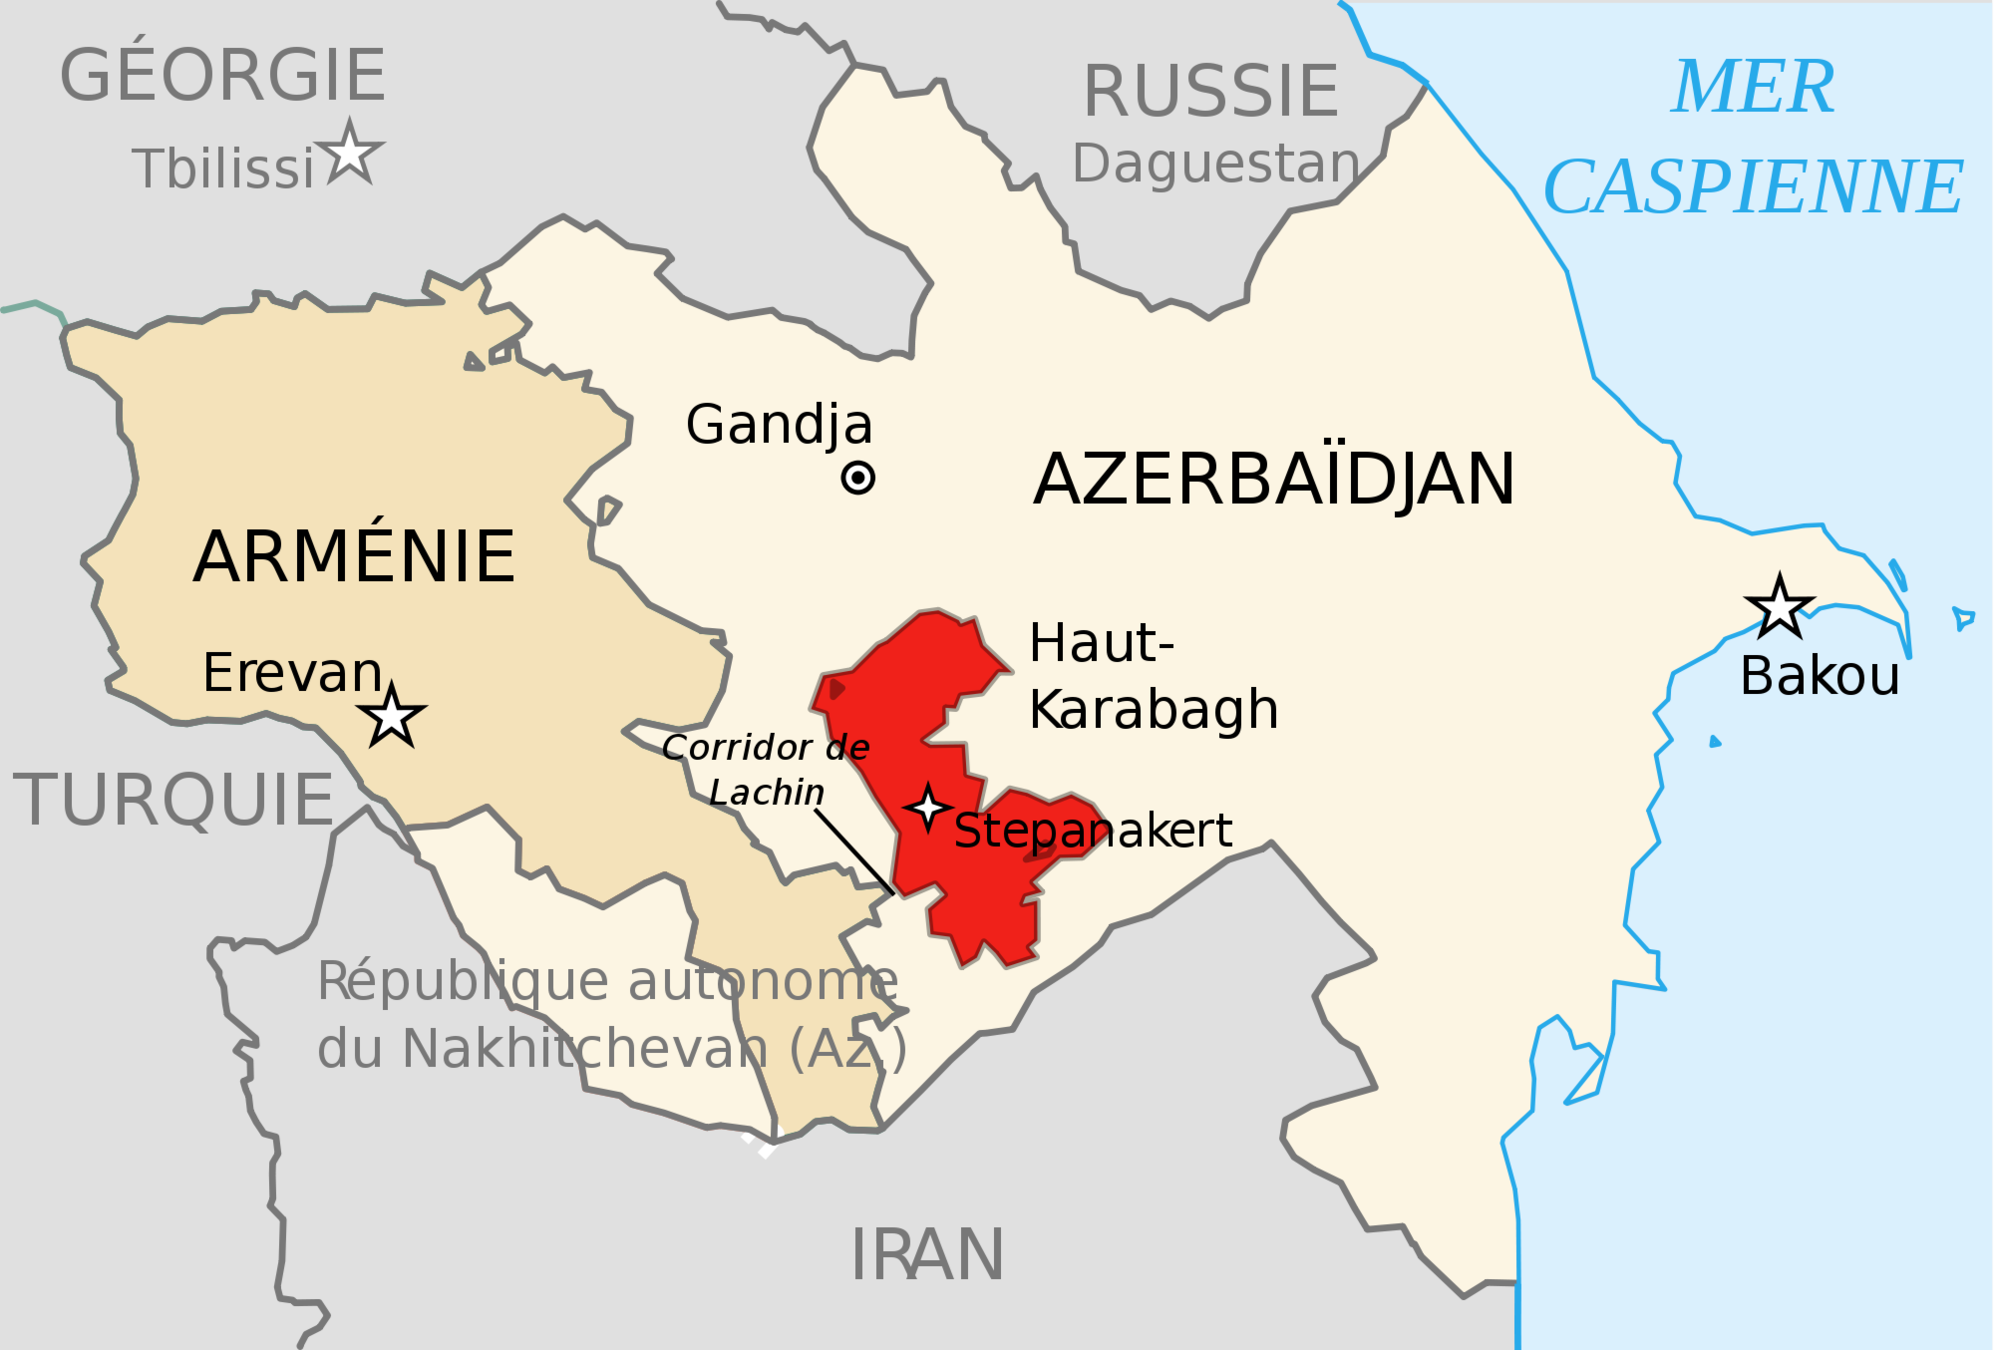
Background on Nagorno-Karabakh
Nagorno-Karabakh:
Armenian enclave within Azerbaijan

Azerbaijanis
Armenians
Source:
Atlas Narodov Mira (1964)
Cultural differences
Armenians
Christian (Armenian Orthodox)
Armenian language
Azerbaijanis
Muslim (85% Shia; 15% Sunni)
A Turkish language
1923: Nagorno-Karabakh Autonomous Oblast
Created by Soviet Union
with the border drawn from scratch
Source: Wikimedia Commons
1923: Nagorno-Karabakh Autonomous Oblast
Made part of Azerbaijan, not of Armenia, because (de Waal 2013: 144-145)
Source: Wikimedia Commons
1. Moscow wanted to appease Azeris, to control their oil fields
2. Economic consideration overrode ethnic integration
Azerbaijan's Soviet-era policies
on Nagorno-Karabakh
Encouraging the migration of Azerbaijanis
| 1926 | 1979 | |
|---|---|---|
| Armenians | 117,000 | 123,000 |
| Azerbaijanis | 13,000 | 37,000 |
Population by ethnicity in Nagorno-Karabakh (de Waal 2013: 153-154)
Neglecting the Armenian culture
No Armenian-language television
Armenian history not taught in Armenian-language schools
Medieval Armenian churches closed and crumbling
1991: Collapse of Soviet Union
Azerbaijan declared independence from Soviet Union
Sept 2
Aug 30
Karabakh declared its secession from Azerbaijan
Dec 10
Karabakh voted yes at a referendum on independence
1992-1994: War of Secession

1992-1994: War of Secession

1992-1994: War of Secession

1992-1994: War of Secession

1992-1994: War of Secession

This map is
not completely
accurate, though
Boundary of Nagorno-Karabakh
= 1994 Ceasefire Line
Source: Wikimedia Commons

(different from the Soviet-era autonomous oblast boundary)
What determines the 1994 ceasefire line?
"Defensible border" for Karabakh against Azerbaijani forces
The 1994 ceasefire line is "remarkably similar" to
what the Karabakh leader (Artur Mkrtchian) sketched out
as "defensible frontiers" in the winter of 1991
(de Waal 2013: 240)
To minimise the length of the front line
Ever since 1994, the ceasefire line is heavily fortified
"the most militarized zone in Europe" (Thomas de Waal)
Consequences of Secession War
Death toll: around 35,000
480,000 Azerbaijanis displaced
from the occupied part of Azerbaijan
300,000 Armenians displaced
from the rest of Azerbaijan

Ethnically homogenized
on both sides of the border
Political institutions in Nagorno-Karabakh
Presidential and parliamentary elections: regularly held since 1994
Generally deemed free and fair
But the ruling party coalition always won
Media is largely controlled by the government
Freedom House ranks Nagorno-Karabakh as "Partly Free" for 2016
Singapore (127) Malaysia (134) Turkey (142) Armenia (146)
Myanmar (152) Thailand (157) Iraq (163) Egypt (165)
Afghanistan (171) Azerbaijan (188)
151st out of 211 "countries"
Threats to identification
What can be different across the border? (1/3)
Initial level of state capacity
Nagorno Karabakh: zero(?)
Azerbaijan: legacy of Union Republic
New oil fields off the coast of Baku
Extraction began in 1996
2006-2008: oil export boom in Azerbaijan
But does it reach the border zone?
(can be checked by DHS surveys in 2006)
Human capital of Armenians vs Azerbaijanis
Literacy rate is 99.9%
in Soviet Union in 1989 (Mironov 1991)
cf.
Damages during the 1992-94 civil war
Need to focus on the segments of the ceasefire line
drawn in the middle of battle fields
What can be different across the border? (2/3)
Market access
Azerbaijan side has Baku
Possibility of being invaded
Karabakh yes
but Azerbaijan no?
What can be different across the border? (3/3)
Karabakh side has Armenia proper
Data
Map available
Digitized by myself with ArcMap
Data source #1
The 1994 Ceasefire Line
Difference from Natural Earth data

Old
(Natural Earth)
New
Data source #2
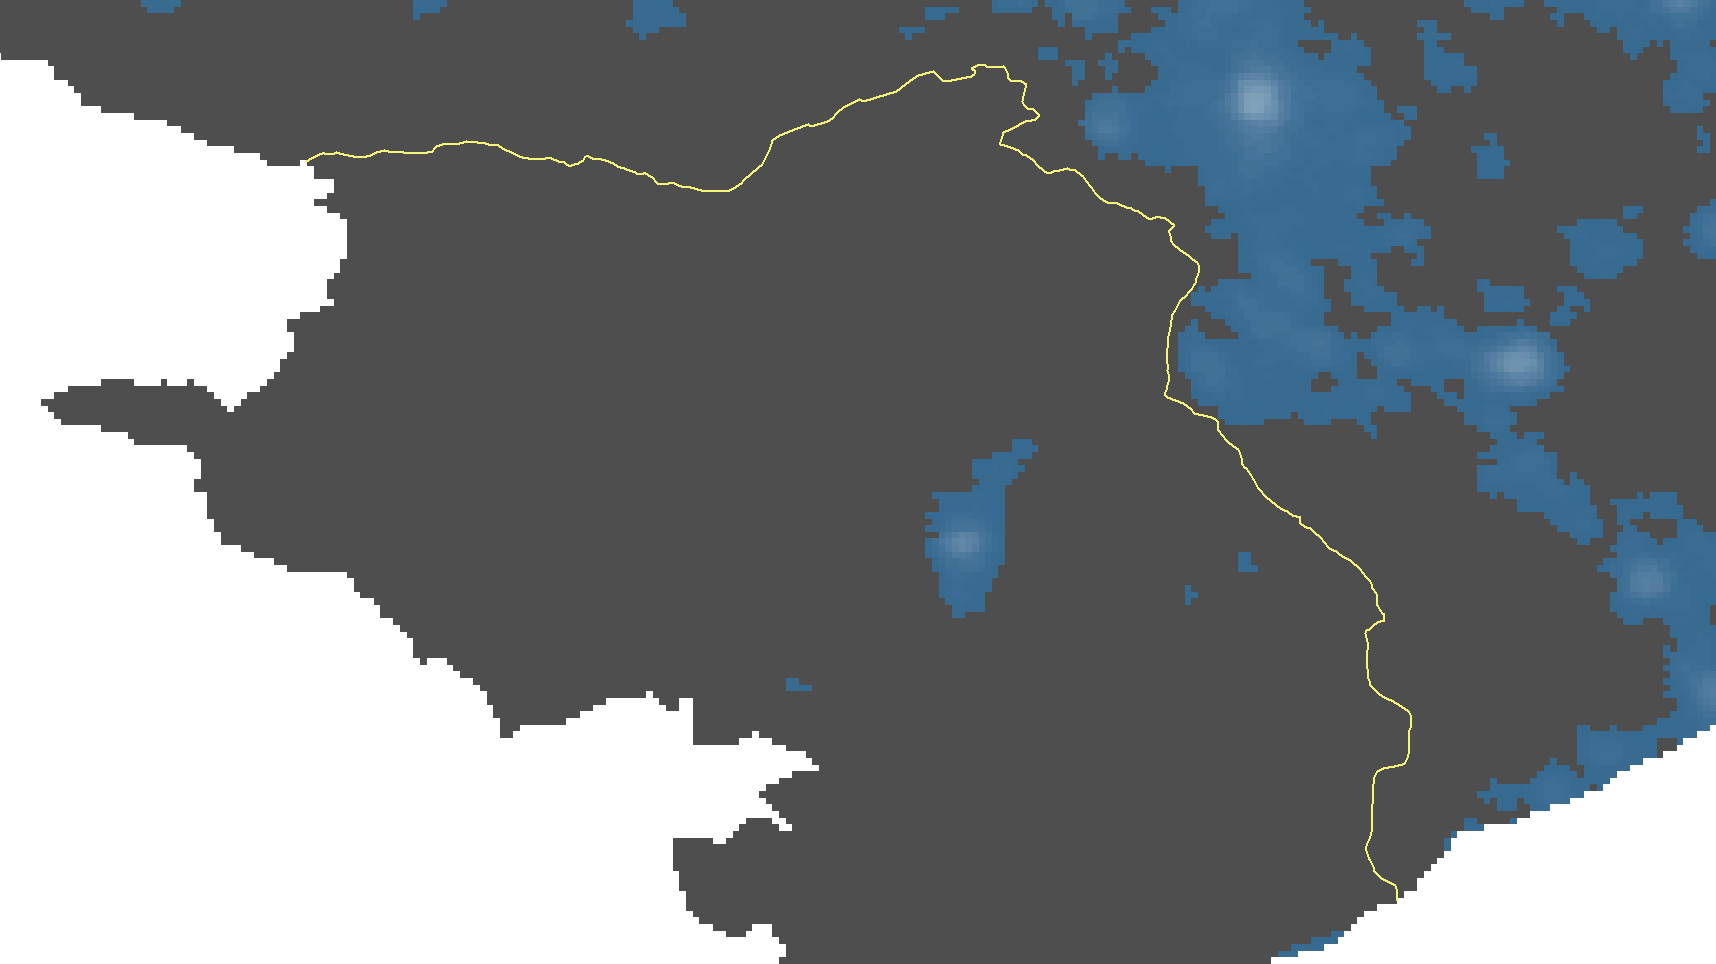
Nighttime light
VIIRS (2015-2016)
DMSP-OLS (1992-2013) used by previous studies in economics
Top-coding
Bottom-
censoring
Blurring
Known issues on DMSP-OLS (not for VIIRS)
30 arc-second (around 1km)
15 arc-second (around 0.5km)
Watt per steradian per square cm (W/cm2*sr)
Digital number 0 to 63
Not
comparable
across years

2015
1992

Data source | DMSP-OLS Nighttime Lights Time Series

Data source | DMSP-OLS Nighttime Lights Time Series
1993

Data source | DMSP-OLS Nighttime Lights Time Series
1994

Data source | DMSP-OLS Nighttime Lights Time Series
1995
Data source | DMSP-OLS Nighttime Lights Time Series
1996

Data source | DMSP-OLS Nighttime Lights Time Series
1997

Data source | DMSP-OLS Nighttime Lights Time Series
1998

Data source | DMSP-OLS Nighttime Lights Time Series
1999

Data source | DMSP-OLS Nighttime Lights Time Series
2000

Data source | DMSP-OLS Nighttime Lights Time Series
2001

Data source | DMSP-OLS Nighttime Lights Time Series
2002

Data source | DMSP-OLS Nighttime Lights Time Series
2003

Data source | DMSP-OLS Nighttime Lights Time Series
2004

Data source | DMSP-OLS Nighttime Lights Time Series
2005

Data source | DMSP-OLS Nighttime Lights Time Series
2006

Data source | DMSP-OLS Nighttime Lights Time Series
2007

Data source | DMSP-OLS Nighttime Lights Time Series
2008

Data source | DMSP-OLS Nighttime Lights Time Series
2009

Data source | DMSP-OLS Nighttime Lights Time Series
2010

Data source | DMSP-OLS Nighttime Lights Time Series
2011

Data source | DMSP-OLS Nighttime Lights Time Series
2012

Data source | DMSP-OLS Nighttime Lights Time Series
2013
Data sources #3:
Covariates (measured at 30 arc-second cell level)
Elevation
Ruggedness
Temperature
Precipitation
Predicted vegetation (biome)
(Temperate broadleaf / Desert)
Distance to coast
Distance to lake (i.e. Caspian Sea)
Distance to port
Distance to river
Henderson et al. (2018) show
these variables predict the spatial distribution of nighttime light
Summary statistics
% of lit cells in 2015
| Nagorno- Karabakh |
Azerbaijan proper |
|
|---|---|---|
| All cells | 3.9 | 21.3 |
| Observations | 70,941 | 420,708 |
| Cells within 10km of border |
2.7 | 24.4 |
| Observations | 13,110 | 14,432 |

Azerbaijan
Nagorno-Karabakh

Azerbaijan
Nagorno-Karabakh
Dashed lines: Cells within 10km of border
Empirical Strategy
Estimation Equation
y_{is} = \beta T_i + \gamma d_i + \delta T_i d_i + \eta_s + \varepsilon_{is}
Indicator of being lit in cell \(i\)
Indicator of being an unrecognized state
Estimation Equation
y_{is} = \beta T_i + \gamma d_i + \delta T_i d_i + \eta_s + \varepsilon_{is}
Distance to the border
(Negative for \(T_i = 0\))
Estimation Equation
T_i = 1
T_i = 0
0
Nagorno Karabakh
Azerbaijan
d_i
y_{is} = \beta T_i + \gamma d_i + \delta T_i d_i + \eta_s + \varepsilon_{is}
Standard practice in the literature
(Lee and Lemieux 2010)
Estimation Equation
Allow distance-outcome relation
to differ across the border
y_{is} = \beta T_i + \gamma d_i + \delta T_i d_i + \eta_s + \varepsilon_{is}
Border segment fixed effect

To make sure comparing k with j, not with i
Estimation Equation
y_{is} = \beta T_i + \gamma d_i + \delta T_i d_i + \eta_s + \varepsilon_{is}
Border segment fixed effect
Estimation Equation
y_{is} = \beta T_i + \gamma d_i + \delta T_i d_i + \eta_s + \varepsilon_{is}
Denote cell \(i\)'s nearest border segment by \(s\)

Estimation Equation
This equation is estimated for each year of 1992-2013 and 2015
Identification in RDD does not require panel estimation
Interested in the dynamics of the impact
y_{is} = \beta T_i + \gamma d_i + \delta T_i d_i + \eta_s + \varepsilon_{is}
Estimation procedure
Start with all locations within Azerbaijan and Nagorno-Karabakh
Find the optimal bandwidth to restrict the sample
Observations far away from the border
are irrelevant to estimate the outcome at the border
For how to choose the optimal bandwidth
we follow Calonico et al. (2014) [ in Stata]
rdrobust
For inference
we also follow Calonico et al. (2014)
Calonico et al. (2014)
When the treatment effect is estimated by local linear regressions,
its confidence interval is approximately correct when
nh^5 \to 0
h: Bandwidth
n: # of observations
To minimize the mean squared error of the estimator
the bandwidth takes the form of
h^* = cn^{-1/5}
c: constant
Thus, the C.I. with h* is not correct because
n(h^*)^5 \nrightarrow 0
1
2
3
Calonico et al. (2014) (cont.)
Estimate the bias in the RD estimator
Subtracting the estimated bias from the RD estimator
Correct the variance of the RD estimator
by taking into account the finite sample variability
in the estimated bias
Validity checks
Data sources #3:
Covariates (measured at 30 arc-second cell level)
Elevation
Ruggedness
Temperature
Precipitation
Predicted vegetation (biome)
(Temperate broadleaf / Desert)
Distance to coast
Distance to lake (i.e. Caspian Sea)
Distance to port
Distance to river
Henderson et al. (2018) show
these variables predict the spatial distribution of nighttime light
Terrain
| Elevation |
Ruggedness | |||
|---|---|---|---|---|
| In Karabakh | 36.02 | 18.26** | ||
| (28.27) | (6.92) | |||
| Optimal bandwidth | 7804.8 | 11751.8 | ||
| Observations | 5444 | 8033 |


Climate
| Temperature | Precipitation | |||
|---|---|---|---|---|
| In Karabakh | -0.16 | 0.24 | ||
| (0.15) | (0.27) | |||
| Optimal bandwidth | 7182.5 | 6671.5 | ||
| Observations | 5020 | 4664 |


Predicted vegetation (Biome)
| Broadleaf |
Desert | |||
|---|---|---|---|---|
| In Karabakh | -0.01 | 0.01 | ||
| (0.01) | (0.01) | |||
| Optimal bandwidth | 8571.0 | 8549.9 | ||
| Observations | 5944 | 5925 |


Trade cost
| Distance to |
Coast | Lake | Port | River |
|---|---|---|---|---|
| In Karabakh | -139.25 | -57.12 | -180.60 | 106.30 |
| (523.00) | (553.75) | (521.33) | (523.19) | |
| Optimal bandwidth | 11684.8 | 7811.4 | 12500.8 | 9785.9 |
| Observations | 7991 | 5449 | 8519 | 6733 |


Ruggedness at cell \(ij\)
\equiv \sqrt{\sum_{i=x-1}^{x+1} \sum_{j=y-1}^{y+1} (e_{ij}-e_{xy})^2}
\(e_{xy}\): elevation at cell \((x, y)\)
e_{ij}
e_{i-1,j}
e_{i+1,j}
e_{i+1,j-1}
e_{i,j-1}
e_{i-1,j-1}
e_{i,j+1}
e_{i-1,j+1}
e_{i+1,j+1}
Data source | SRTM30
Ruggedness

Image template

Findings
for 2015
2015
Image template

Image template

Being lit in 2015
| Local polynomial | Linear |
Quadratic | ||
|---|---|---|---|---|
| In Karabakh | 0.01 | -0.00 | ||
| (0.01) | (0.01) | |||
| Optimal bandwidth | 2814.2 | 6941.8 | ||
| Observations | 8071 | 19403 |
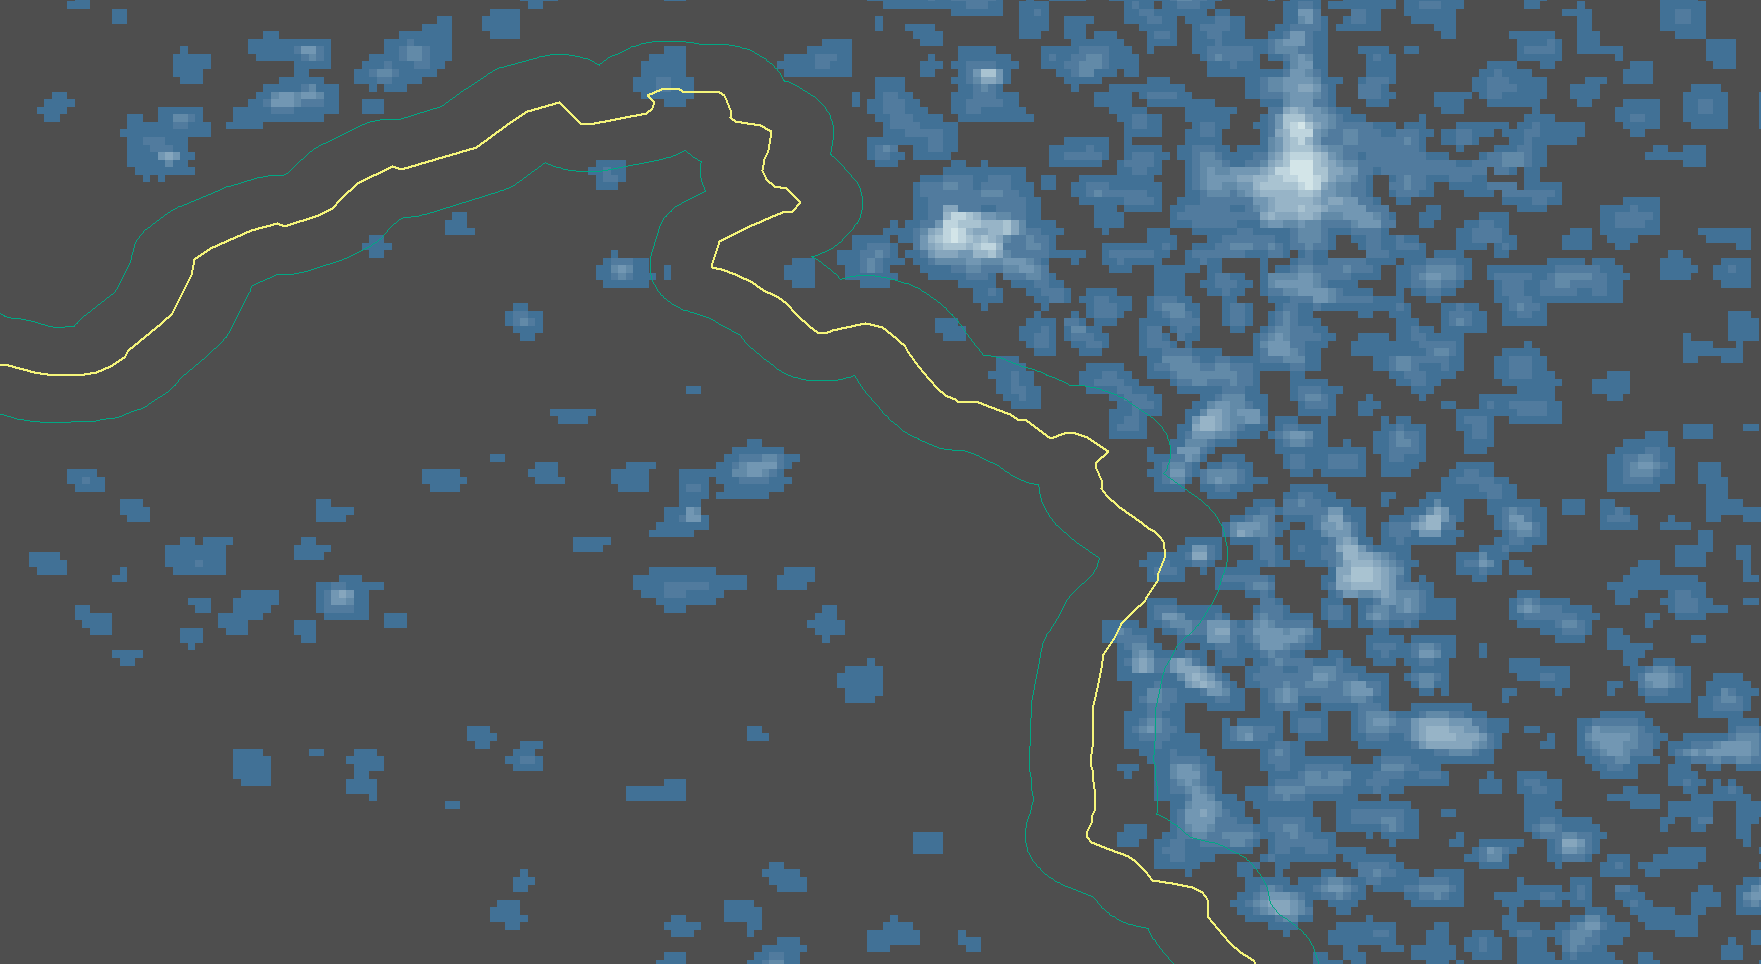
2015 (north-east)
Findings
for 1992-2013
Bandwidth choice for 1992-2013
Optimal bandwidth for each year
Median optimal bandwidth for all years
Fixed bandwidths for all years
1
2
3
From 5106.43 to 14435.77 meters
7450.34 meters
2500, 5000, 10000 meters


Data source | DMSP-OLS Nighttime Lights Time Series
2012
Data source | DMSP-OLS Nighttime Lights Time Series
2013
Bandwidth choice for 1992-2013
Optimal bandwidth for each year
Median optimal bandwidth for all years
Fixed bandwidths for all years
1
2
3
From 5106.43 to 14435.77 meters
7450.34 meters
2500, 5000, 10000 meters


Data source | DMSP-OLS Nighttime Lights Time Series
1995


What goes wrong?
Issue #1
Measurement error of the border
Solution to Issue #1
Google Map

Issue #2
RD design
for discrete dependent variable
Issue #3
External validity
The area around the border: different from the rest of the country
e.g. Cab drivers dim their lights at night, to avoid Armenian sniper fire from a few kilometers away
Gunfire and occasional shell explosions are routine for frontline residents, with up to 200 people killed each year
In frontline areas the Azeri government retains ownership of all land and artesian wells for irrigation
farmers cannot take loans from banks because they have no land to put down as collateral.
Source: EurasiaNet (2007)
Mail me your comments to m.kudamatsu@gmail.com
Frozen Conflicts: The Impact of Unrecognized States on Post-conflict Recovery (Version 3.0 for OEIO Workshop)
By Masayuki Kudamatsu


