SESSION 3


Infographics
and Data Visualization
for beginners
Wednesday 24th November, 2021
Laura Navarro & Storydata

- Types of graphs
- Choosing the right one
-
Recommended literature:
An Economist’s Guide to Visualizing Data -Jonathan A. Schwabish .
- Presentation of Flourish
- Kinds of graphs and stories
- Creation of a graph

Infographics and Data Visualization
Structure
Theory
Practice
SESSION 3
0.40h
1.20h
Infographics and Data Visualization
SESSION 3

Basic Data Visualizations
Infographics and Data Visualization
SESSION 3
How do formats and styles affect your data?


One Dataset, Visualized 25 Ways

Nathan Yau
One dataset, 25 graphs

This compares trends over time and for each country
One dataset, 25 graphs
This shows countries separetly so that lines don't overlap

One dataset, 25 graphs
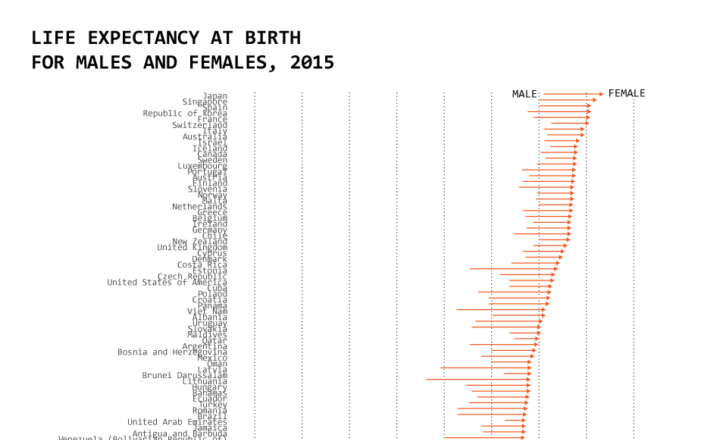
This focus on the difference between two sexes, with comparison across countries
One dataset, 25 graphs
This shows the distribution and also the evolution

One dataset, 25 graphs
This also shows the distribution and the evolution, but it focus on each year

One dataset, 25 graphs
This shows the distribution spread

Infographics and Data Visualization
Getting to the point
SESSION 3
What do you do when you have a lot of data? How should you visualize it? Here’s what you can do:
- Ask the data questions.
- Start with the visualization basics.
-
Focus.
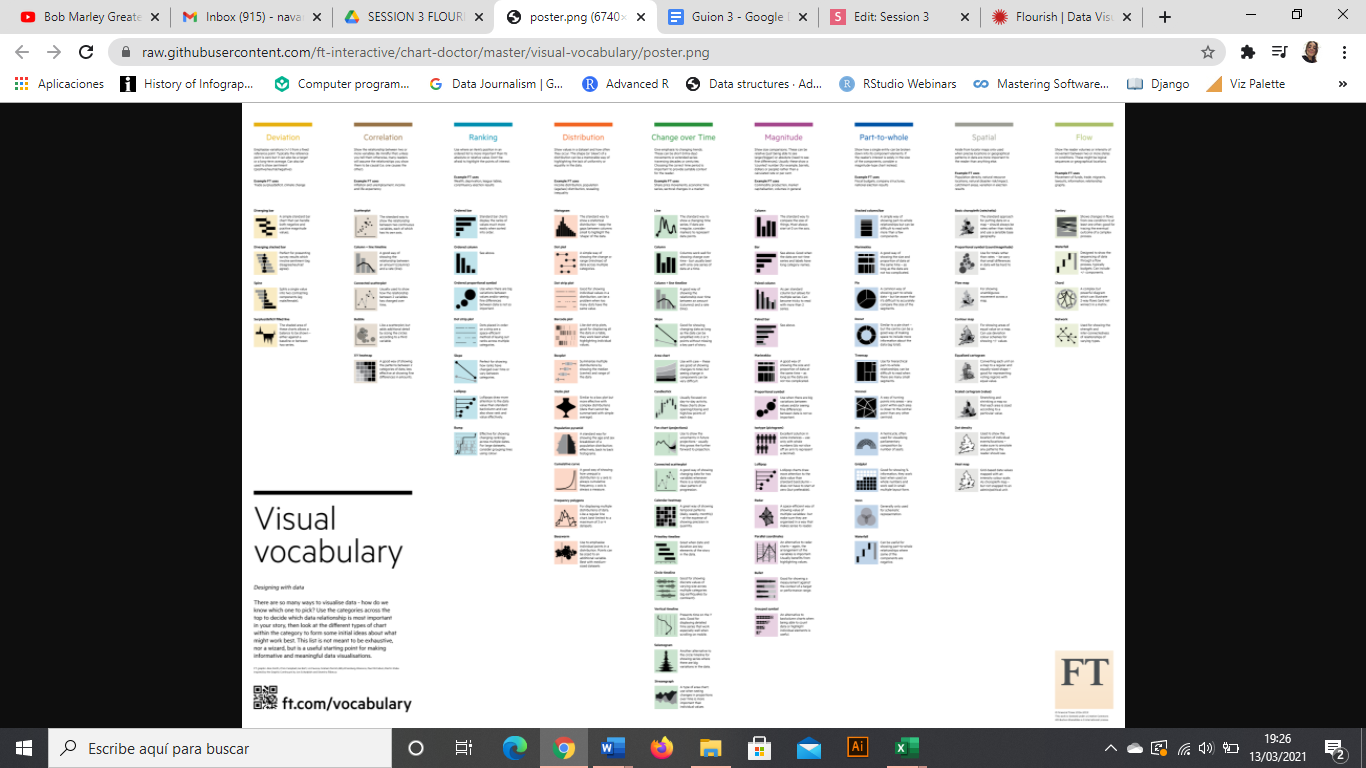
https://ft-interactive.github.io/visual-vocabulary/
Deviation


BAR DIVERGING
BAR DIVERGING-STACKED
SPINE-CHART
BALANCE FILLED LINE
Emphasise variation (+/-)


LINE
COLUMN TIME-LINE
COLUMN-LINE-CHART
SLOPE
AREA
CIRCLE TIME-LINE
Change over time
Changing trends

SCATTERPLOT
COLUMN-TIME-LINE
BUBBLE
XY HEATMAP
SPURIOUS CORRELATIONS
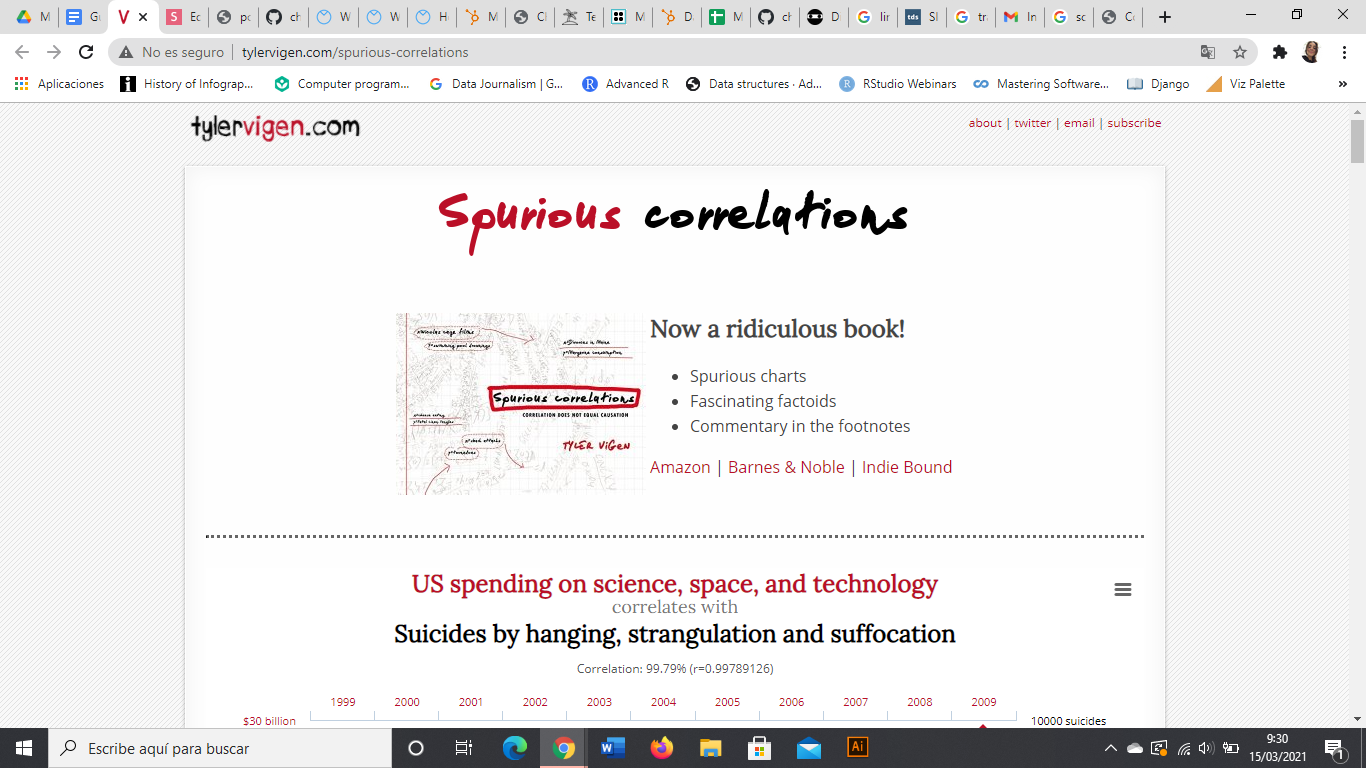
Correlation
show relationship between variables

ORDERED COLUMN
ORDERED BAR
SLOPE
LOLLIPOP

BUMP
Rankings
importance of the position

HISTOGRAM
BOXPLOT
DOT PLOT
PYRAMIDS
Distribution
how often
Infographics and Data Visualization
SESSION 3
Distribution


COLUMN STACKED
PIE CHART
DOUGHNUT
TREEMAP

GRIDPLOT
Part-to-a-whole
show part of a variable to its total


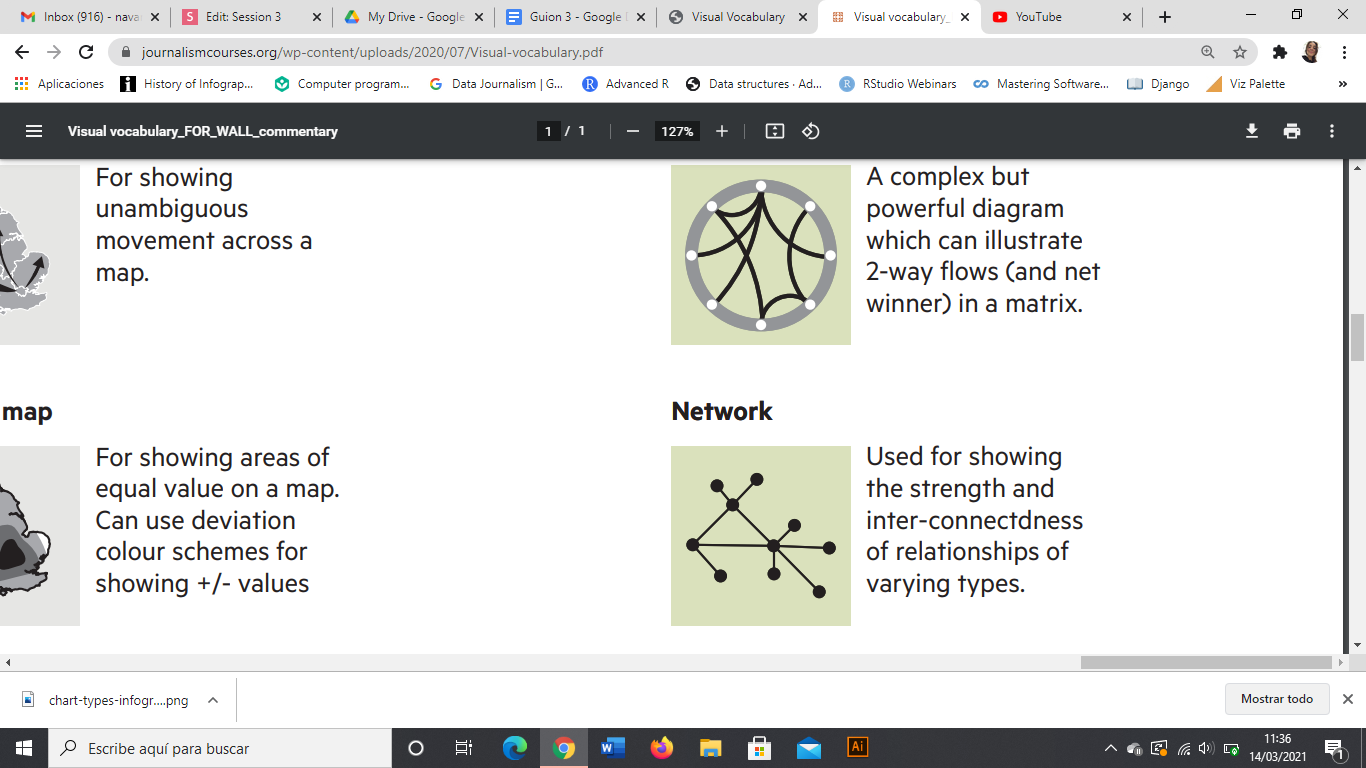
CHOROPLETH
POINTS/DOTS
FLOW
CONTOUR
EQUALISED CARTOGRAM
CARTOGRAM
Spatial
geographical patterns
Infographics and Data Visualization
SESSION 3
Flow

SANKEY
CHORD
NETWORK
Infographics and Data Visualization
SESSION 3

?

Enable accurate estimates
May enable general estimates
Infographics and Data Visualization
SESSION 3

Infographics and Data Visualization
SESSION 3
Infographics and Data Visualization
SESSION 3
Your turn

https://docs.google.com/spreadsheets/d/1iMo-xtqDT72V2ZlplRG5dQyLDb2cI4Oi-50OM0MTUUE/edit?usp=sharing
Data
Infographics and Data Visualization
SESSION 3
navarrosolerlaura@gmail.com
Thank you!
write me
Infographics and Data Visualization
SESSION 3
Line vs. Column


Session 3
By laura_navarro


