SESSION 4


Infographics
and Data Visualization
Wednesday 1th December, 2021
Laura Navarro & Storydata

- Maps to tell stories
- Basic concepts of geocoded data
- Kinds of maps
- Platforms to find geospatial data
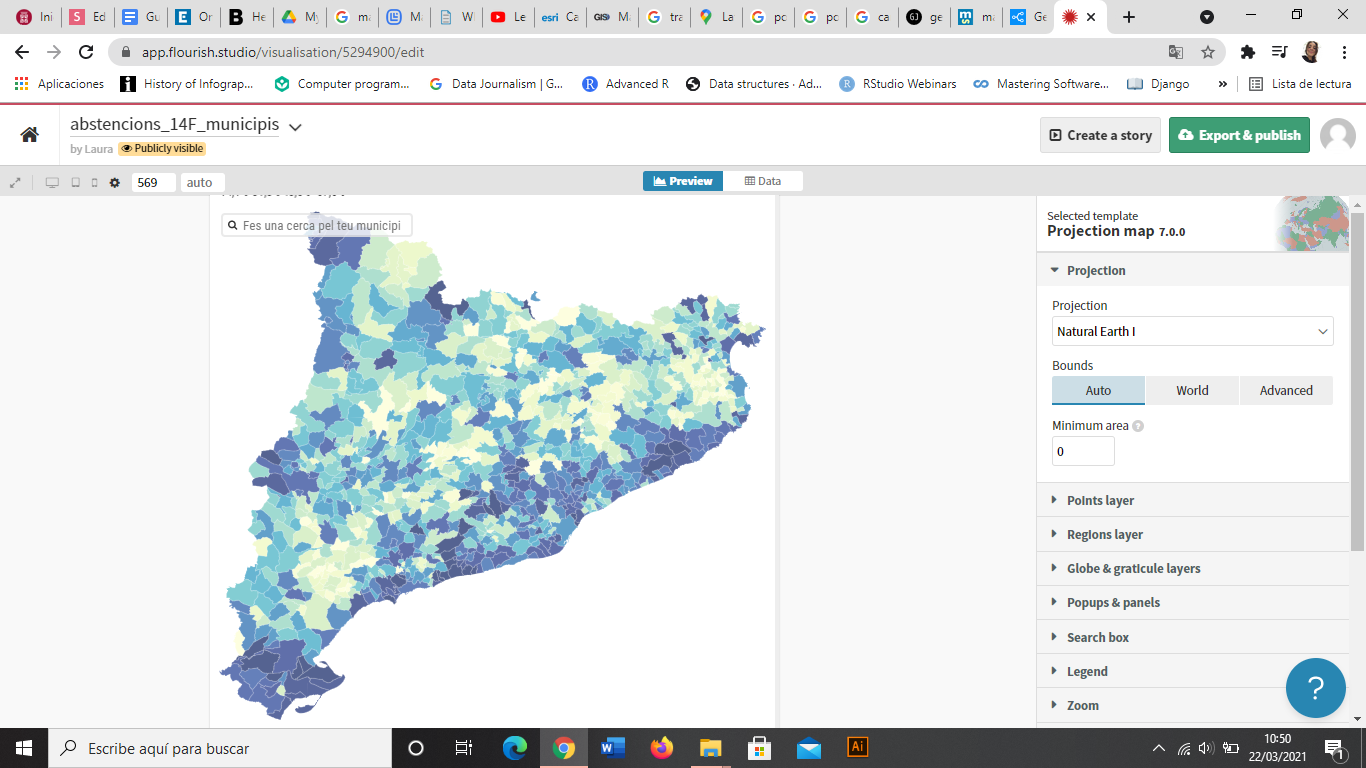
- Flourish: maps
- Regions and points
- Download and share

Infographics and Data Visualization
Structure
Theory
Practice
SESSION 4
1h
1h


Lascaux caves
Infographics and Data Visualization
SESSION 4

Maps that tell stories
John Snow
Infographics and Data Visualization
Maps that tell stories
SESSION 4
Infographics and Data Visualization
Maps that tell stories: data visualization
SESSION 4
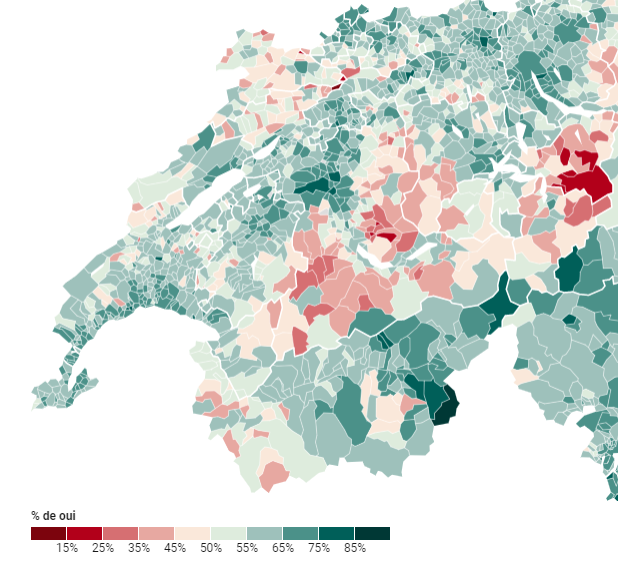
RTS. Radio Television Suisse
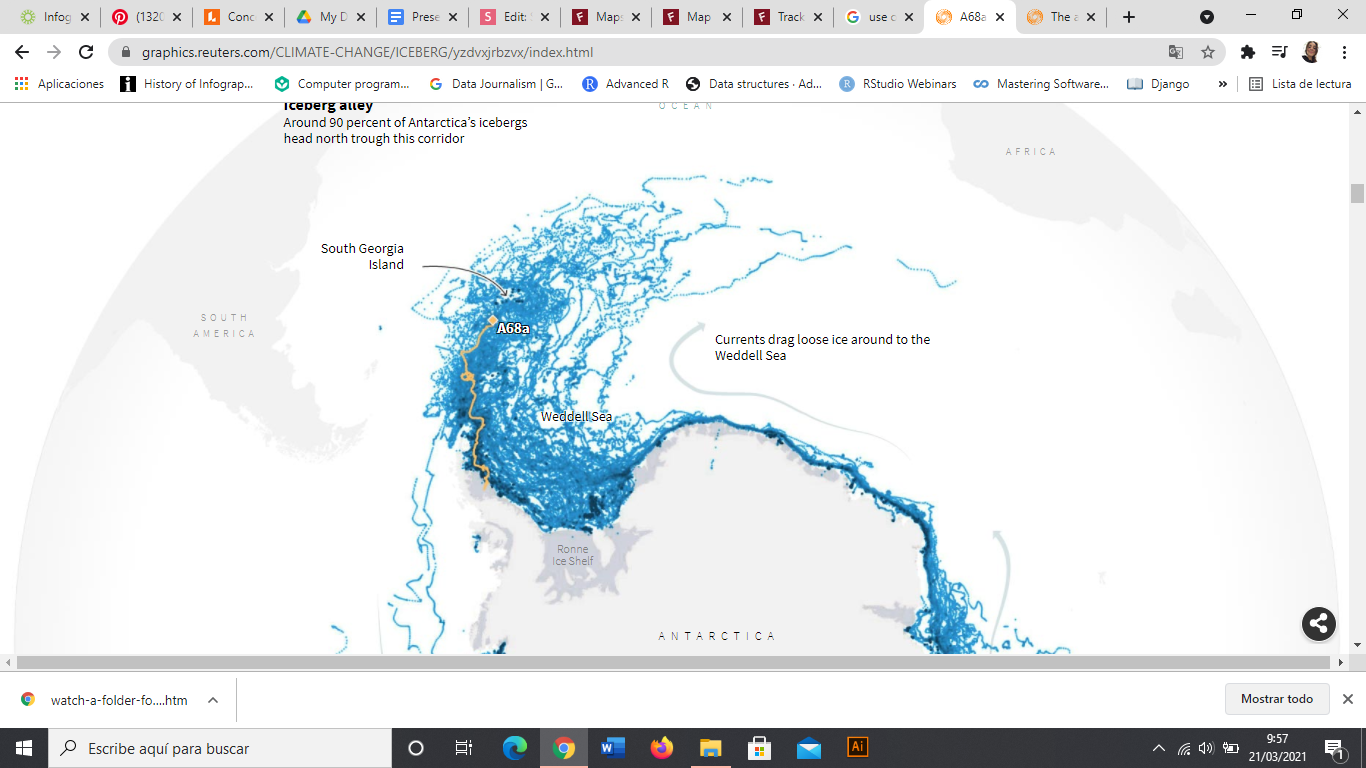
Reuters. World’s biggest iceberg heads for disaster
Maps that tell stories: infographics


Infographics and Data Visualization
SESSION 4
Geospatial data
Infographics and Data Visualization
Basic concepts of geospatial data
SESSION 4
points
some coordinates
regions/polygons
constellation of coordinates

Infographics and Data Visualization
SESSION 4
| Latitude | Longitude | name |
|---|---|---|
| 42.061201860 | -0.490321024 | point1 |
| 38.887787884 | -1.537996281 | point2 |
| 38.696322447 | -9.137571576 | point3 |
| geometry | name |
|---|---|
| polygon | region1 |
| multipolygon | region2 |
| polygon | region3 |
Basic concepts of geospatial data

-0.48576,38.00000;-1.5600786,38.547564;-0.496745634,37.058475, etc.
Infographics and Data Visualization
SESSION 4
Basic concepts of geospatial data
JSON (acronym of JavaScript Object Notation). It is a simple text format for data exchange.

CSV (Comma Separated Values)
TSV (Tabulator Separated Values)
Excel
GeoJSON. The same as JSON but designed for representing vector geometries
Others: XML, KML
SHP (Shapefile)
Basic concepts of geospatial data
Infographics and Data Visualization
SESSION 4
Geospatial data draws dots or shapes, and they store information for each one of these points or regions

Infographics and Data Visualization
SESSION 4
Map types

Dots/Points
Infographics and Data Visualization
SESSION 4
Reuters, World’s biggest iceberg heads for disaster


Choropleth
Infographics and Data Visualization
SESSION 4
Percentage of people who live in less than 20m2, LN

Infographics and Data Visualization
SESSION 4
[17:49]
Infographics and Data Visualization
SESSION 4
Bubble

Bing, Covid-19 cases
Infographics and Data Visualization
SESSION 4
Heat
Indian Anual Average Rainfall Map. Wikimedia

Infographics and Data Visualization
SESSION 4
Flows
Haisam Hussein.

Infographics and Data Visualization
SESSION 4
Hexagonal binning
The Economist. UK Election 2015

Categorical color scales: categories of elements
Sequential color scales: numbers (from low to high)
Diverging color scales: positive, negative and midpoint values


Color palettes
Infographics and Data Visualization
Brief mention to Projection
SESSION 4
· Geographical Institutes websites / Open Data
http://centrodedescargas.cnig.es/CentroDescargas/index.jsp
Geospatial
Data Sources

Your turn
Infographics and Data Visualization
SESSION 4
https://academy.datawrapper.de/article/134-what-to-consider-when-creating-choropleth-maps
What to consider when creating choropleth maps, Datawrapper
https://blog.datawrapper.de/beautifulcolors/
How to pick more beautiful colors for your data visualizations, Lisa Charlotte Rost (Datawrapper)
Outlier Conference 2021, Data Visualization Society
Infographics and Data Visualization
SESSION 4
Thank you!
Categorical color scales: categories of elements

Sequential color scales: numbers (from low to high)

Diverging color scales: positive, negative and midpoint values

Session 4
By laura_navarro


