


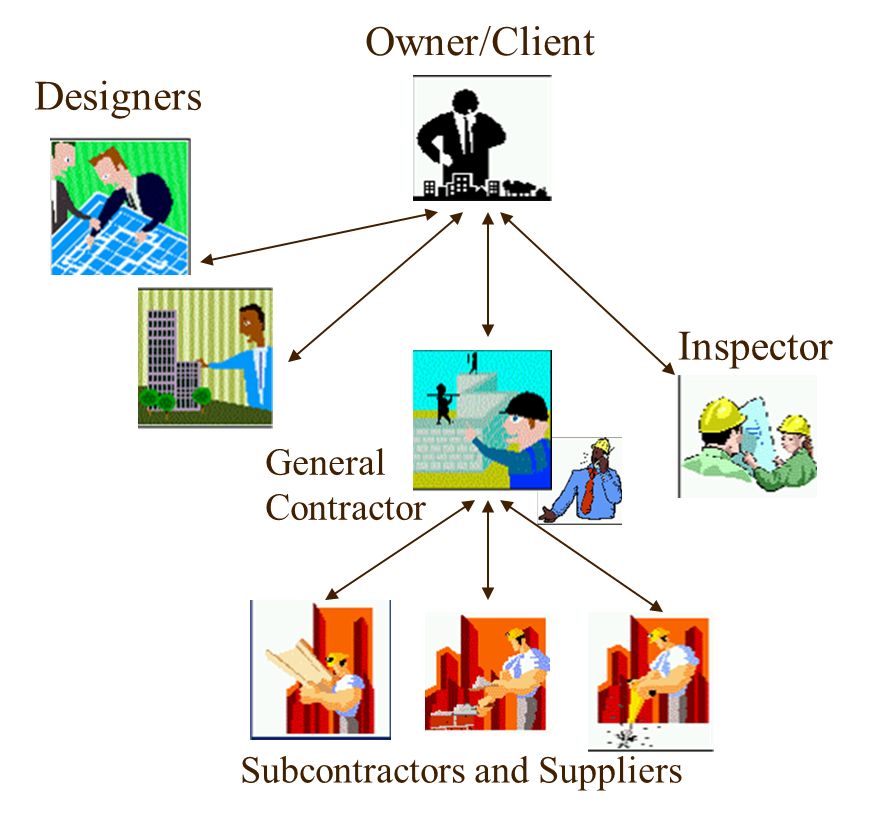


Ling Ma (Lorin)
Lecturer at the University of Huddersfield.
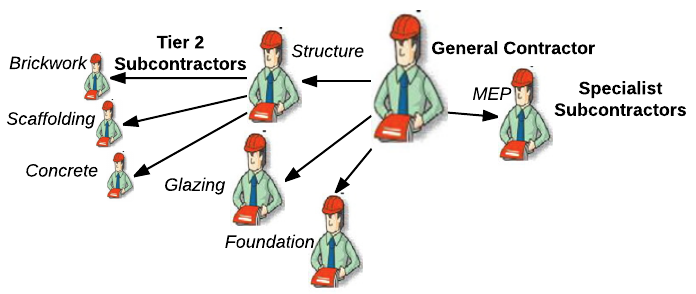
National Building Research Institute
Technion - Faculty of Civil and Environmental Engineering
© Dr. Ling Ma
© Dr. Ling Ma
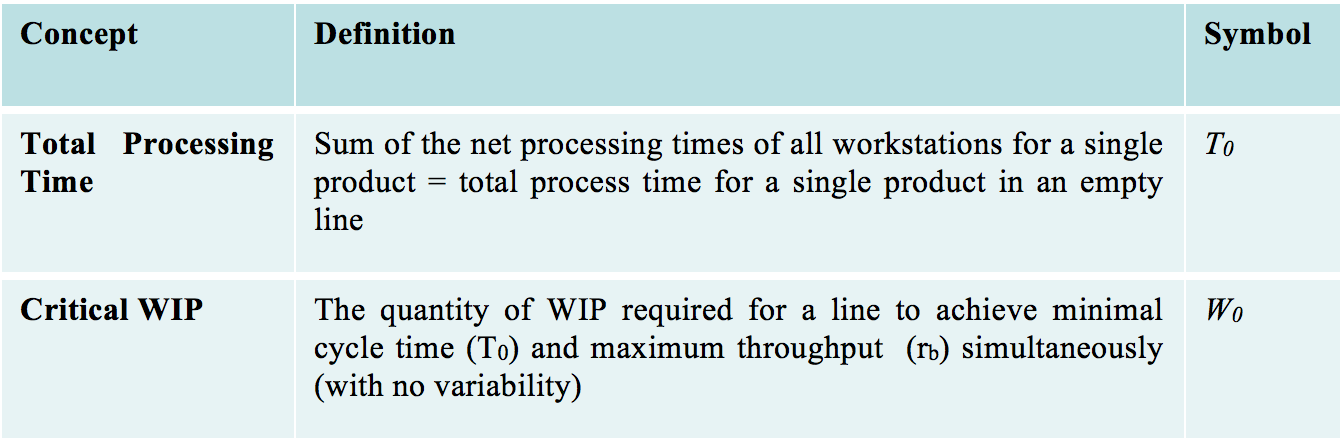
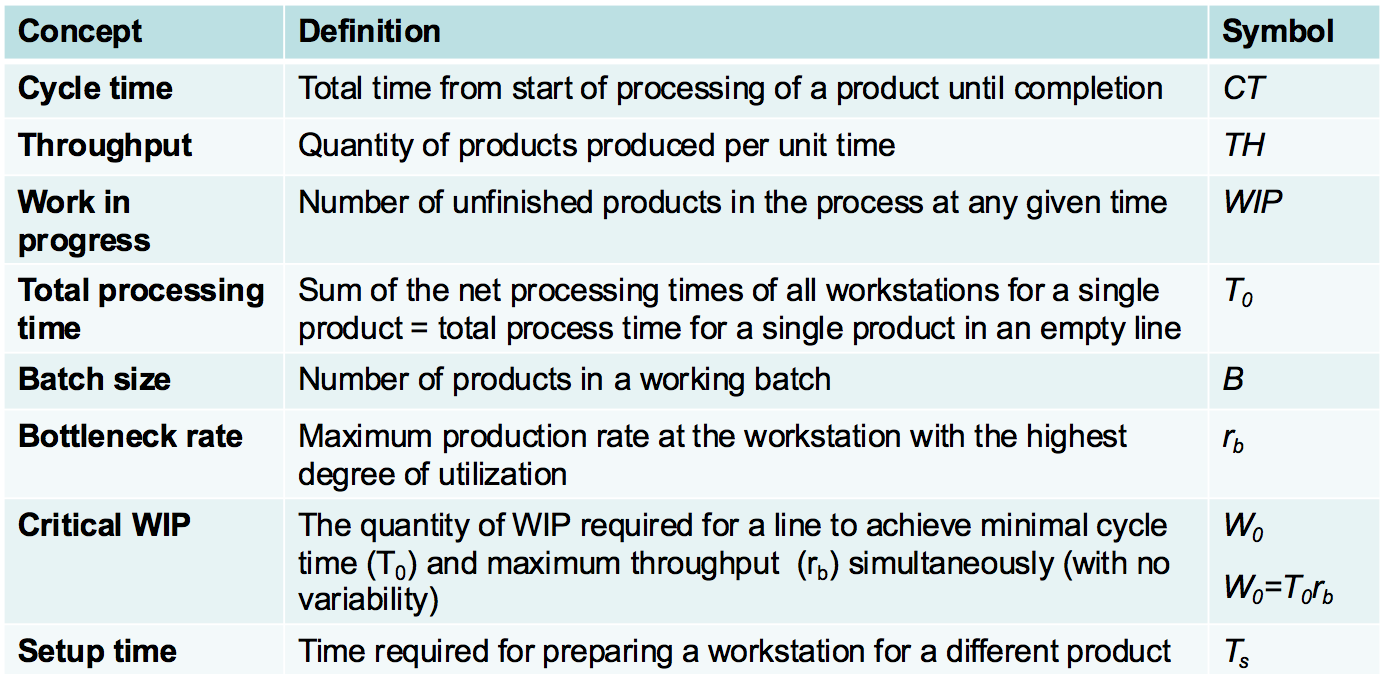
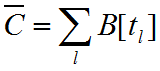
Indicators of success or failure in construction project management?
What does a project manager do in his or her everyday routine?
When would you advice the use of software tools?
© Dr. Ling Ma
© Dr. Ling Ma
© Dr. Ling Ma
Russell Kenley, Olli Seppänen, Location-Based Management for Construction – Planning, Scheduling and Control, Spon Press, London and New York, 2010.
Chris Hendrickson. Project Management for Construction, Department of Civil and Environmental Engineering, Carnegie Mellon University, Pittsburgh, PA I5213 Copyright C. Hendrickson 1998. http://pmbook.ce.cmu.edu/
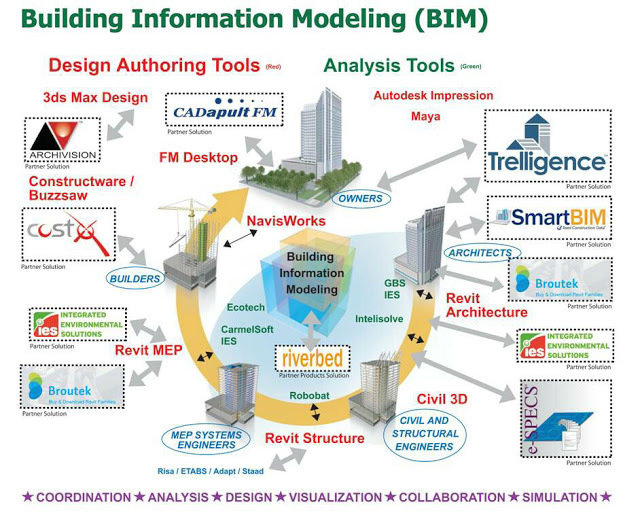
Chuck Eastman, Paul Teicholz, Rafael Sacks, Kathleen Liston. BIM Handbook, John Wiley 2008
© Dr. Ling Ma
Questions?
lingma@technion.ac.il
© Dr. Ling Ma
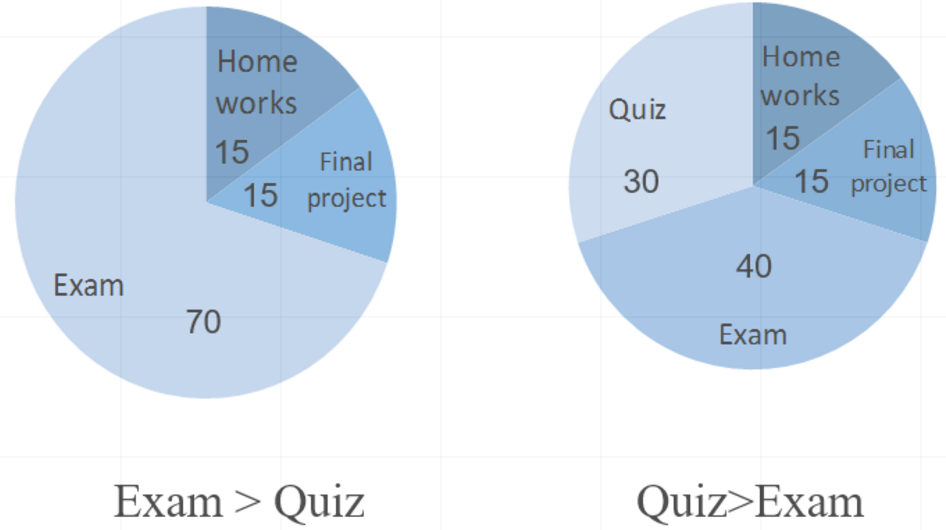
To pass the course
© Dr. Ling Ma
National Building Research Institute
Technion - Faculty of Civil and Environmental Engineering
Features:
© Dr. Ling Ma
Features:
© Dr. Ling Ma
Features:
© Dr. Ling Ma
Features:
© Dr. Ling Ma
© Dr. Ling Ma
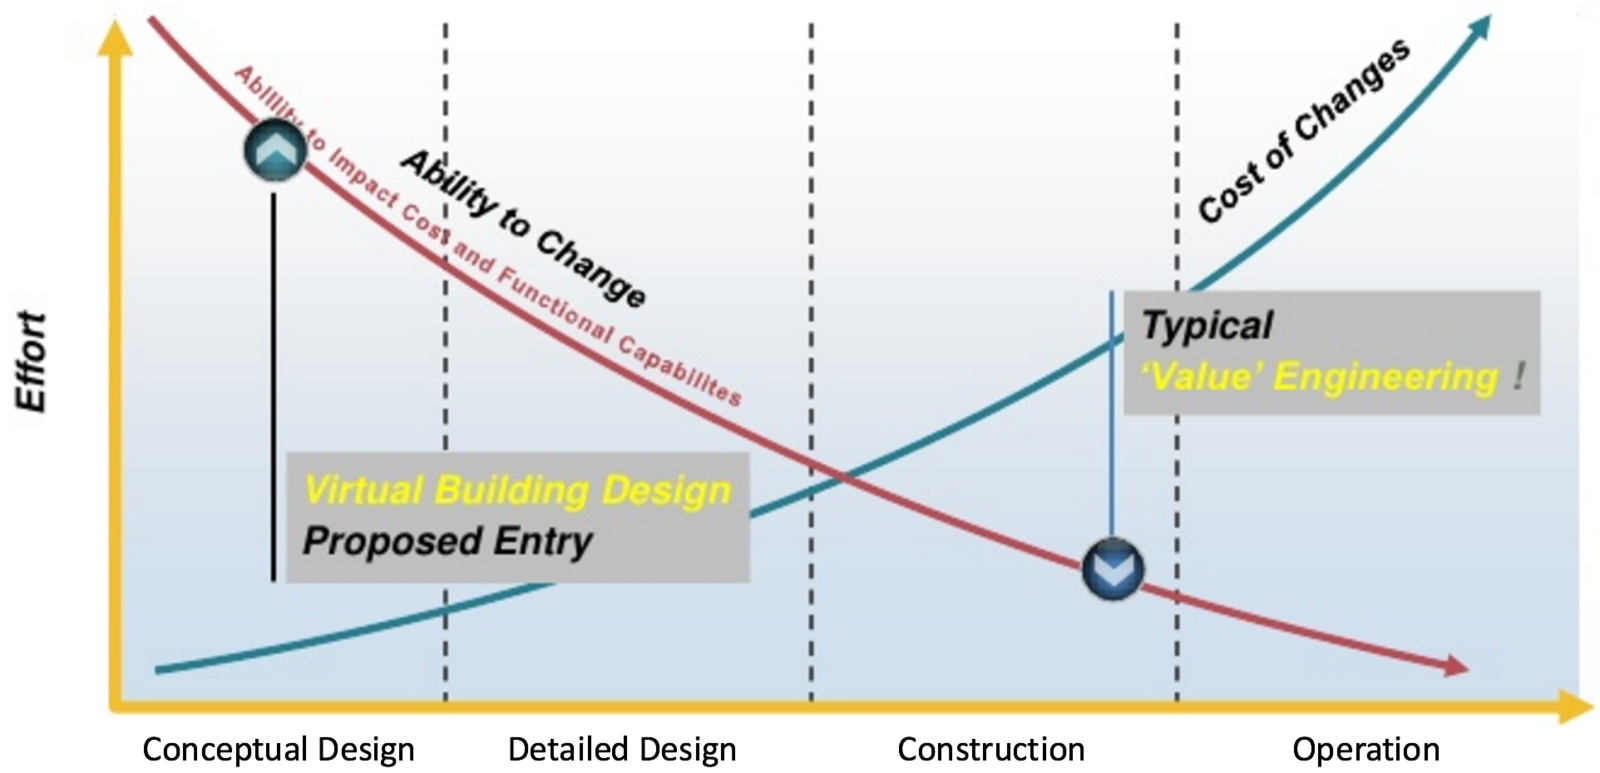
Technology Driven
Organizational Innovation
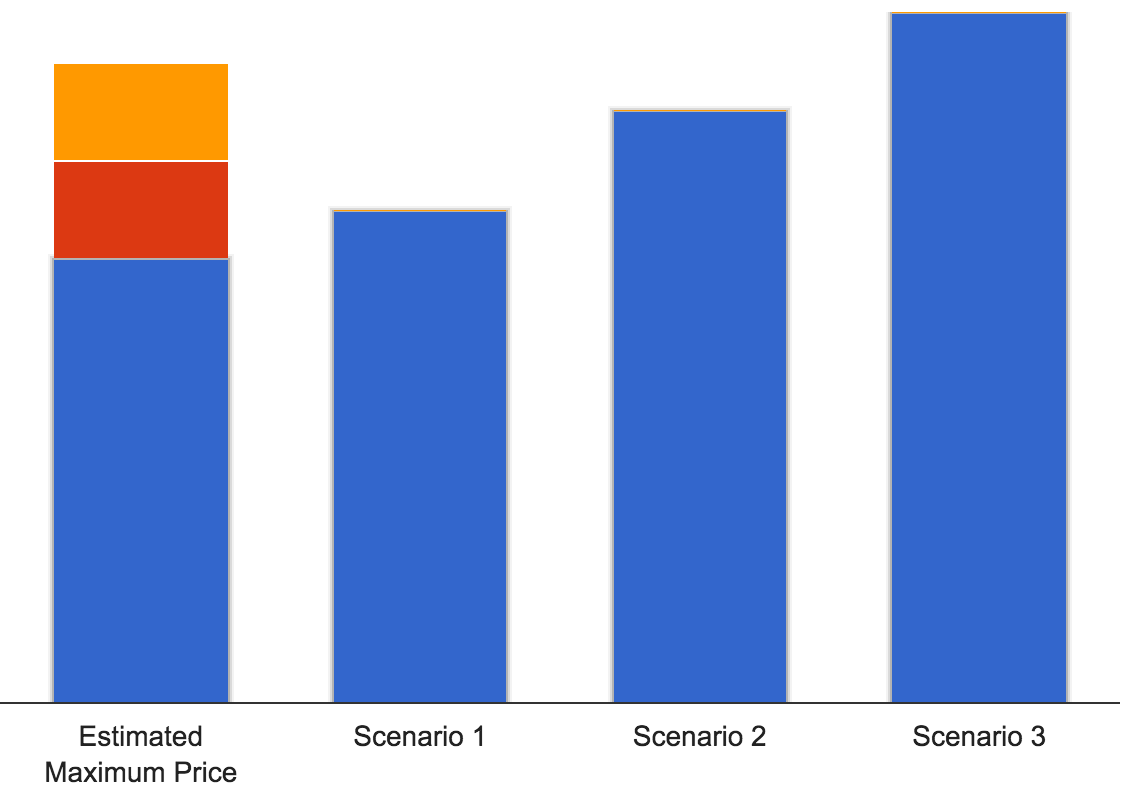
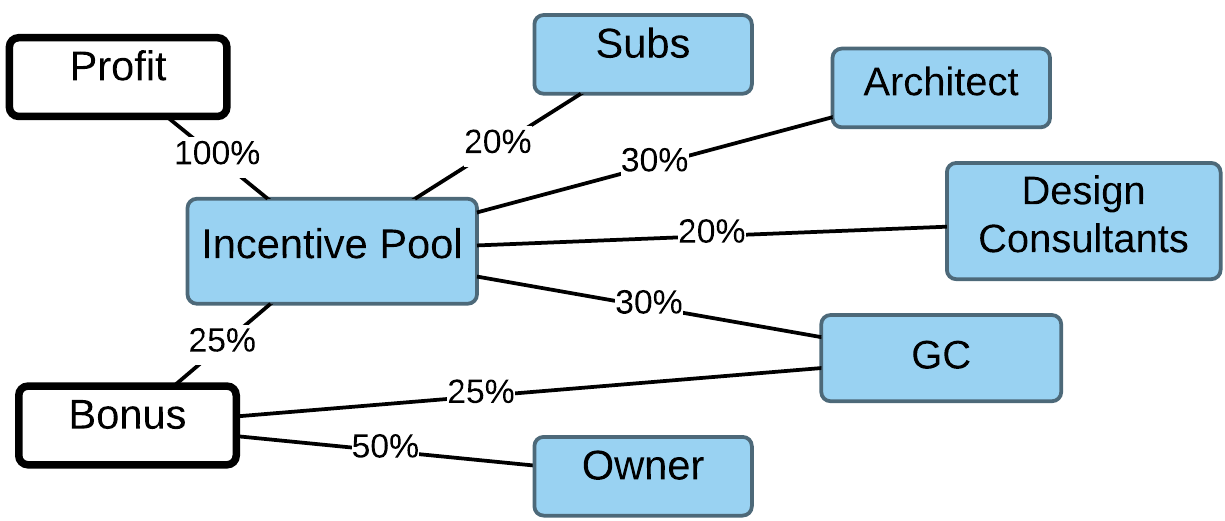
Actual Cost
Actual Cost
Actual Cost
Estimated Cost
IPD Contingency
Fixed Profit
Full Profit Payout
Shared Saving Bonus
Partial Profit Payout
Owner pays cost only
© Dr. Ling Ma
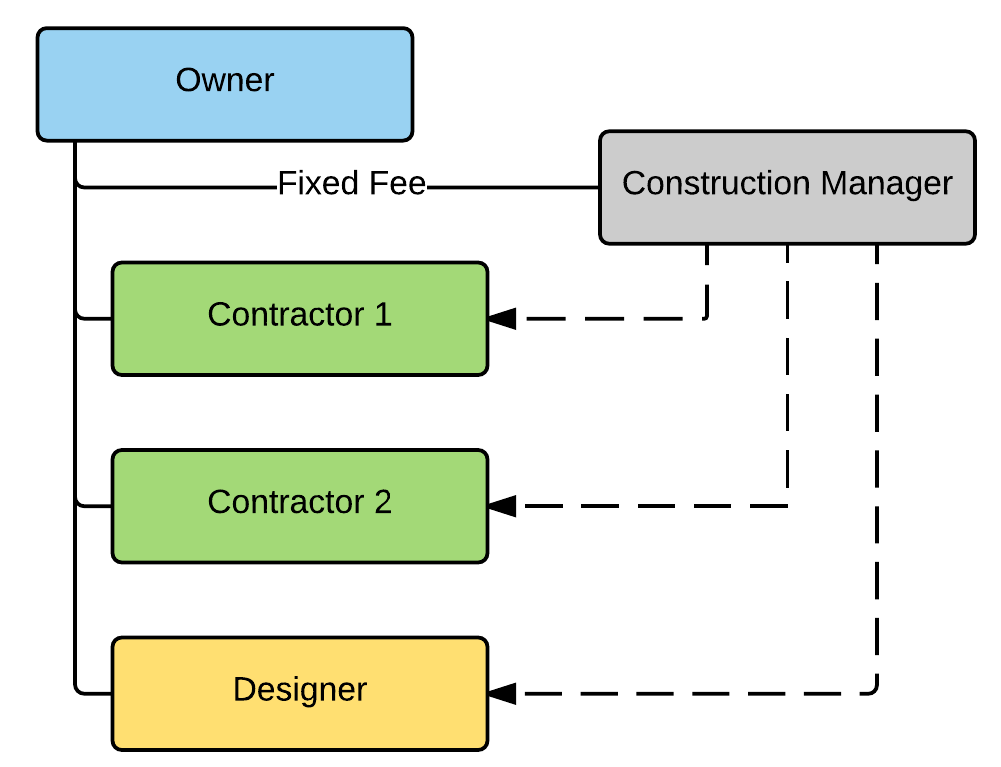
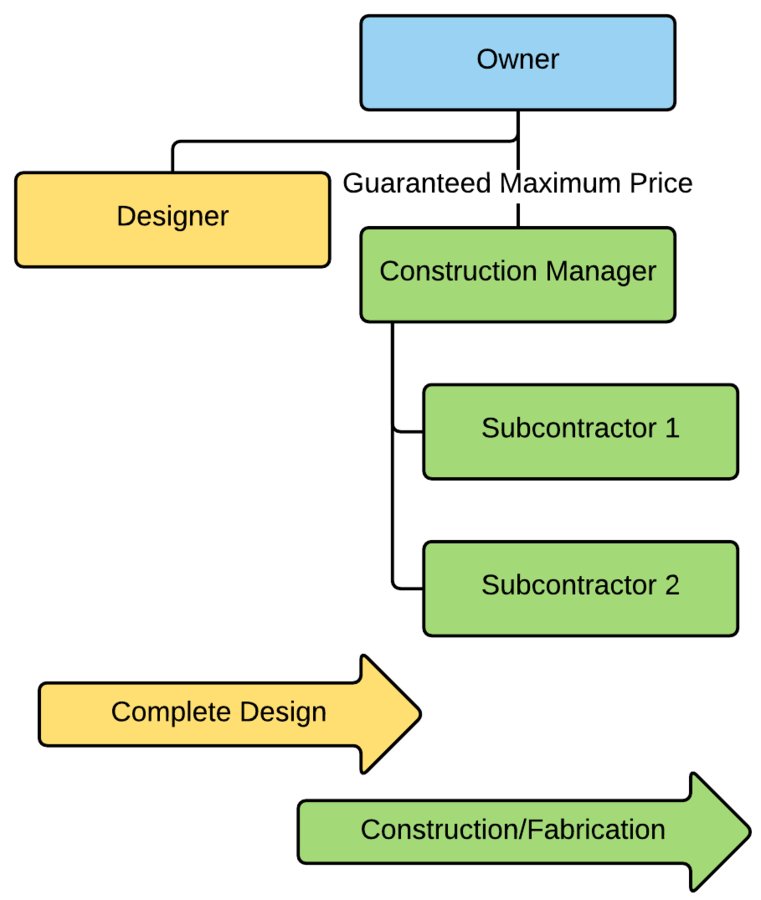
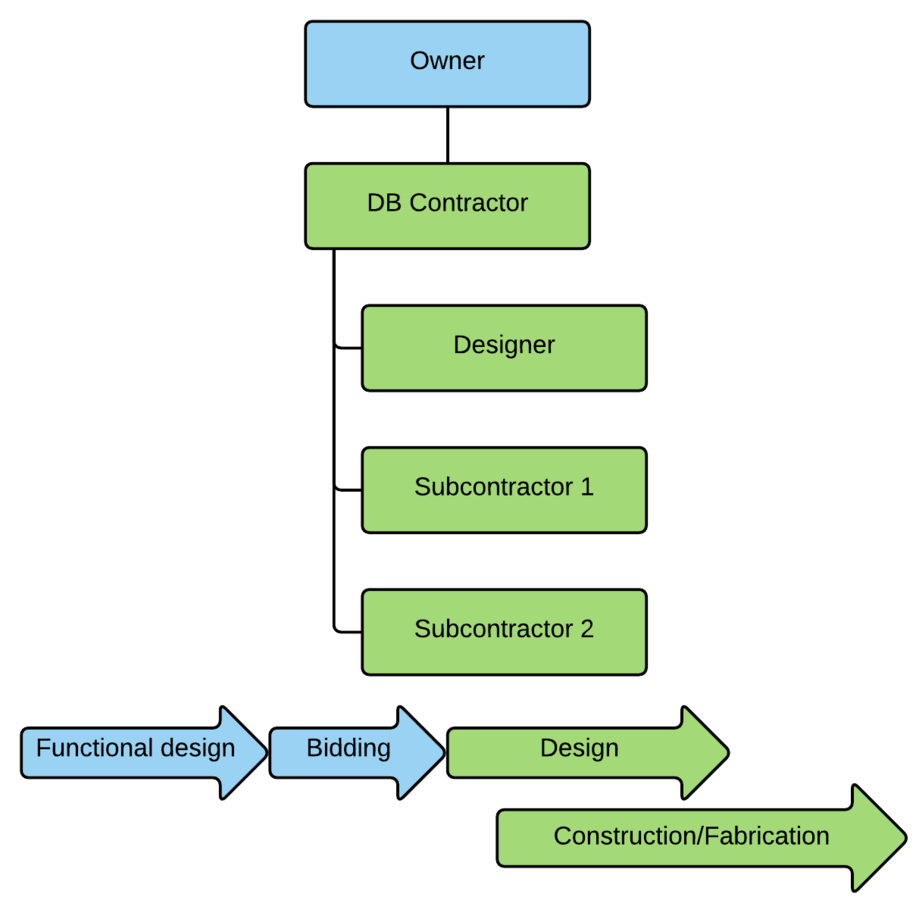
DBB, CM service, CM@risk, DB, IPD
© Dr. Ling Ma
© Dr. Ling Ma
© Dr. Ling Ma
National Building Research Institute
Technion - Faculty of Civil and Environmental Engineering
© Dr. Ling Ma
© Dr. Ling Ma
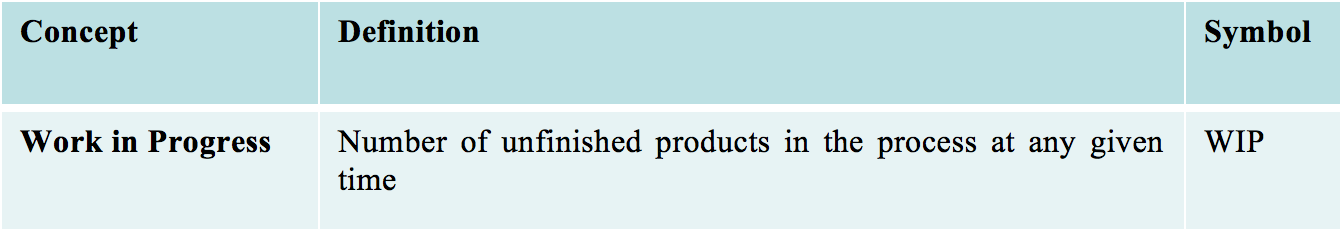
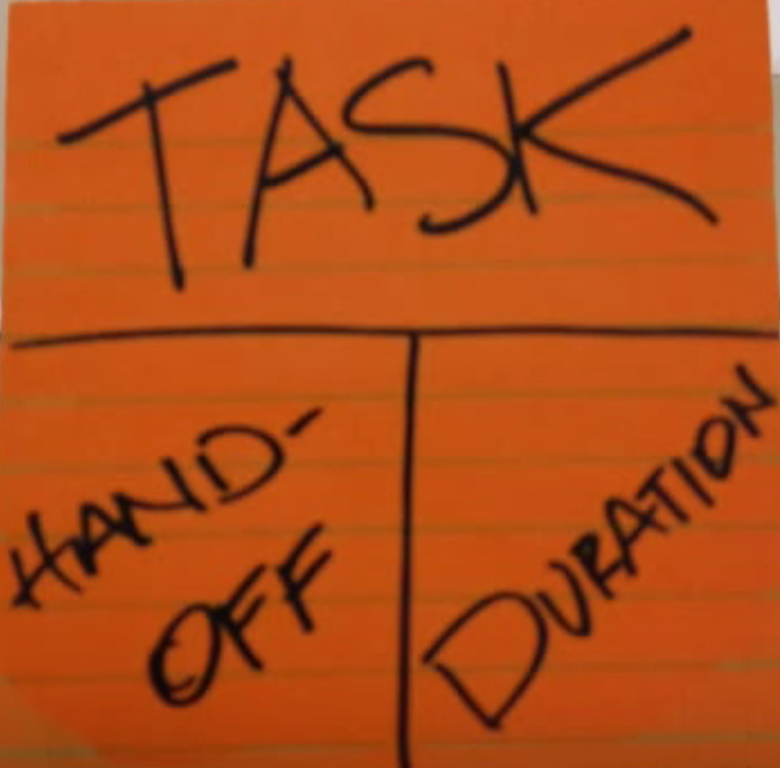
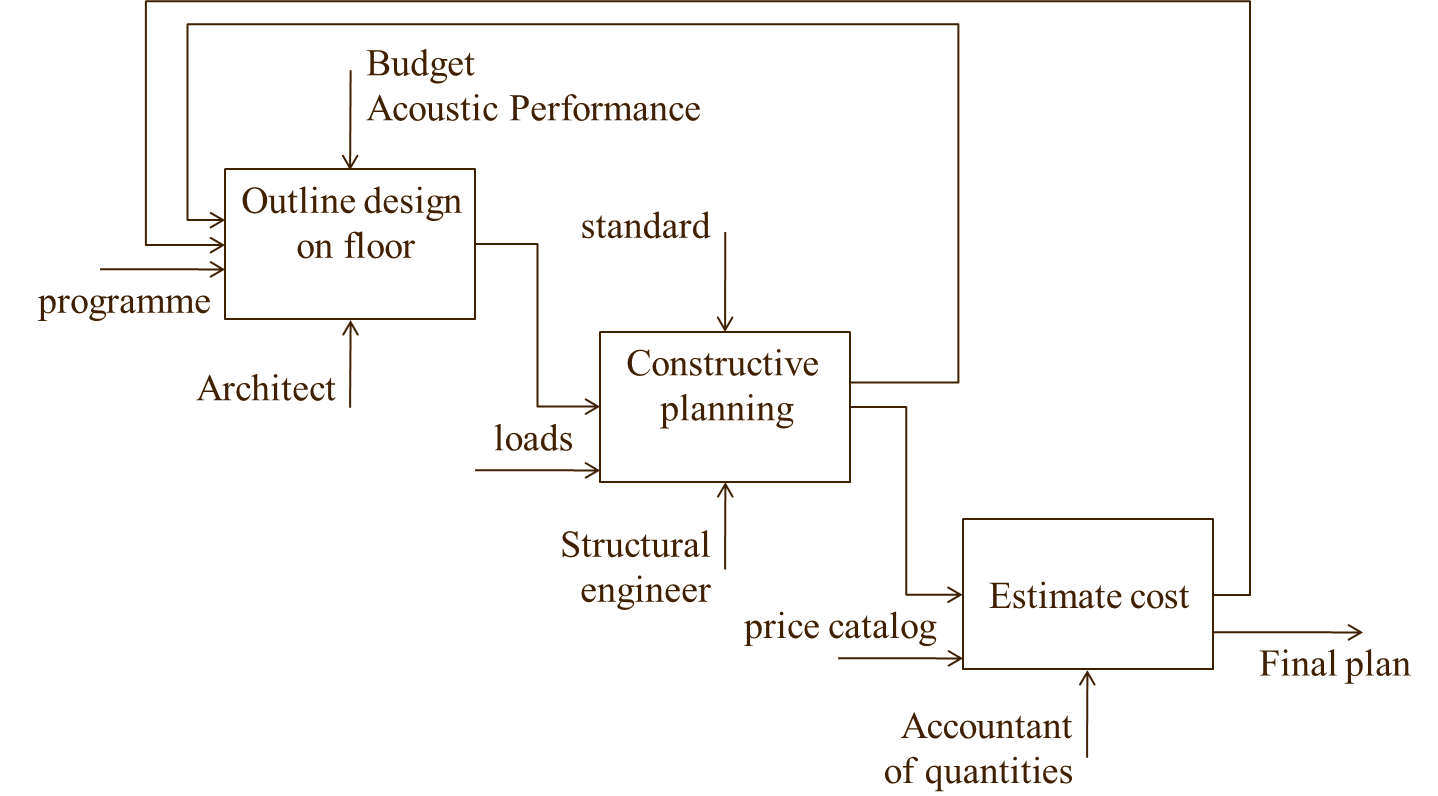
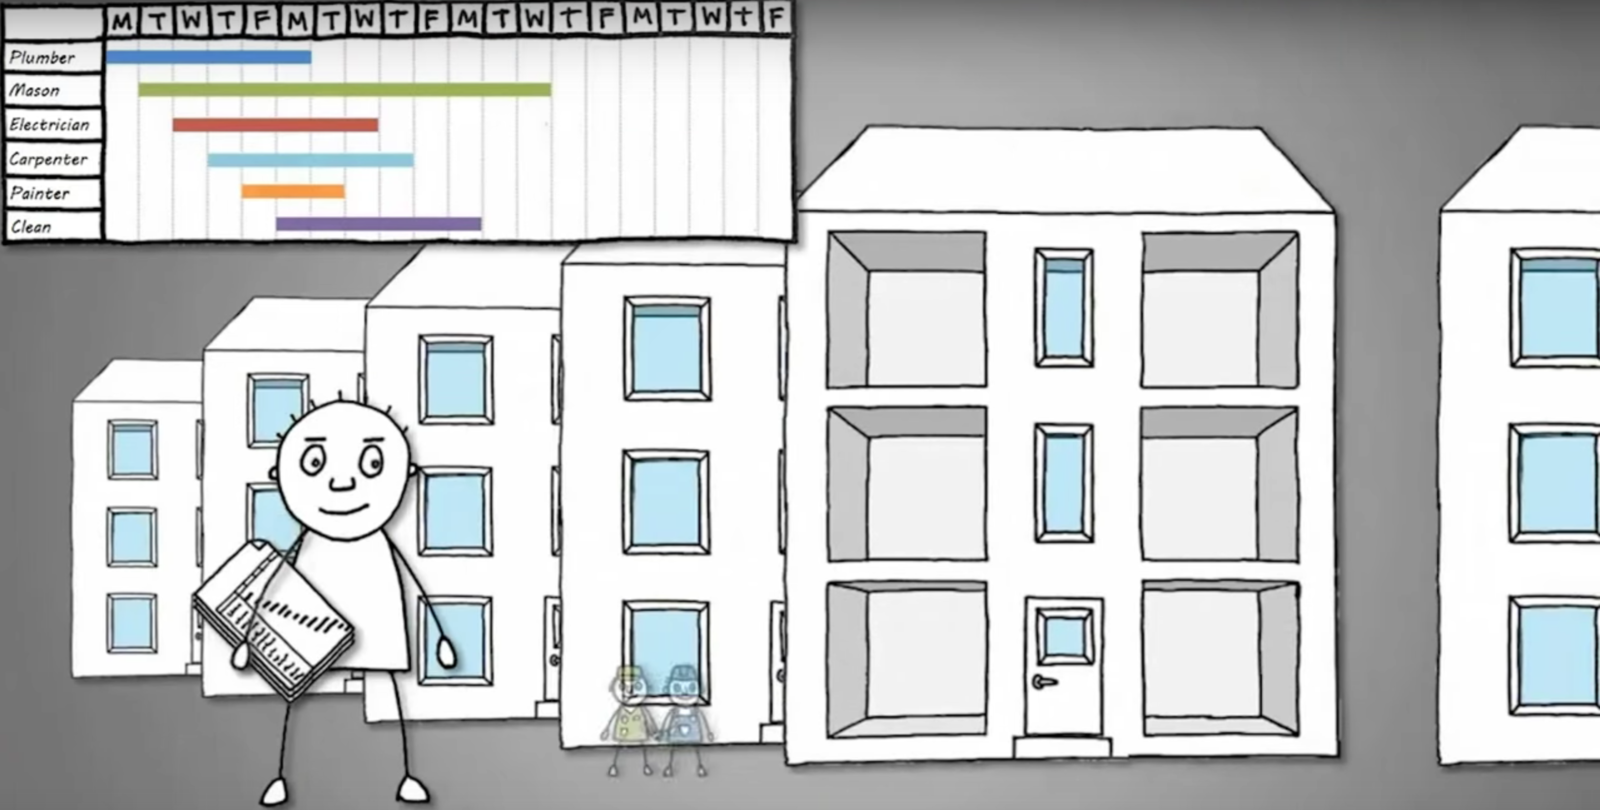
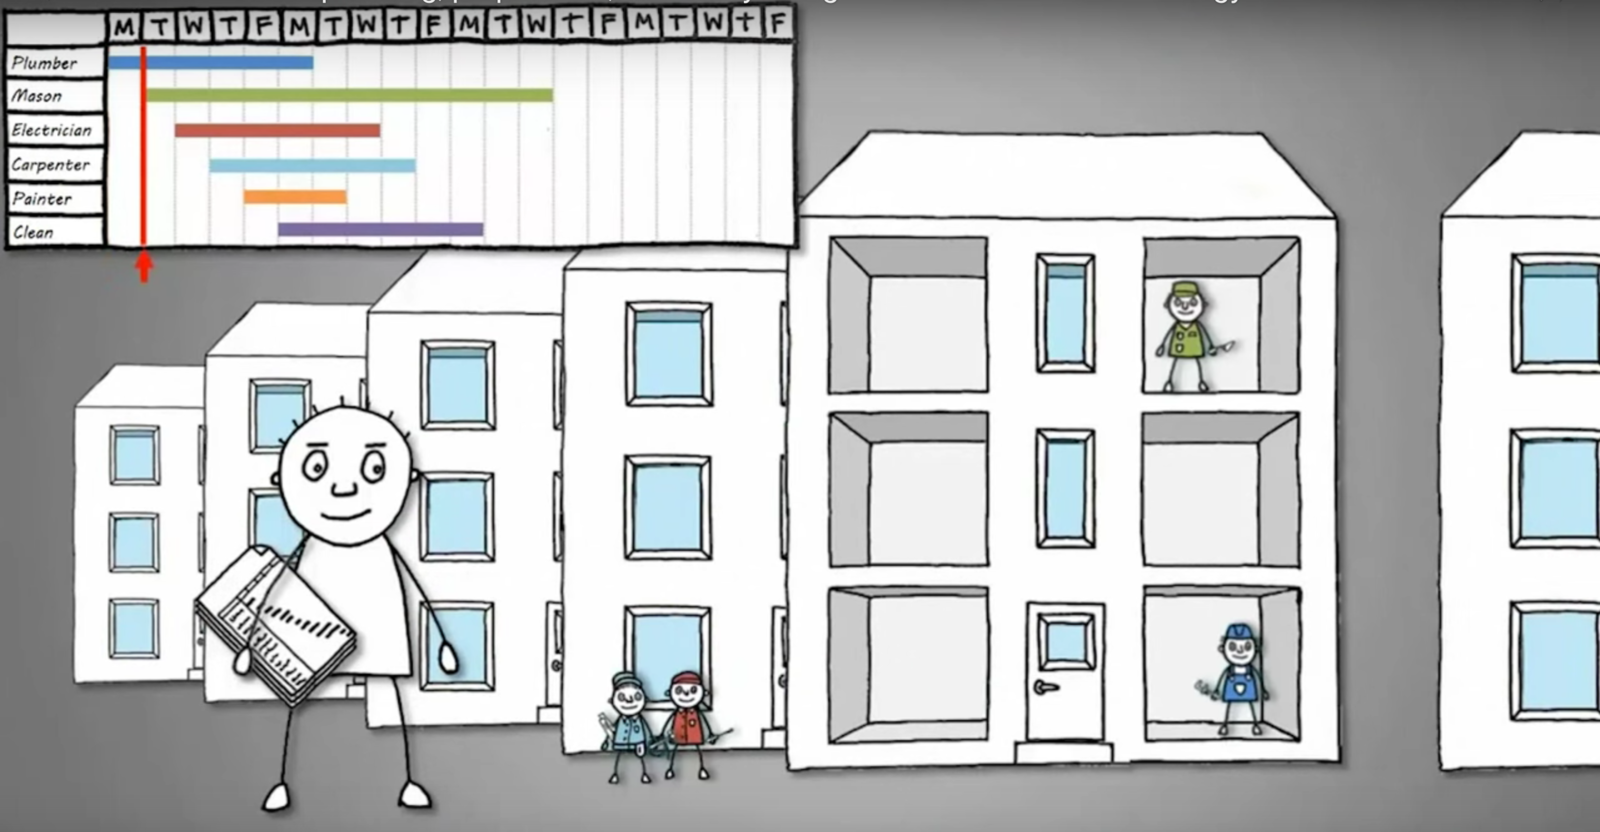
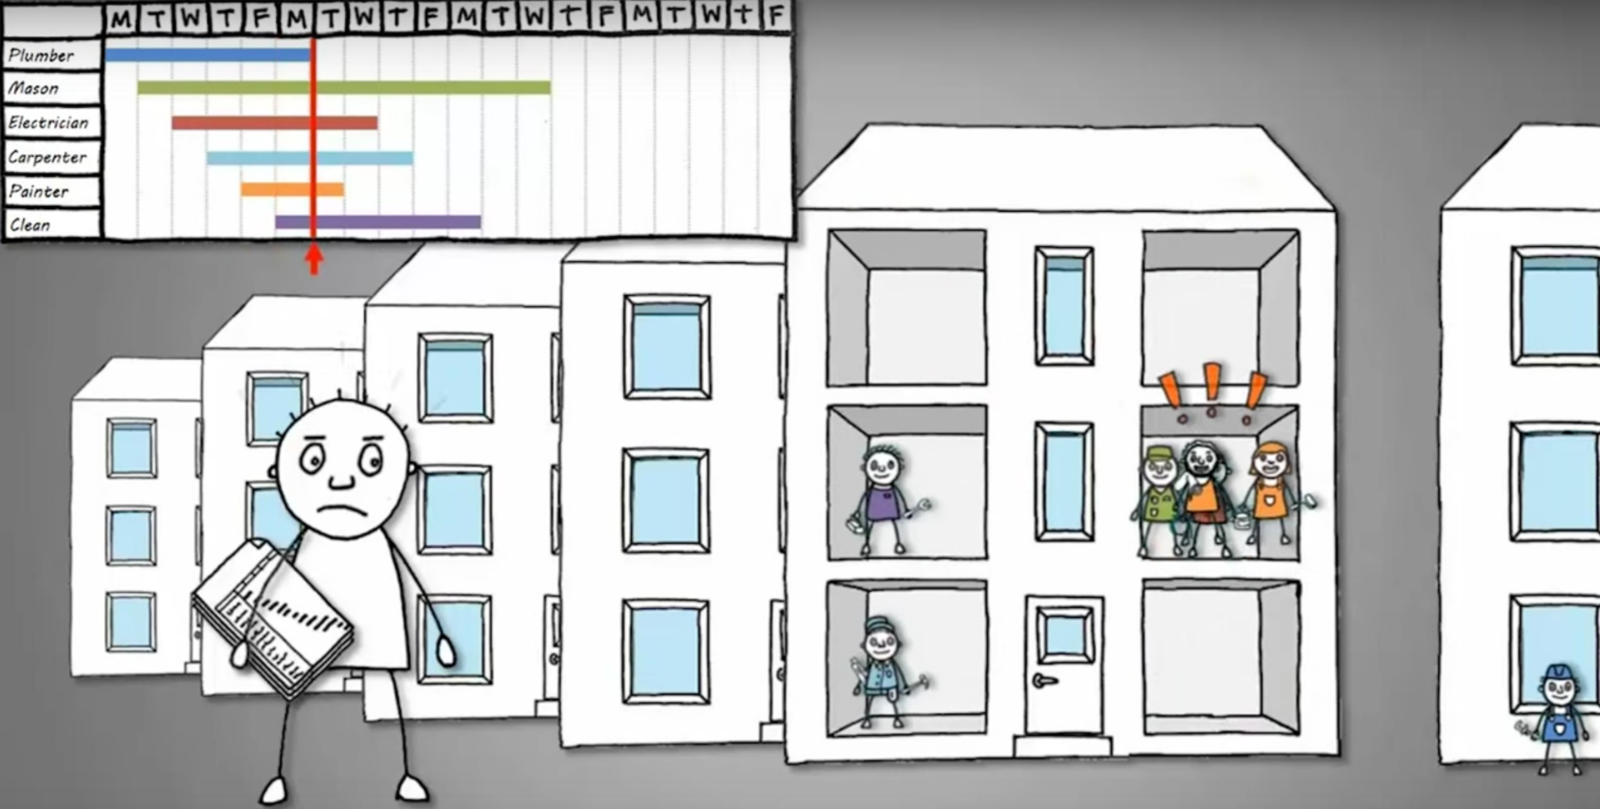
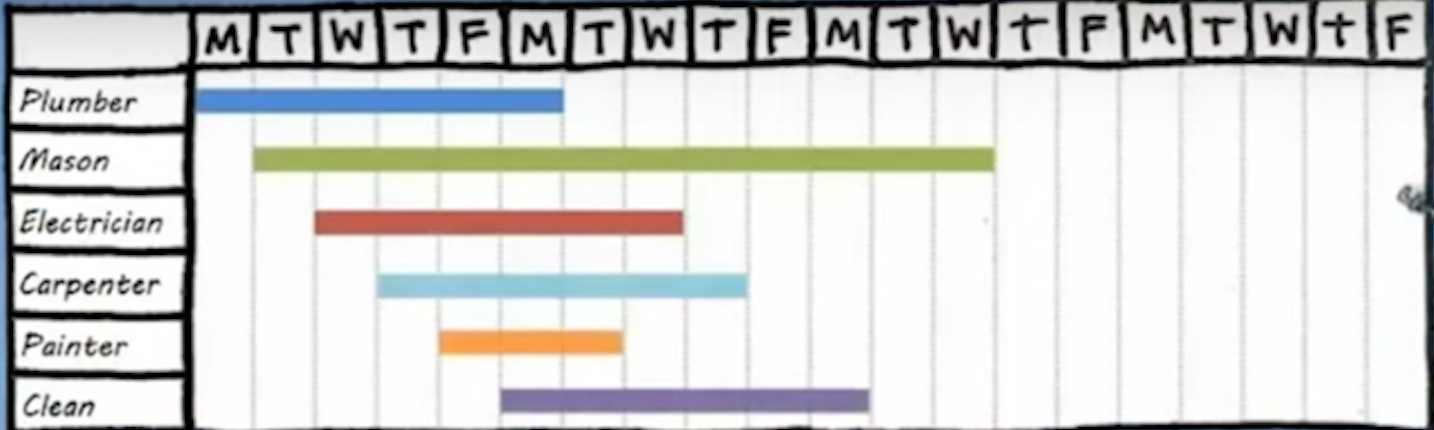
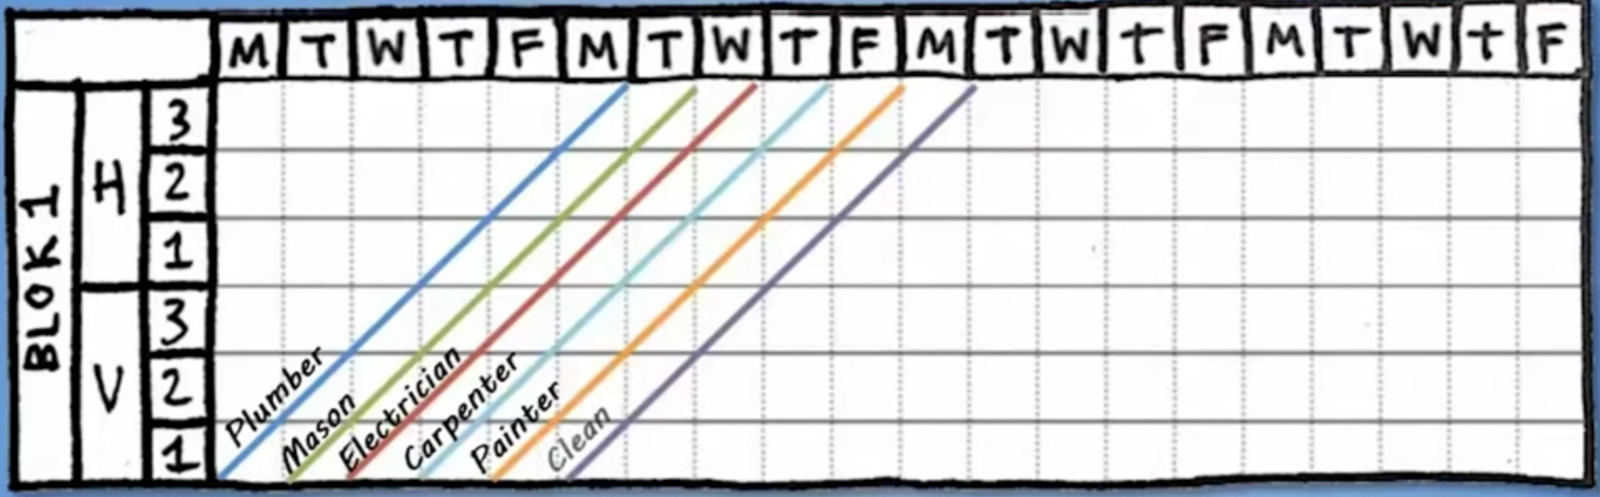
Work
Specify the activities, translate the design
Work Method, Quantity, Space
Work Breakdown Structure (WBS)
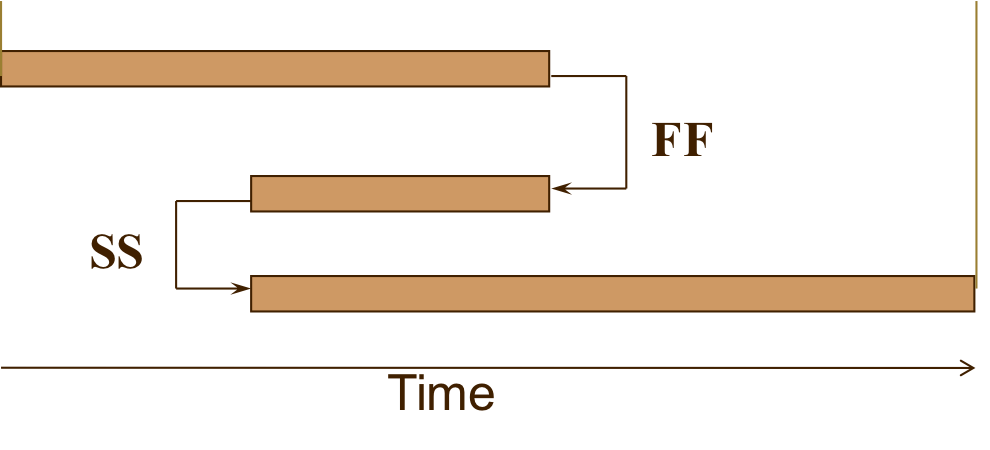
Link
Work dependencies
Define the start and end time
Gantt chart and network diagram
Resource
Constraints of resource allocation
Resource leveling
© Dr. Ling Ma
100% rule
Mutually exclusive elements
Level of detail
Coding scheme
© Dr. Ling Ma
© Dr. Ling Ma
© Dr. Ling Ma
| ES | Activity | EF |
|---|---|---|
| LS | LF | |
| TF | Duration | FF |
| ES | Activity | EF |
|---|---|---|
| LS | LF | |
| TF | Duration | FF |
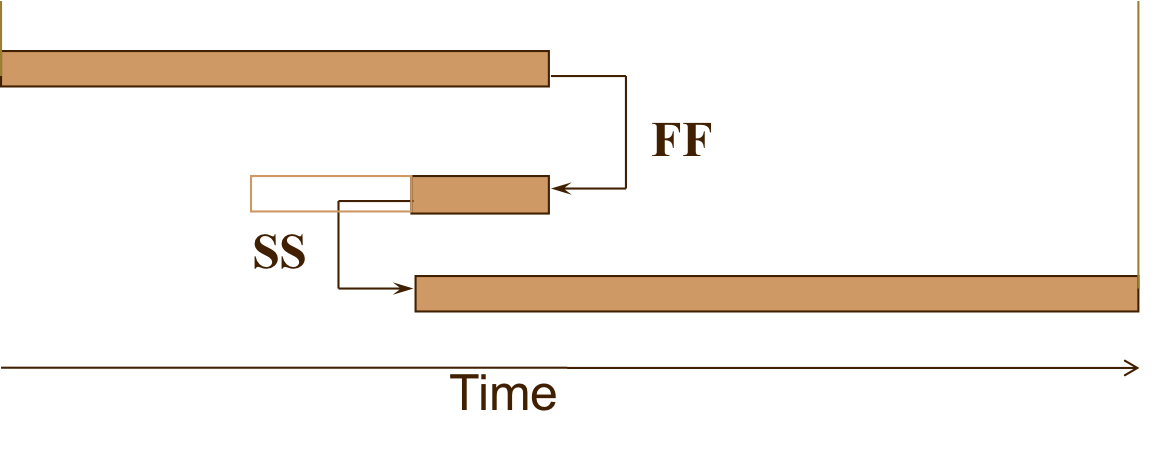
FF = Maximum delay of an activity that does not cause a delay in the start of any successor activities (ESs-EFp)
TF = Maximum delay of and activity that does not cause a delay in completion of all the project (LS-ES)
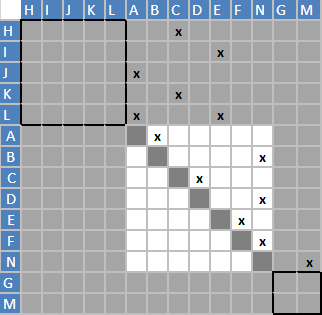
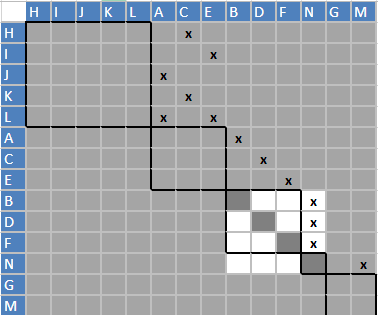
Critical path: nodes with TF = 0
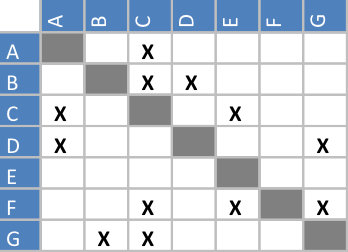
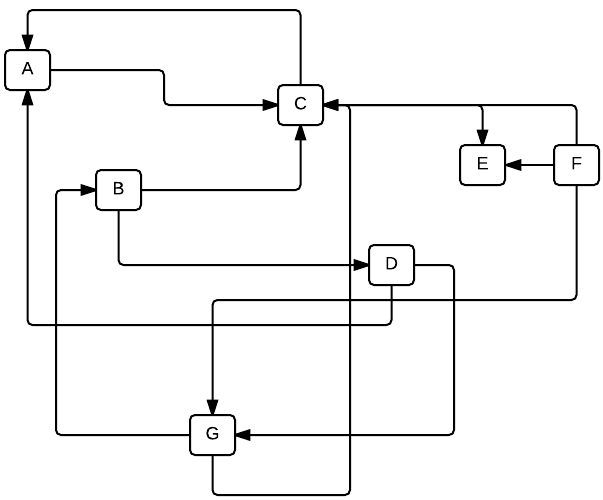
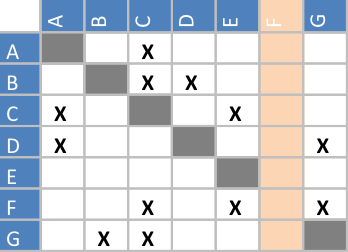
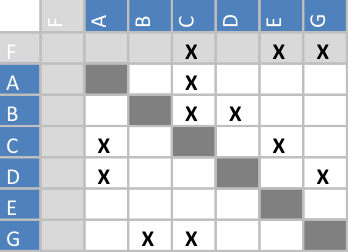
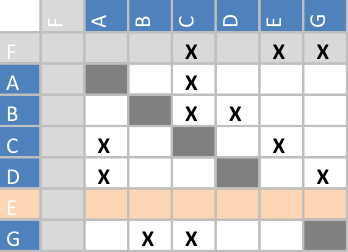
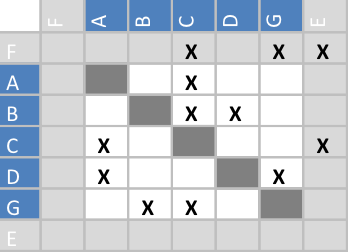
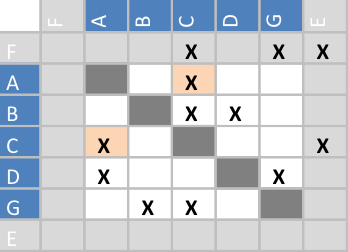
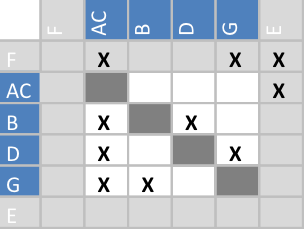
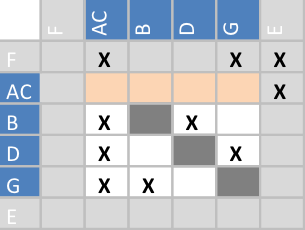
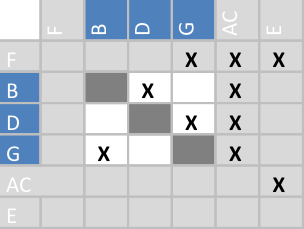
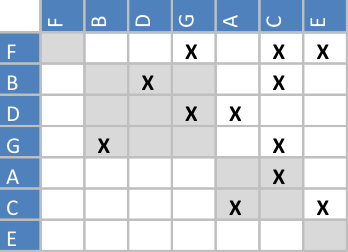
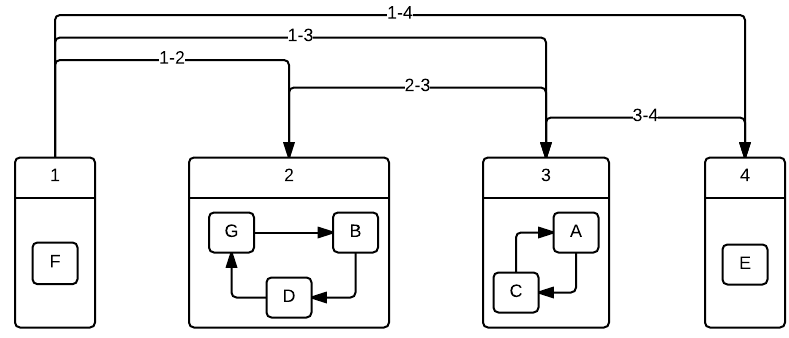
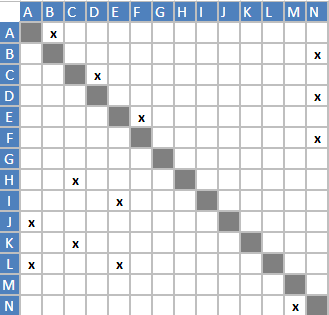
| Activity | A | B | C | D | E | F | G |
| Duration | 1 | 2 | 1 | 3 | 2 | 3 | 2 |
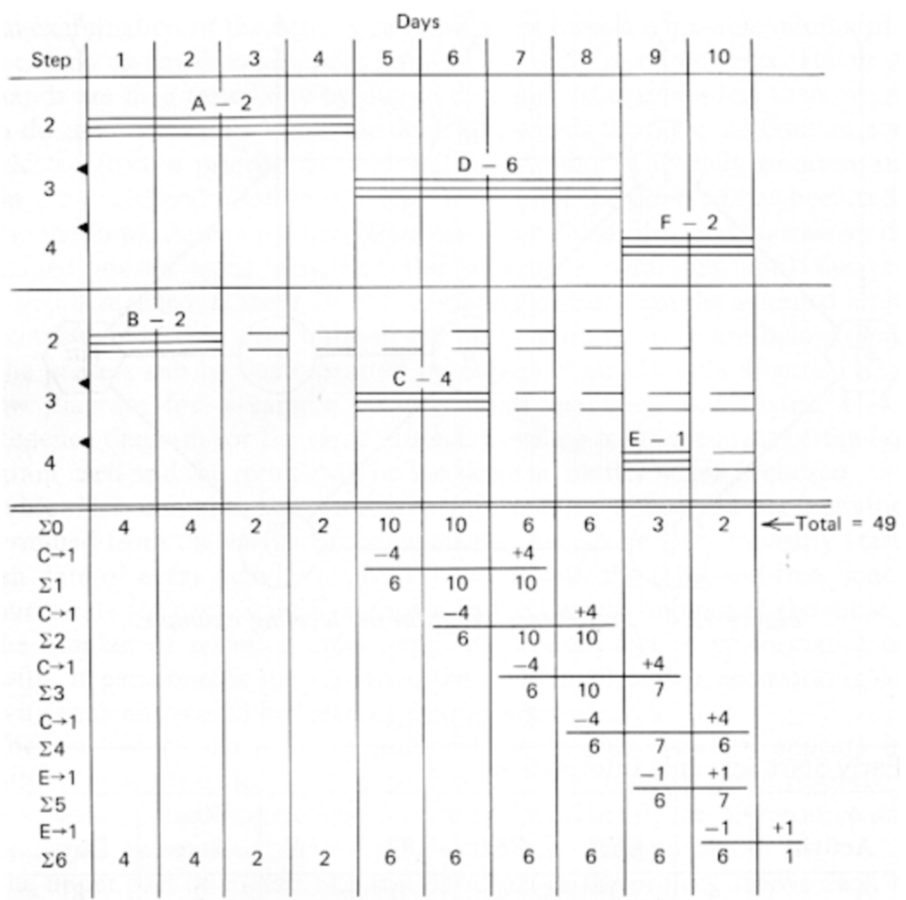
Level Method
| Predecessor activity | Successor activity |
|---|---|
| A | C |
| B | D |
| G | A |
| F | C |
| B | G |
| D | A |
| E | G |
| D | F |
© Dr. Ling Ma
| 0 | B | 2 |
|---|---|---|
| 2 |
| 2 | D | 5 |
|---|---|---|
| 3 |
| 5 | F | 8 |
|---|---|---|
| 3 |
| 0 | E | 2 |
|---|---|---|
| 2 |
| 2 | G | 4 |
|---|---|---|
| 2 |
| 5 | A | 6 |
|---|---|---|
| 1 |
| 8 | C | 9 |
|---|---|---|
| 1 |
0
0
0
1
0
2
0
9
8
8
8
7
7
5
5
2
5
2
0
5
3
0
0
0
3
3
2
0
FF = Maximum delay of an activity that does not cause a delay in the start of any successor activities (ESs-EFp)
TF = Maximum delay of and activity that does not cause a delay in completion of all the project (LS-ES)
Critical path: nodes with TF = 0
| ES | Activity | EF |
|---|---|---|
| LS | LF | |
| TF | Duration | FF |
| ES | Activity | EF |
|---|---|---|
| LS | LF | |
| TF | Duration | FF |
| Activity code | Length (weeks) |
Predecessor | Type of connection |
Total float |
|---|---|---|---|---|
| A | 7 | - | ||
| B | 9 | - | ||
| C | 12 | - | ||
| D | 14 | A B C |
FF=14 FS=2 SS=8 |
|
| E | 11 | D | FS=0 | |
| F | 17 | D | SS=11 | |
| G | 13 | E | FS=0 | 0 |
| H | 6 | E F |
FS=3 FS=0 |
|
| I | ? | F | SS=12 | 0 |
© Dr. Ling Ma
© Dr. Ling Ma
© Dr. Ling Ma
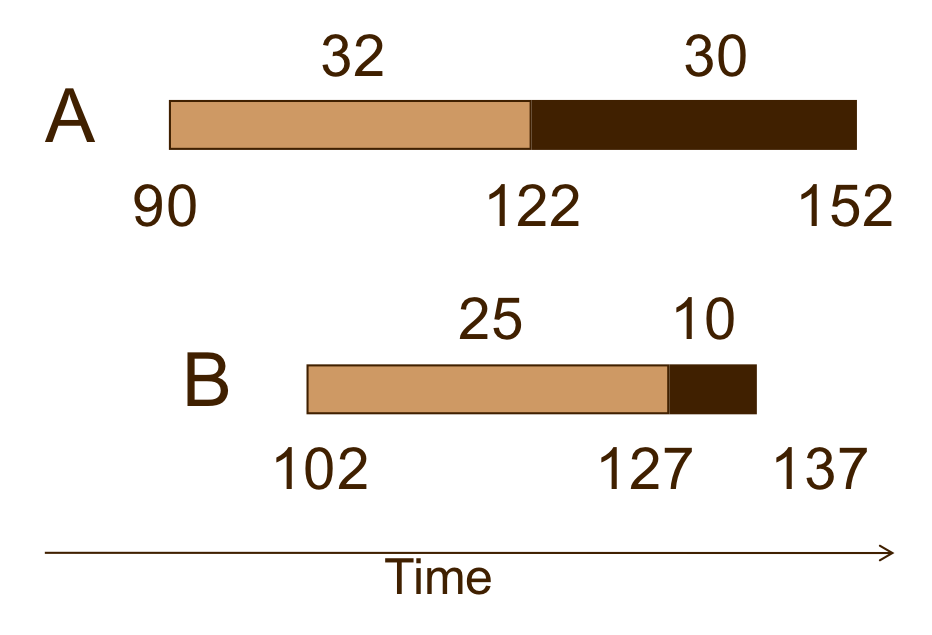
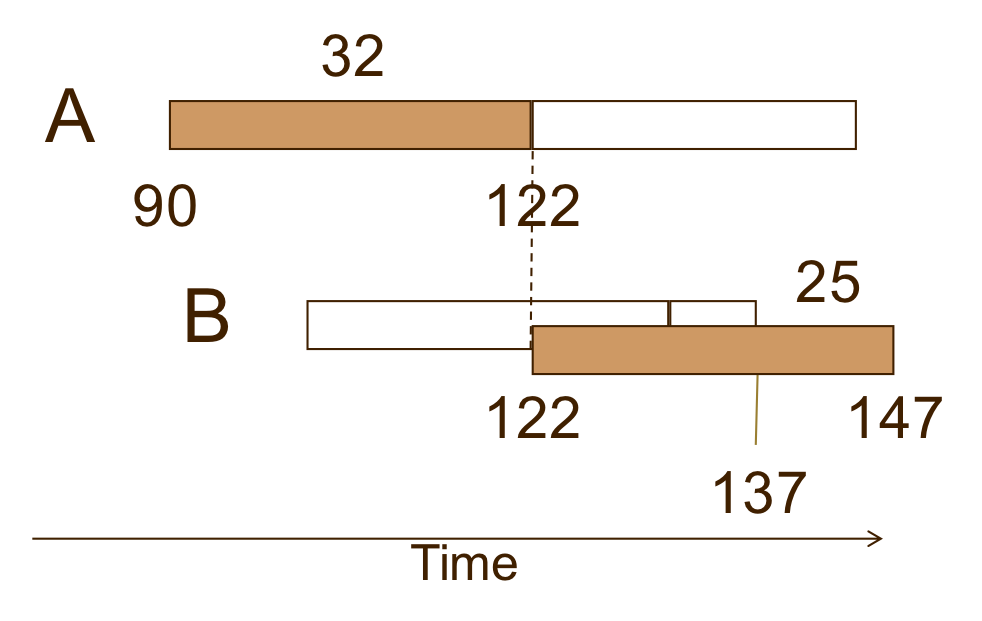
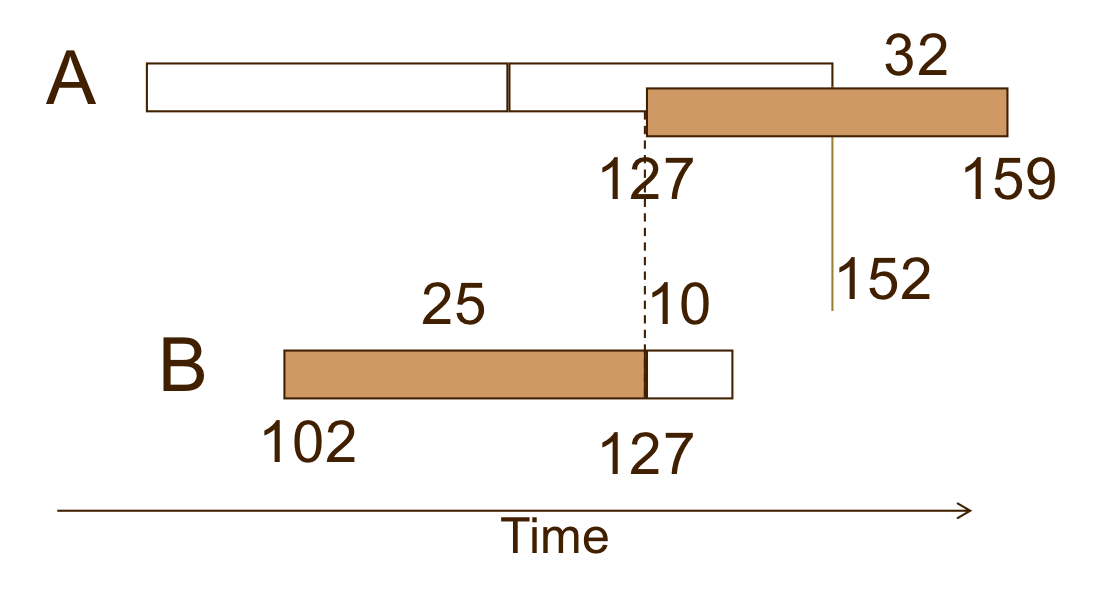
| Activity | Duration | Early Start | Total Float |
|---|---|---|---|
| A | 32 | 90 | 30 |
| B | 25 | 102 | 10 |
Project delay 147-137= 10
Project delay 159-152= 7
If both A and B require the same resource, and only one unit of that resource is available, and the activities must be performed continuously, which activity should be given the resource first, in order to minimize the impact on the project as a whole?
© Dr. Ling Ma
© Dr. Ling Ma
A highway project has four tasks: A, B, C and D.
Site overheads are ¥ 2,000/day, and the client has offered a bonus of ¥ 500 for every week short of the 15th week
The contractor can perform the work in two different construction methods
© Dr. Ling Ma
© Dr. Ling Ma
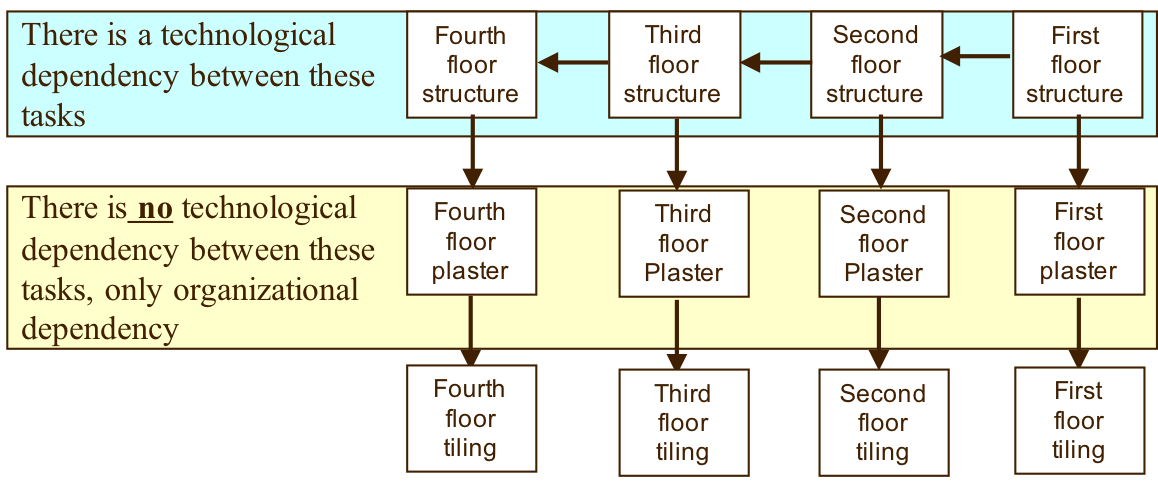
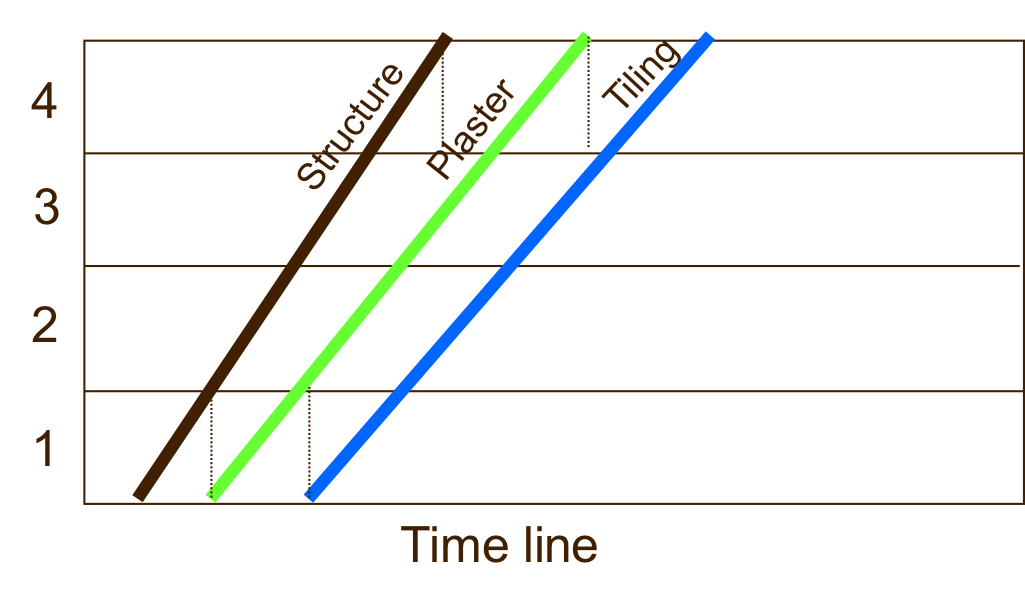
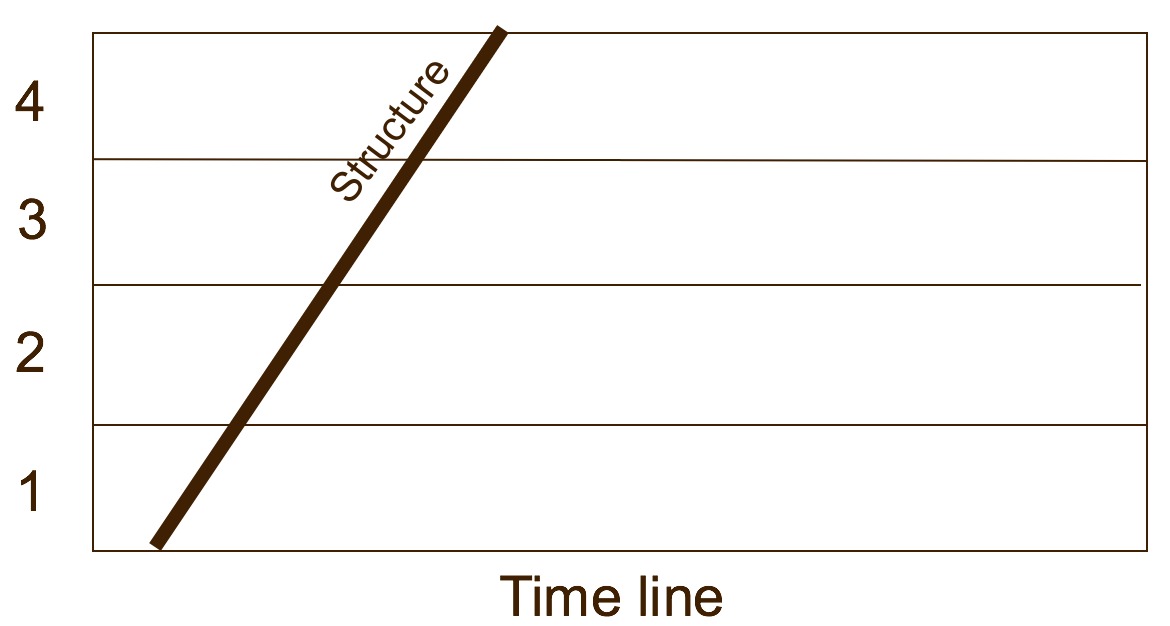
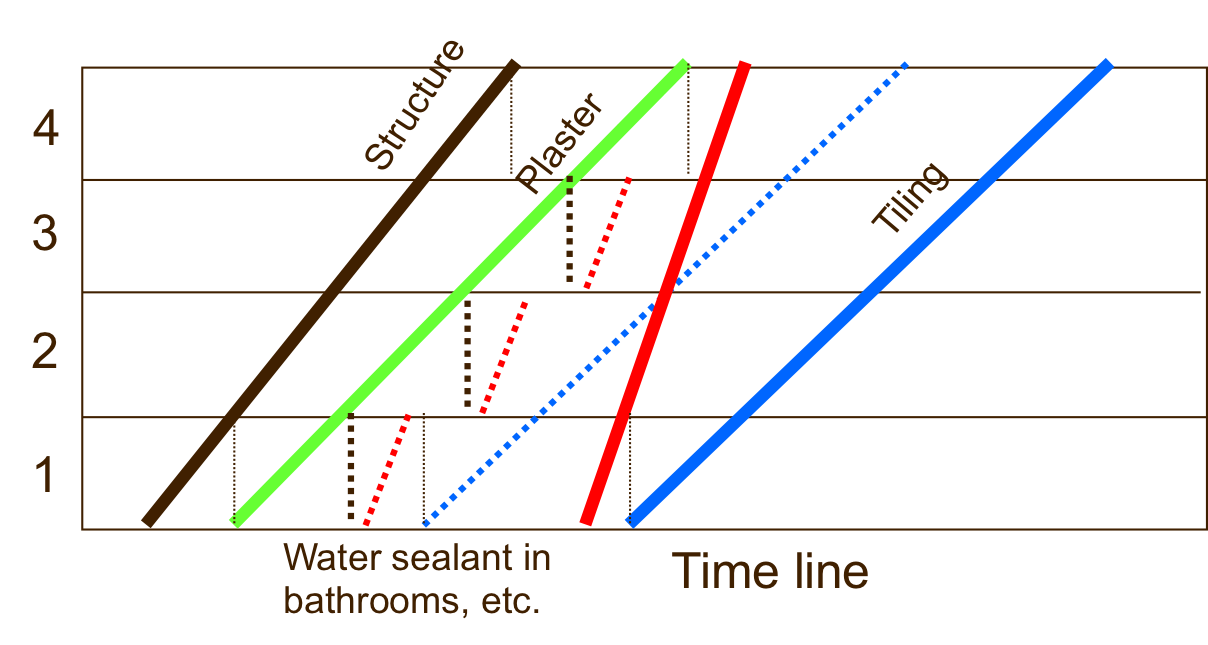
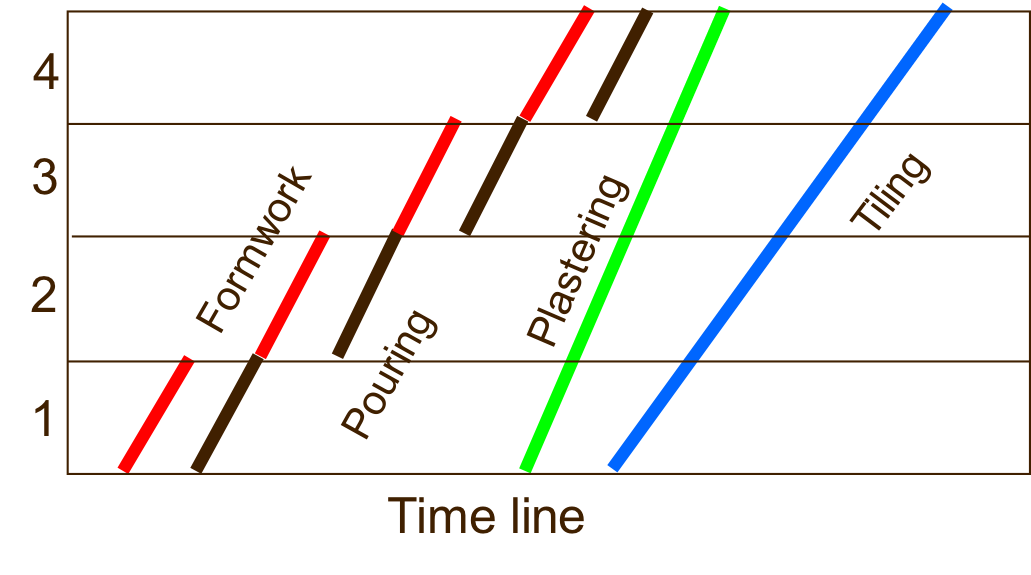
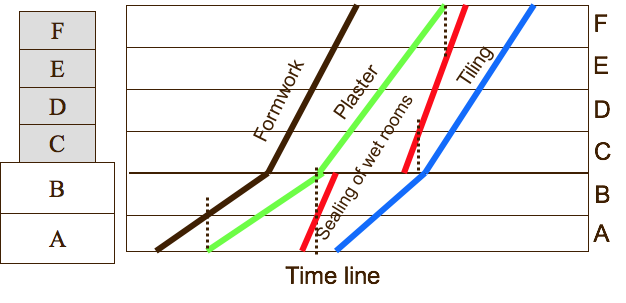
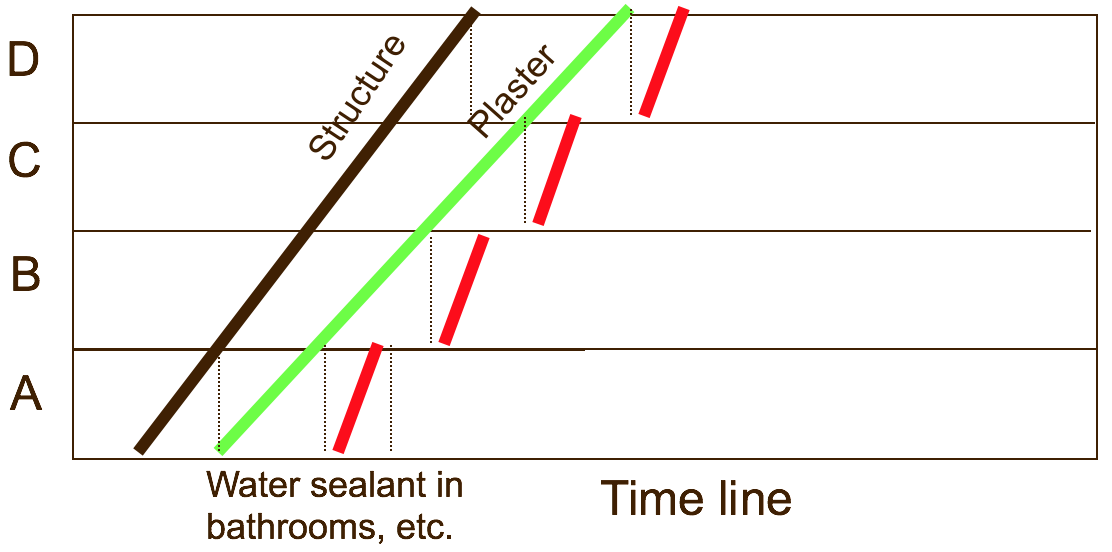
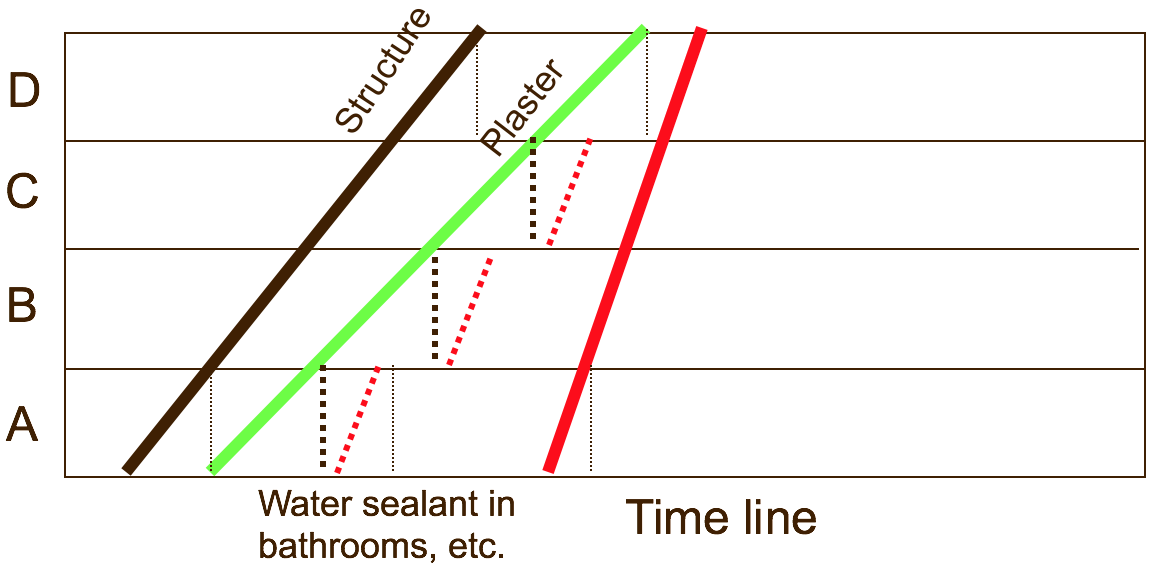
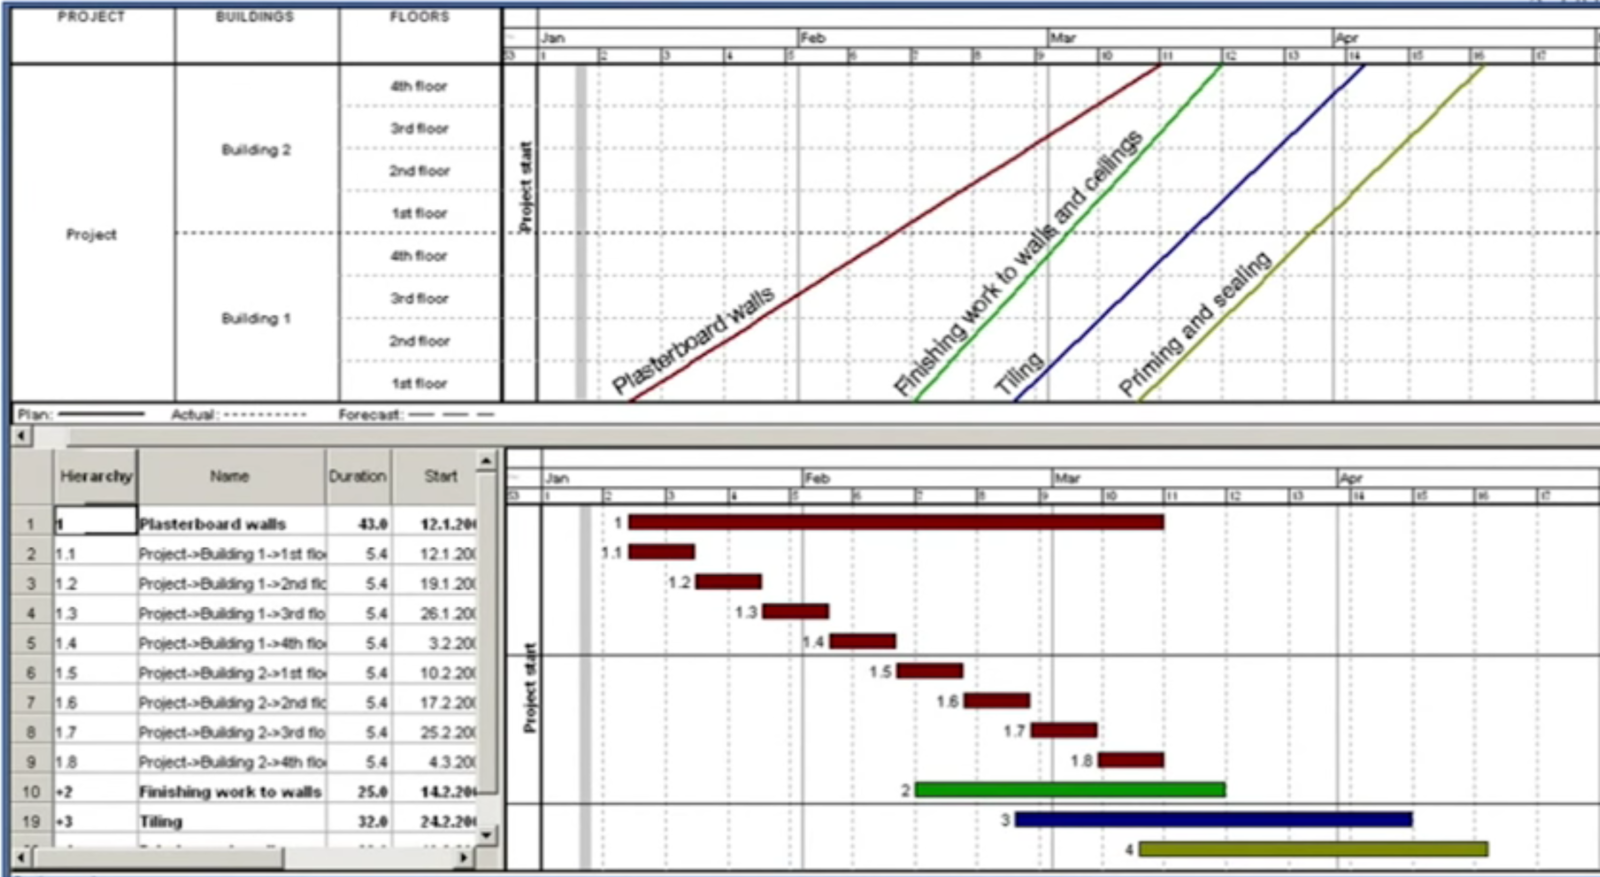
| Work section / Floor |
|---|
| 1 |
| 2 |
| 3 |
| 4 |
| Trades |
|---|
| Structure |
| Plastering |
| Tiling |
© Dr. Ling Ma
© Dr. Ling Ma
| Work section / Floor |
|---|
| 1 |
| 2 |
| 3 |
| 4 |
| Trades |
|---|
| Structure |
| Plastering |
| Tiling |
© Dr. Ling Ma
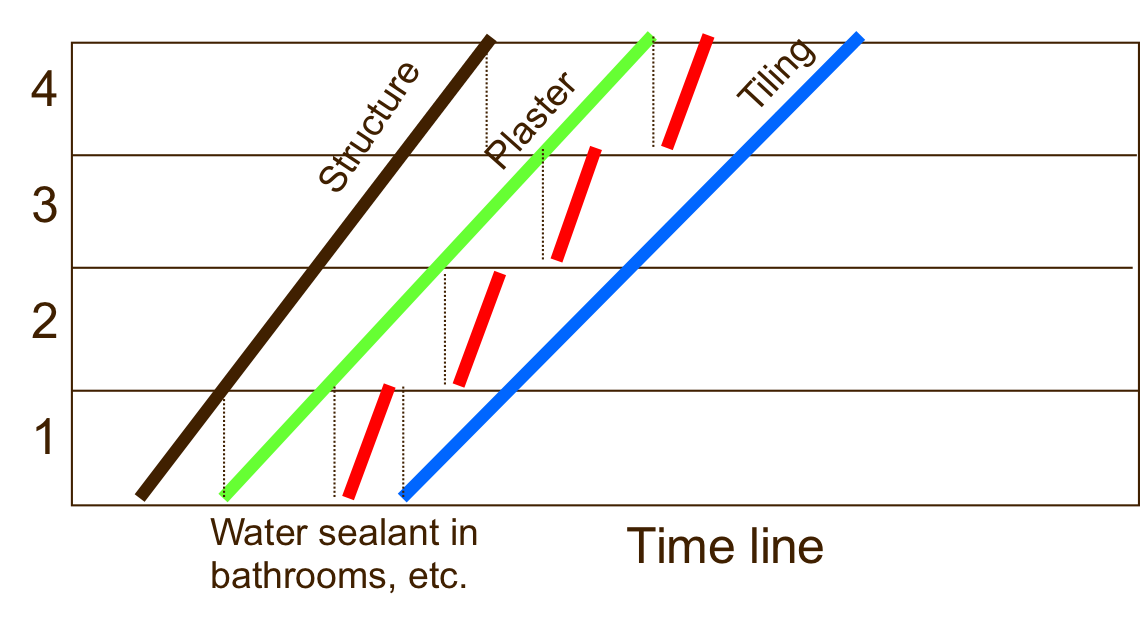
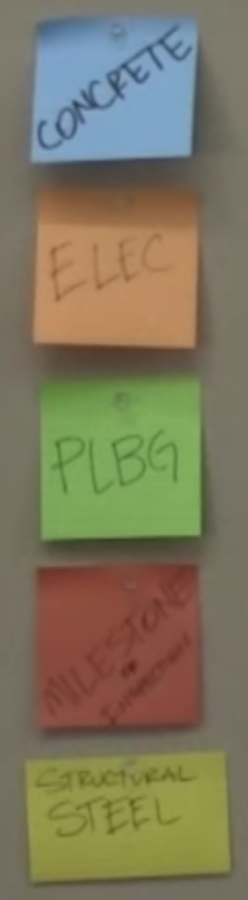
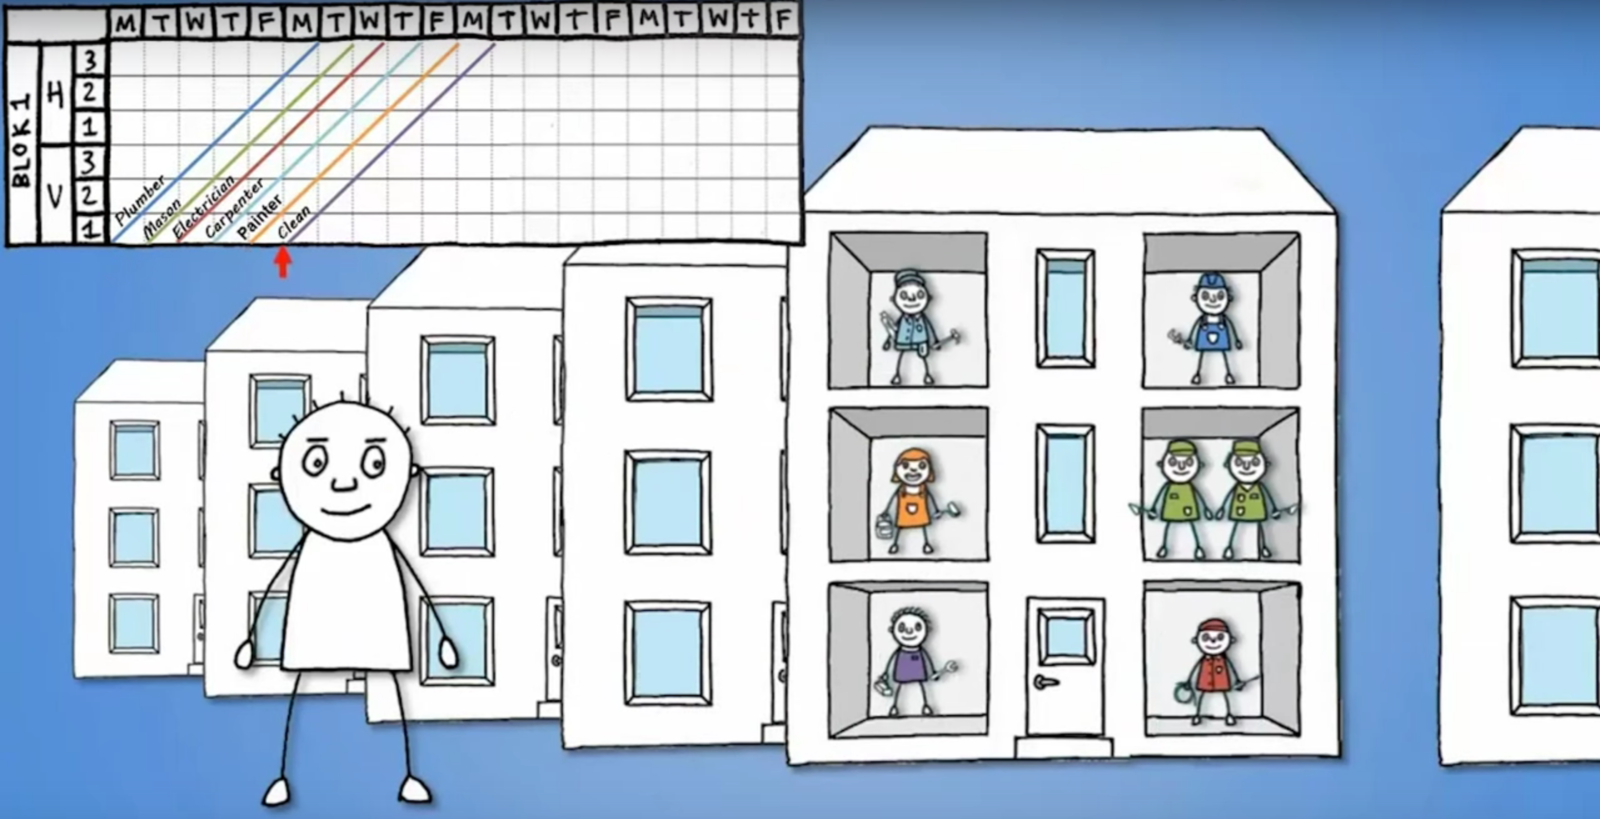
The following is a list of trades in construction.
© Dr. Ling Ma
© Dr. Ling Ma
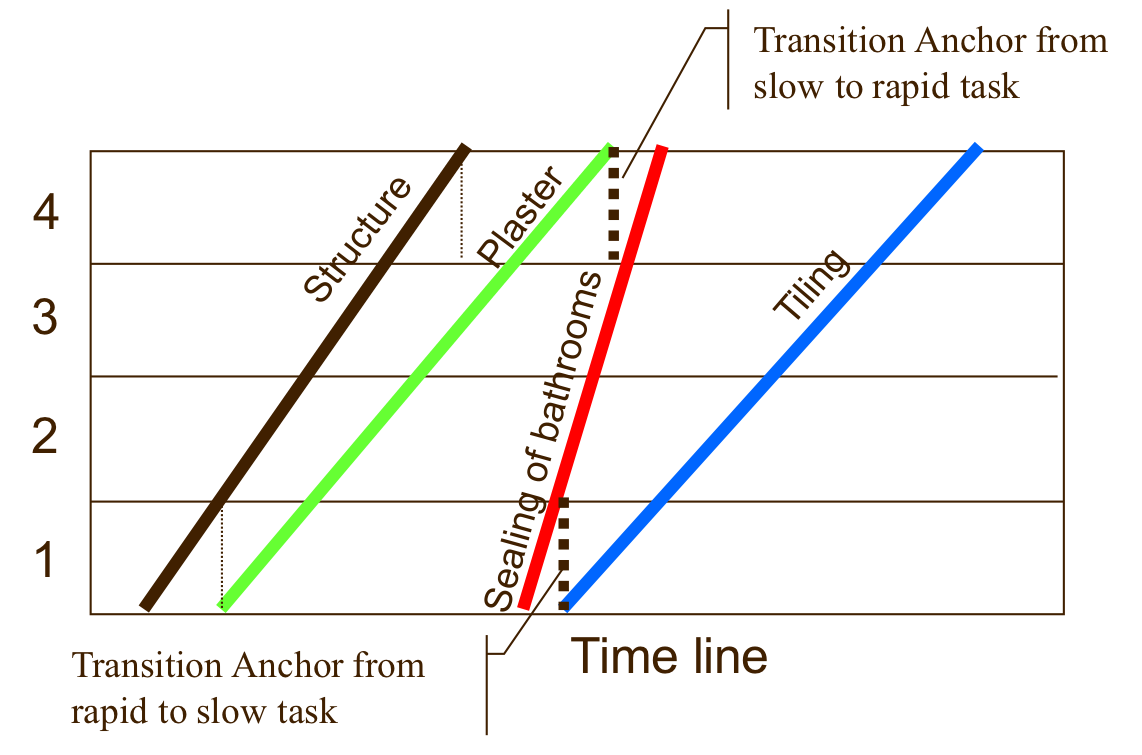
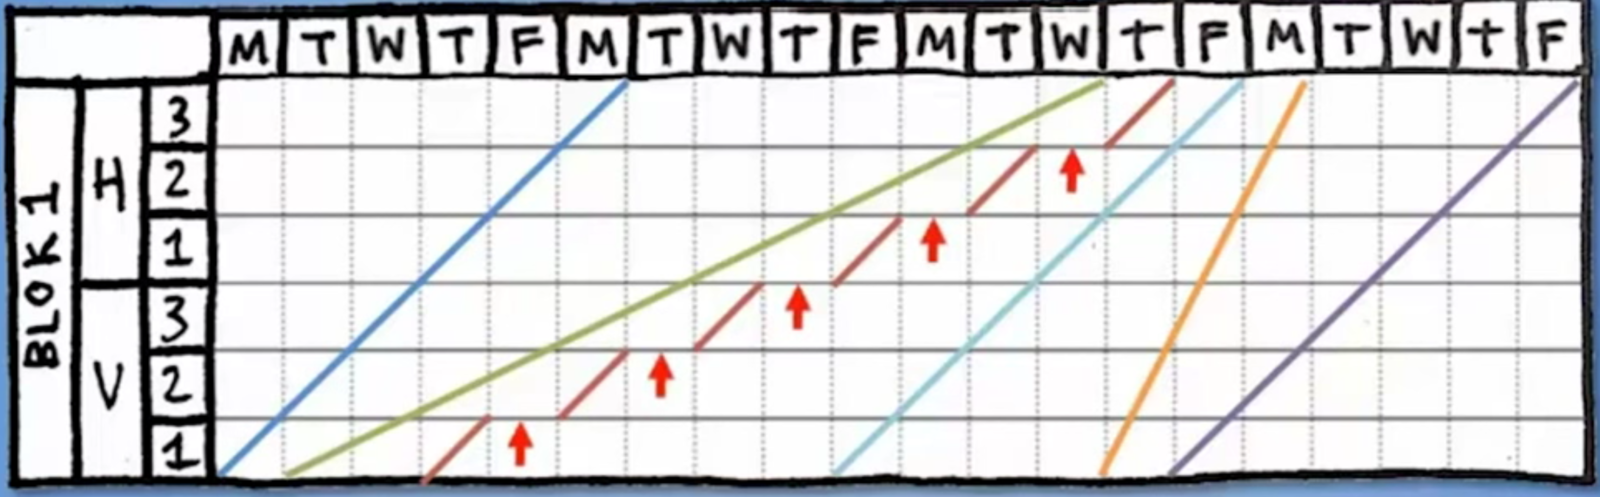
How to treat the 'Slow' tasks
© Dr. Ling Ma
© Dr. Ling Ma
© Dr. Ling Ma
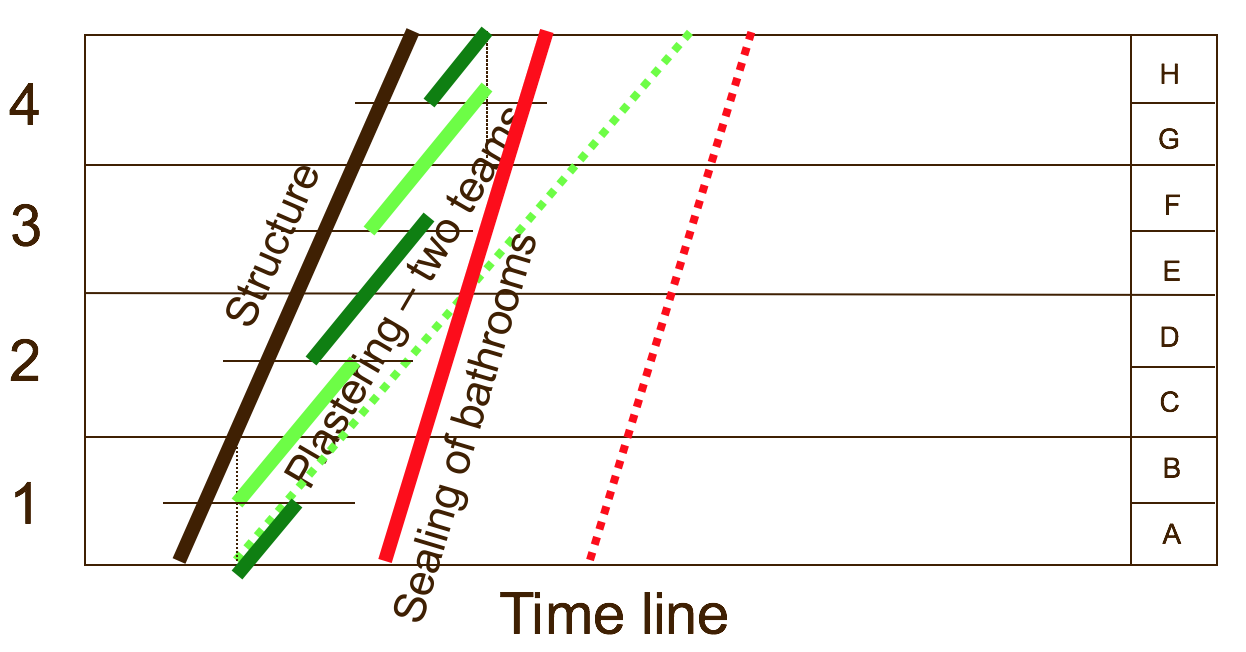
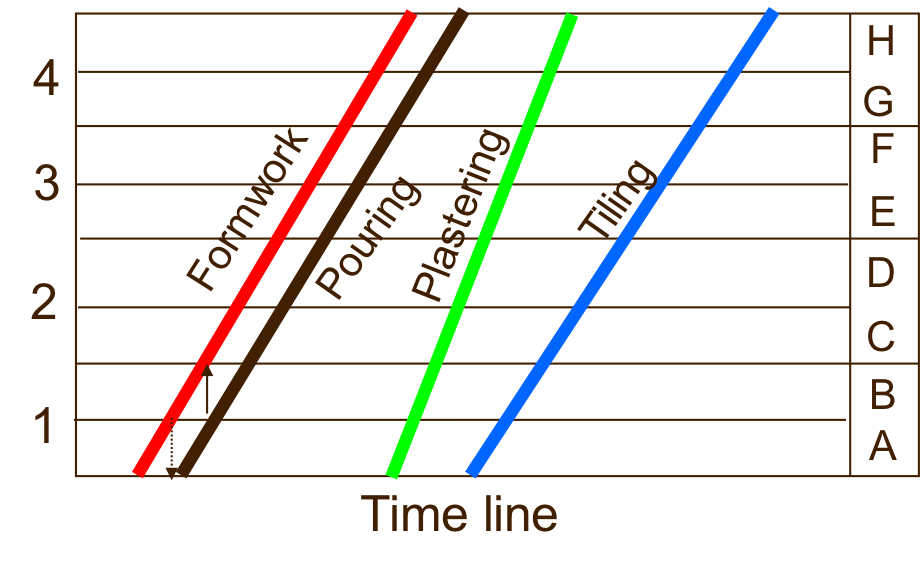
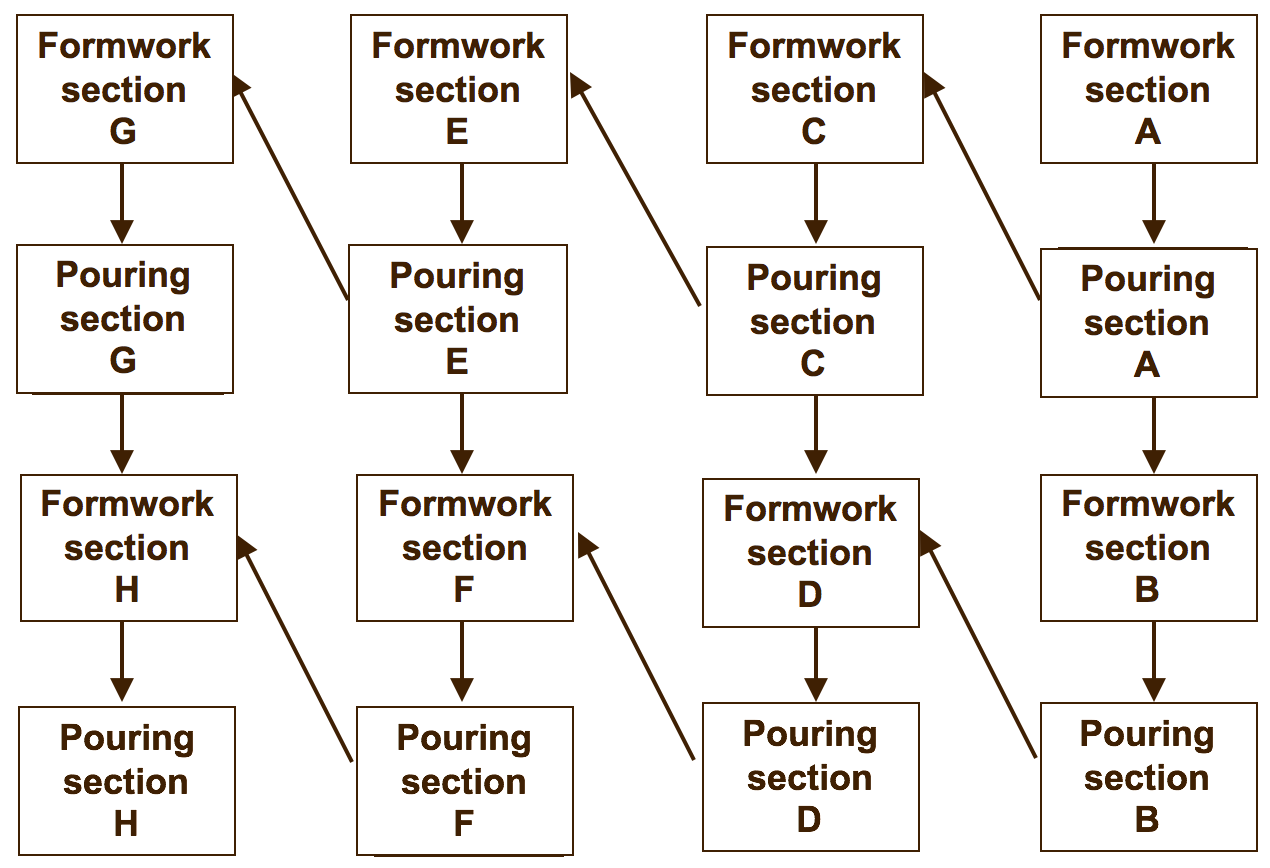
| 1 |
| 2 |
| 3 |
| 4 |
| A |
| B |
| C |
| D |
| E |
| F |
| G |
| H |
© Dr. Ling Ma
© Dr. Ling Ma
Pouring concrete with a pump
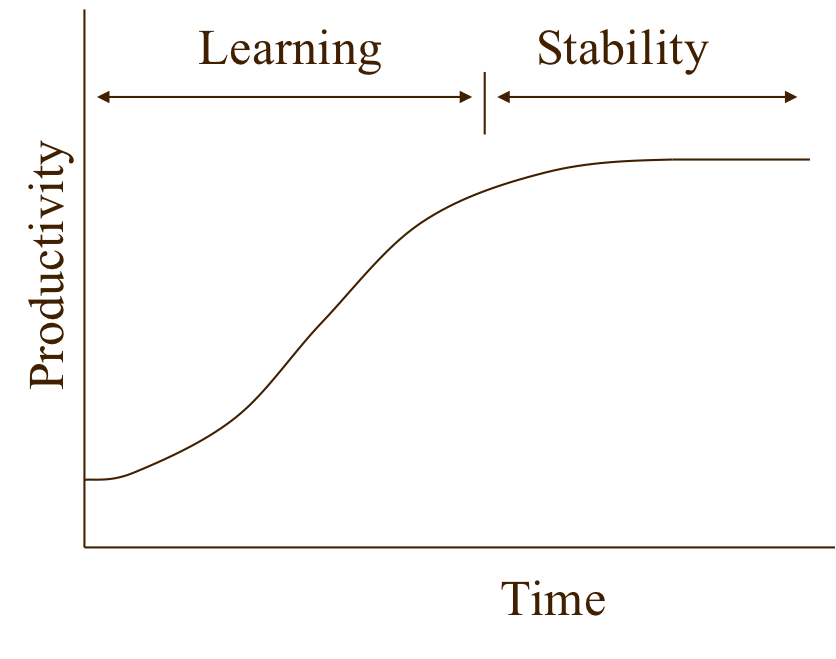
Learning curve
© Dr. Ling Ma
| 0 | F | 10 |
|---|---|---|
| 10 |
| 0 | A | 12 |
|---|---|---|
| 12 |
| 12 | C | 18 |
|---|---|---|
| 6 |
2
0
2
18
12
12
12
0
2
2
0
0
| 0 | F | |
|---|---|---|
| 9-12 |
| 0 | A | |
|---|---|---|
| 10-13 |
| C | ||
|---|---|---|
| 6 |
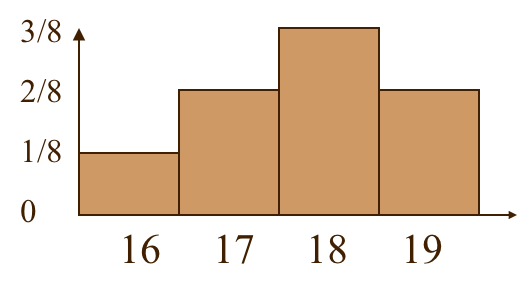
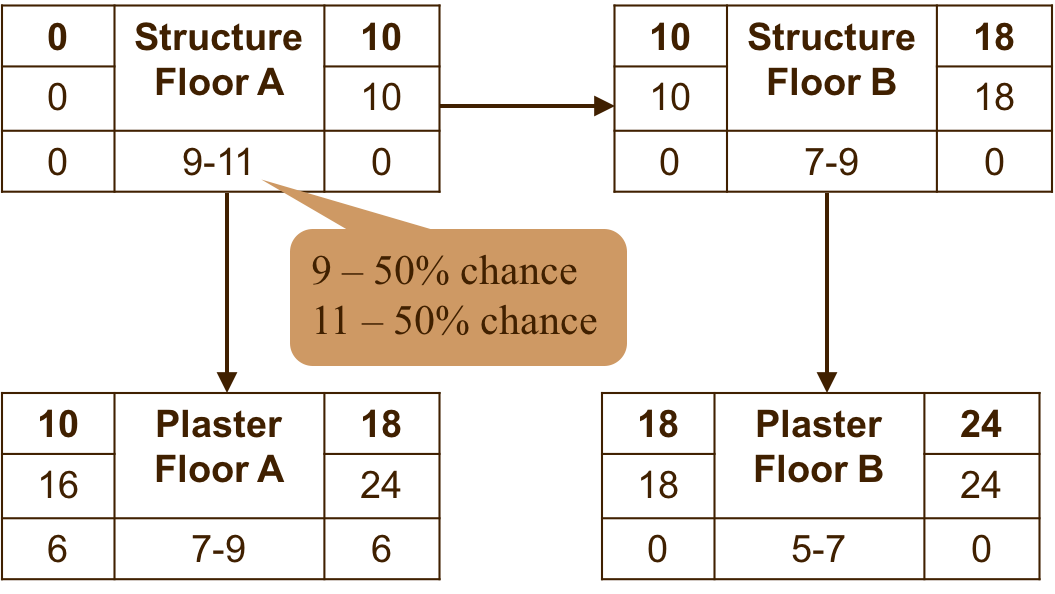
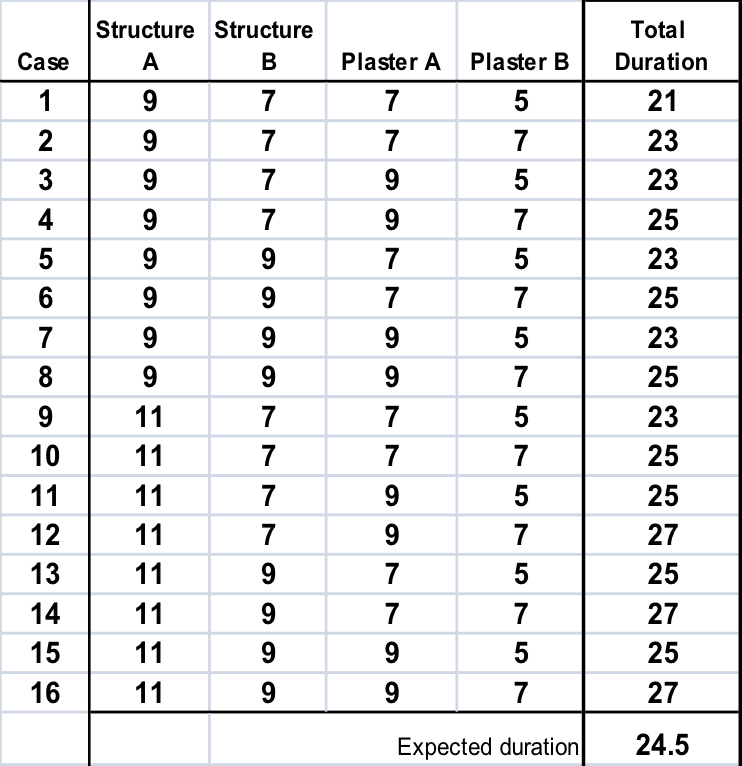
If the durations of the tasks are uncertain
Assume that:
© Dr. Ling Ma
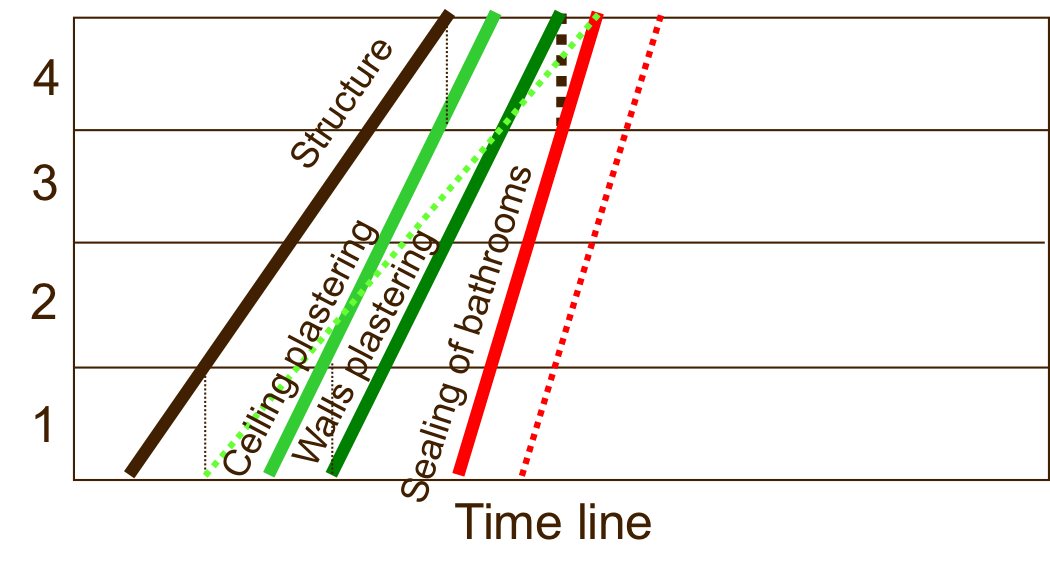
Note: Only one plaster crew is available
Suppose a uniform distribution of the probability of durations from D-1 to D+1 days
Case # 1: All minimal durations
Probability of this case: 0.5*0.5*0.5*0.5=0.125
© Dr. Ling Ma
© Dr. Ling Ma
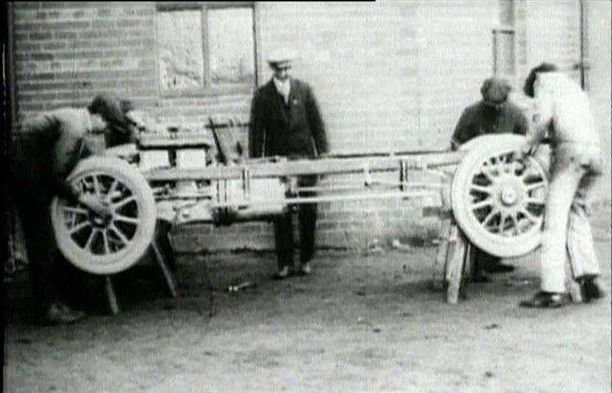
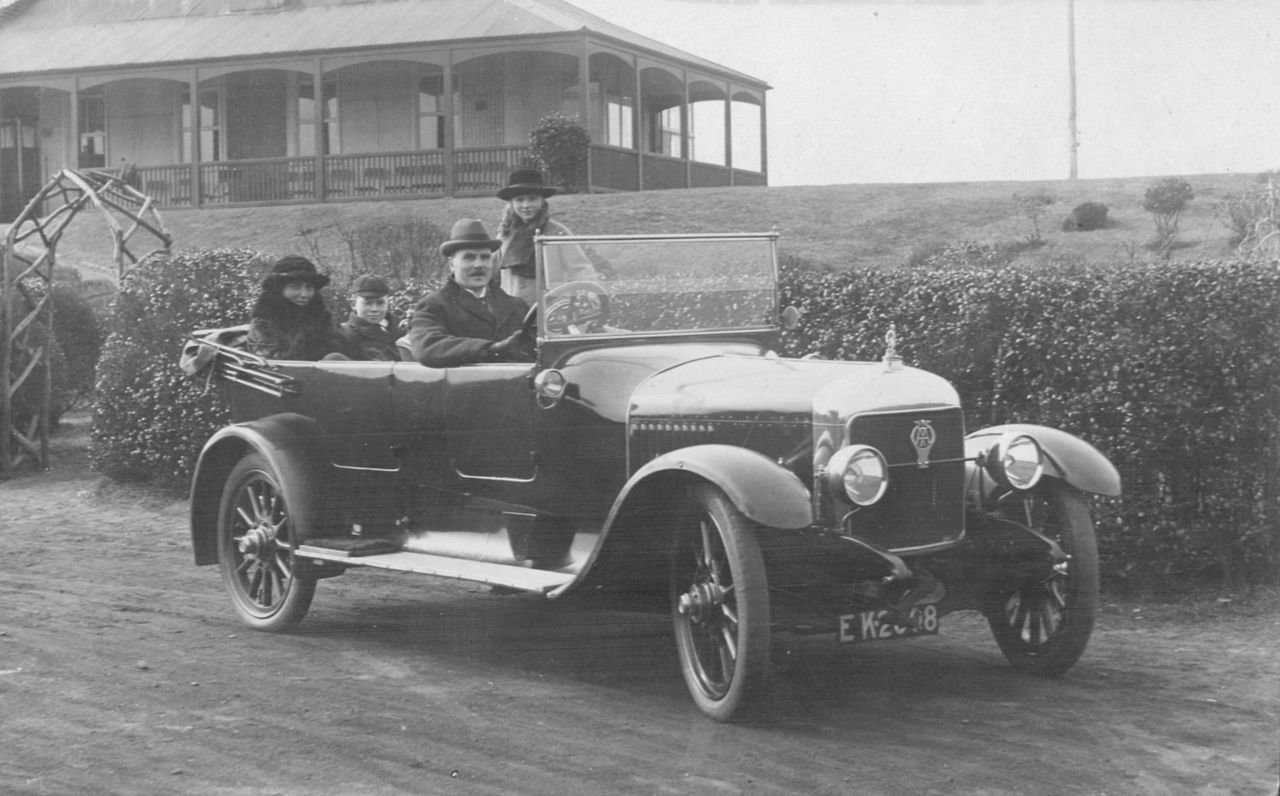
Vulcan 20 HP Tourer
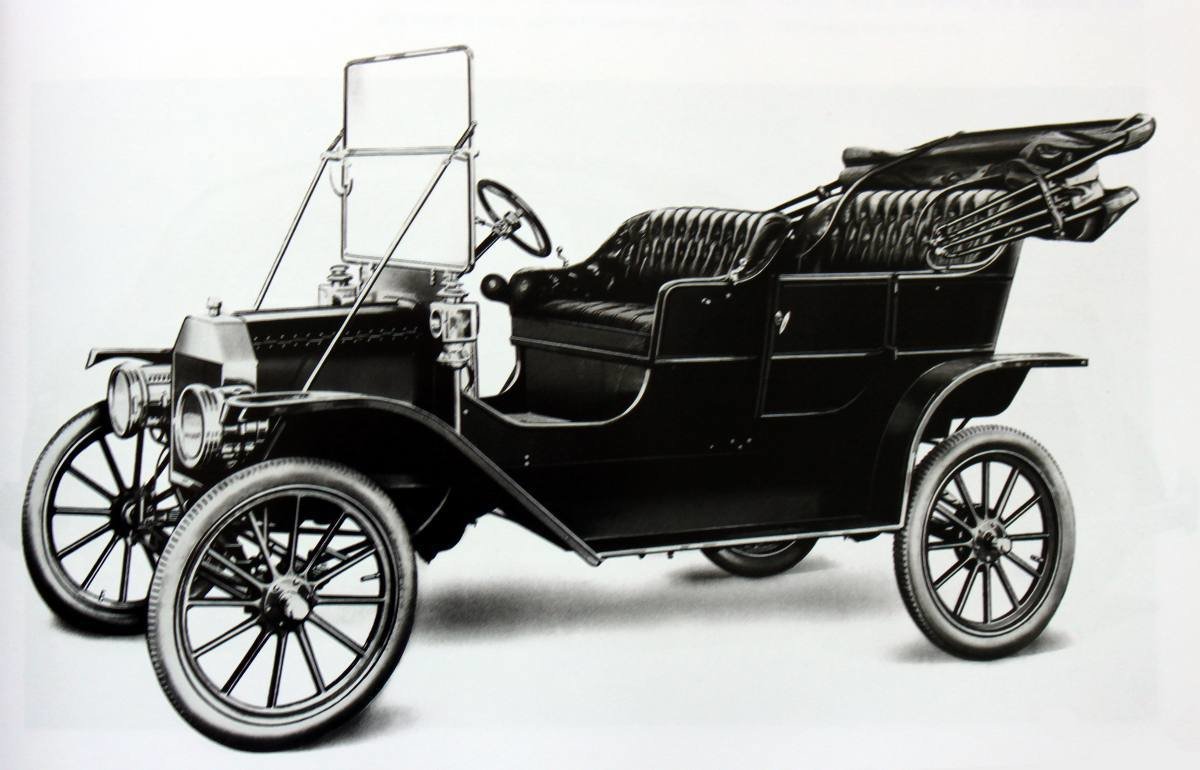
Henry Ford Model T
© Dr. Ling Ma
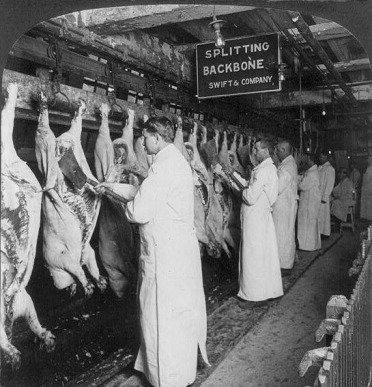
Disassembly line at the Chicago Meat Packing Factory
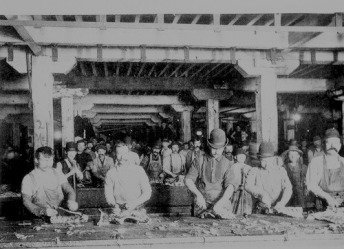
Assembly line at Ford
© Dr. Ling Ma
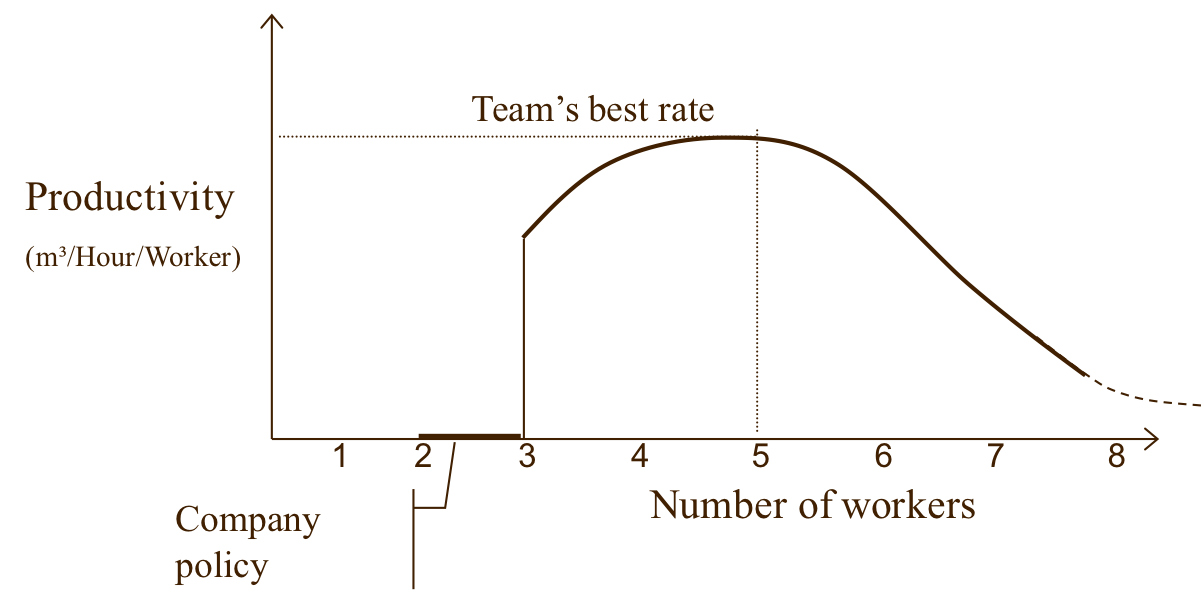
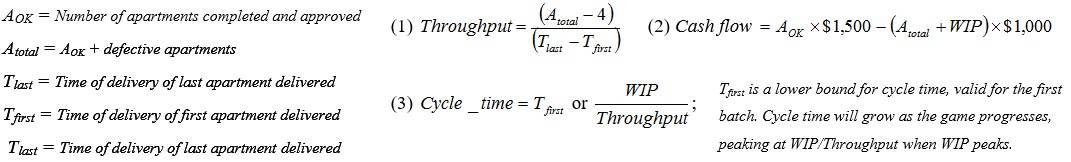
Production Performance Measure
© Dr. Ling Ma
© Dr. Ling Ma
© Dr. Ling Ma
© Dr. Ling Ma
© Dr. Ling Ma
© Dr. Ling Ma
2 hr
2 hr
2 hr
2 hr
| X | |||
|---|---|---|---|
T=0
T=2?
T=4?
T=6?
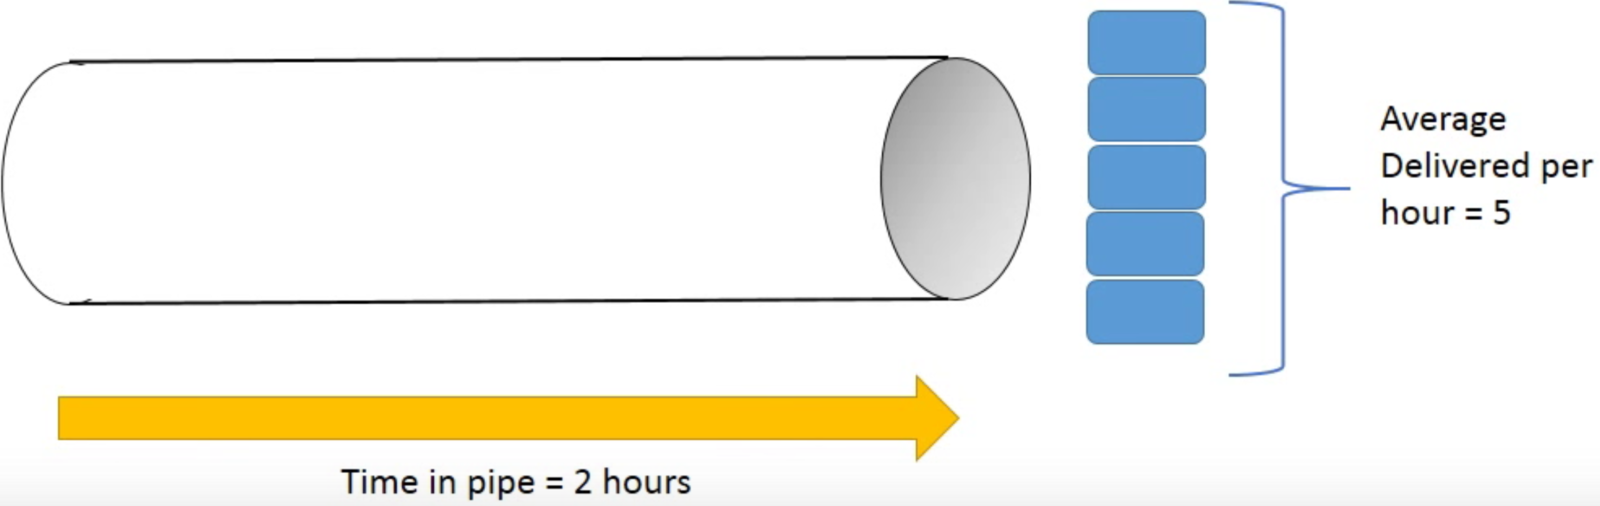
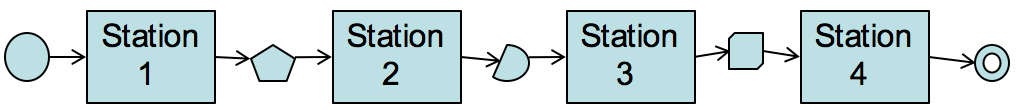
WIP=1
Station 1
Station 2
Station 3
Station 4
| X | X | ||
|---|---|---|---|
WIP=2
Station 1
Station 2
Station 3
Station 4
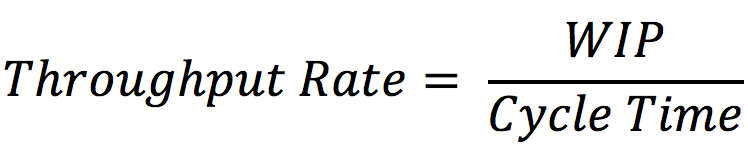
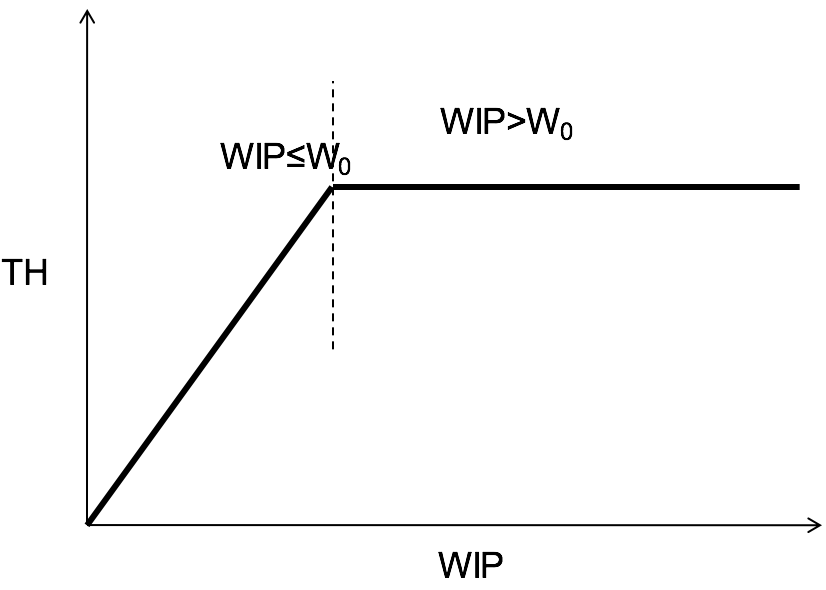
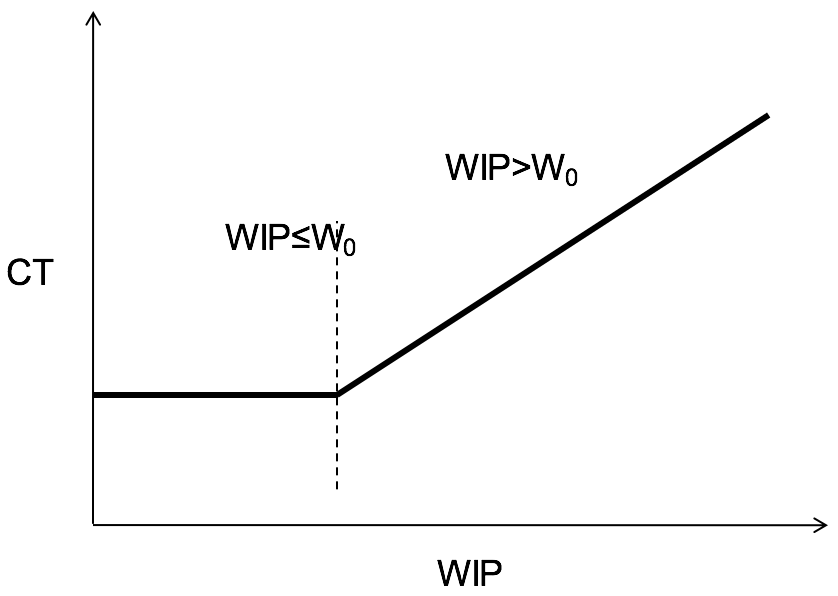
| WIP | 1 | 2 | 3 | 4 | 5 |
|---|---|---|---|---|---|
| CT | |||||
| TH |
© Dr. Ling Ma
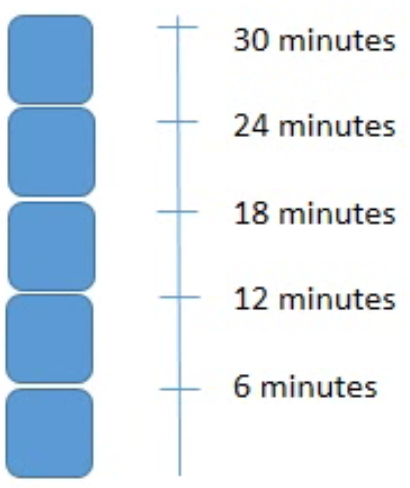
6 mins
6 mins
6 mins
6 mins
6 mins
6 mins
6 mins
6 mins
6 mins
6 mins
W0?
© Dr. Ling Ma
© Dr. Ling Ma
4 hr
Impact of batch size on TH and CT?
2 hr
2 hr
2 hr
Processing time
Batch size
2
1
1
1
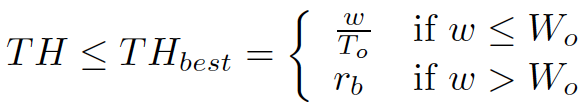
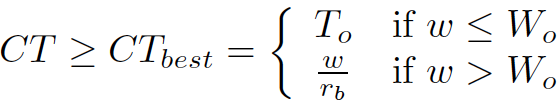
Total processing time T0 = ___
Bottleneck rate rb = ___
Critical WIP W0 = ___
| WIP | 2 | 4 | 5 | 7 |
|---|---|---|---|---|
| CT | 12 | |||
| TH | 2/12 |
© Dr. Ling Ma
4 hr
2 hr
2 hr
2 hr
Processing
time
Batch size
2
1
1
1
| t=0 | #2, #1 | ||||||||
| t=1 | #2, #1 | ||||||||
| t=2 | #2, #1 | ||||||||
| t=3 | #2, #1 | ||||||||
| t=4 | #2 | #1 | |||||||
| t=5 | #2 | #1 | |||||||
| t=6 | #2 | #1 | |||||||
| t=7 | #2 | #1 | |||||||
| t=8 | #2 | #1 | |||||||
| t=9 | #2 | #1 | |||||||
| t=10 | #2 | #1 | |||||||
| t=11 | #2 | ||||||||
| t=12 | #2 | ||||||||
| t=13 | |||||||||
| t=14 |
© Dr. Ling Ma
| t=0 | #4, #3 | #2 | #1 | ||||||
| t=1 | #4, #3 | #2 | #1 | ||||||
| t=2 | #4, #3 | #2 | #1 | ||||||
| t=3 | #4, #3 | #2 | #1 | ||||||
| t=4 | #4 | #3 | #2 | #1 | |||||
| t=5 | #4 | #3 | #2 | ||||||
| t=6 | #4 | #3 | #2 | ||||||
| t=7 | #4 | #3 | |||||||
| t=8 | #4 | #3 | |||||||
| t=9 | #4 | #3 | |||||||
| t=10 | #4 | #3 | |||||||
| t=11 | #4 | ||||||||
| t=12 | #4 | ||||||||
| t=13 | |||||||||
| t=14 |
First, distribute the WIP to the system
It takes 12 days for the last two items - #3 and #4 to complete
The cycle time = 12 days
TH=WIP/12=4/12
© Dr. Ling Ma
| t=0 | #4, #5 | #3 | #2 | #1 | |||||
| t=1 | #4, #5 | #3 | #2 | #1 | |||||
| t=2 | #4, #5 | #3 | #2 | #1 | |||||
| t=3 | #4, #5 | #3 | #2 | ||||||
| t=4 | #5 | #4 | #3 | #2 | |||||
| t=5 | #5 | #4 | #3 | ||||||
| t=6 | #5 | #4 | #3 | ||||||
| t=7 | #5 | #4 | |||||||
| t=8 | #5 | #4 | |||||||
| t=9 | #5 | #4 | |||||||
| t=10 | #5 | #4 | |||||||
| t=11 | #5 | ||||||||
| t=12 | #5 | ||||||||
| t=13 | |||||||||
| t=14 |
First, distribute the WIP to the system
© Dr. Ling Ma
© Dr. Ling Ma
2 hr
4 hr
3 hr
3 hr
© Dr. Ling Ma
2 hr
4 hr
3 hr
3 hr
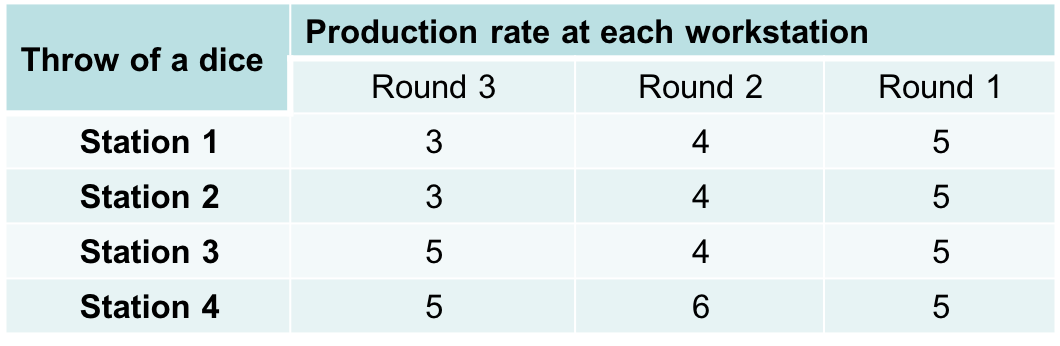
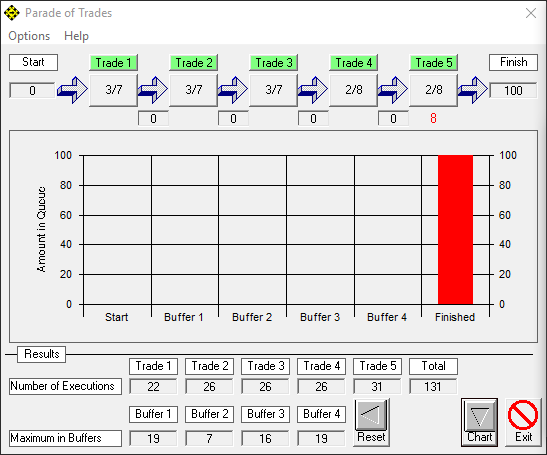
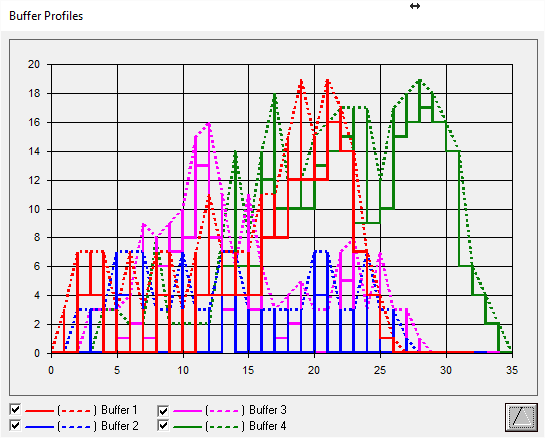
Software simulation – the ‘Parade of Trades’
A three-round experiment in which production rates vary.
The average production rate at each workstation will be 5 units/ round, but the actual instantaneous rate will depend on the throw of a dice.
© Dr. Ling Ma
© Dr. Ling Ma
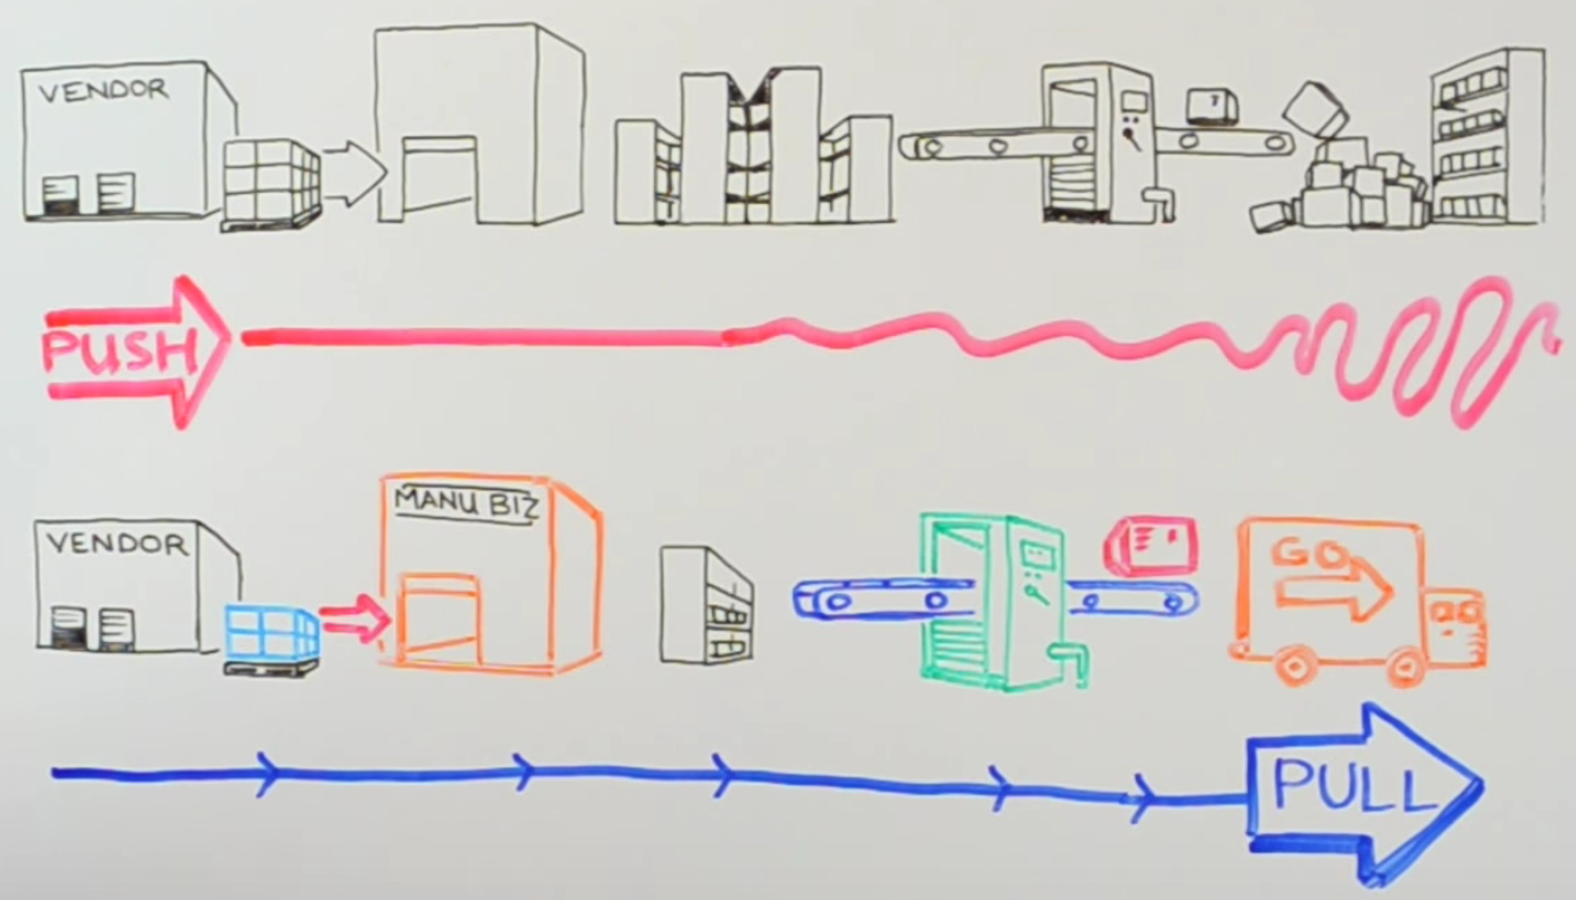
Minimum inventory - Just in Time (JIT)
© Dr. Ling Ma
As the Project Manager
Problems?
PUSH
Design Change?
PULL
© Dr. Ling Ma
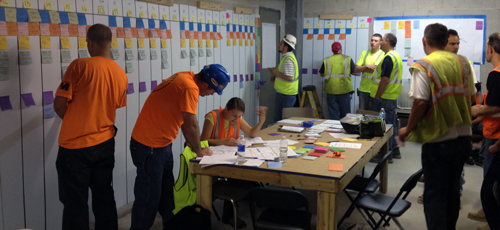
Pull scheduling meeting
© Dr. Ling Ma
Design
White paper and post notes
White sheets
Planning backwards
© Dr. Ling Ma
© Dr. Ling Ma
© Dr. Ling Ma
Variability in CPM
Variability in LBS
Variability in Production Line
| 0 | F | |
|---|---|---|
| 9-12 |
| 0 | A | |
|---|---|---|
| 10-13 |
| C | ||
|---|---|---|
| 6 |
© Dr. Ling Ma
Good Schedule?
© Dr. Ling Ma
Many more ...
© Dr. Ling Ma
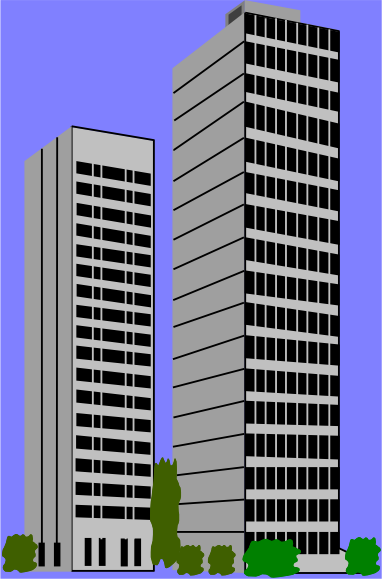
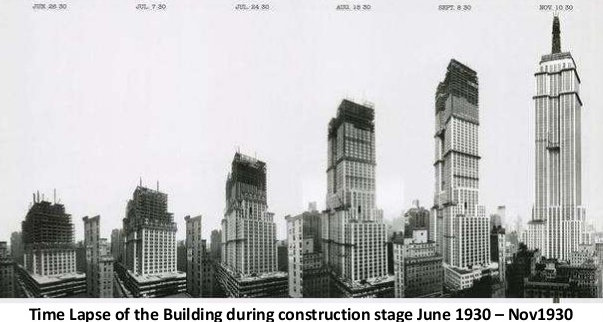
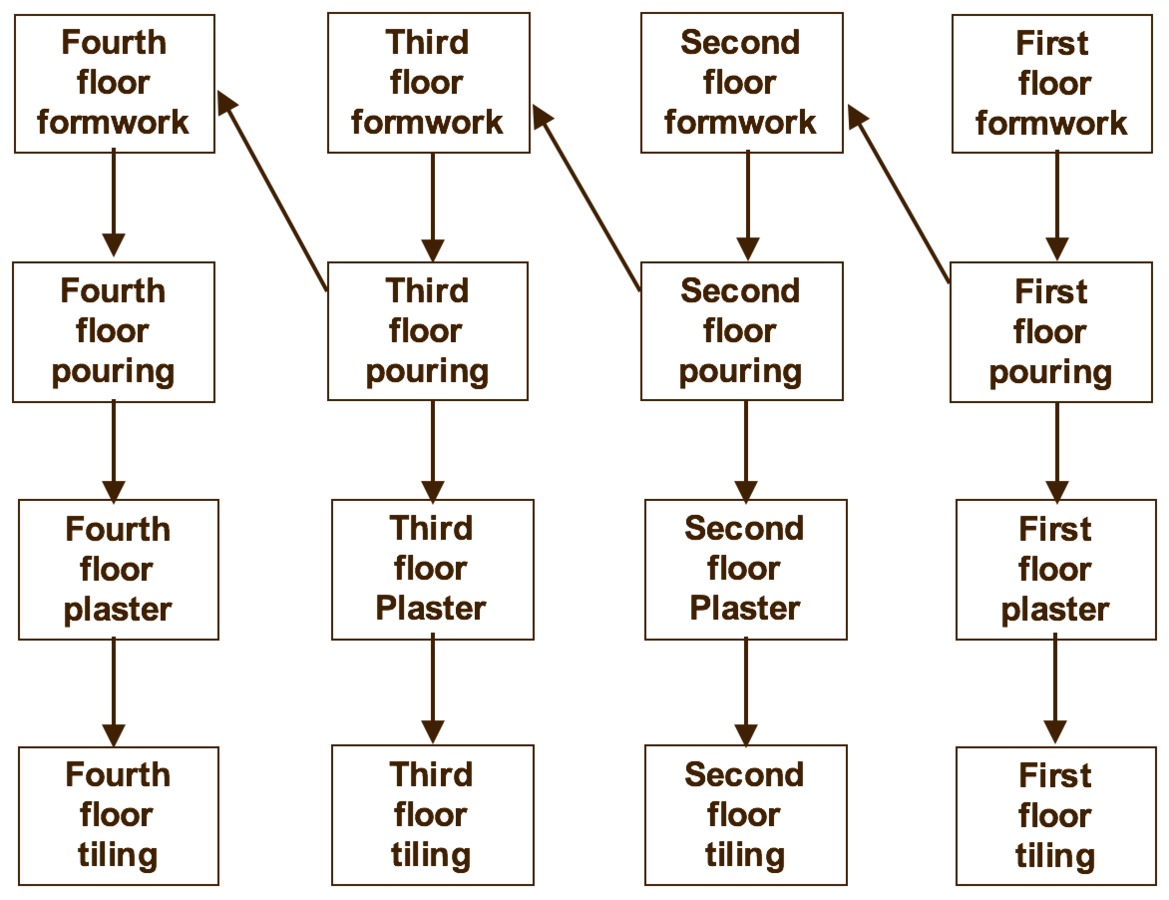
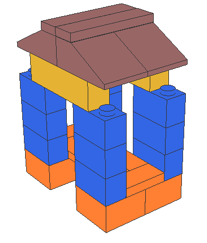
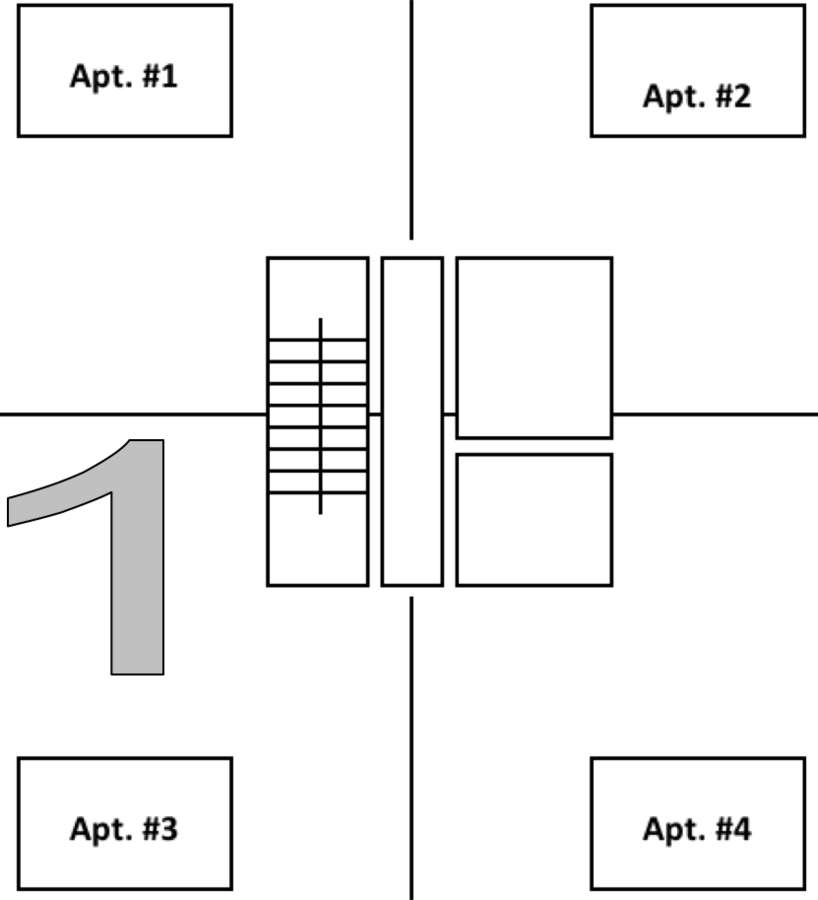
Build a 4-story concrete structure
Preconditions (Roll the dice)
© Dr. Ling Ma
© Dr. Ling Ma
© Dr. Ling Ma
Which one will you choose?
© Dr. Ling Ma
The "Physics" of Coordination
© Dr. Ling Ma
© Dr. Ling Ma
© Dr. Ling Ma
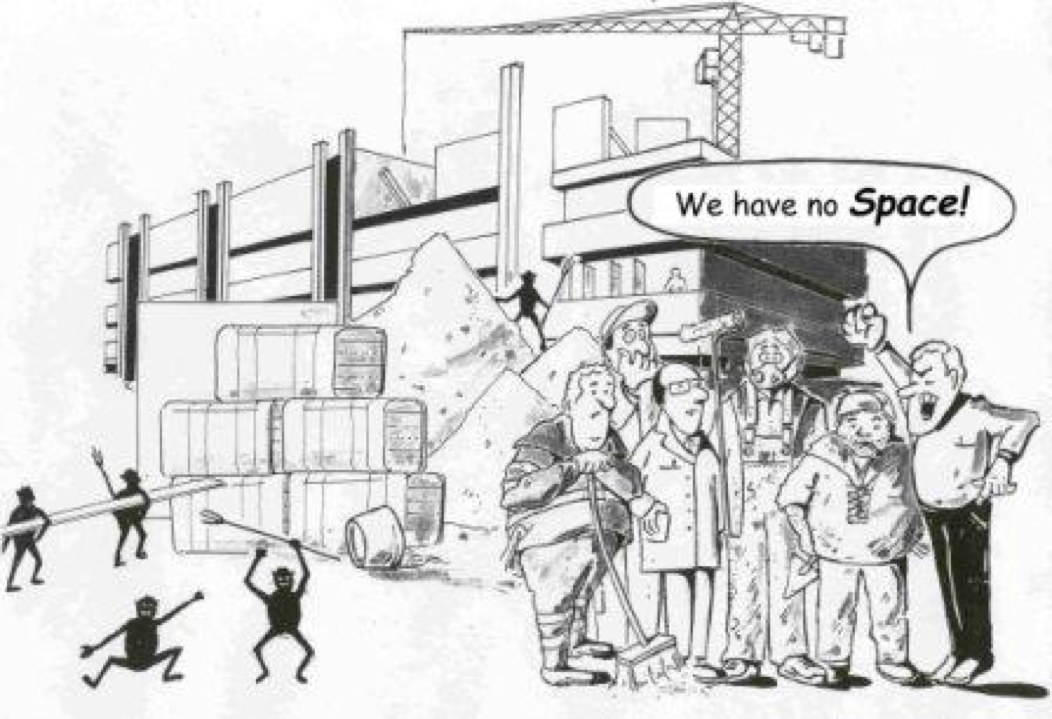
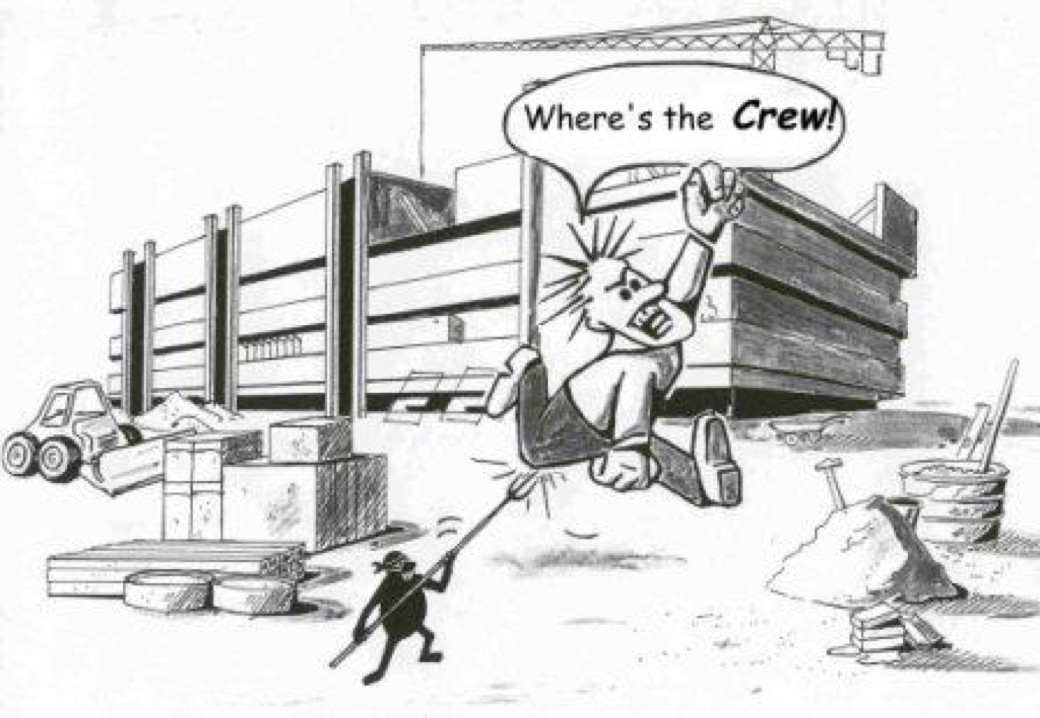
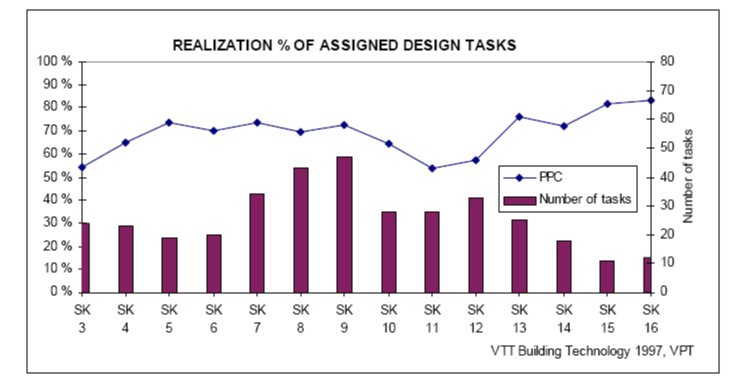
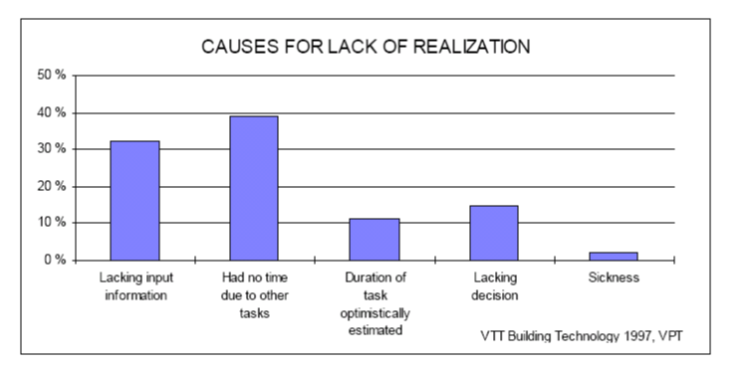
When an assignment is not completed by the end of the plan week, the Last Planner must record the reasons for non-completion (RNC). Reasons for plan failure fall into categories pertaining to directives, prerequisite work, resources, and process or output failures.
© Dr. Ling Ma
PPC Evolution
Record of PPC
© Dr. Ling Ma
© Dr. Ling Ma
© Dr. Ling Ma
National Building Research Institute
Technion - Faculty of Civil and Environmental Engineering
© Dr. Ling Ma
© Dr. Ling Ma
© Dr. Ling Ma
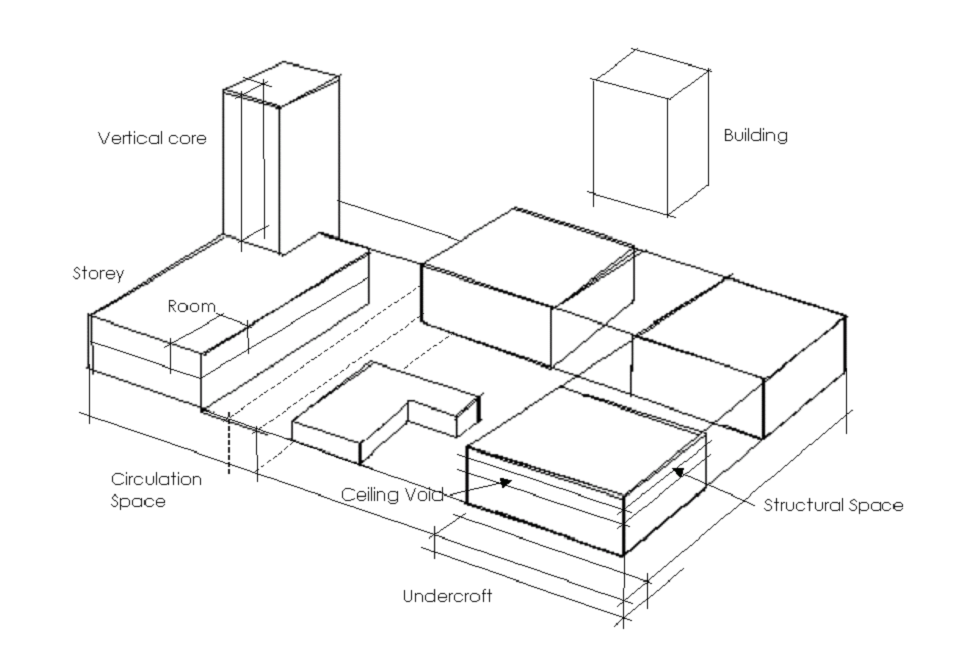
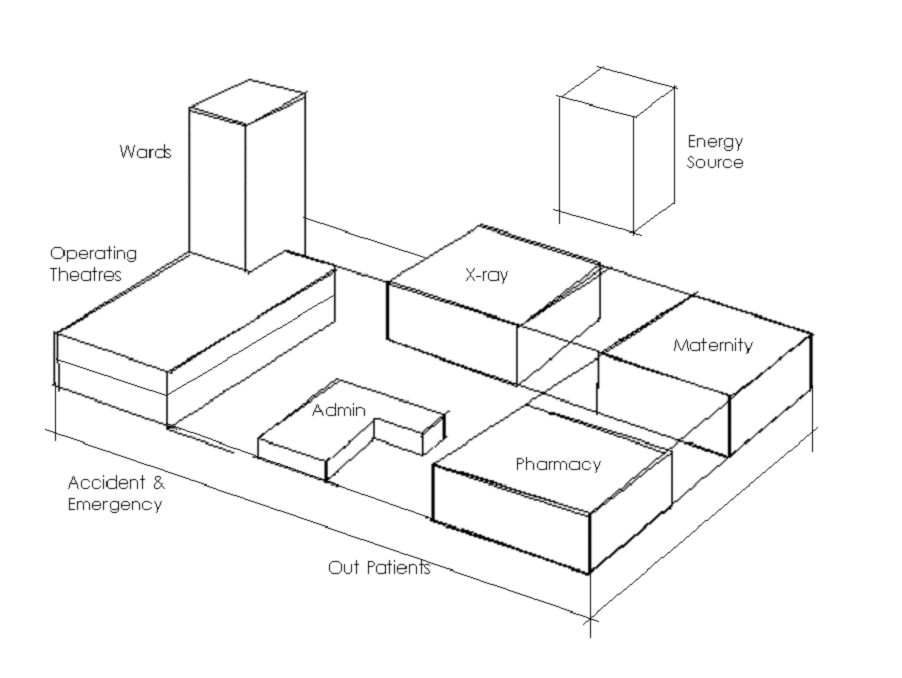
Building Composition Spaces
Functional Spaces
© Dr. Ling Ma
© Dr. Ling Ma
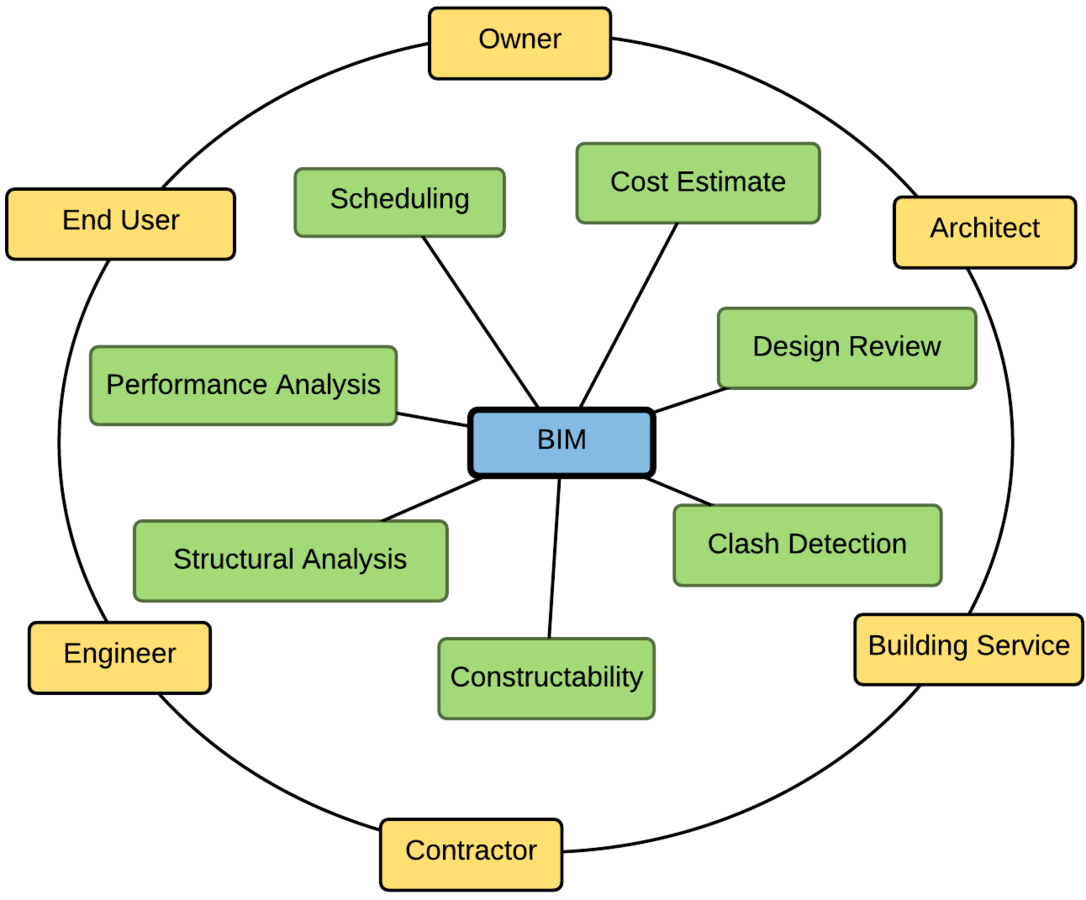
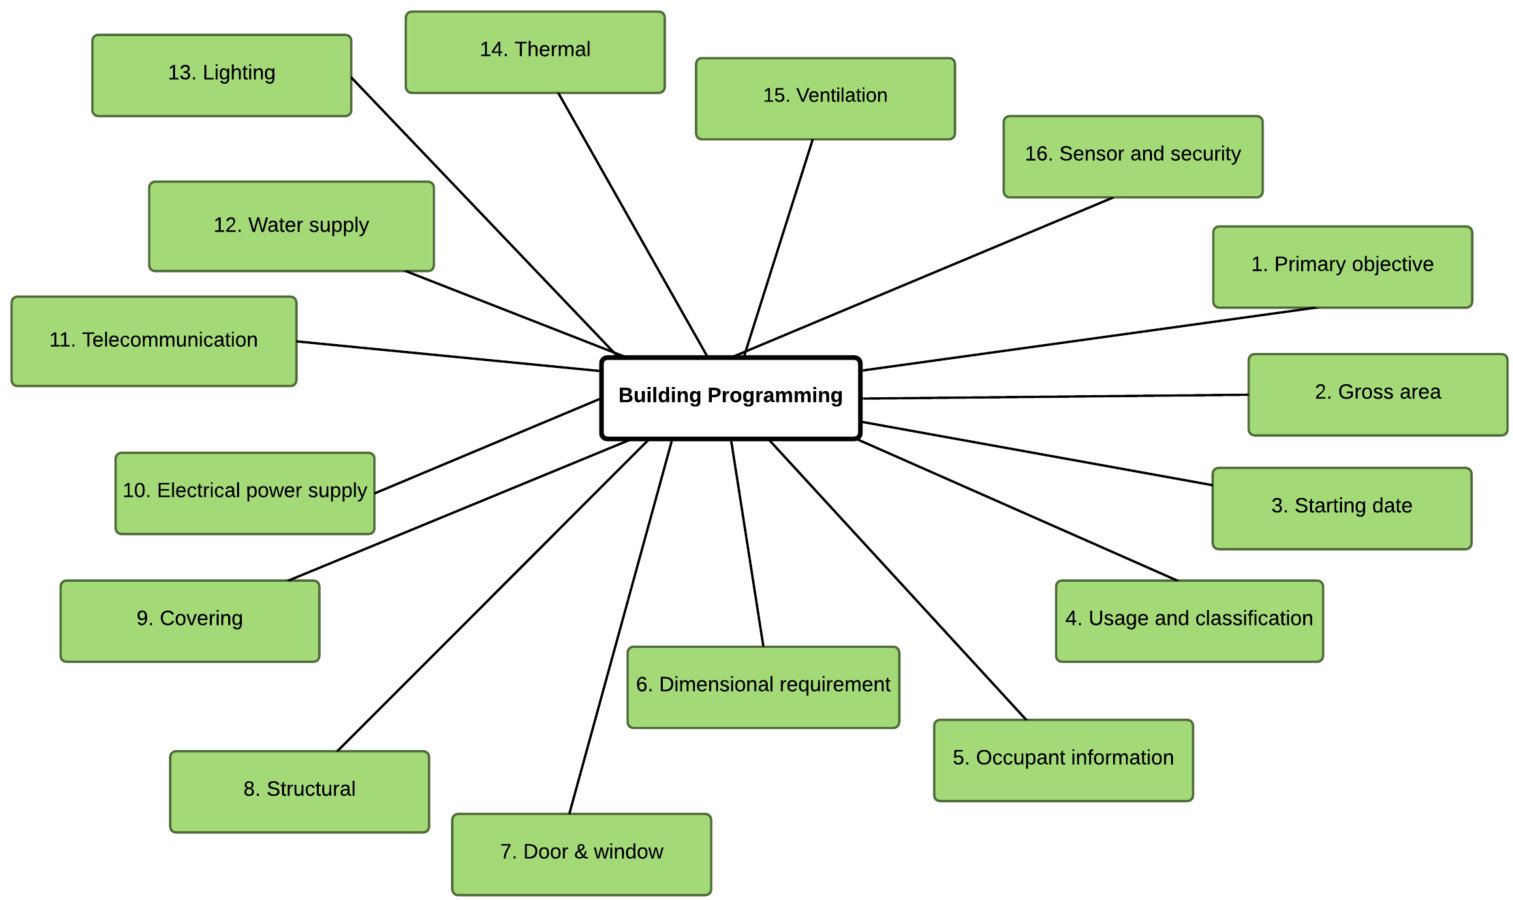
Example project - Architecture from National Institute of Building Sciences
© Dr. Ling Ma
Example project - Structural Engineering from National Institute of Building Sciences
© Dr. Ling Ma
Example project - Mechanical Engineering from National Institute of Building Sciences
© Dr. Ling Ma
Example project - Electrical Engineering from National Institute of Building Sciences
© Dr. Ling Ma
Example project - Plubming Engineering from National Institute of Building Sciences
© Dr. Ling Ma
© Dr. Ling Ma
© Dr. Ling Ma
© Dr. Ling Ma
© Dr. Ling Ma
© Dr. Ling Ma
© Dr. Ling Ma
© Dr. Ling Ma
© Dr. Ling Ma
© Dr. Ling Ma
Energy analysis
Structural analysis
© Dr. Ling Ma
© Dr. Ling Ma
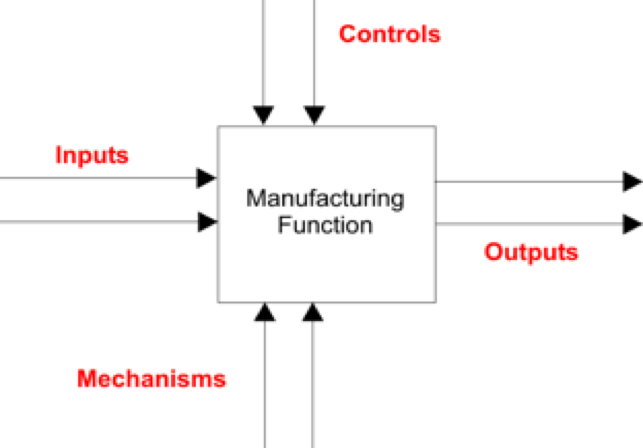
IDEF0 Model
Design Iterations
© Dr. Ling Ma
Constraint-Based Support for Collaboration in Design and Construction Lottaz, C., Clément, D., Faltings, B., and Smith, I. Journal of Computing in Civil Engineering 1999 13:1, 23-35
© Dr. Ling Ma
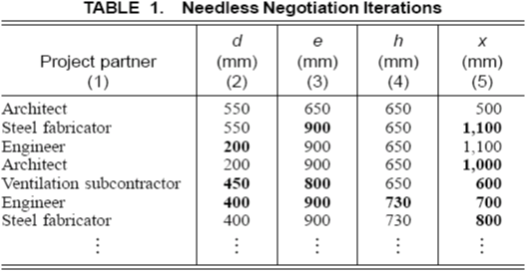
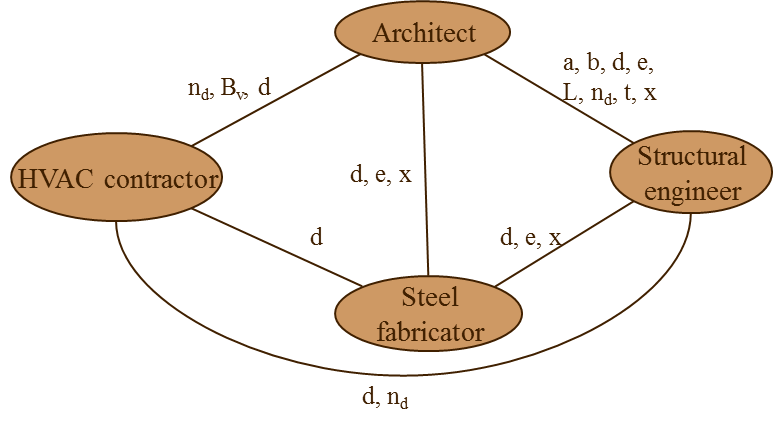
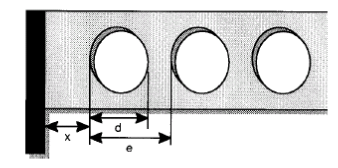
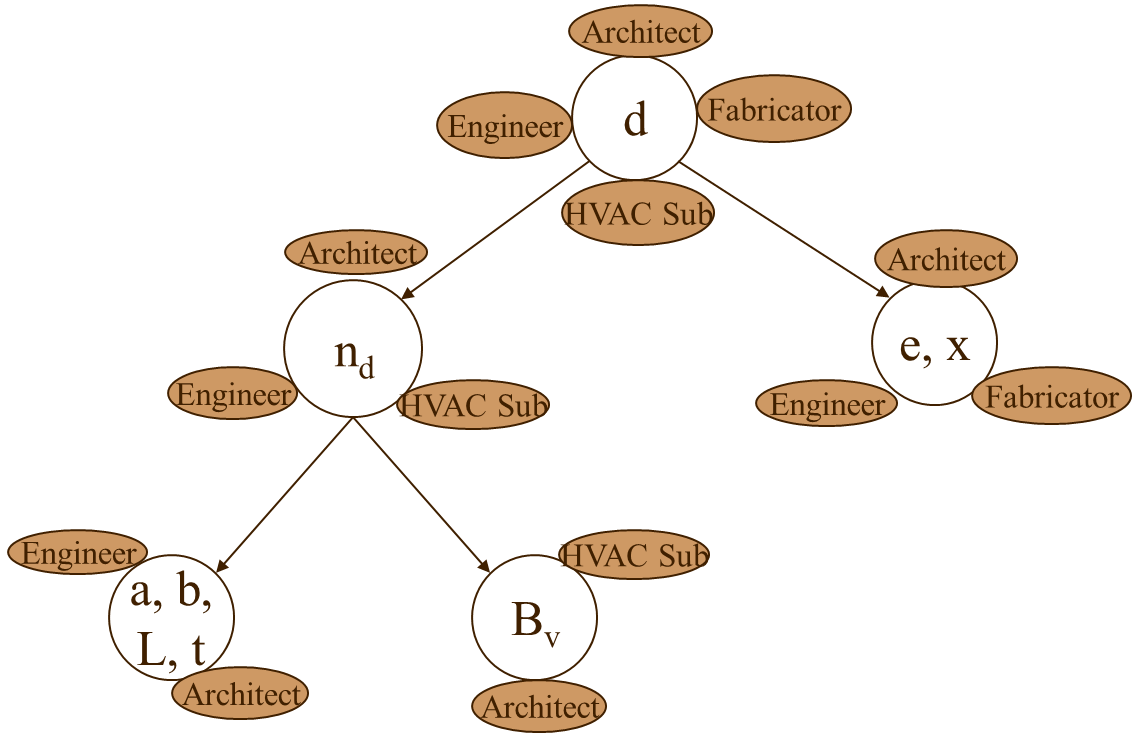
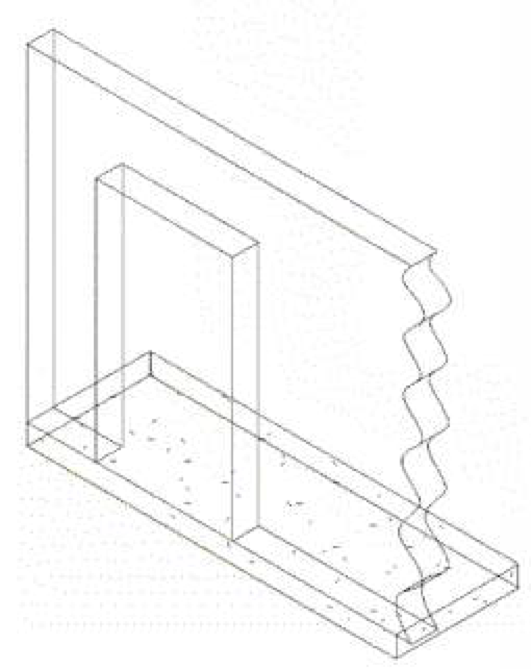
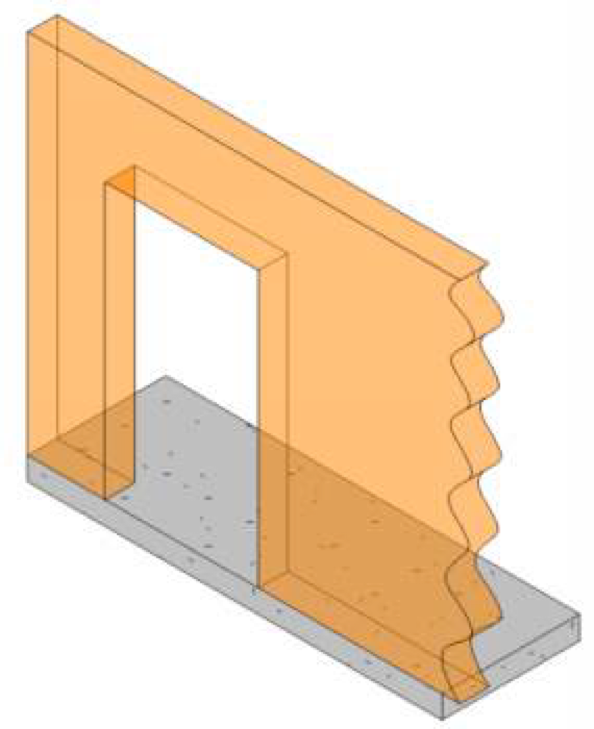
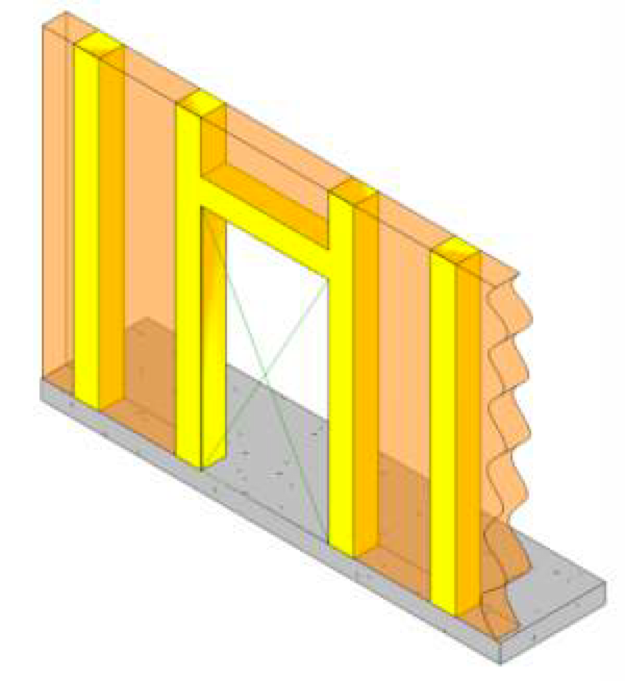
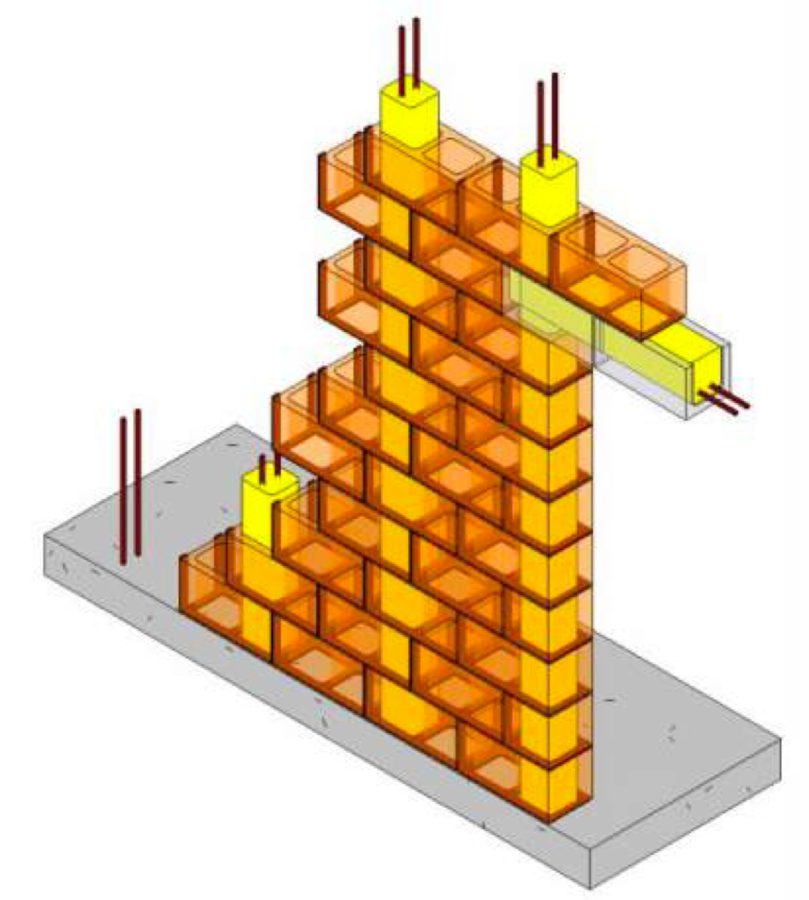
Example: designing a hole for HVAC ducts in a steel beam
a: chord height above hole
b: intermediary value
d: hole diameter
e: center-to-center hole spacing
L: beam span
nd: number of ducts
t: flange thickness
x: distance from support to first hole
Bv: floor volume
h: total beam height
x>=1.5d
Constraint-Based Support for Collaboration in Design and Construction Lottaz, C., Clément, D., Faltings, B., and Smith, I. Journal of Computing in Civil Engineering 1999 13:1, 23-35
© Dr. Ling Ma
© Dr. Ling Ma
© Dr. Ling Ma
Arrows represent
data dependencies
© Dr. Ling Ma
© Dr. Ling Ma
Rearrange the design process to minimize the impact of repetitive process
© Dr. Ling Ma
© Dr. Ling Ma
© Dr. Ling Ma
© Dr. Ling Ma
© Dr. Ling Ma
© Dr. Ling Ma
National Building Research Institute
Technion - Faculty of Civil and Environmental Engineering
© Dr. Ling Ma
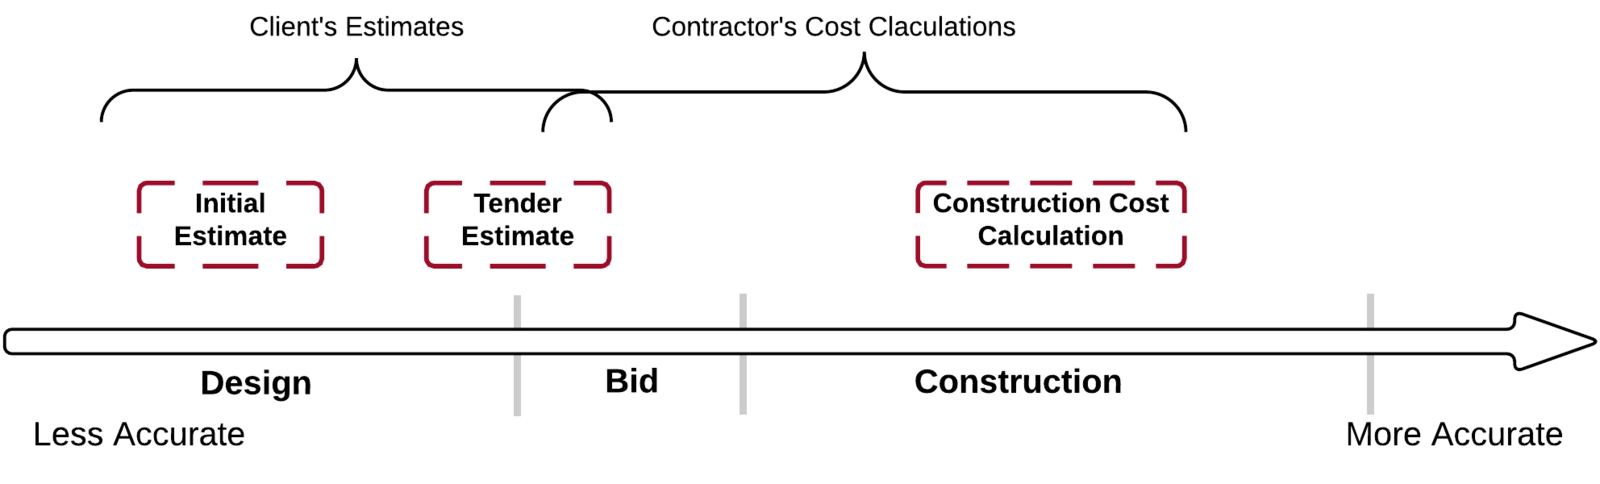
Client's Perspective
Contractor's Perspective
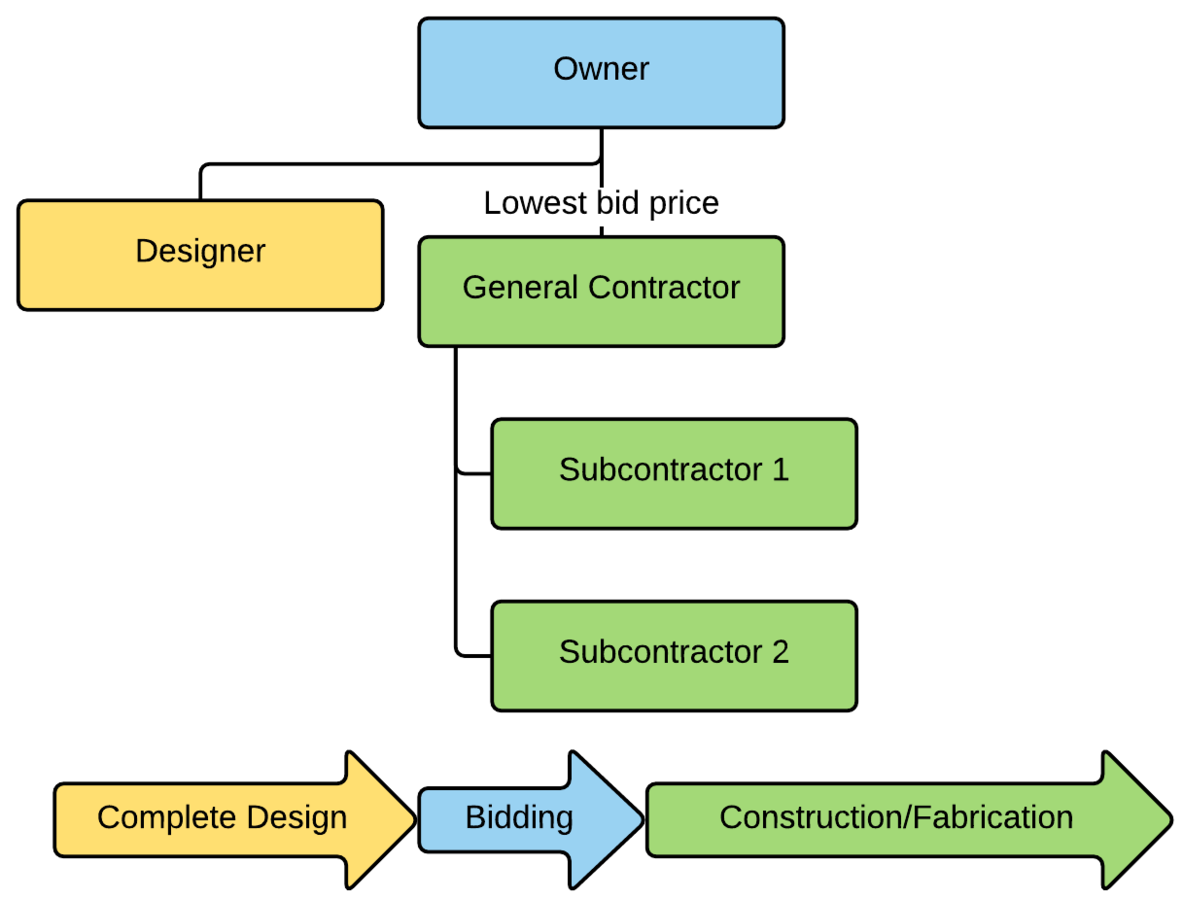
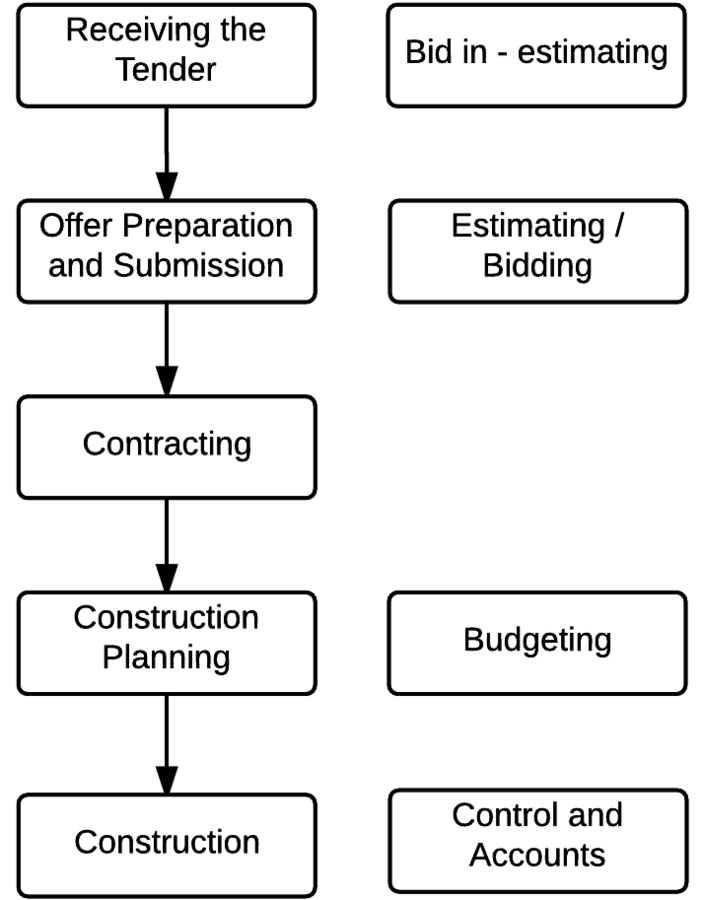
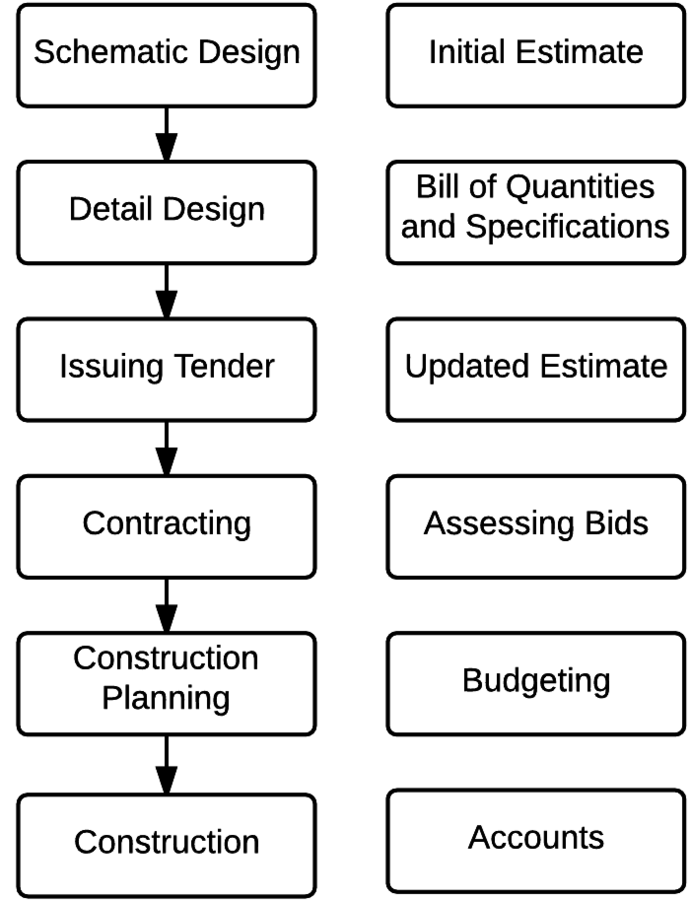
DBB
Cost Estimation
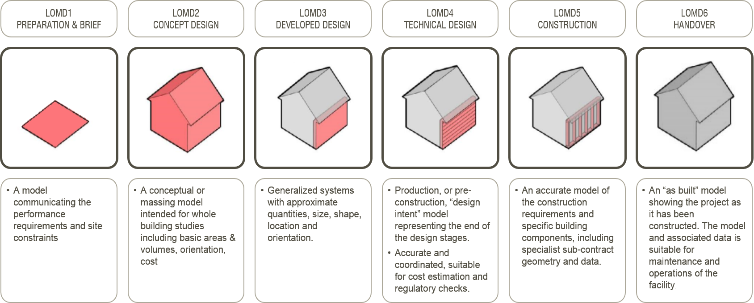
Levels of Development
© Dr. Ling Ma
UK - Construction Industry Council (CIC) BIM Protocol
Schematic Design
(SD)
Design Development
(DD)
Construction Document
(CD)
Facility Management
(FM)
The LOD of the estimate is highly related with LOD of design.
© Dr. Ling Ma
3 NIS
© Dr. Ling Ma
Single price rate method
Basic Measures
© Dr. Ling Ma
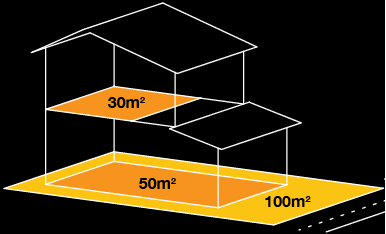
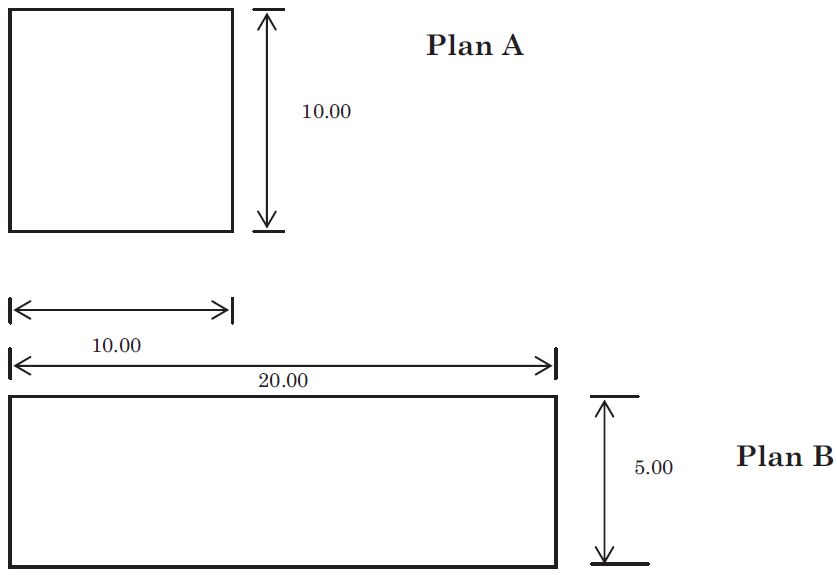
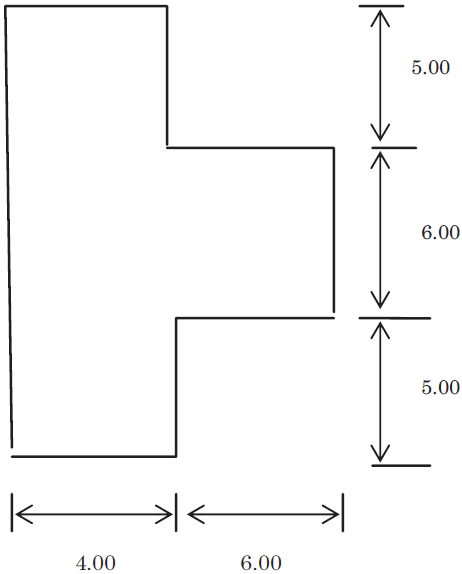
Area-perimeter ratio?
The design of a building can have a major impact on costs.
The amount of external envelope is important as it is one of the cost significant groups of elements, containing external walls and fenestration.
© Dr. Ling Ma
The design of a building can have a major impact on costs.
© Dr. Ling Ma
The design of a building can have a major impact on costs.
© Dr. Ling Ma
Measures of changes in items such as location, building costs or tender prices are performed using index numbers. Index numbers are a means of expressing data relative to a base year.
© Dr. Ling Ma
Cost adjustment
© Dr. Ling Ma
© Dr. Ling Ma
Standard libraries of a government office/public client
Libraries of construction companies
Drafting a new line item
Define the line items
Construction Specifications Institute (CSI) - UniFormat
© Dr. Ling Ma
LOD200
LOD300
LOD350
LOD400
Steel Framing Column
Generic column element
Generic wall element
Masonry Framing
Calculate unit price
© Dr. Ling Ma
Calculate quantities
© Dr. Ling Ma
© Dr. Ling Ma
© Dr. Ling Ma
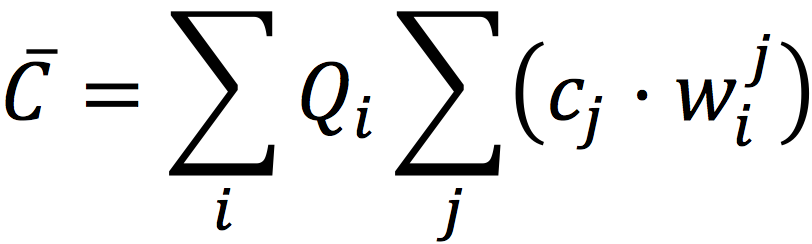
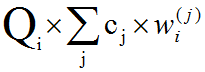
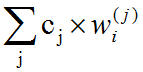
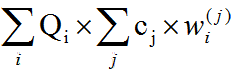
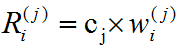
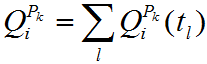
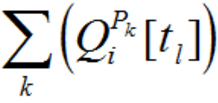
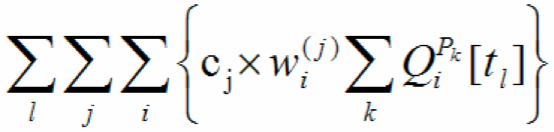
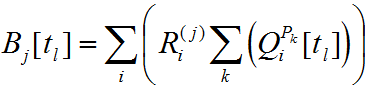
Amount of resource consumption units type j needed to produce one unit of product i
Cost of resource consumption unit j
Direct cost of all resource consumption units needed to produce one unit of product i
Total direct cost needed produce all quantity of product “i”
Direct cost of all project items
Resource Consumption
Products
Production Process
Work items in bill of quantities
i1,i2,i3,i4,i5
© Dr. Ling Ma
© Dr. Ling Ma
© Dr. Ling Ma
© Dr. Ling Ma
© Dr. Ling Ma
© Dr. Ling Ma
© Dr. Ling Ma
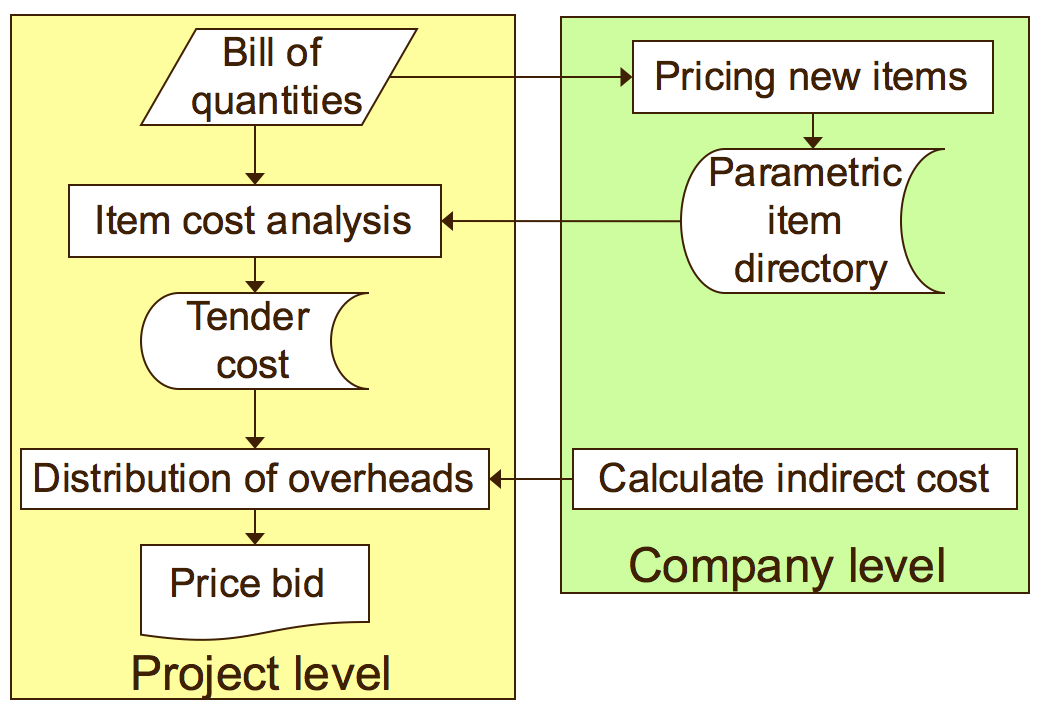
Even distribution: multiplying each price by same loading factor.
Distribution by items: multiplying all item prices in each chapter by a consistent factor for chapter. (Why do this?) Total cost of the project should be maintained.
Distribution by resource consumption : addition to each item price according to the weight of the resource consumption at the item price. Total cost of the project should be maintained.
Distribution by sections: multiplying each item price by a separate factor . Total cost of the project should be maintained.
© Dr. Ling Ma
© Dr. Ling Ma
© Dr. Ling Ma
© Dr. Ling Ma
© Dr. Ling Ma
© Dr. Ling Ma
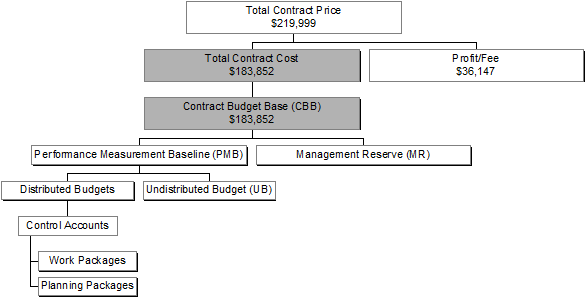
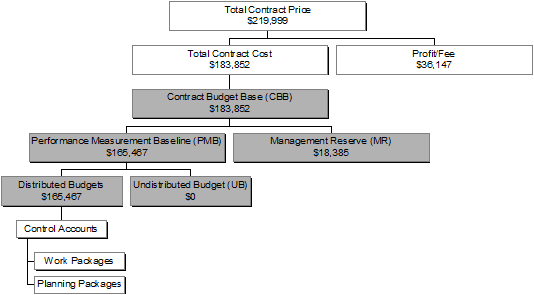
Schedule Baseline
Based on the Project Scope, the work activities in the WBS are scheduled to establish the Schedule Baseline
© Dr. Ling Ma
Cost Baseline
Based on the Project Scope and available resources, the project cost is allocated across the scheduled activities
© Dr. Ling Ma
Budget (Integrated) Baseline
The project budget is allocated across the scheduled activities and across time. The time phased allocation of resources.
© Dr. Ling Ma
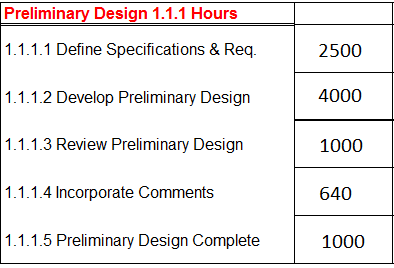
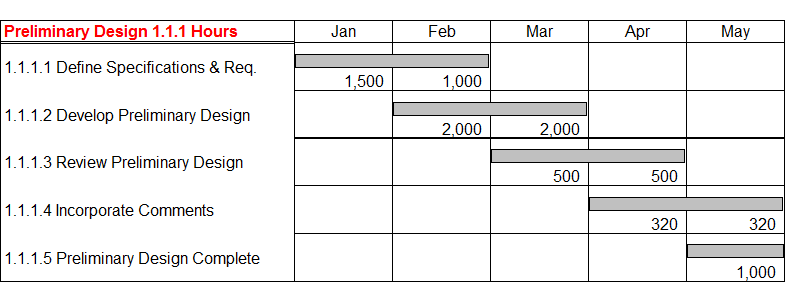
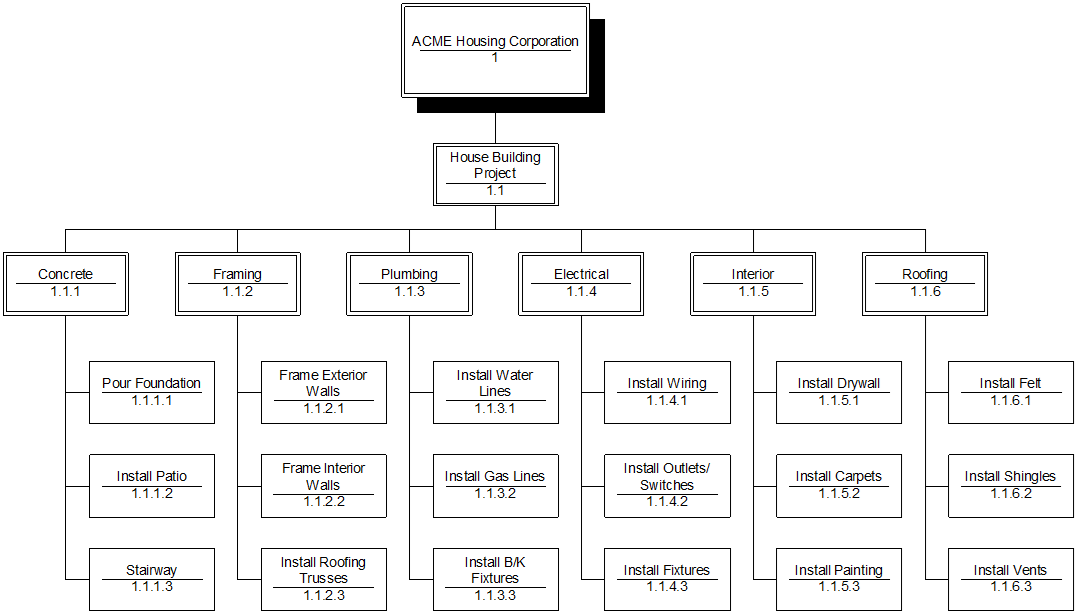
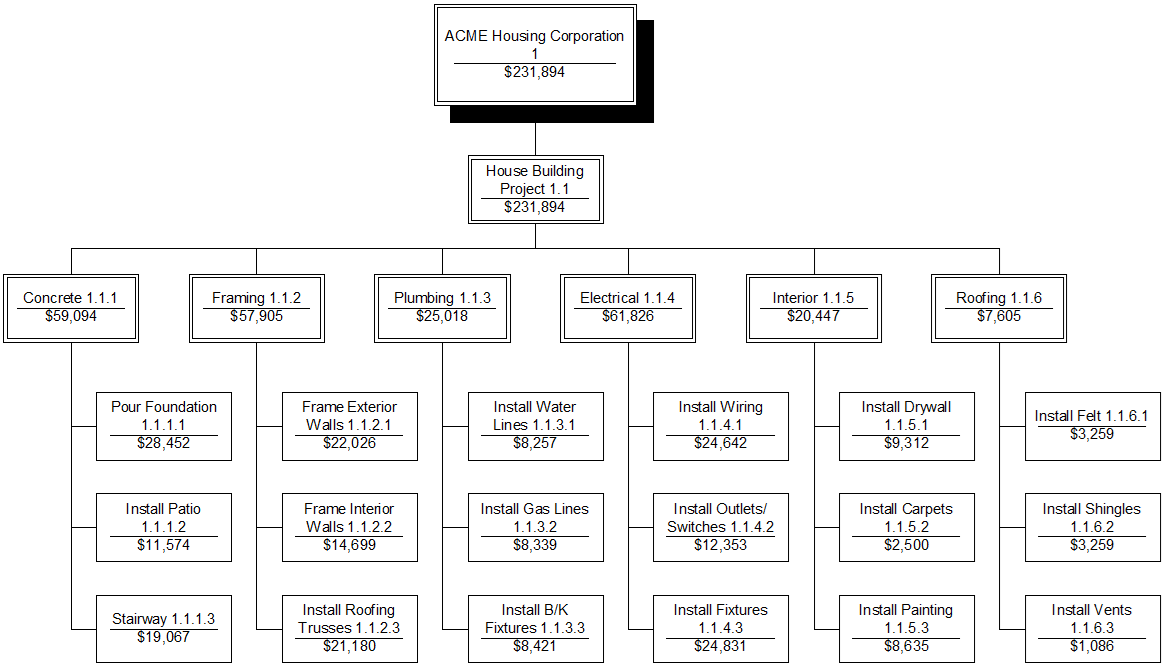
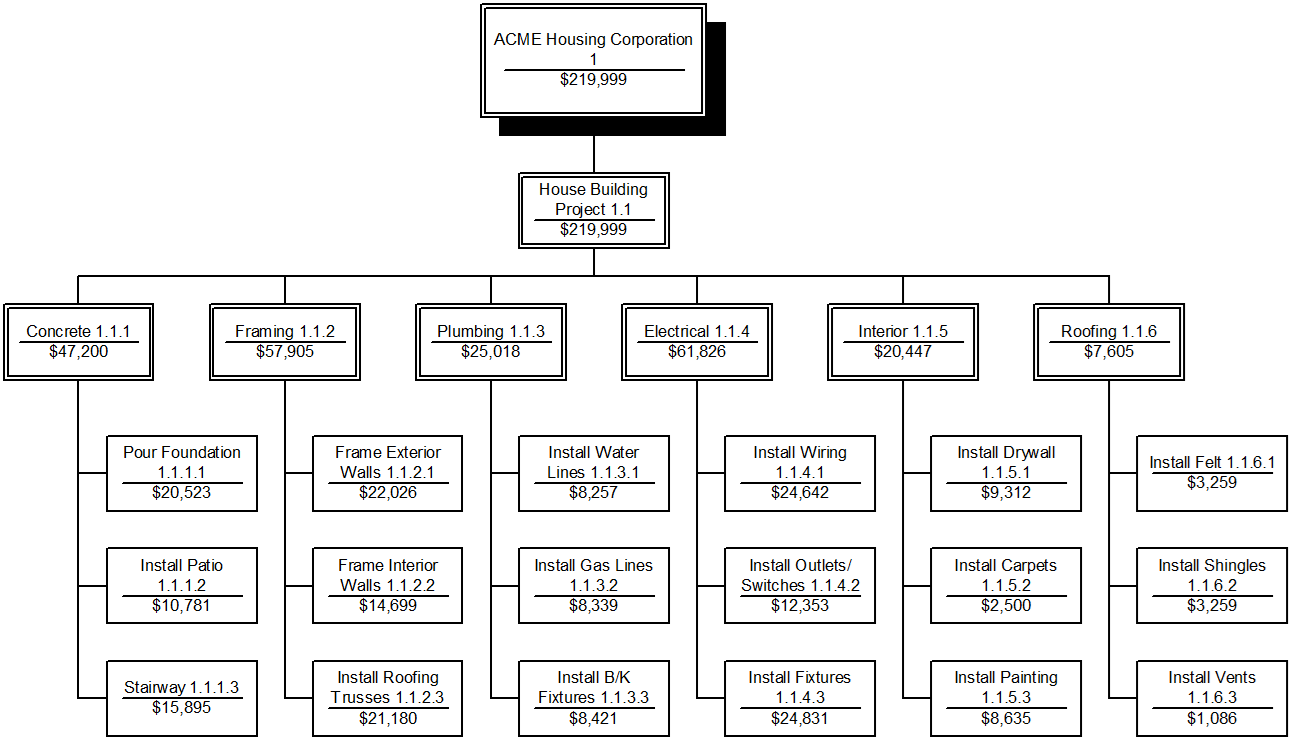
Specific for Building Projects of ACME House Corporation
© Dr. Ling Ma
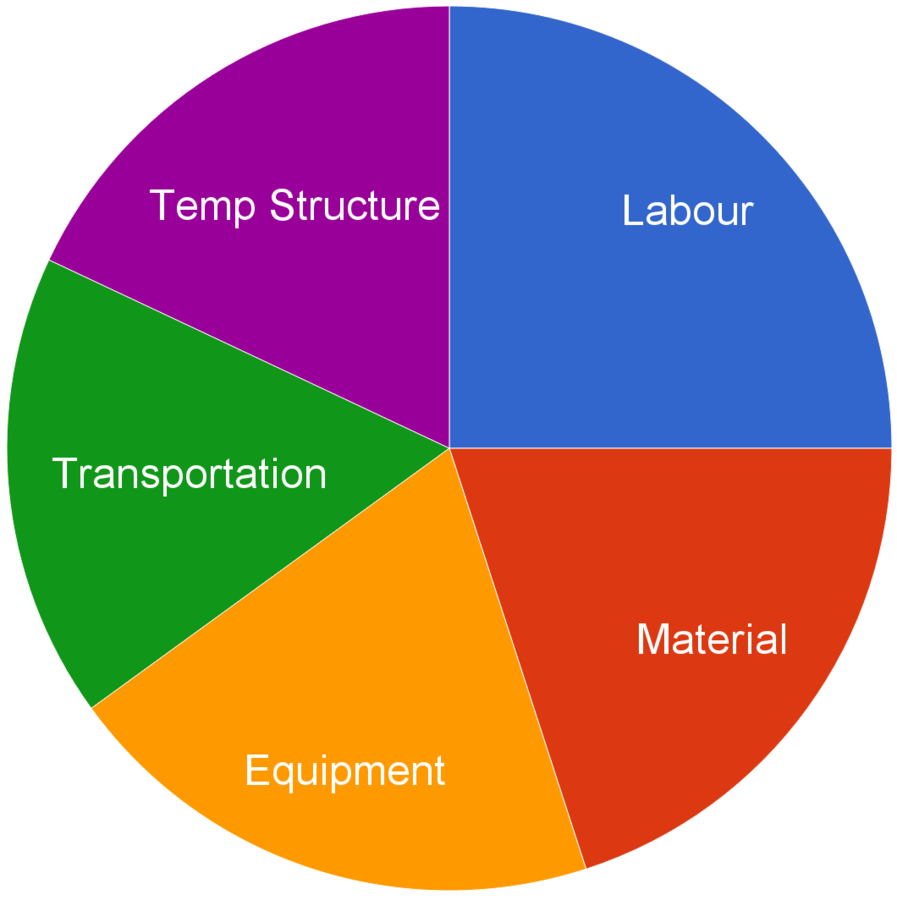
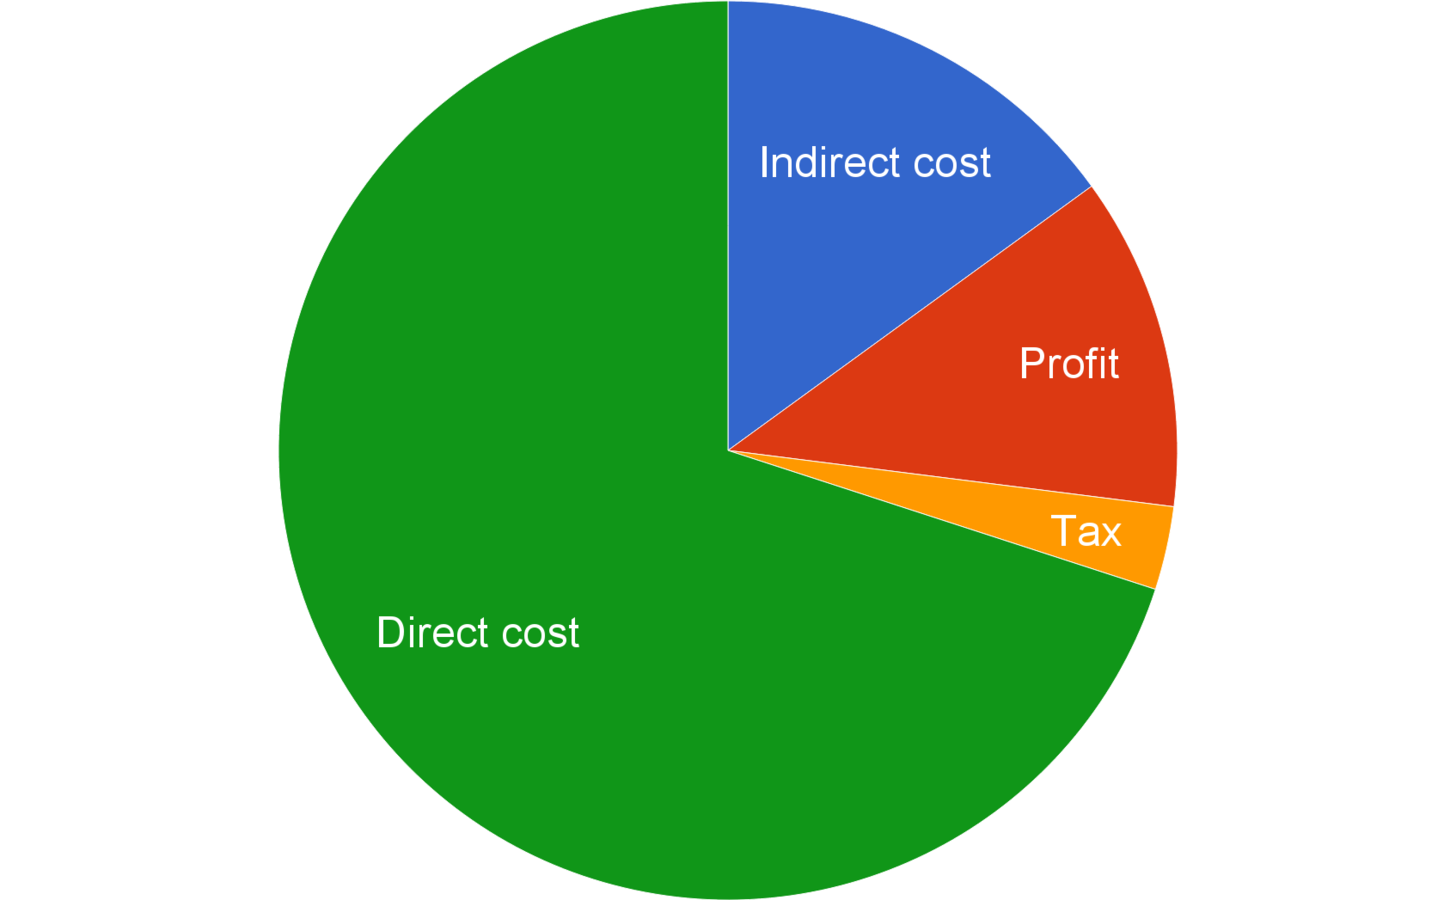
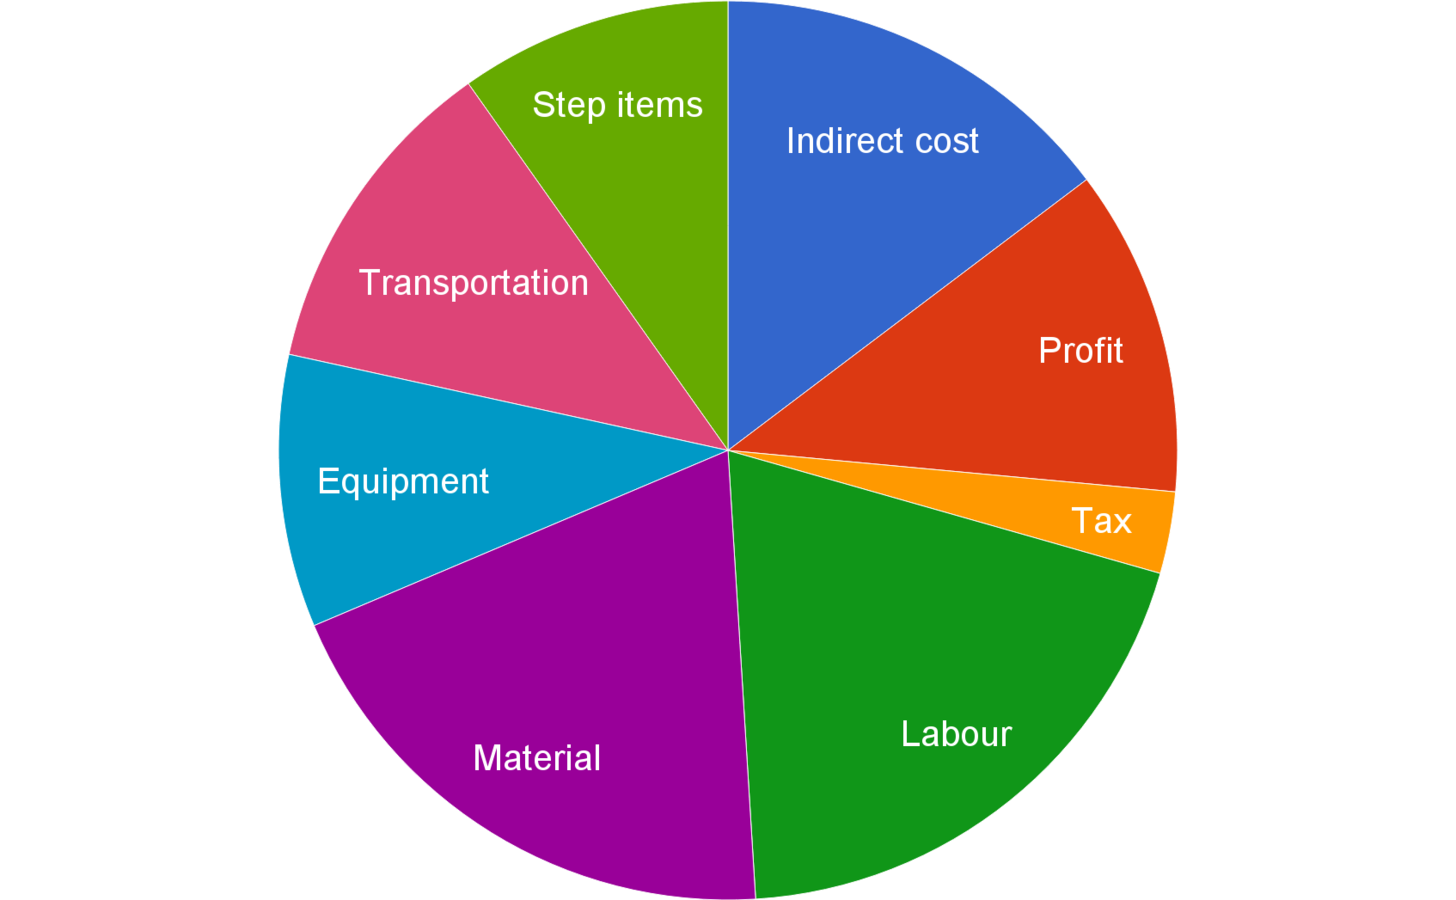
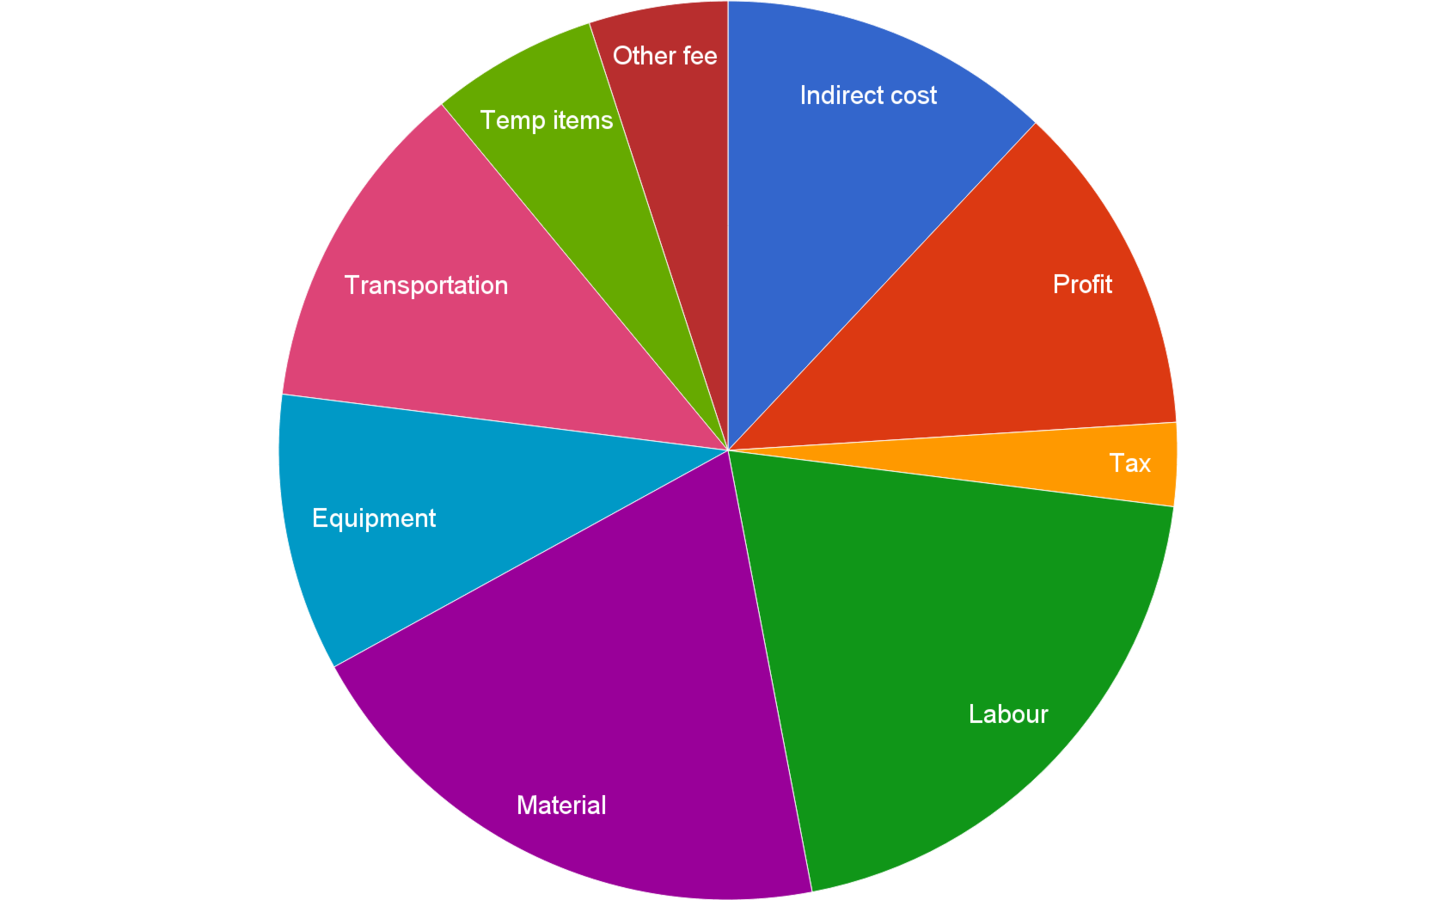
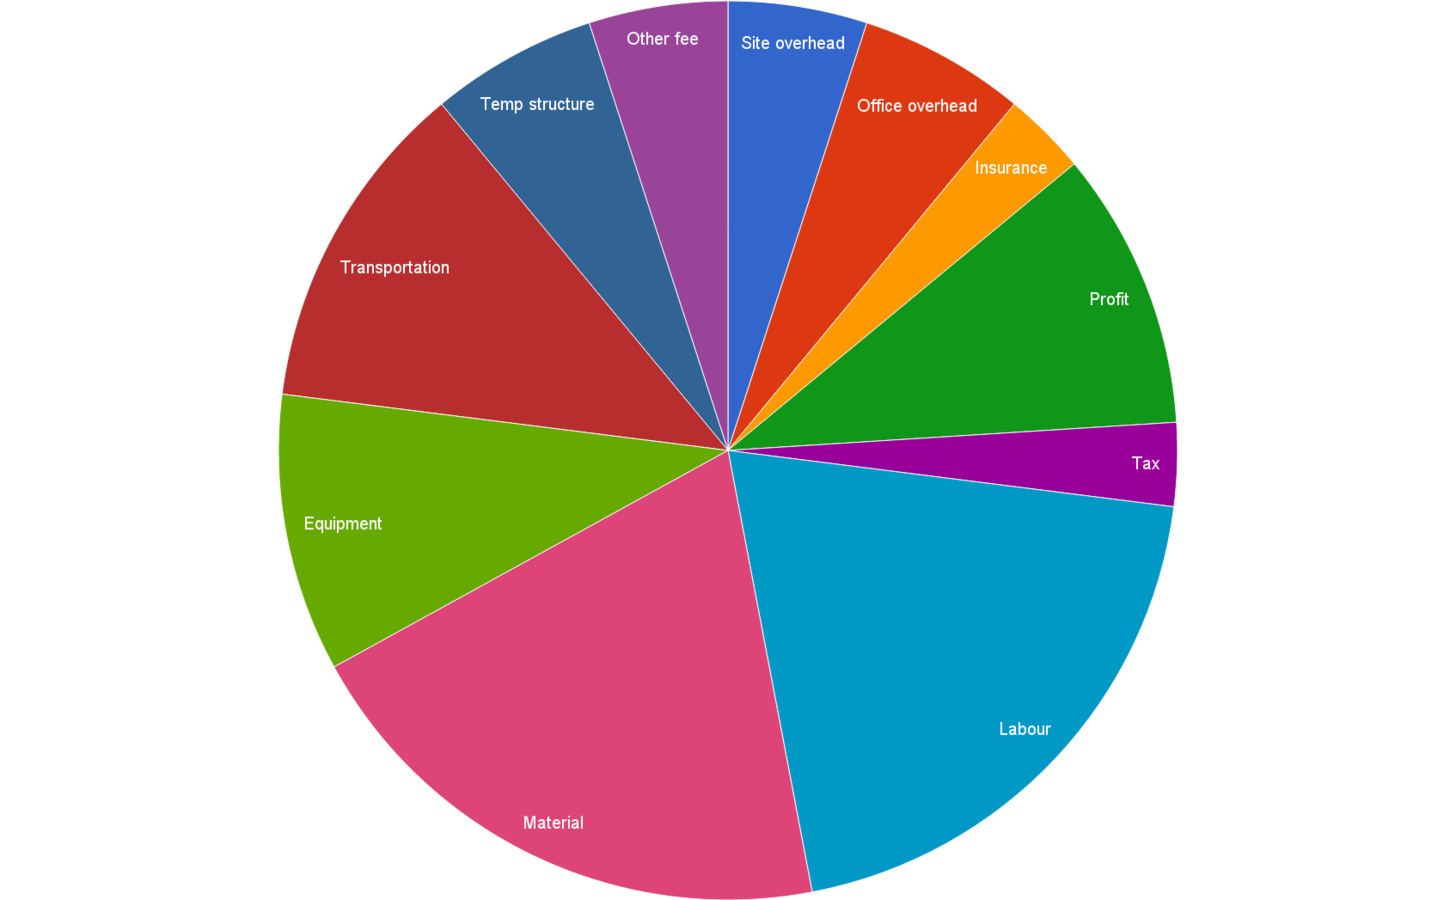
Direct Costs – Costs applicable to, and identified specifically with, the program contract Statement of Work.
Example of Indirect Costs: Overhead, General & Administrative (G&A), Cost of Money (COM),etc.
Indirect Costs – Charges that cannot be consistently or economically identified against a specific contract. These are typically calculated by applying rates and factors to the cost base.
Examples of Direct Costs: Labor, Equipment, Material, etc.
© Dr. Ling Ma
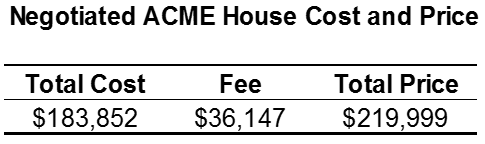
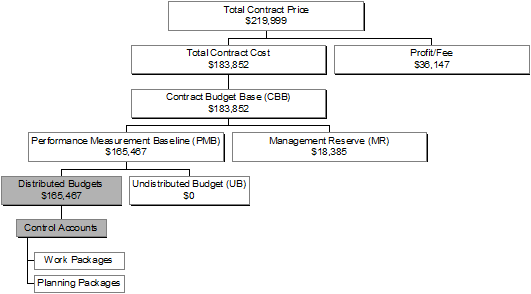
Total Proposed Price $231,894
© Dr. Ling Ma
The proposed price is $231,894; however, the buyer of the house can only afford to pay $220,000. The ACME house builder has agreed to build the ACME house for $219,999, but some revisions had to be made to the plans to utilize less expensive materials.
Total Negotiated Price
$219,999
© Dr. Ling Ma
The Negotiated Total Cost, without Profit/Fee, for the House equals $183,852. This will be the basis for developing the Contract Budget Baseline (CBB).
© Dr. Ling Ma
Program Manager establishes a Management Reserve (MR) prior to distributing budgets to the performing organizations. The purpose of MR is to have a budget for the Program Manager to allocate for unforeseen problems. MR is held at the program level. Transactions into and out of MR are approved by the Program Manager.
In the case of this House, MR amount equal to 10% of the Contract Budget Base.
Undistributed budget (UB) applies to contractually authorized efforts not yet allocated to WBS elements. The UB consists of a budget for authorized changes for which there has not been adequate time to plan the change at the control account level. Undistributed budget is an element of the Performance Measurement Baseline, but it is not time-phased.
© Dr. Ling Ma
Now that the Management Reserve has been established by the Program Manager, target budgets are developed and distributed to the Control Account Managers.
Establishing the target budgets will often be accomplished through a joint effort by the Program Manager, Team Leaders, and the Control Account Managers.
© Dr. Ling Ma
Distributed Budget
$165,467
Control Account Level
For monitoring the cost and schedule performance of a significant element of the work.
Detailed Budgeting Level
Once the budgets have been allocated to the Control Accounts, the Control Account budgets are further subdivided into work packages and planning packages.
© Dr. Ling Ma
The time-phased budget for the project
© Dr. Ling Ma
Concrete budget
for March
© Dr. Ling Ma
Amount of resource consumption units type “j” needed to produce one unit of product “i”
This beam needs 3 m3 concrete
Cost of resource consumption unit “j”
Concrete price
Direct cost of all resource consumption units needed to produce one unit of product “i”
Unit price of this type of beam
Total direct cost needed to produce the whole quantity of product “i”
Cost of all the beams of this type
Total direct cost of all project items
© Dr. Ling Ma
Direct cost of all the concrete needed to produce one unit of 20/40 columns.
Task ‘floor A structure’ being done at week 9.
Every day some amount of 20/40 columns is produced.
Total amount of 20/40 columns produced by ‘floor A structure’, ‘floor B structure’, etc. per day
© Dr. Ling Ma
Total budget of ready-mix concrete at week 9 composed of the cost of all concrete amount at that week being consumed at ‘foundations asks and ‘floor A structure’ for ‘foundations 60/80 and 20/40 columns
Total budget for week 9 composed from all resource consumption budgets: concrete, reinforcement, workers, pump for that week
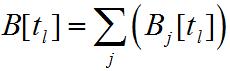
Project total cost = Total budget over the construction period
© Dr. Ling Ma
Indirect cost:
Site overhead & Company overheads: static budgeting, usually uniformly distributed. For example, “communication costs” same budget every month.
Allocate Direct Costs to Activities:
Depends on how the expense is generated:
Labor consumption, equipment – uniform over time.
Materials: expense at the beginning of the task, uniform or at the end.
Subcontracting - some in advance, some ongoing, some at the end.
© Dr. Ling Ma
Goal: to know the cost of the project from existing data
What data changes during the project?
The “living budget” principle
Updated budget = work done so far + remaining budget
Remaining budget update:
Baseline budget
© Dr. Ling Ma
© Dr. Ling Ma
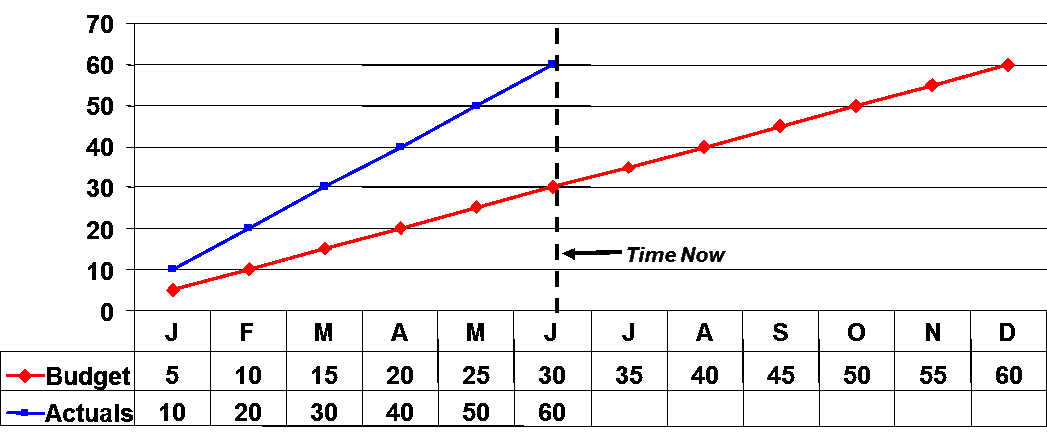
The flow of money from the owner to the contractor is in the form of progress payments.
Because of the delay in payment of billings by the owner and the Retainage withheld, the revenue profile lags behind the cost flow S-curve
Retainage or Retention
© Dr. Ling Ma
© Dr. Ling Ma
© Dr. Ling Ma
© Dr. Ling Ma
BSCPM
© Dr. Ling Ma
Why?
What?
Duration
Cost
Quality
Safety.
© Dr. Ling Ma
© Dr. Ling Ma
| Duration | Cost | |
|---|---|---|
| Basis (desired) | Schedule | Budget |
| Measure (reality) | PPC | Actual cost |
| Quality | Safety | |
|---|---|---|
| Basis (desired) | Plans and technical specifications |
Safety procedures |
| Measure (reality) | Physical condition and function |
Accidents |
© Dr. Ling Ma
Graphics by exigo
© Dr. Ling Ma
Graphics by exigo
© Dr. Ling Ma
Graphics by exigo
© Dr. Ling Ma
Graphics by exigo
© Dr. Ling Ma
Graphics by exigo
© Dr. Ling Ma
Graphics by exigo
© Dr. Ling Ma
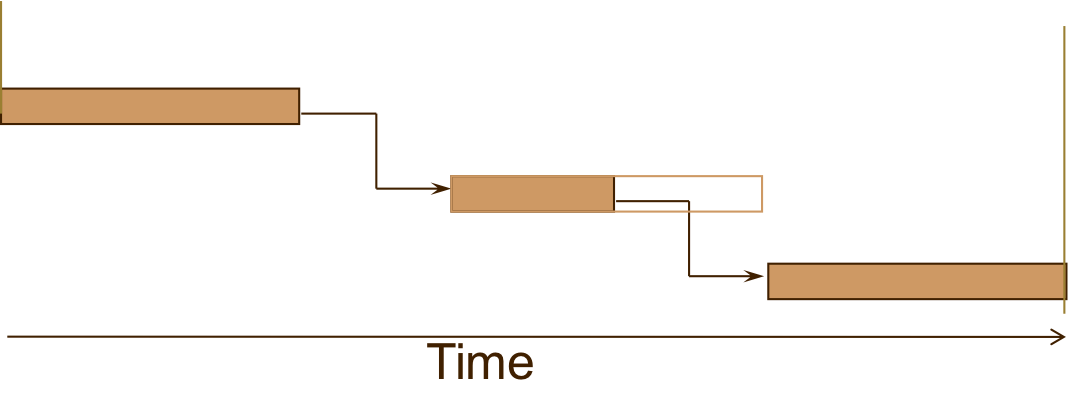
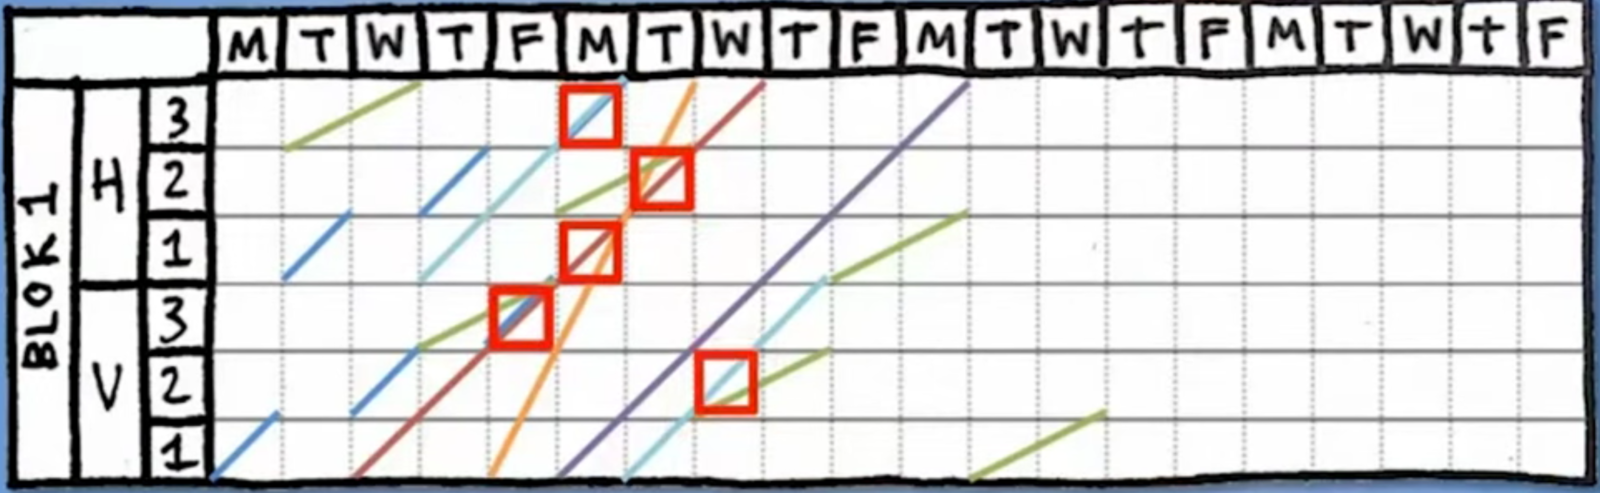
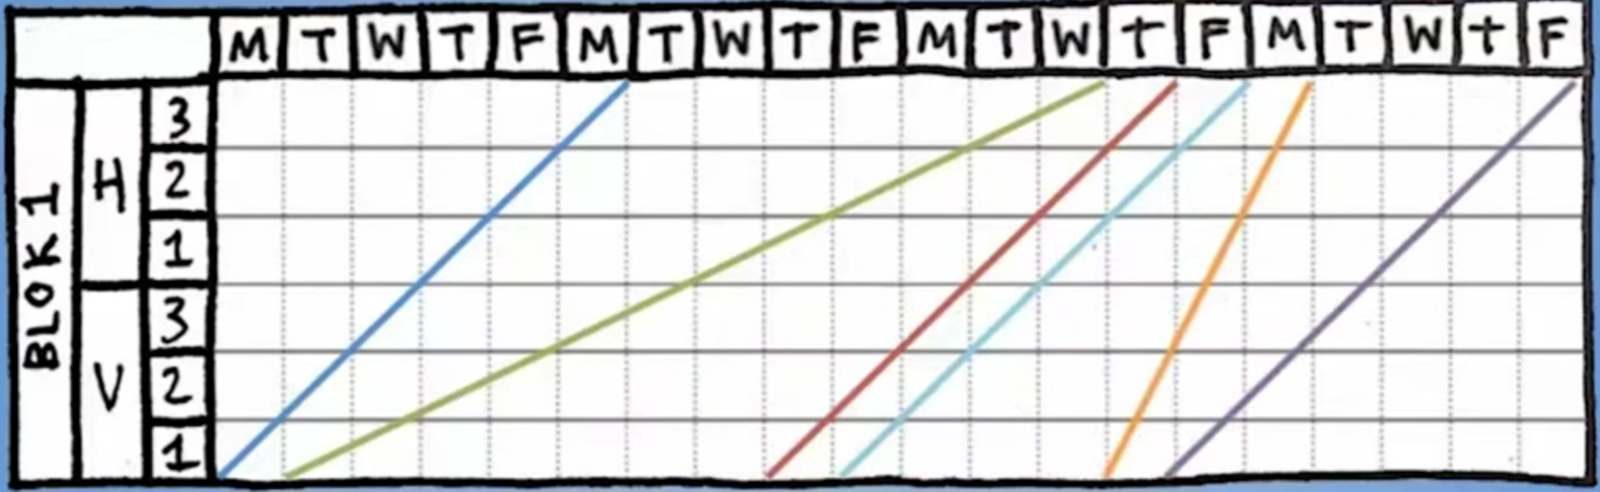
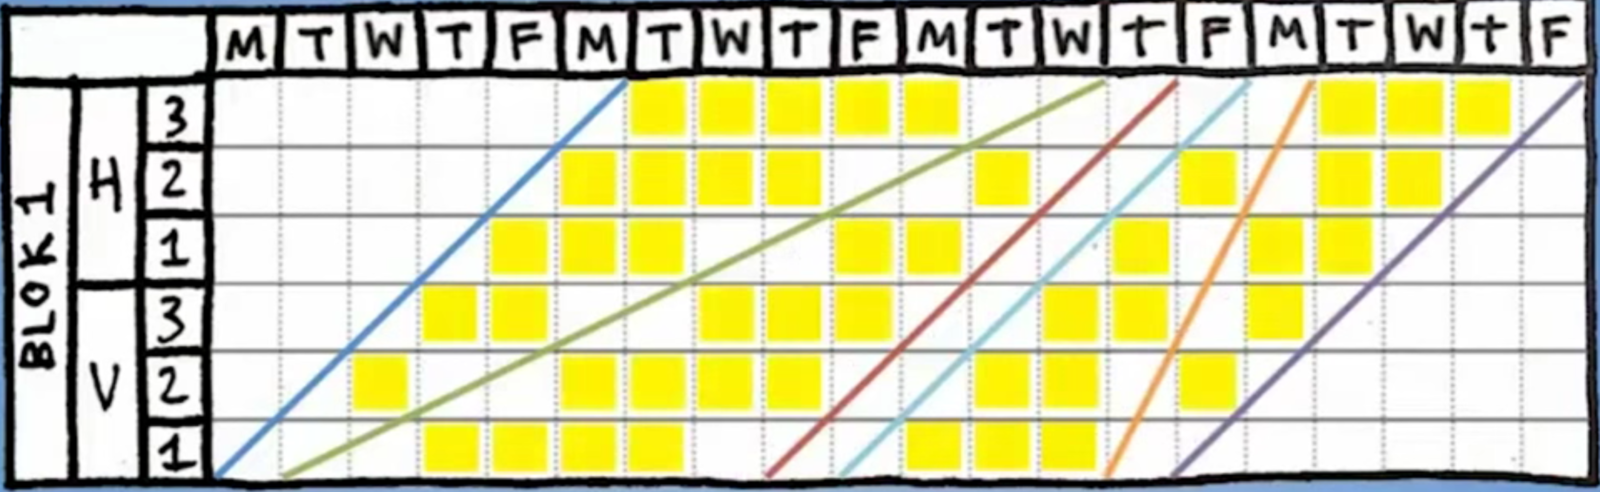
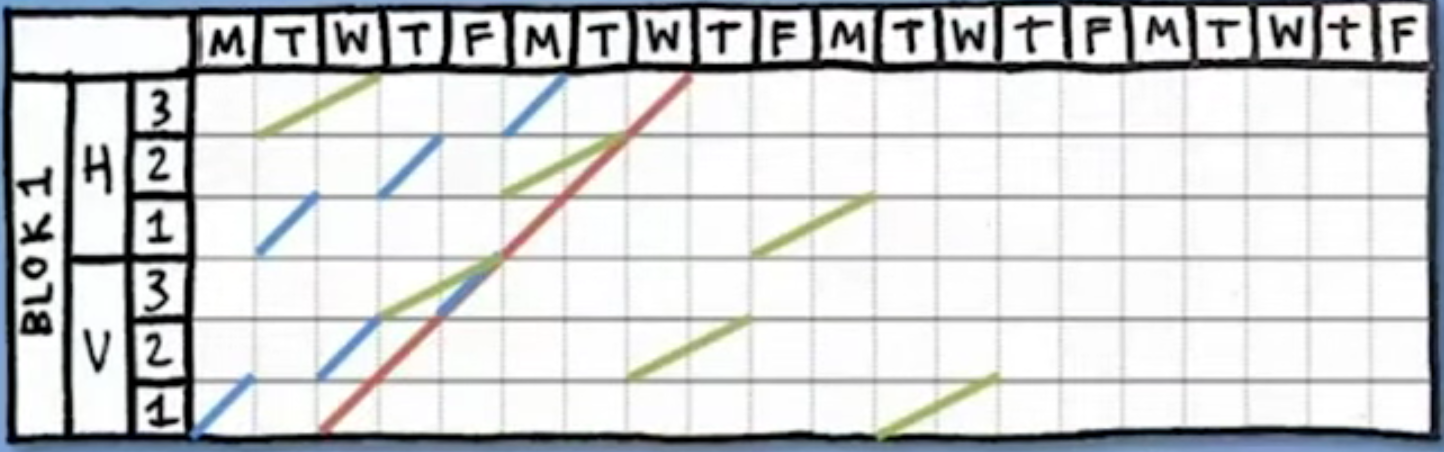
1 task in flow line = 8 tasks in Gantt chart
© Dr. Ling Ma
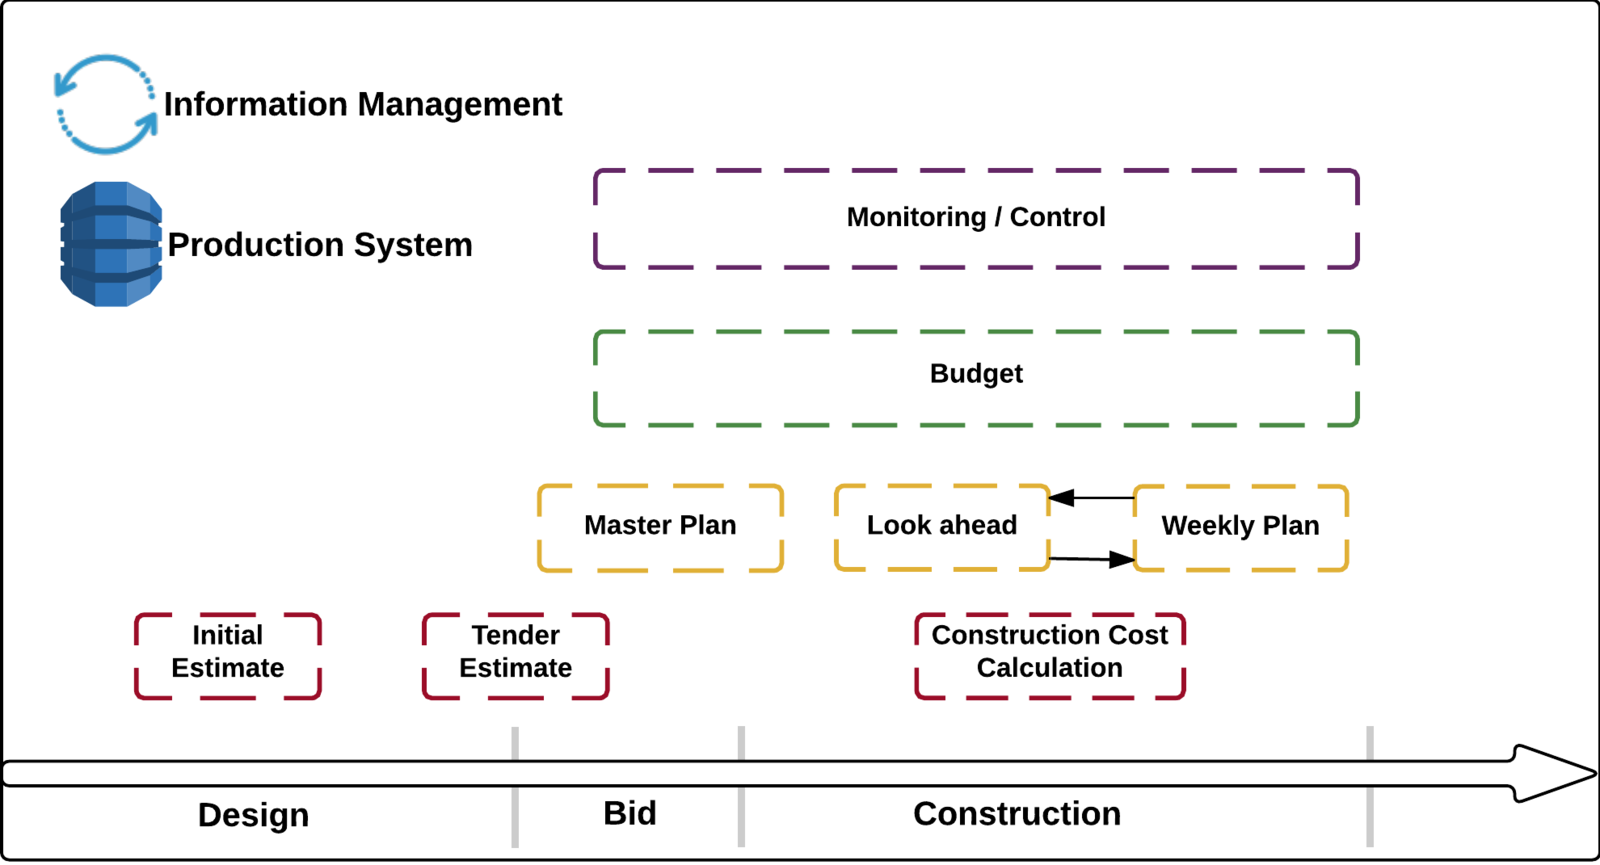
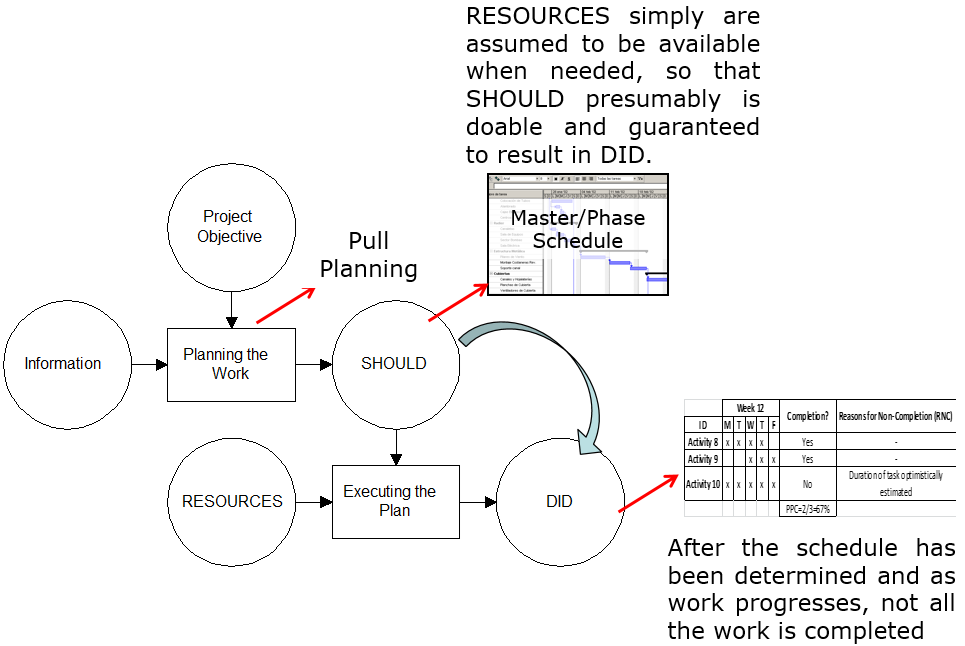
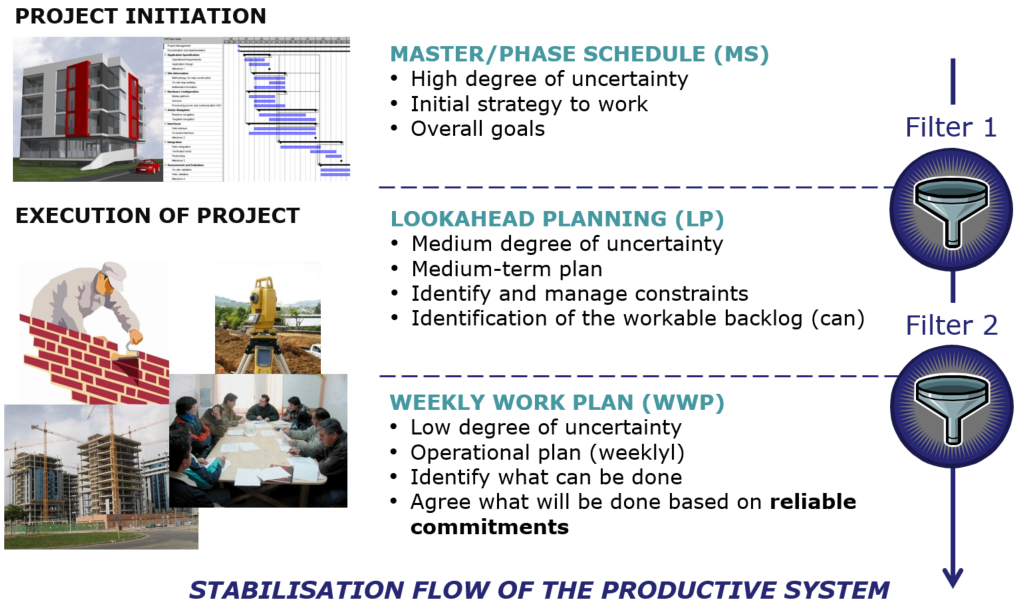
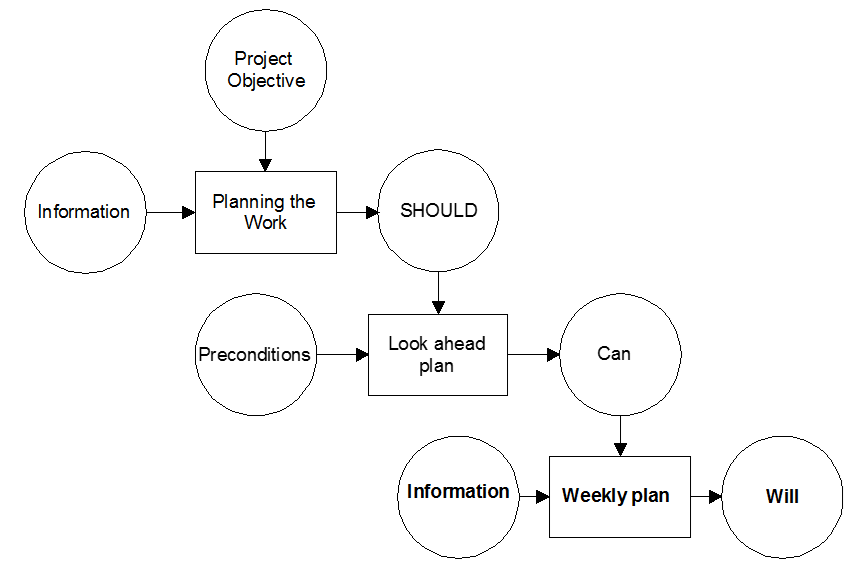
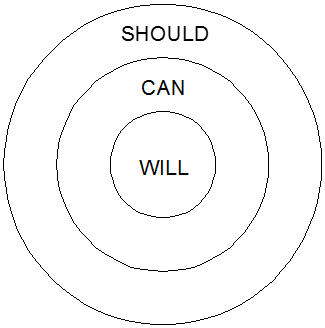
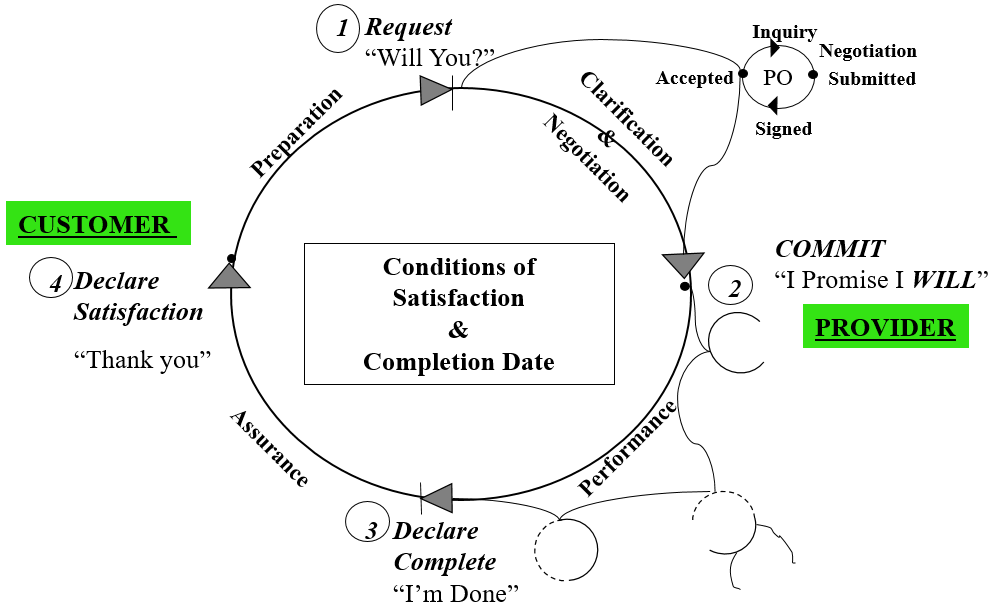
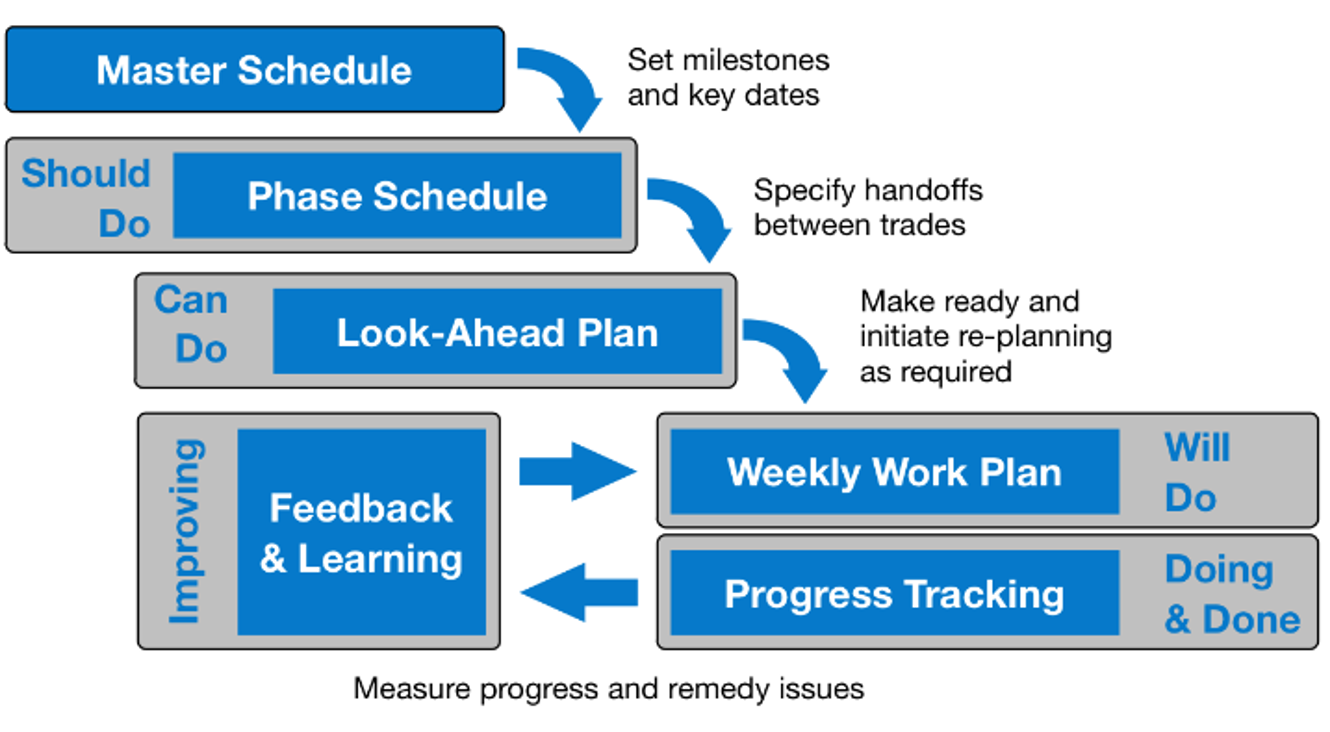
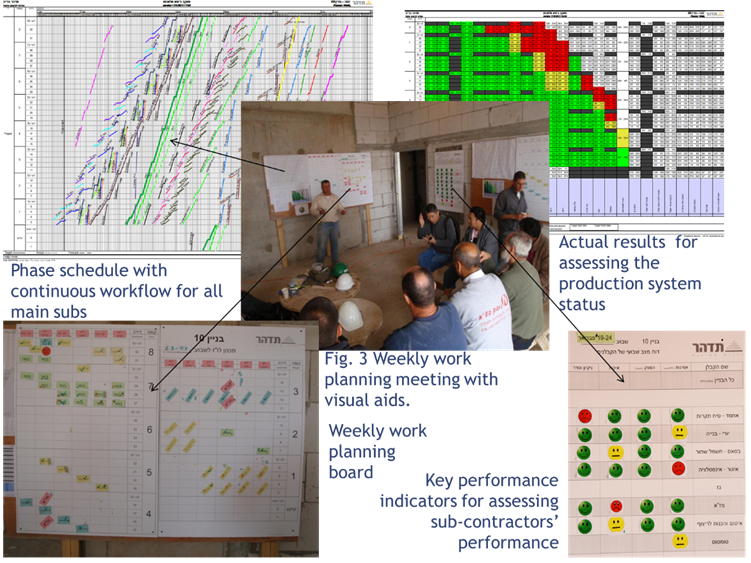
"Last Planner"™ is the name for the LCI's system of production control. Production control governs execution of plans and extends throughout a project. "Control" first of all means causing a desired future rather than identifying variances between plan and actual.
Production control consists of work flow control and production unit control. Work flow control is accomplished primarily through the lookahead process. Production unit control is accomplished primarily through weekly work planning.
© Dr. Ling Ma
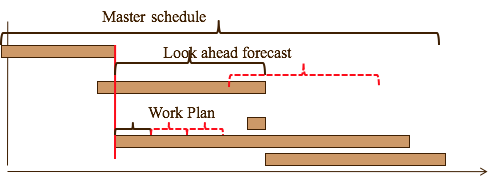
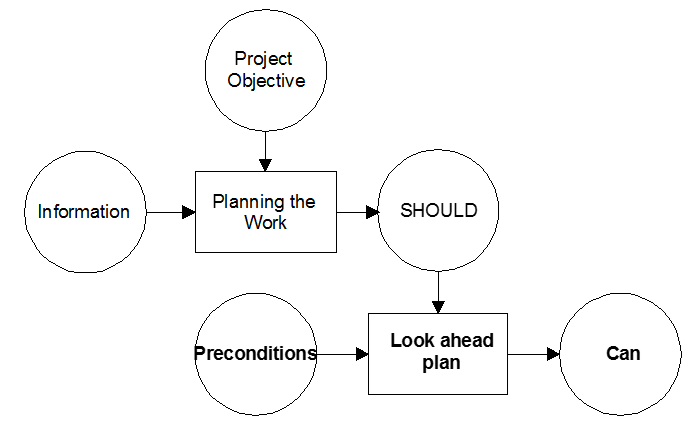
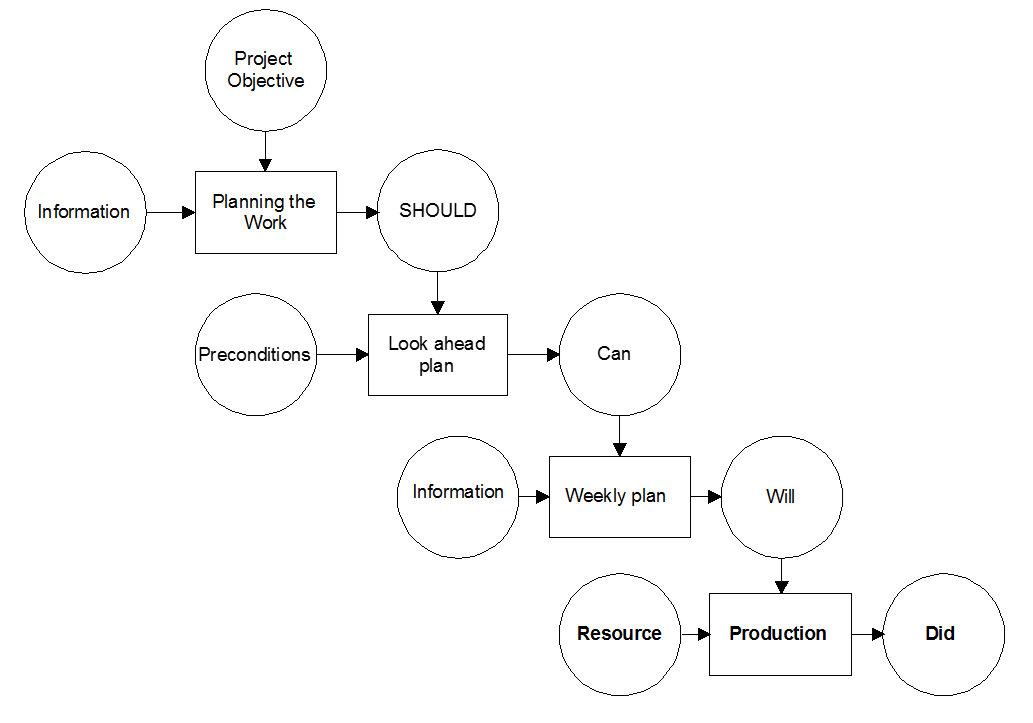
Master Schedules are prepared in front end planning, which belongs to the project definition and design phase. Master schedules serve specific purposes; e.g., demonstrating the feasibility of project completion by target end date. Those purposes do not require a high level of detail, which most often is inappropriate because of uncertainty regarding the future. Master schedules are expressed at the level of milestones, typically by phase.
Phase schedules are produced by cross functional teams using pull techniques near in time to the scheduled start of the phase. Phase schedules feed into lookahead windows, usually 3 to 12 weeks in duration. Lookahead processes make scheduled tasks ready for assignment. Such tasks are placed in Workable Backlog.
© Dr. Ling Ma
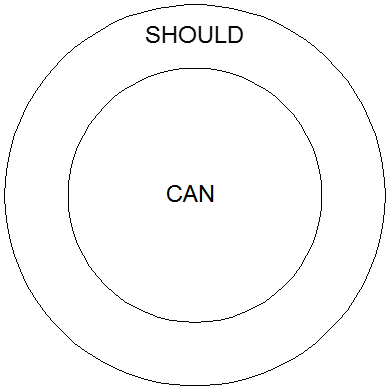
Tasks are allowed to maintain their scheduled starts only if the planner is confident they can be made ready in time. Scheduled tasks are made ready by screening for constraints, then by assigning make-ready actions to remove those constraints. The lookahead process generates early warning of problems so there is more time to resolve them.
Weekly work plans are formed by selection of tasks from Workable Backlog. Every effort is made to to make only quality assignments; i.e., those that are well defined, sound, in the proper sequence, and sized to capacity.
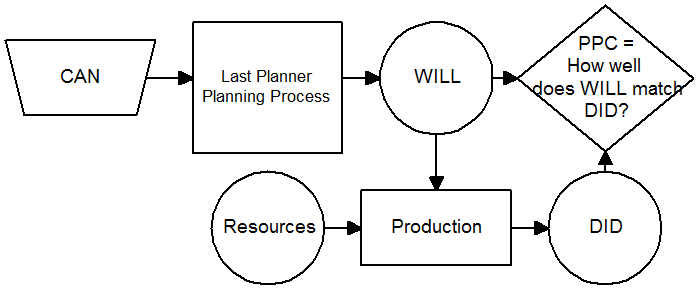
The percentage of planned assignments completed (PPC) is tracked and reasons for non-completions are identified and analyzed to root causes. Action is taken on root causes to prevent repetition.
© Dr. Ling Ma
© Dr. Ling Ma
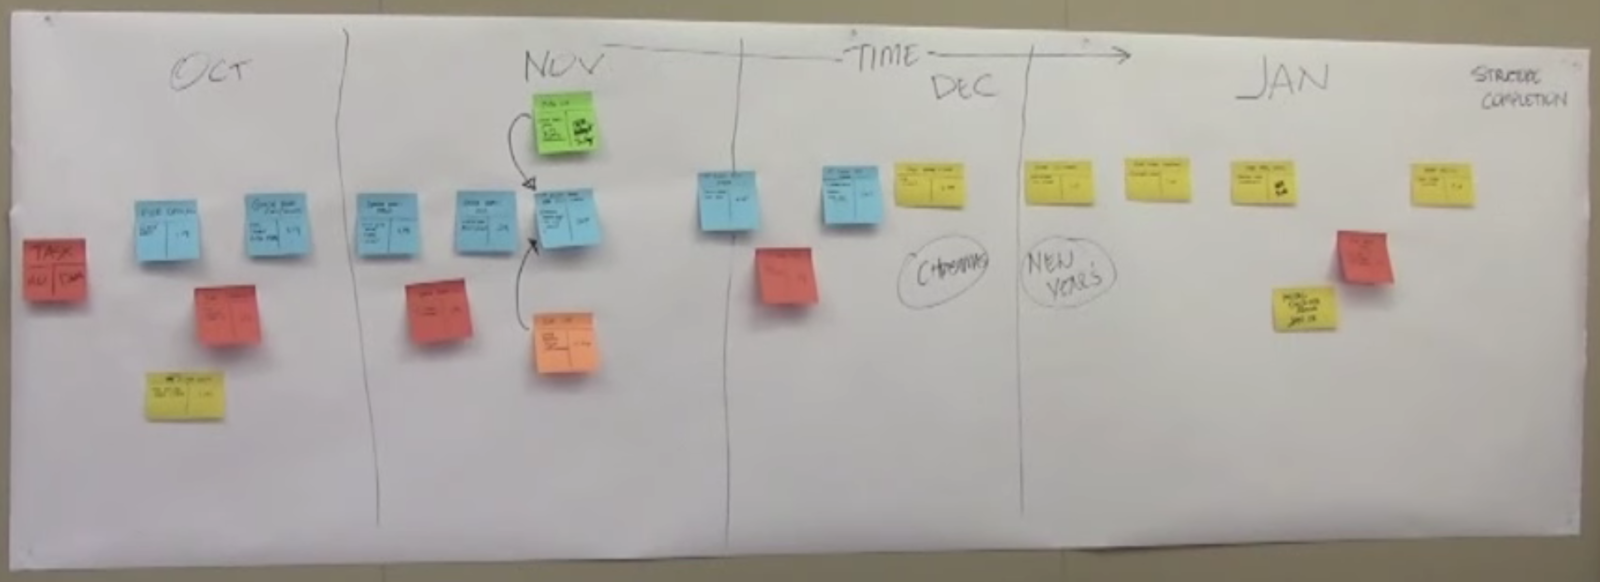
Schedule tasks at the last responsible moment to enable flow and early finish
Steady work rate for each subcontractor and allocation of resources to ensure it
Collaboration with the subcontractors in planning
Moving to Location Based Scheduling
© Dr. Ling Ma
Who are the right employees to be the ‘Last Planner’?
What, in your opinion, are the effects of using the PPC, including publicizing the PPC ?
Traditional management methods in design and construction divide the project and ignore the production process aspects.
What are the units of production in construction projects?
There is waste in construction (the ‘fat’): therefore, using appropriate (lean) management – with no addition of production capacity or materials – one can reduce costs and durations. True or false ?
© Dr. Ling Ma
| Apartment, 1-3 Story Construction Cost Assumptions | |
|---|---|
| Location: | US National Average |
| Stories: | 3 |
| Story Height (L.F.): | 10.00 |
| Floor Area (S.F.): | 22500 |
| Basement Included: | No |
| Data Release: | Year 2013 |
| Cost Per SF: | $$113.96 |
| Total Cost: | $2,564,000 |
© Dr. Ling Ma
| Chapter | Description | Unit | Quantity | Price [NIS] |
|---|---|---|---|---|
| 10.01.020 | Flooring with white marble tiles 30/60 cm, including the initial filling of the base with gravel of depth 10 cm | m2 | 2,880 |
| Resource Code | Resource Description | Unit | Cost [NIS] | Notes |
|---|---|---|---|---|
| 10 | Gravel | m3 | 100 | Waste factor of 8% |
| 20 | White marble tiles of size 30/60 cm | m2 | 200 | Waste factor of 3% |
| 30 | Flooring crew | day | 2,000 | 300m2/day |
| 40 | Gravel pump | m3 | 30 |
© Dr. Ling Ma
© Dr. Ling Ma
© Dr. Ling Ma
This beam needs 3 m3 concrete
Concrete price
Static budget
Every day some amount of 20/40 columns is produced in Task ‘floor A structure’
Time phased budget
Budget of ready-mix concrete at week 9:
Direct cost of all the concrete needed to produce one unit of 20/40 columns.
© Dr. Ling Ma
In Traditional management, there are two data sources:
But how much work has been produced?
This approach does not indicate:
© Dr. Ling Ma
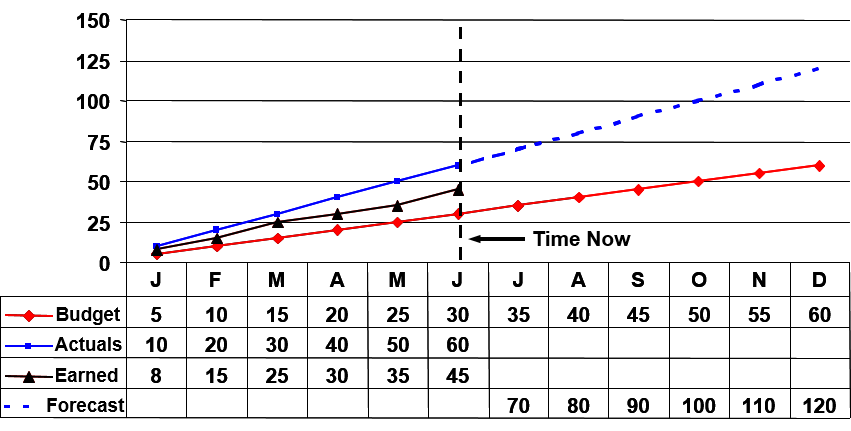
Earned Value takes three data sources and is able to compare the budgeted value of work scheduled and compare it to the “earned value of physical work completed” and the actual value of work completed.
If the PV is $1,000 and the project is actually 20% complete:
EV = PV x % = 1,000 x 20/100 = $200
© Dr. Ling Ma
By comparing the budget line (in red) to the earned value line (in black), the project is producing more than it was budgeted to produce to date.
By comparing the actual expenditures (in blue) to the earned value line (in black), the project is spending more then it was budget to date.
© Dr. Ling Ma
Schedule Variance - the project is experiencing a schedule variance of 15. This is derived from comparing the Earned (45) to the Budget (30). SV=EV-PV
Cost Variance - the project is experiencing a cost variance of -15. This is derived from comparing the Earned (45) to the Actual expenditures (60). CV=EV-AC
© Dr. Ling Ma
Schedule Variance - the project is ahead/behind of schedule in comparison to what was supposed to be done in the frame time measured.
Cost Variance - the project is saving/overrunning budget. Notice: overruns in cost do not correct themselves and need management intervention
Along with the schedule and cost results discussed, earned value management enables you to forecast the final results of the project (blue dashed line).
© Dr. Ling Ma
Cost Performance Index (CPI) = EV/AC
CPI measures the value of work completed against the actual cost. A CPI value < 1.0 indicates that costs were higher than budgeted. CPI > 1.0 indicates that costs were less than budgeted.
Schedule Performance Index (SPI) = EV/PV
SPI measures progress achieved against progress planned. An SPI value < 1.0 indicates less work was completed than was planned. SPI > 1.0 indicates that more work was completed than was planned.
For both SPI and CPI, >1 is good and <1 is bad.
Estimated at Completion (EAC) = (Total Project Budget) / CPI
EAC is a forecast of how much the total project will cost.
© Dr. Ling Ma
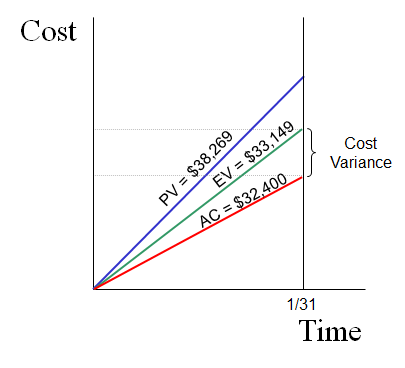
| PV | EV | AC | |
|---|---|---|---|
| Foundation | $15,394 | $15,394 | $15,850 |
| Patio | $8,166 | $8,166 | $7,200 |
| Exterior Walls | $8,748 | $6,608 | $6,250 |
| Stairway | $5,961 | $2,981 | $3,100 |
| Project Total | $38,269 | $33,149 | $32,400 |
What does this tell you?
© Dr. Ling Ma
Earned Value Management (EVM) is a systematic approach to the integration and measurement of cost, schedule, and technical (scope) accomplishments on a project or task
Traditional management provides you with…
How much money and time a particular job is likely to require prior to starting and once stated, how much money was spent at any given time.
Earned Value Management additionally provides you with…
Once started, what work has been accomplished to date for the funds expended (what you got for what you spent)
Once started, what the total job will cost at completion, and how long it will take to complete
© Dr. Ling Ma
Is there a need to assign additional resources/work hours?
Is there a need to change construction methods or the resource assignments?
© Dr. Ling Ma
Final Exam:
10/7/2016
9:00AM-12:00AM
Robin:404+405
By Ling Ma (Lorin)


