
Working together
for a safer world
Maximising value from legacy raster bathymetry datasets

Gareth Grewcock
@ gordy99
Rasters Revealed 2017
21.02.2017
Bathymetry = 'submarine topography'
Acquistion = £££'s
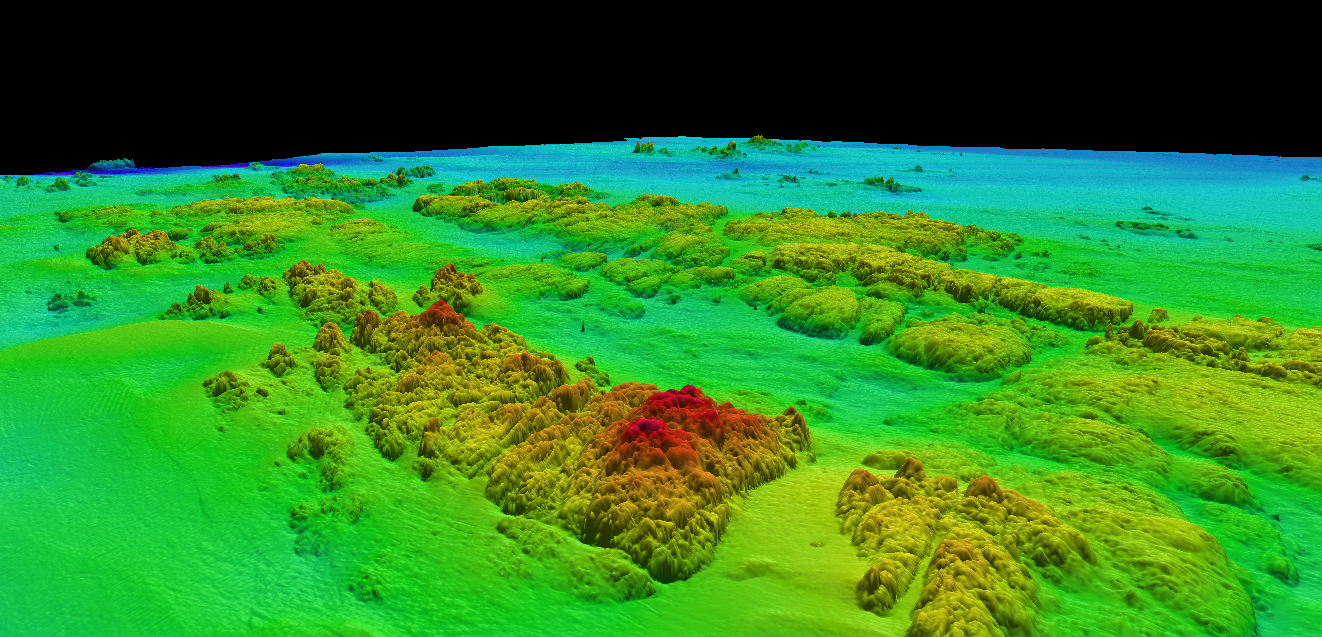
marine DTM
New Bathymetry Survey @ ~£20,000 per day?
Raster Bathymetry DTM = not fit for engineering purposes
- excessively smoothed and delivered as a 5x5m Grid.
- fairly coarse for shallow bathymetry survey
Key seabed features lost

Let's review the raw survey data, does it support a higher resolution DTM?
Why has it been delivered at 5x5m?
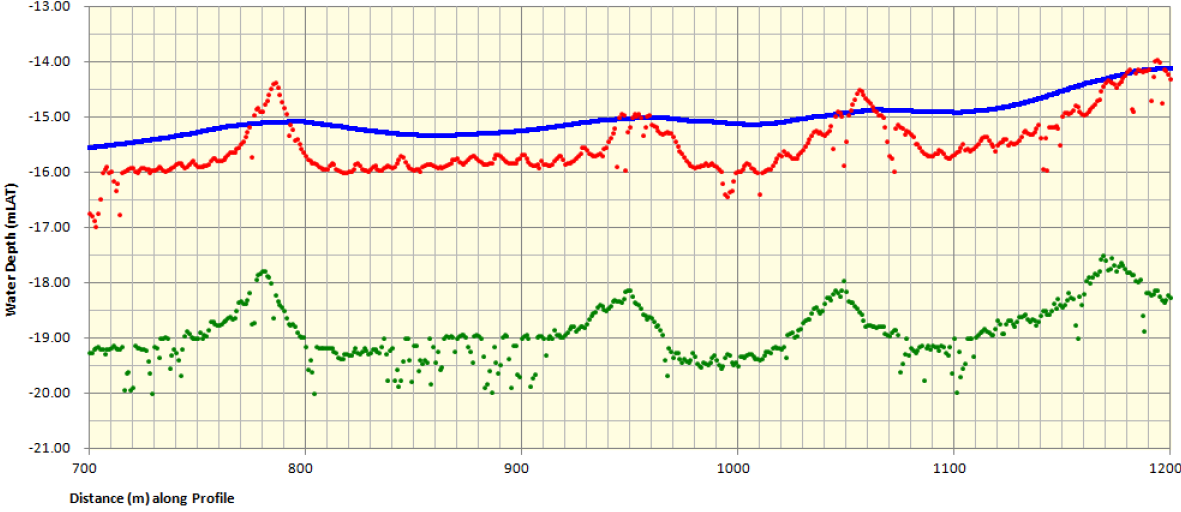
Discrepancy of absolute depths = tidal issue
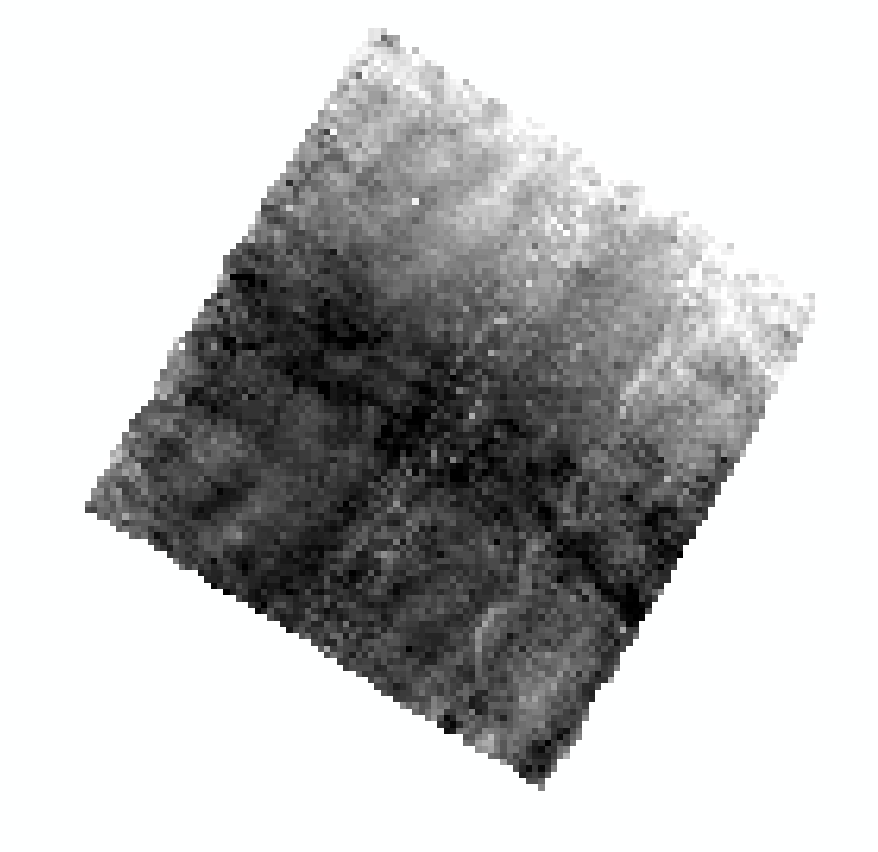
oversmoothed bathymetry surface 5x5m
VORF control
surface 1x1m
Raw data reprocessed
1x1m
The raw data does support 1x1m
If we can fix the tidal issue =
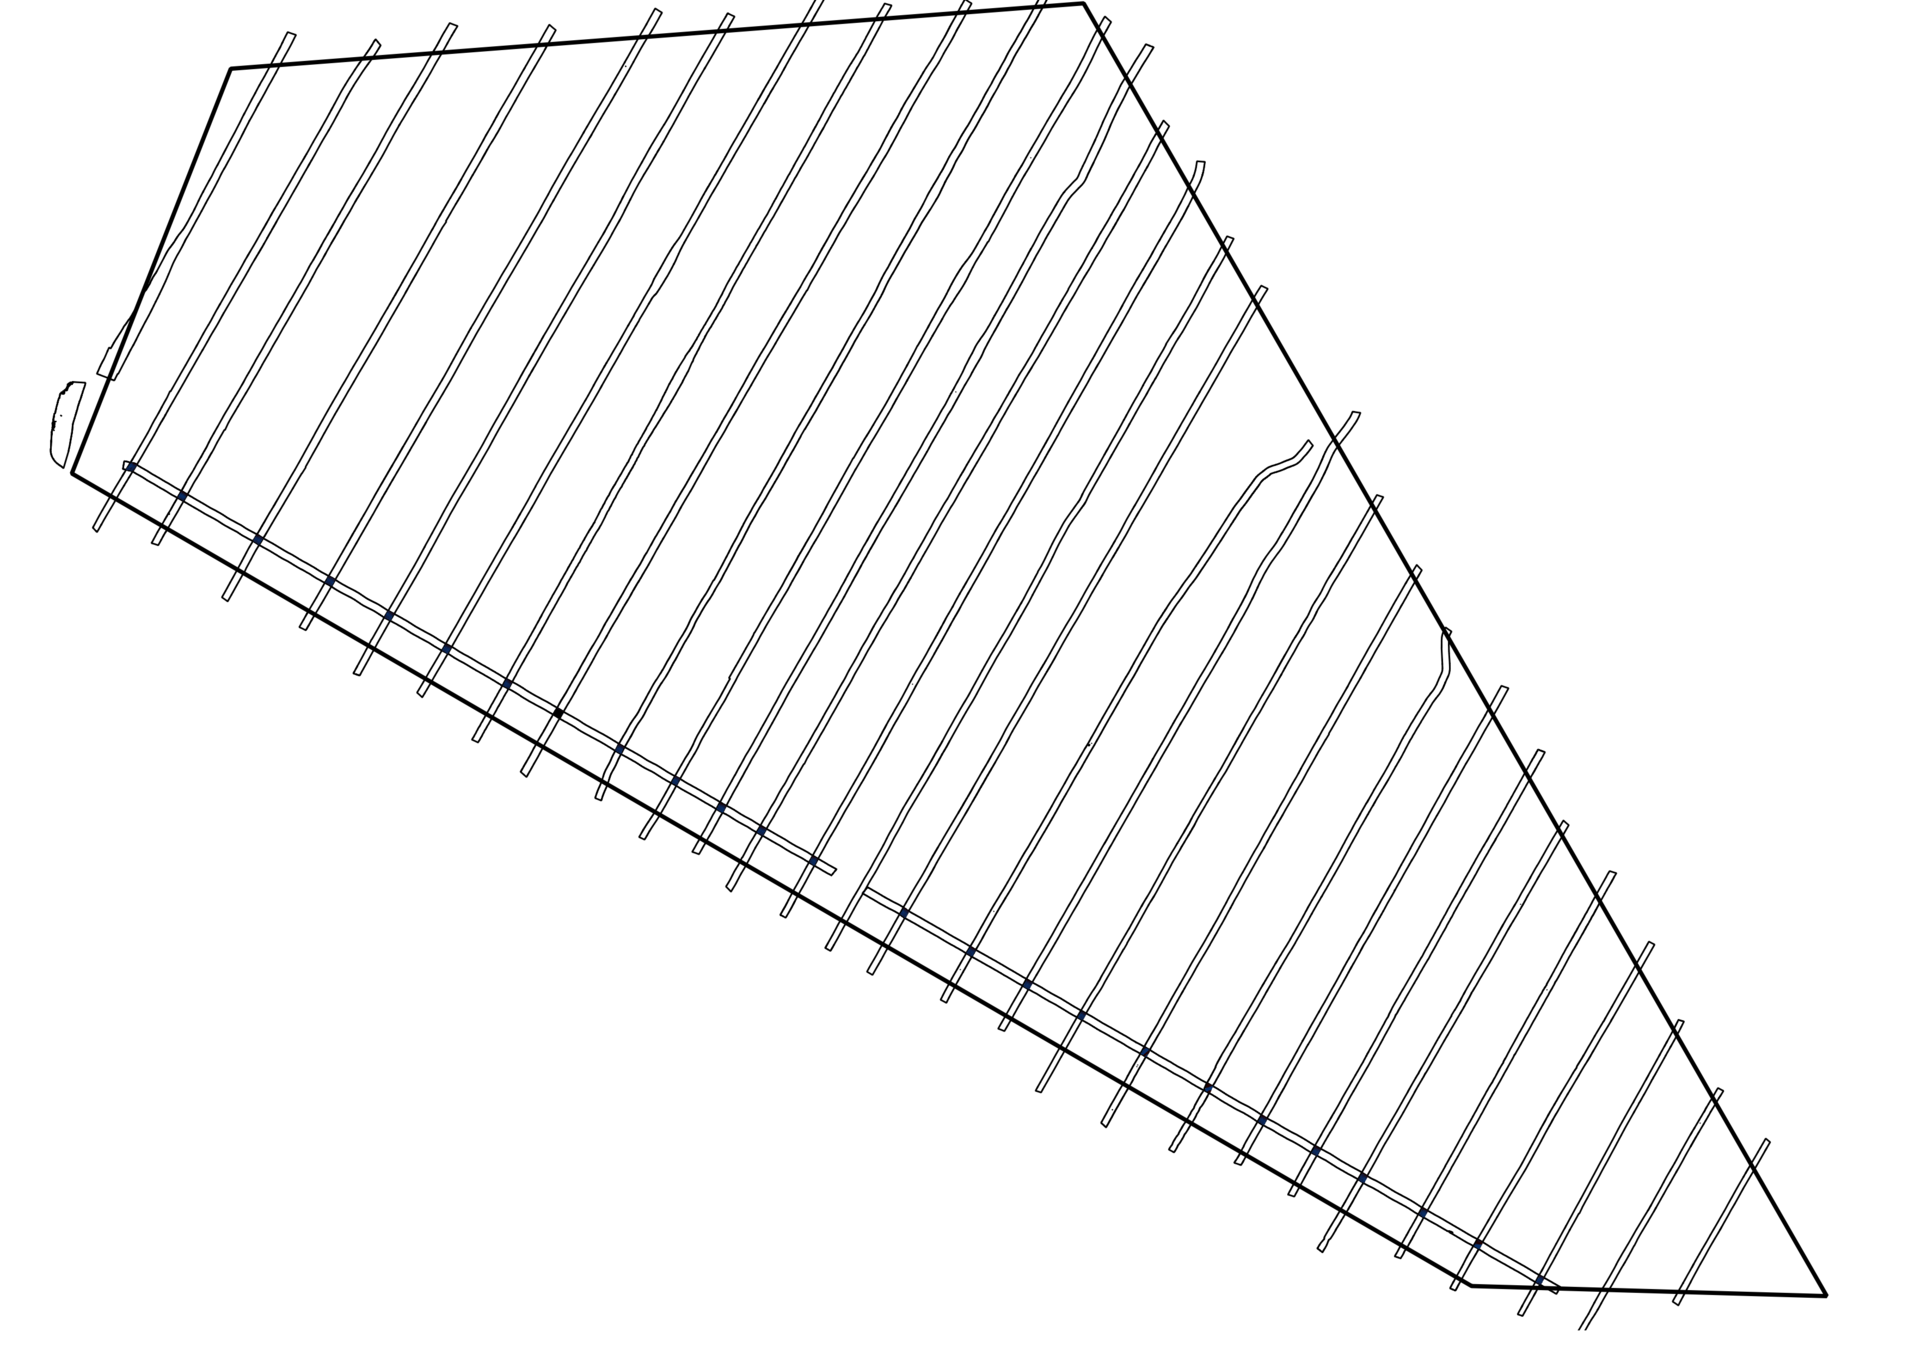
130 NW - SE reprocessed lines
30 NE - SW run lines
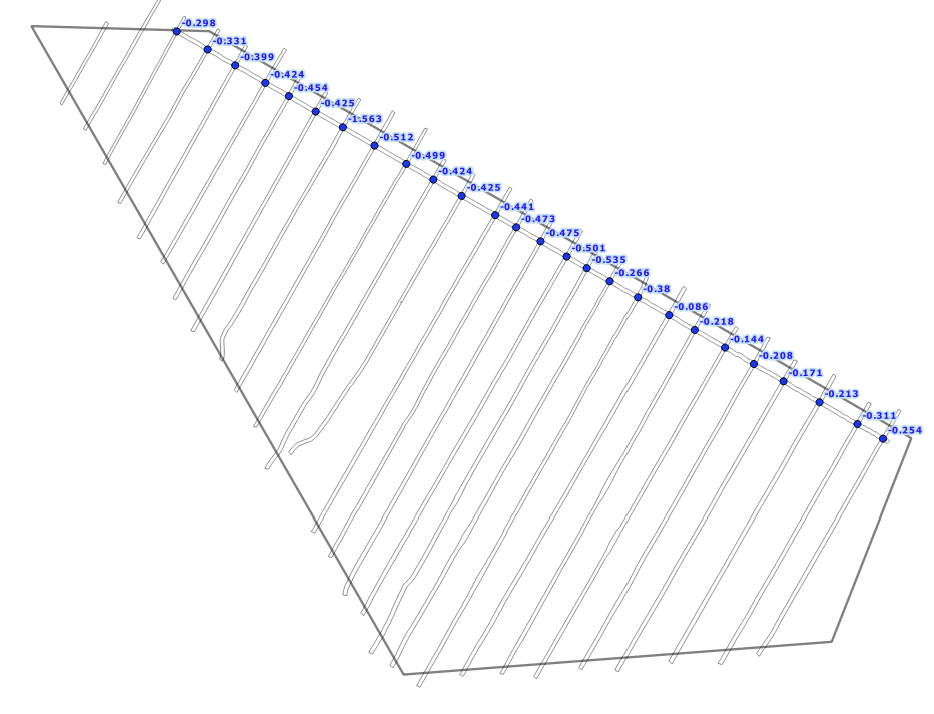
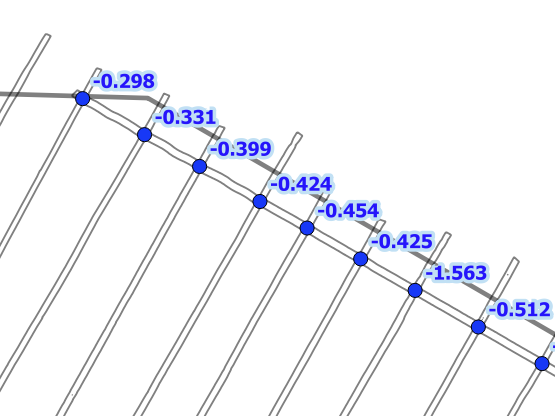
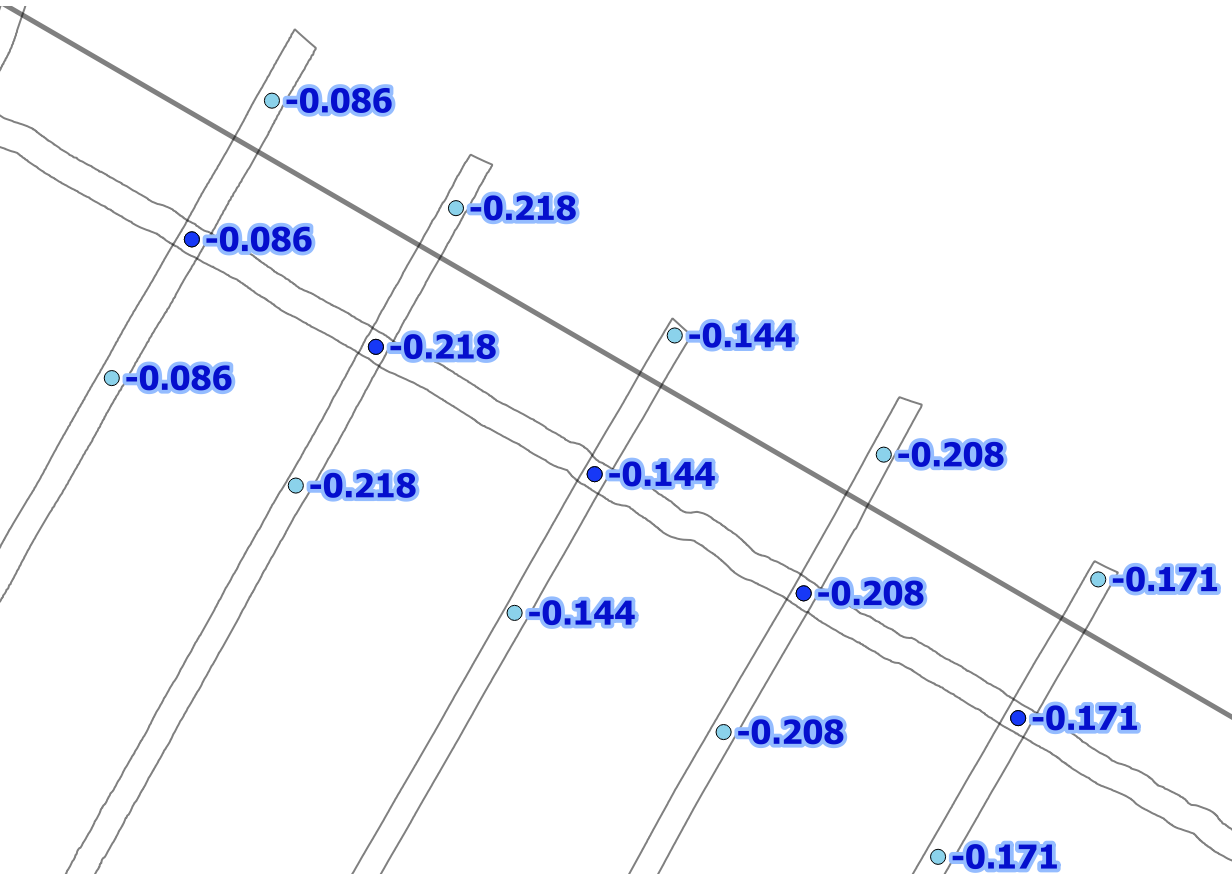
30 VORF control lines X 130 reprocessed lines = 3600 tidal correction points
5x5m Oversmoothed DTM
VORF control DTM 1x1m
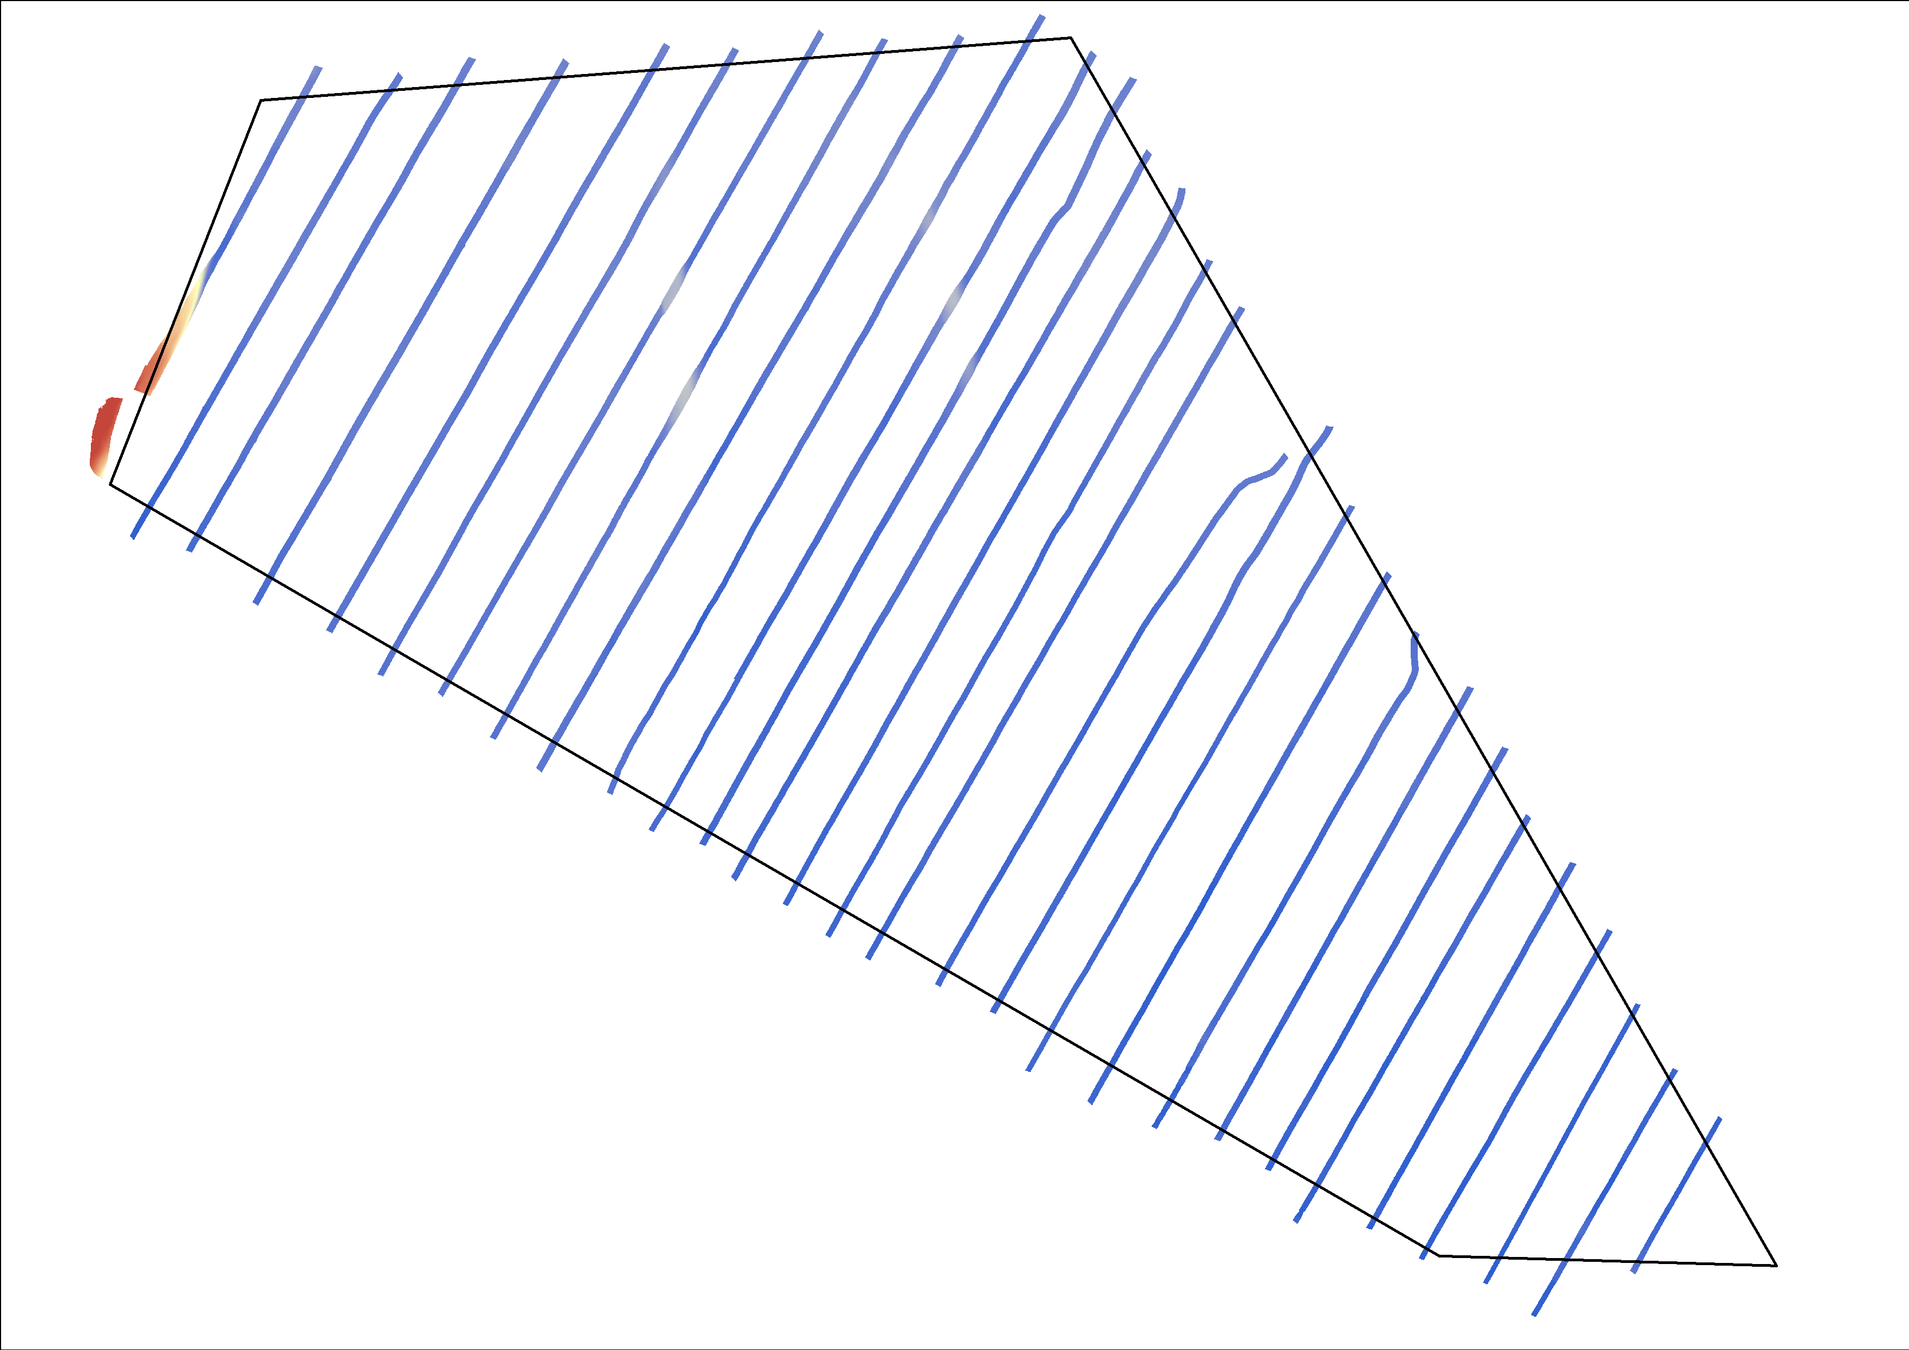
30 Tidal Control Points per reprocessed survey line
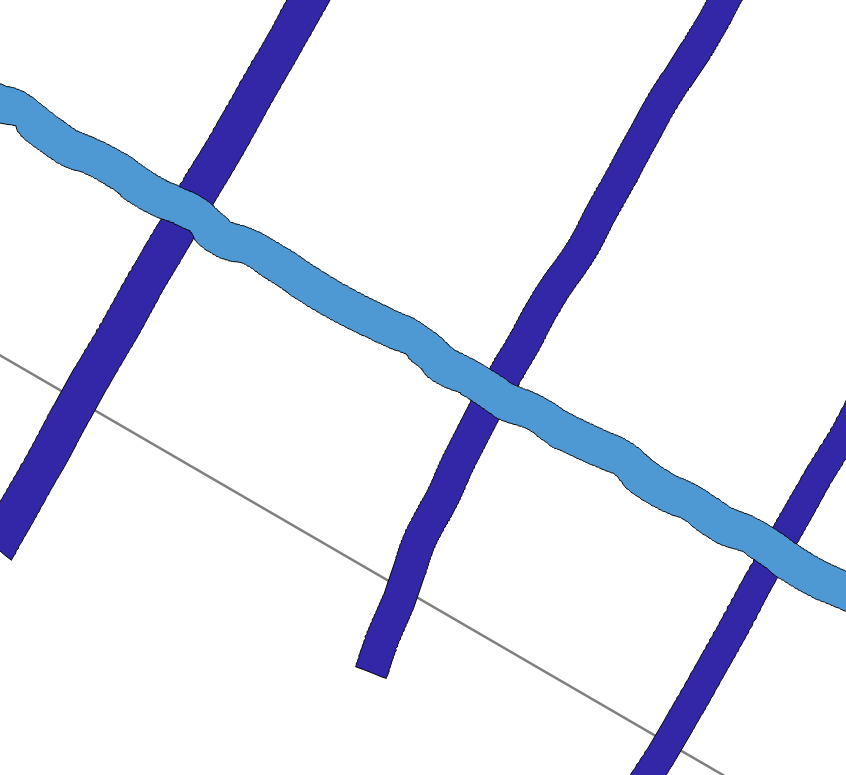
intersections
calculate the mean difference at each intersection
We can create a raster correction surface using the tidal correction points (mean differences) to level each 1x1m reprocessed survey line to a common level

Effectively, we're dealing with XYZ data
Finally - lets talk raster processing...

manual reptitive task = automated solution
{Code Snippets}How did we create the tidal correction raster surface?


automated workflow
task #1
syntax
grdmath rstr-a.tif rstr-b.tif SUB = output.tif=gd:GTiff
Difference each (130) reprocessed 1x1m survey line from the VORF control surface
VORF Control Lines (1 DTM)
Reprocessed 1x1m survey line
task #2
output from task #1
gdalwarp -cutline output.shp -csql "SELECT * FROM output WHERE ID = '29'" -crop_to_cutline out-clip.tif
syntax
Create vector extent for each NE-SW VORF control survey line
grdmath rstr-a.tif=gd:GTiff -10000 GT = output.tif=gd:GTiff

gdal_polygonize output.tif -f "ESRI Shapefile" output.shp
Clip the difference output by each (30) NE-SW VORF control survey line
automated workflow
task #3
output from task #2
100 m
100 m
from osgeo import gdal

clip_out = r"F:\Temp\clip-out.tif"

src_ds = gdal.Open(clip_out)

if src_ds is None:
                <font></font>
    print 'Unable to open INPUT.tif'
                <font></font>
    sys.exit(1)

srcband = src_ds.GetRasterBand(1)
stats = srcband.GetStatistics( True, True )
x, y
GDAL Windows Python Bindings | http://www.gisinternals.com/release.php
Calculate the tidal correction offset value
DTM centre coordinates
- min Z value
- max Z value
- mean Z value
- standard deviation
automated workflow
Mean value
(tidal correction offset)
Pipe out to next stage..
automated workflow
Calculate the tidal correction offset value
30 Tidal Correction Offsets for 1x1m reprocessed survey line
task #4
arcpy.NaturalNeighbor_3d(mean_tidal_3d_shp_out,"POINT_Z",tidal_correction_surface_out, 1)natural neighbour interpolation
syntax
calculate offset points (copy parallel)
Create the raster tidal correction offset surface
ArcPy

#confession
automated workflow
task #5
grdmath rstr-a.tif rstr-b.tif ADD = output.tif=gd:GTiff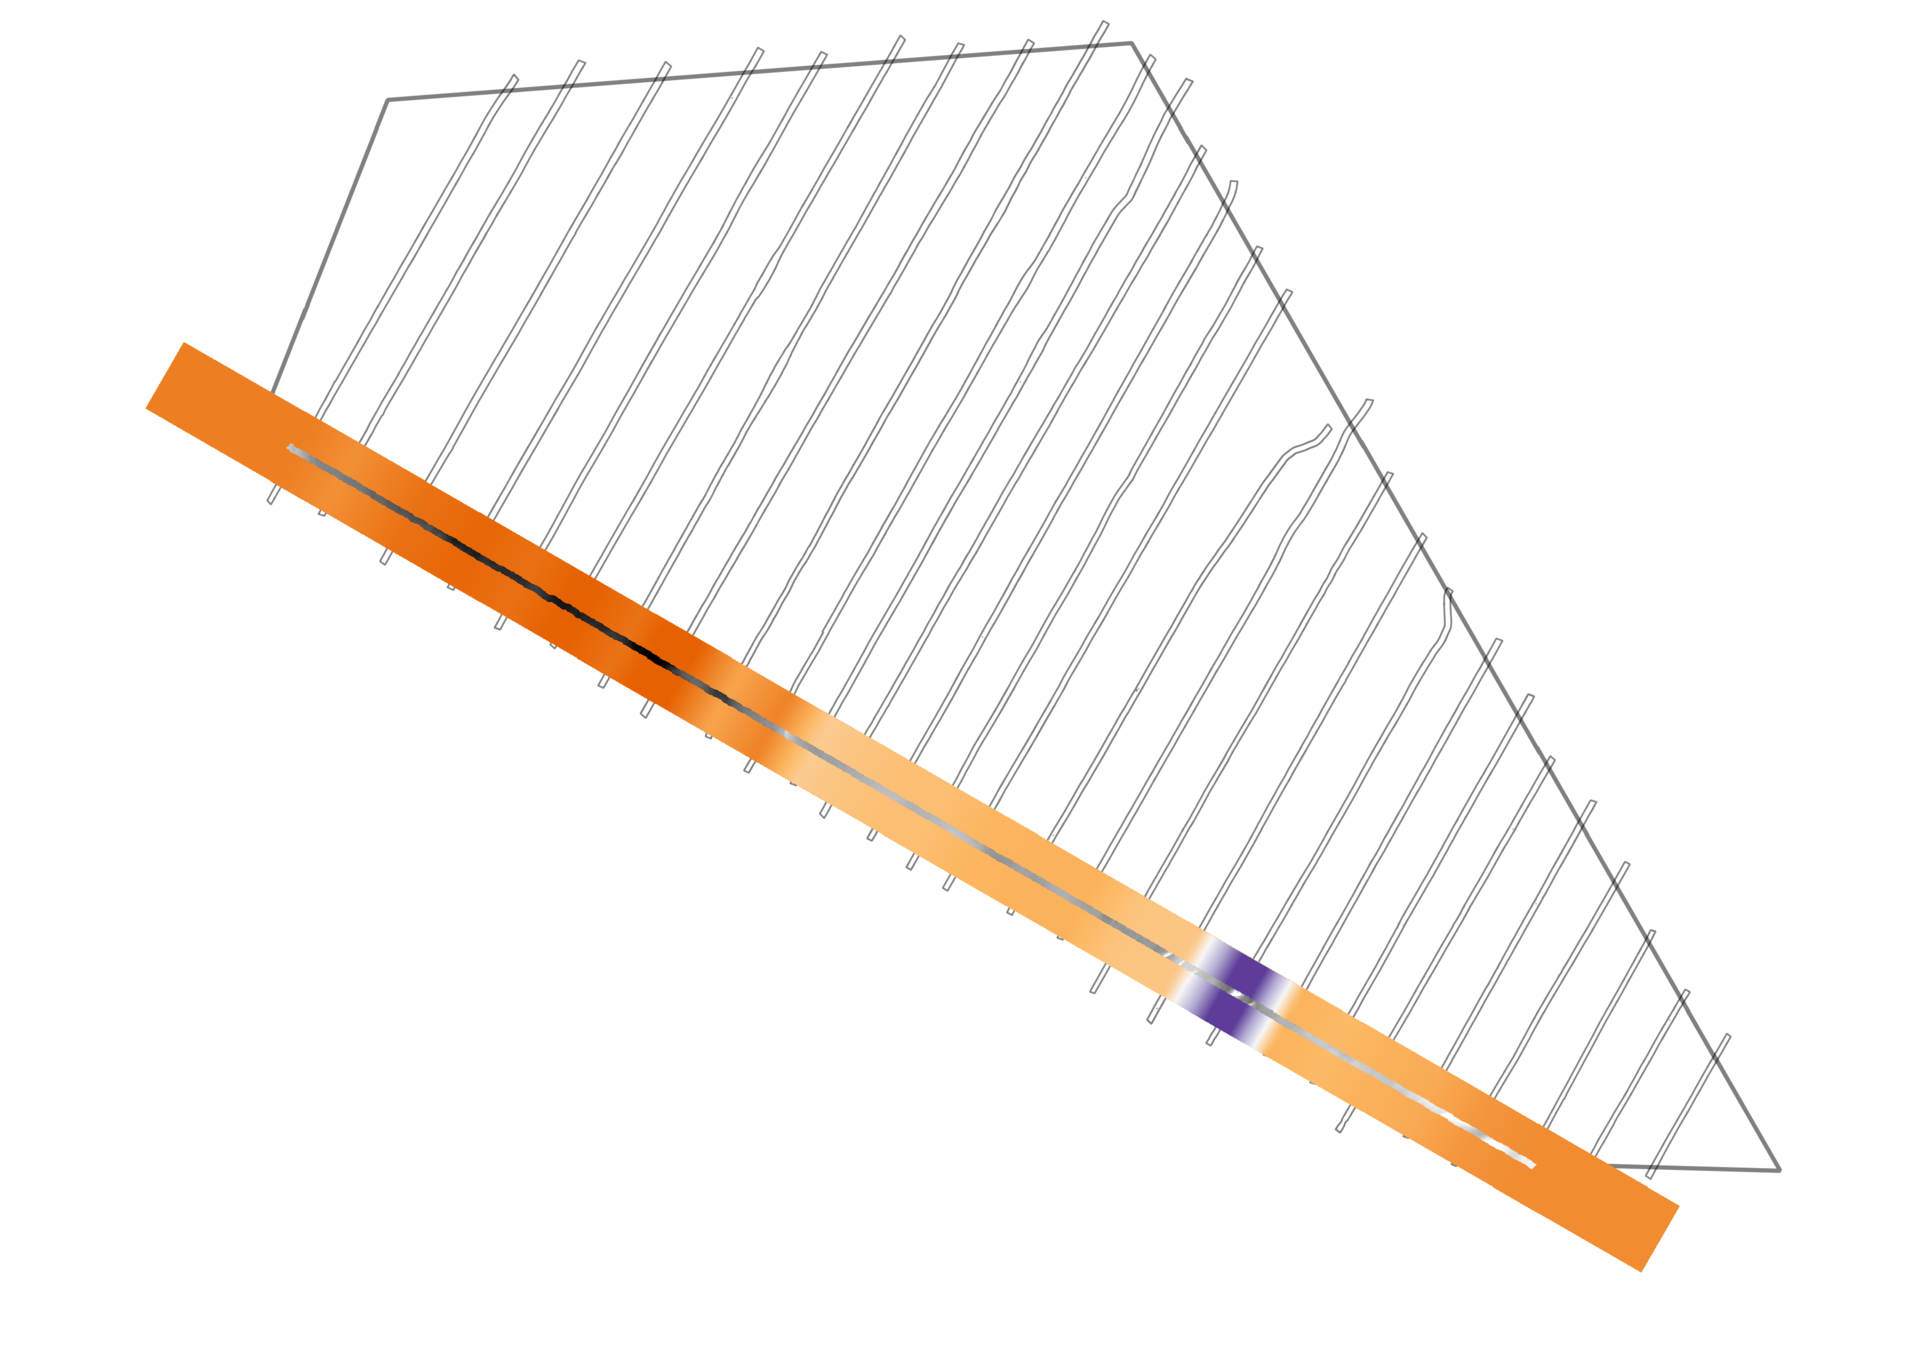
Level raw legacy survey line with the tidal correction raster surface
automated workflow
Reprocessed 1x1m survey line
Tidal correction raster surface
=
A tidally corrected, 1x1m levelled survey line
task #6
gdalbuildvrt levelled-rasters.vrt *.tif

gdal_translate -co COMPRESS=LZW -a_srs EPSG:32631 levelled-rasters.vrt output-mosaic_1x1m.tif
Create final 1x1m levelled raster DTM surface
directory of 130 levelled survey lines
automated workflow
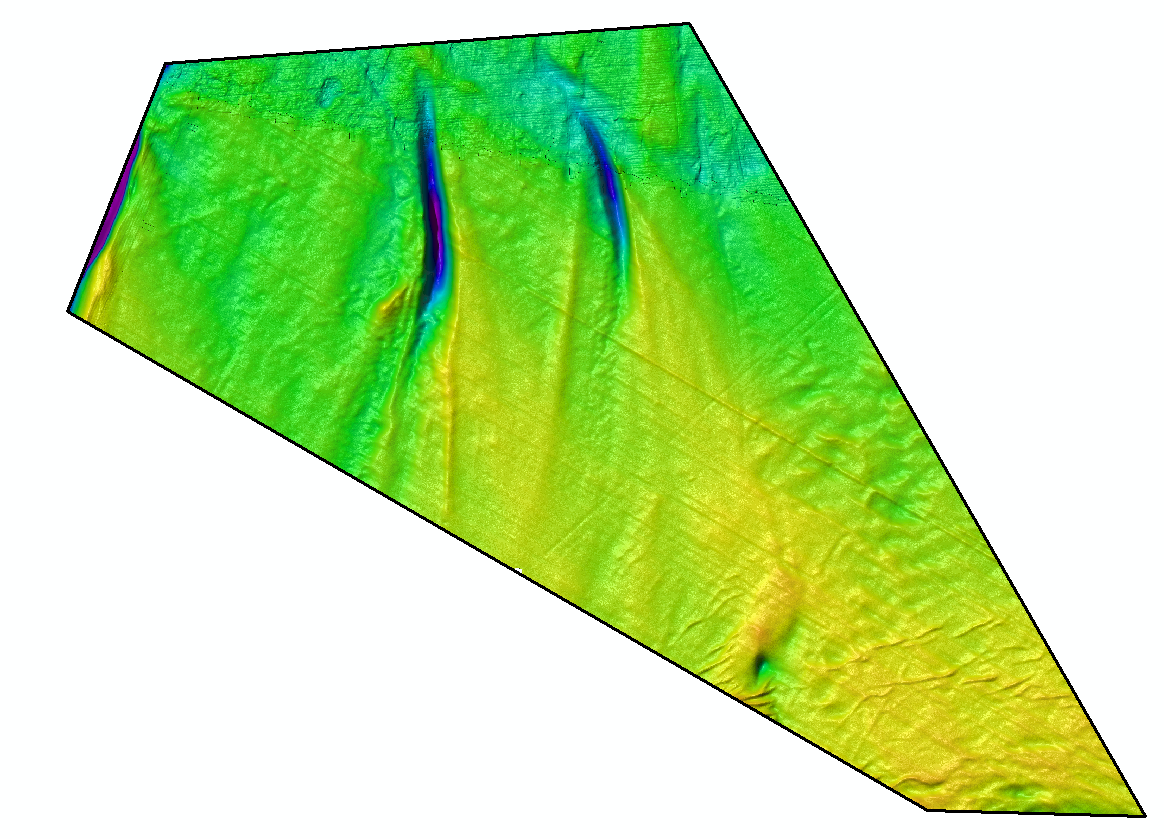
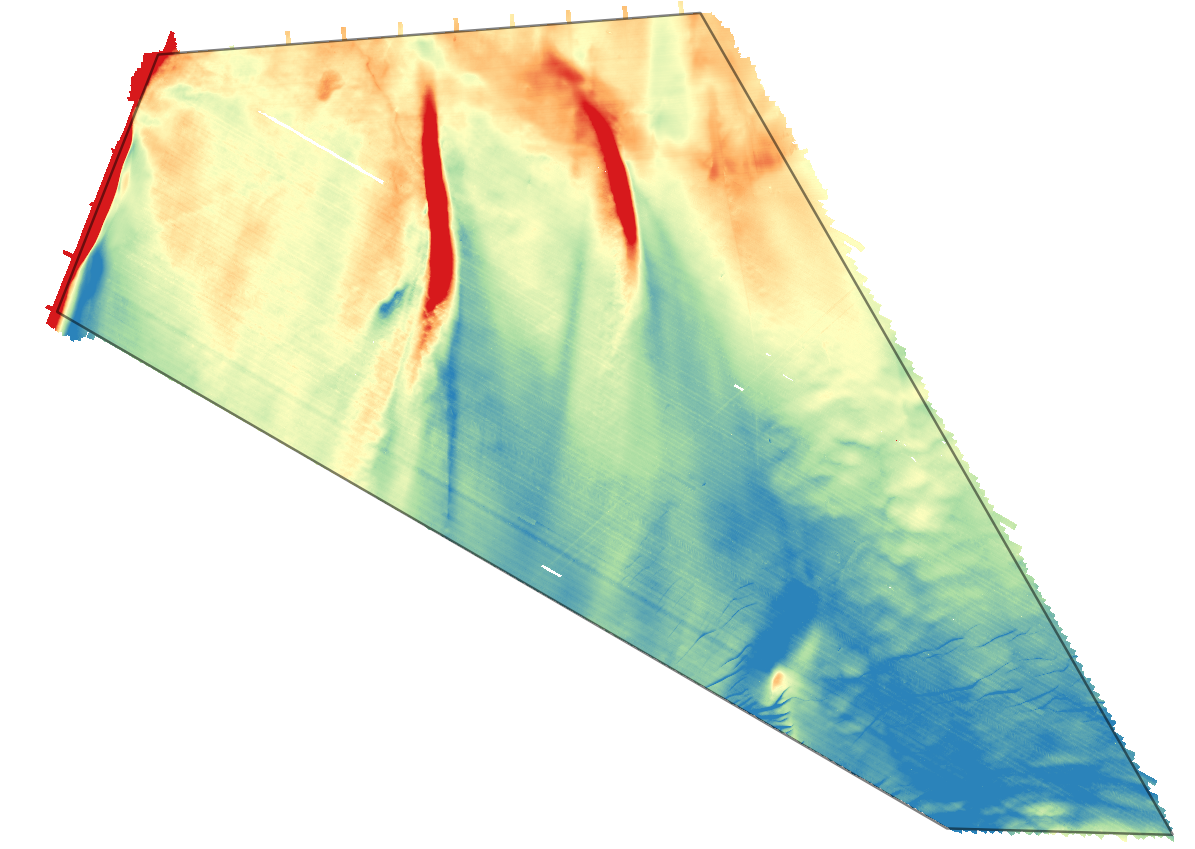
- Levelled all 130 1x1m reprocessed survey lines
- 1x1m DTM - now fit for engineering purposes
- Seabed features now clearly identified
results
Ultimately - raster processing saved the client $$$'s!!

Working together
for a safer world
Gareth Grewcock
Geospatial Team
Survey & GeoEngineering
Lloyd's Register
T +44 (0)1225 485800 E
Lloyd’s Register and variants of it are trading names of Lloyd’s Register Group Limited, its subsidiaries and affiliates.
Copyright © Lloyd’s Register. 2016. A member of the Lloyd’s Register group.
Gareth.Grewcock@lr.org
Maximising value from legacy raster bathymetry datasets [Rasters Revealed 2017]
By Lloyd's Register
Maximising value from legacy raster bathymetry datasets [Rasters Revealed 2017]
Presentation to Rasters Revealed 21.02.2017


