


















Lucia Kocincova
Data Analyst and Data Viz somewhere
○ hard to develop and progress the ideas further
○ hard to draw conclusions to overall visual problem
○ hard to share versions during development
○ very hard to go back to a specific version
Does the process really matter?
○ NO
○ ..but also YES
○ NO
○ ..but also YES
○ hard to develop and progress the ideas further
○ hard to draw conclusions to overall visual problem
○ hard to share versions during development
○ very hard to go back to a specific version
Does the process really matter?
○ state main goal/question
Make possibilities visible
○ list data (with type/ranges)
○ indicate current mappings
○ sort into categories
○ state main goal/question
○ list data (with type/ranges)
○ indicate current mappings
○ sort into categories
Make possibilities visible
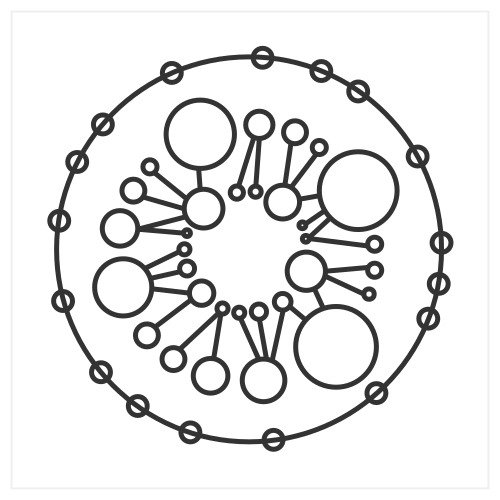
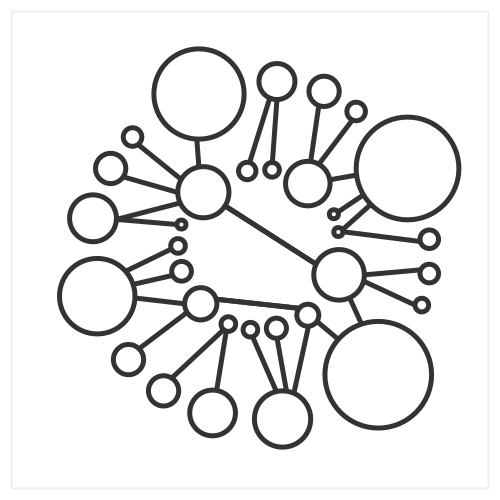
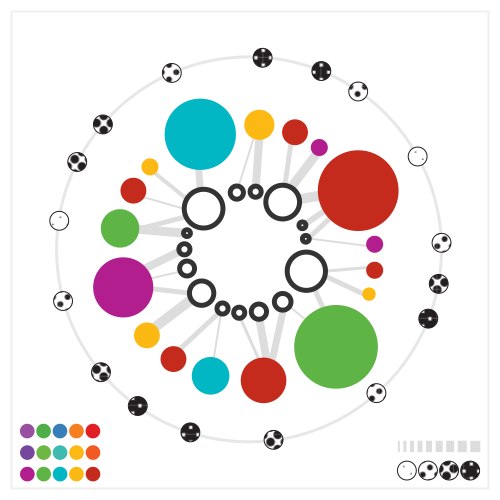
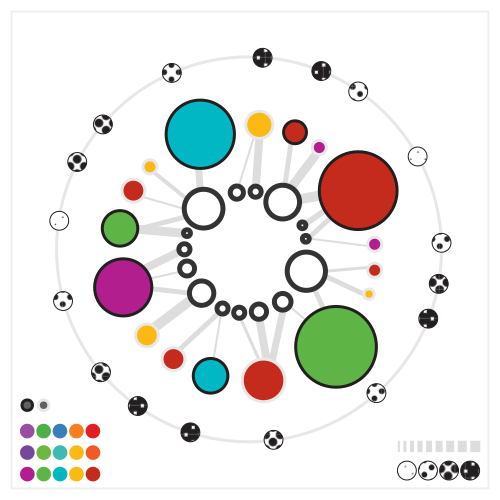
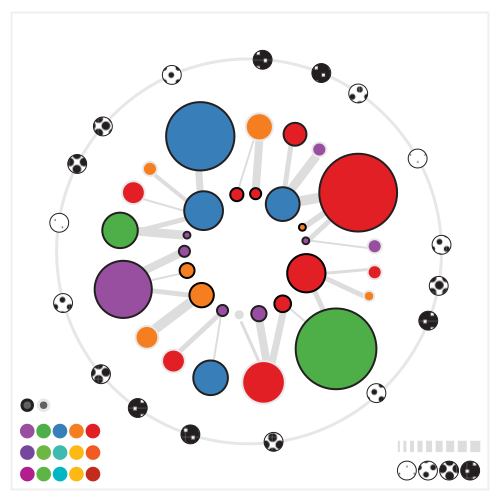
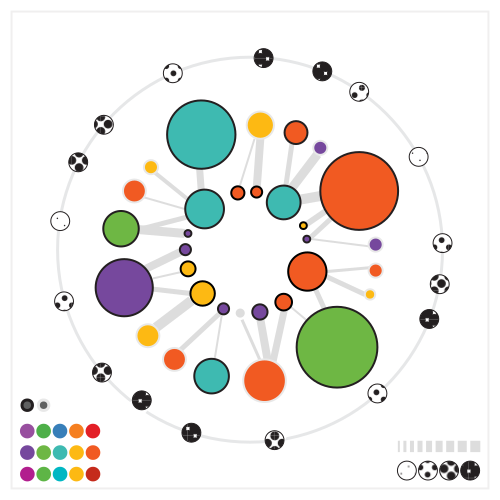
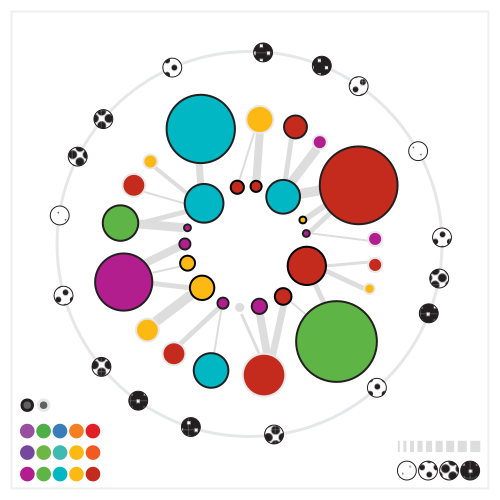
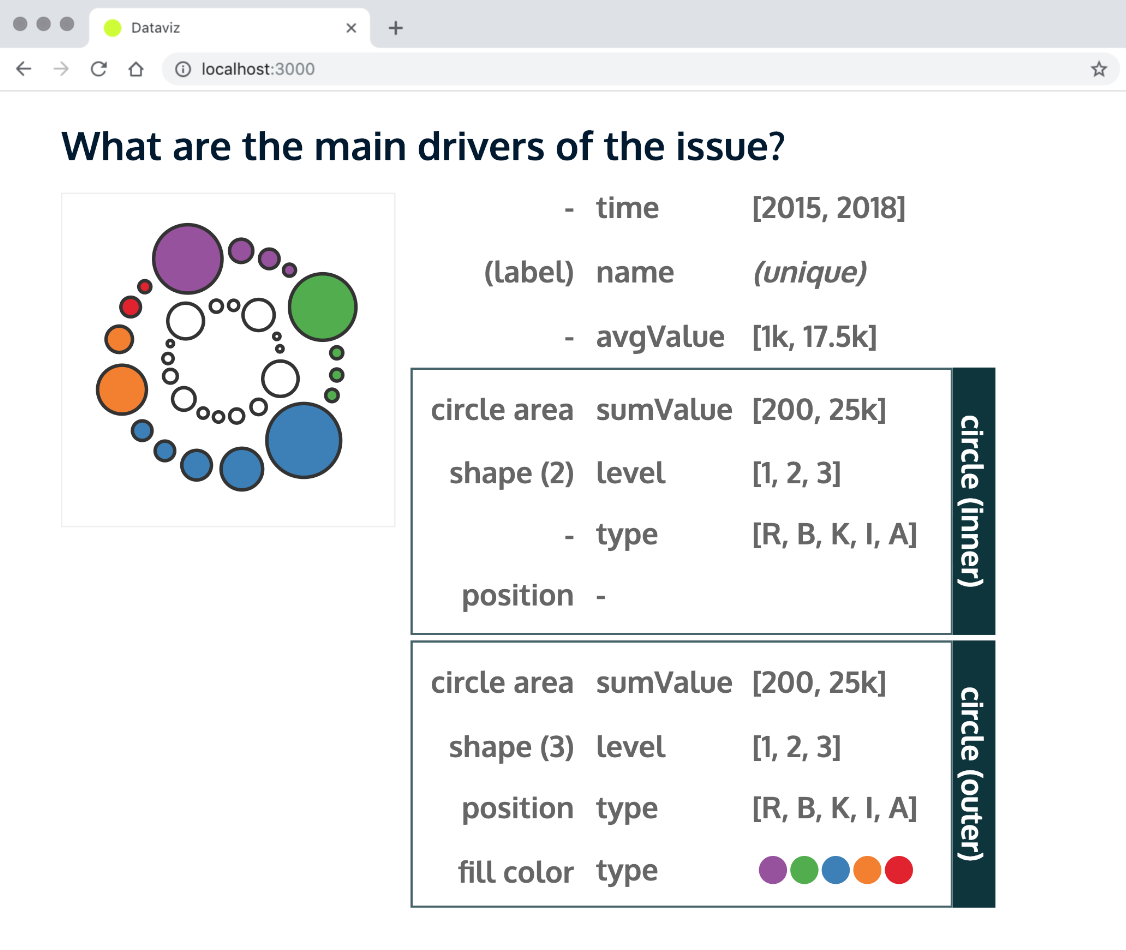
What are the main drivers of the issue?
time
name
sumValue
avgValue
level
type
[2015, 2018]
(unique)
[200, 25k]
[1k, 17.5k]
[1, 2, 3]
[R, B, K, I, A]
-
(label)
circle area
-
shape (3)
position
fill color
circle (outer)
sumValue
level
type
[200, 25k]
[1, 2, 3]
[R, B, K, I, A]
circle area
shape (2)
position
circle (inner)
-
-
type
form
color
position
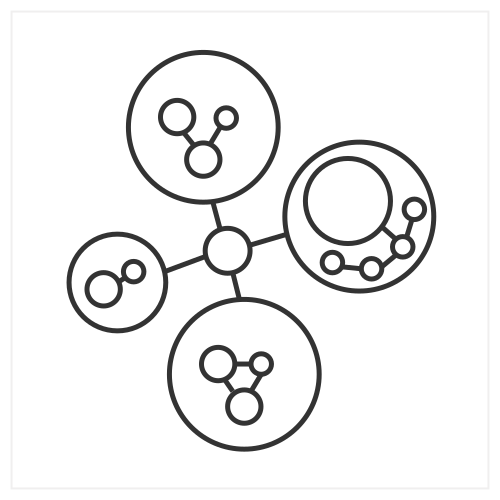
circle (2) | circle (3)
type (3)
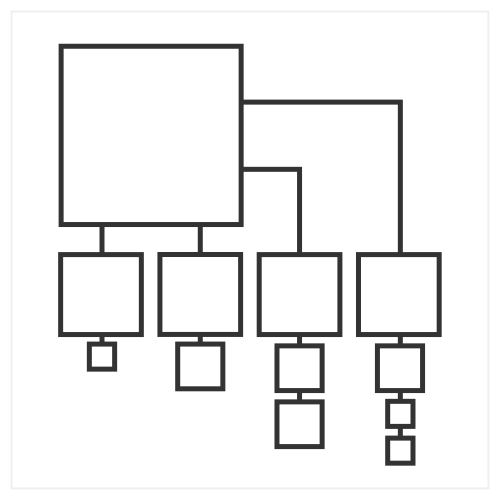
type + hierarchy
motion
---
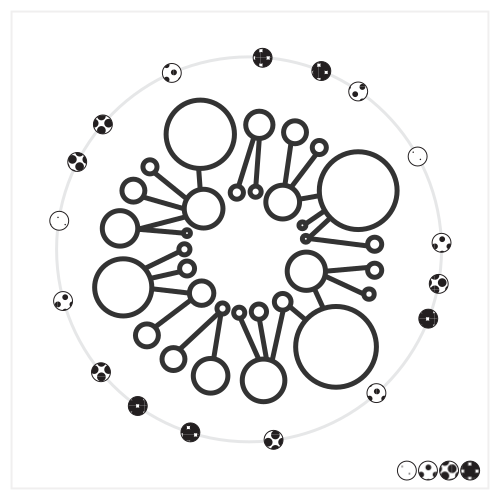
Preattentive attributes
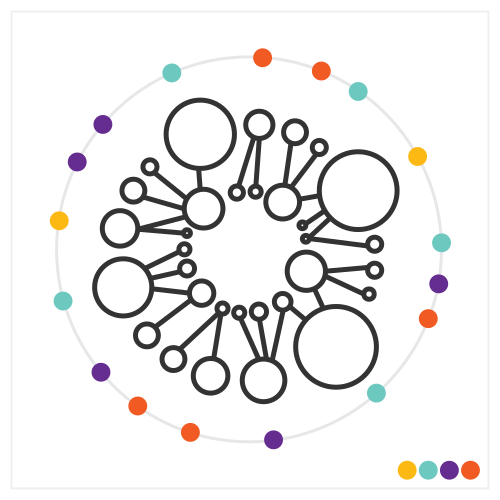
(picture from
Interactive Visualization
by Bill Ferster)
(selected)
Preattentive attributes
(selected)
○ v1
Semantic versioning
○ v2.0.0-beta
Doesn't have to include just numbers
○ v1.3.20
○ v12_flow_diagram_color_options
○ vDonut-chart-with-jam
_final
_final_final_really
v1.3.4
new idea/mapping
developing same idea
minor change
<INSERT ANYTHING>
<THAT WORKS>
<FOR YOU>
○ v1
○ v1.3.20
Semantic versioning
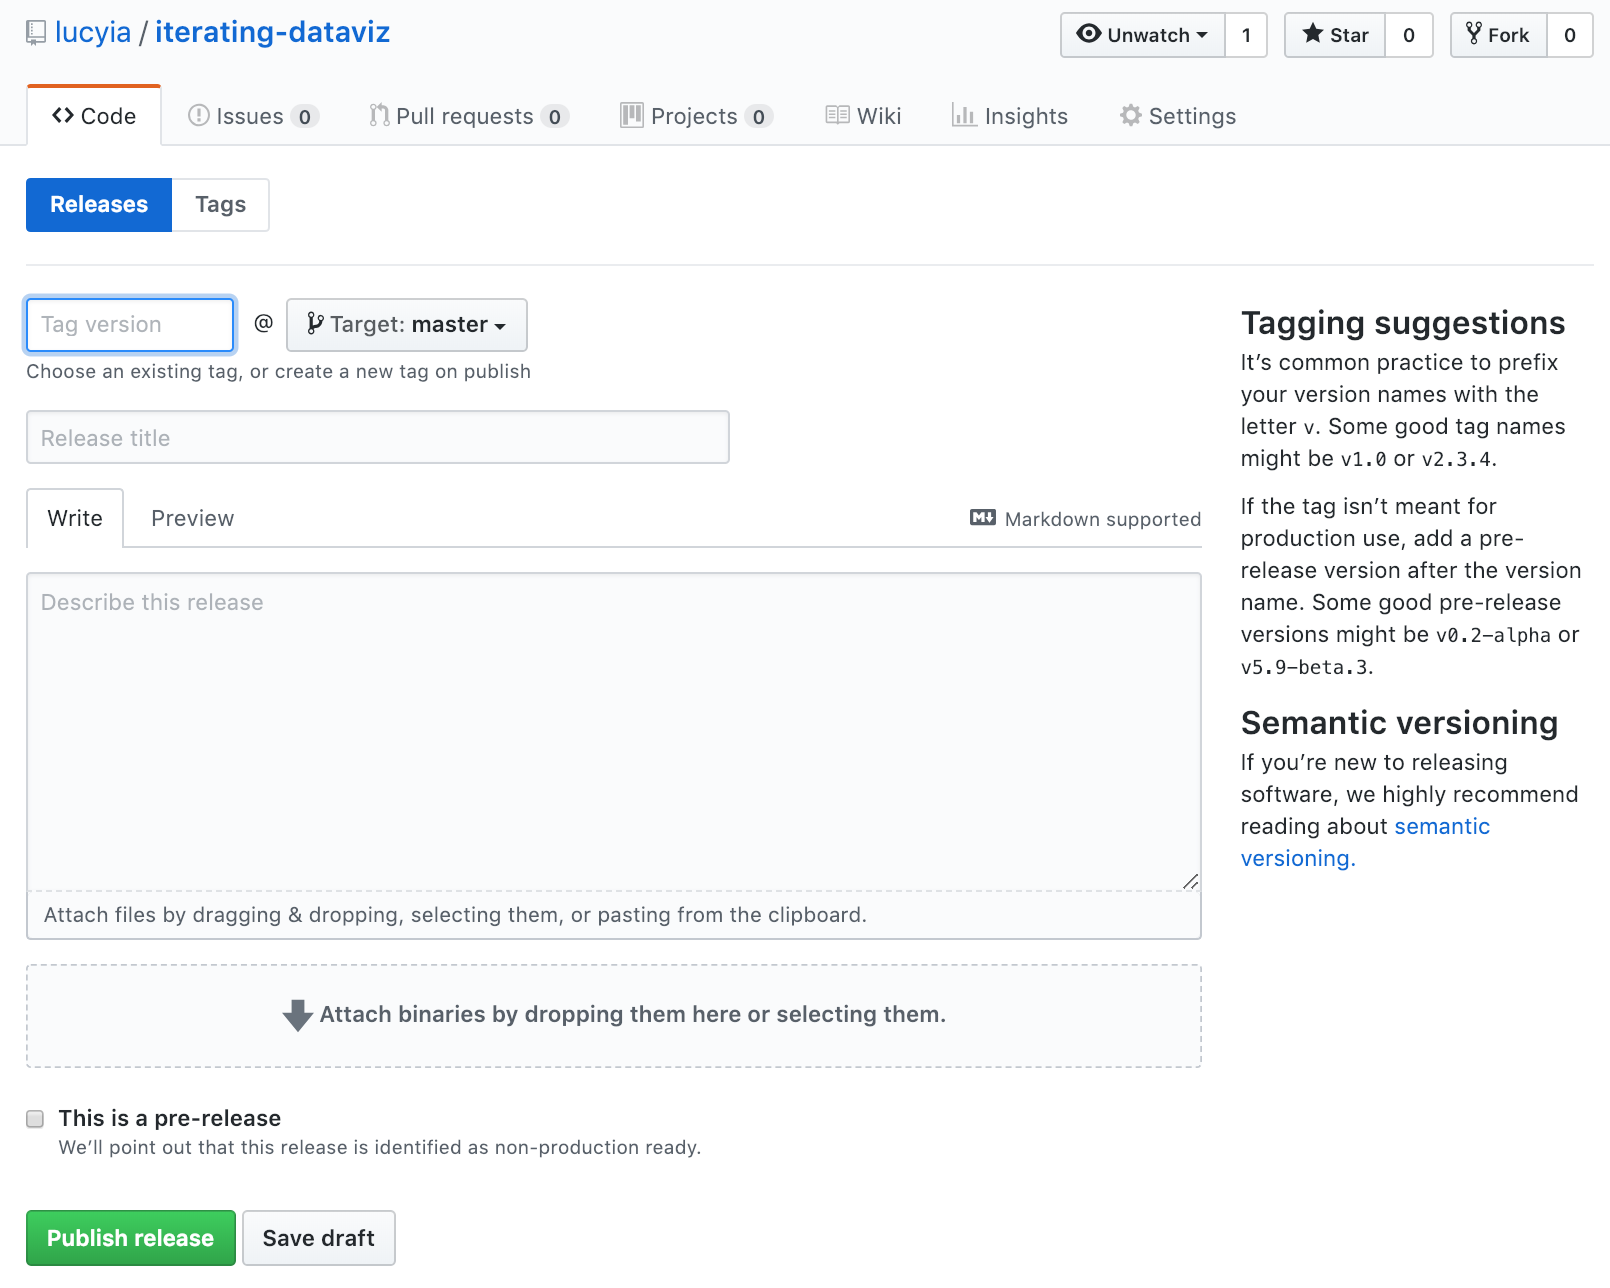
○ create a tag
○ publish tags
○ see other tags
Git 101
○ repeat
○ git tag v1.0
○ git tag -a v1.0 -m "Pizza chart"
○ git push origin : v1.0
○ git tag
○ git push origin --tags
○ create a tag
○ publish tags
○ see other tags
○ repeat
Git 101
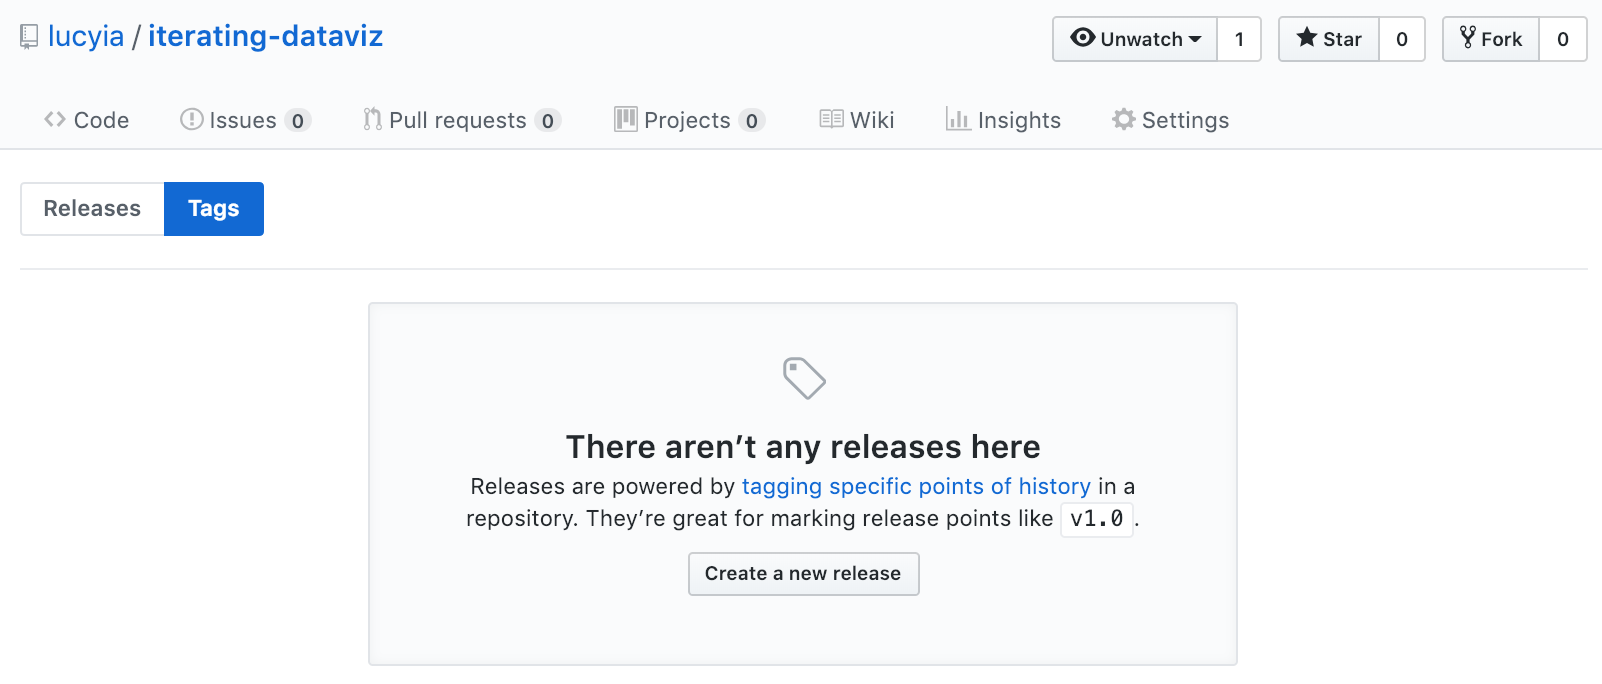
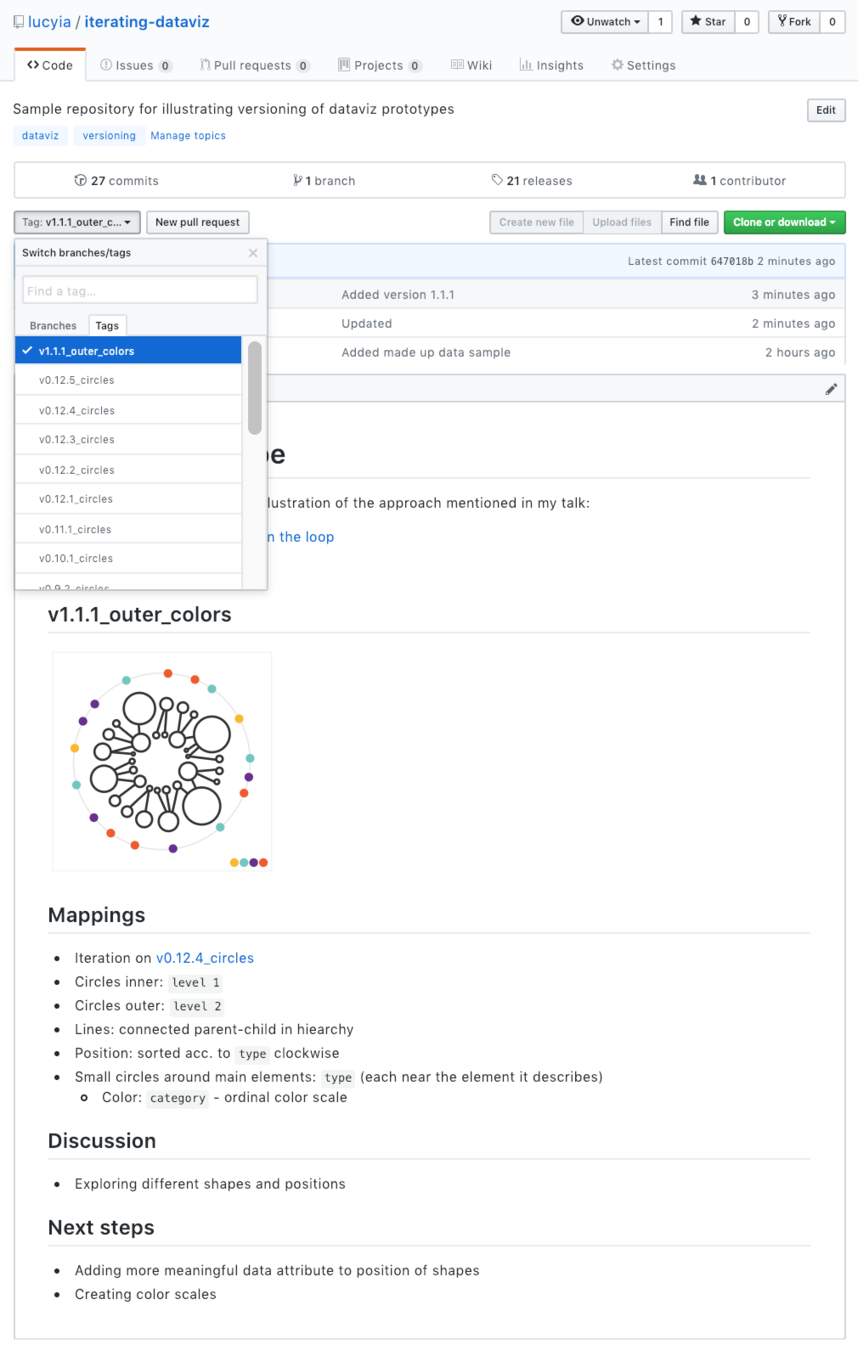
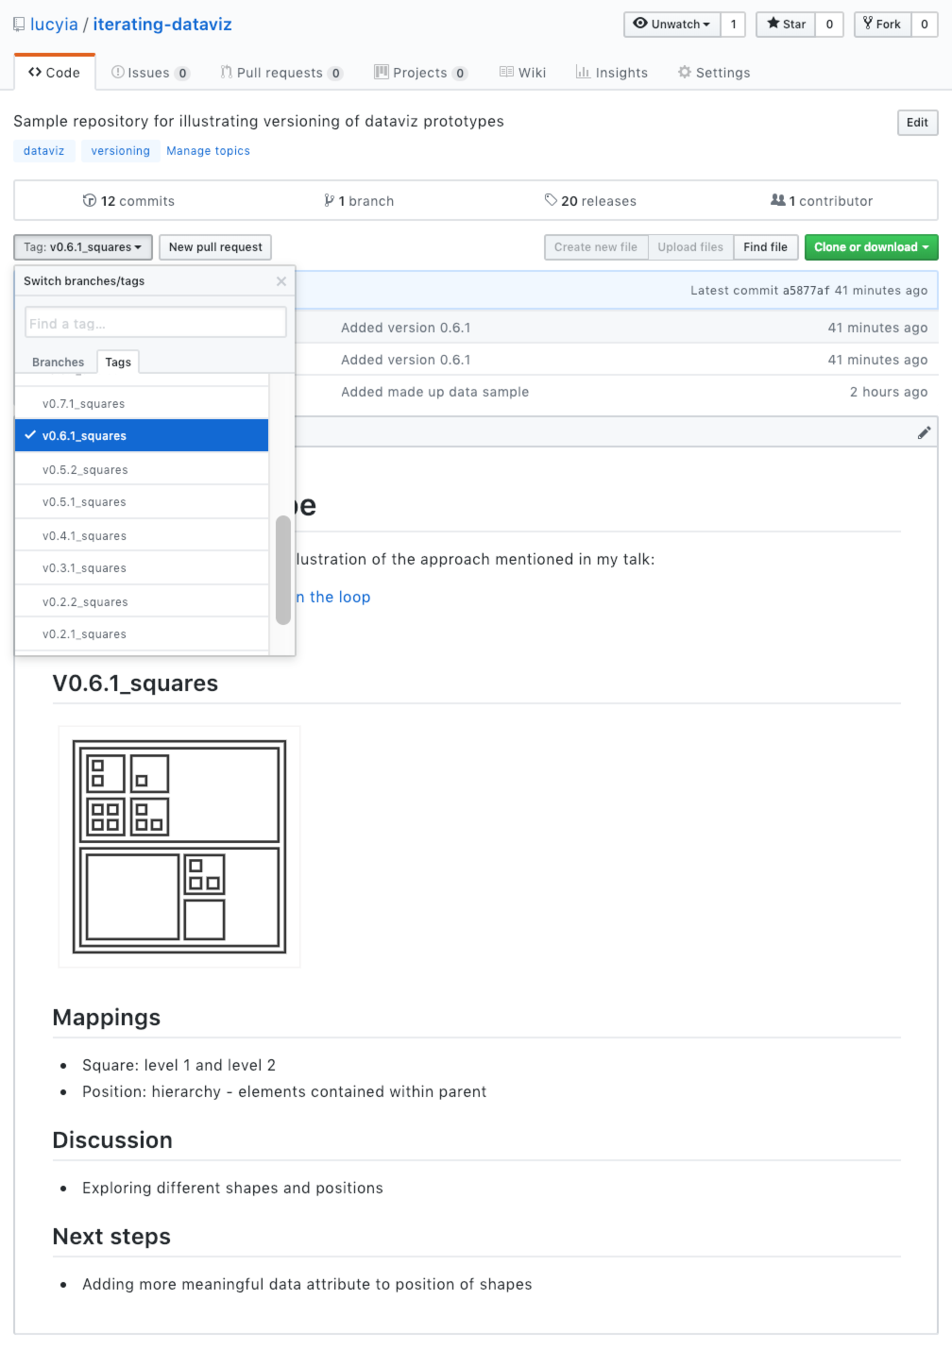
GitHub tags
GitHub tags
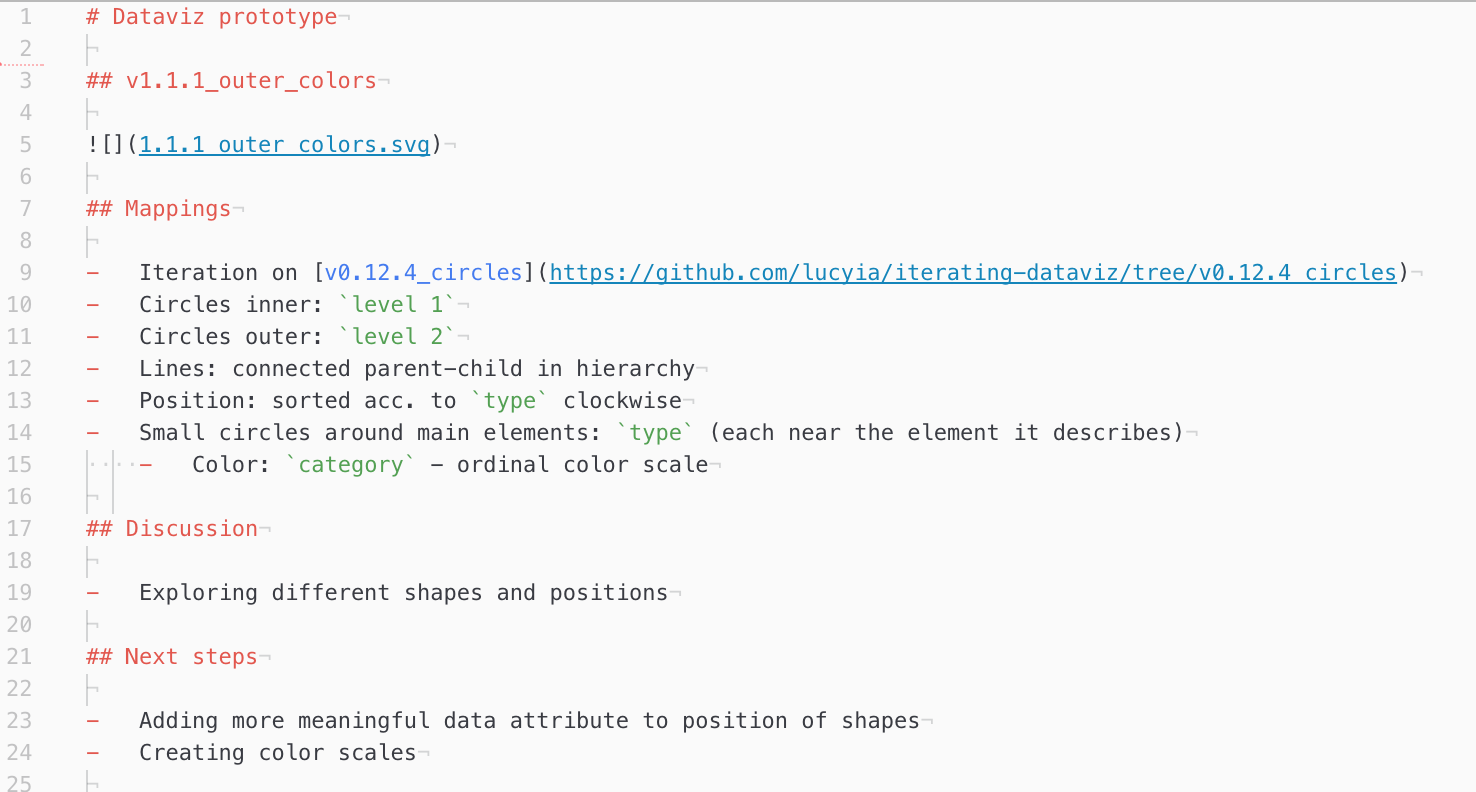
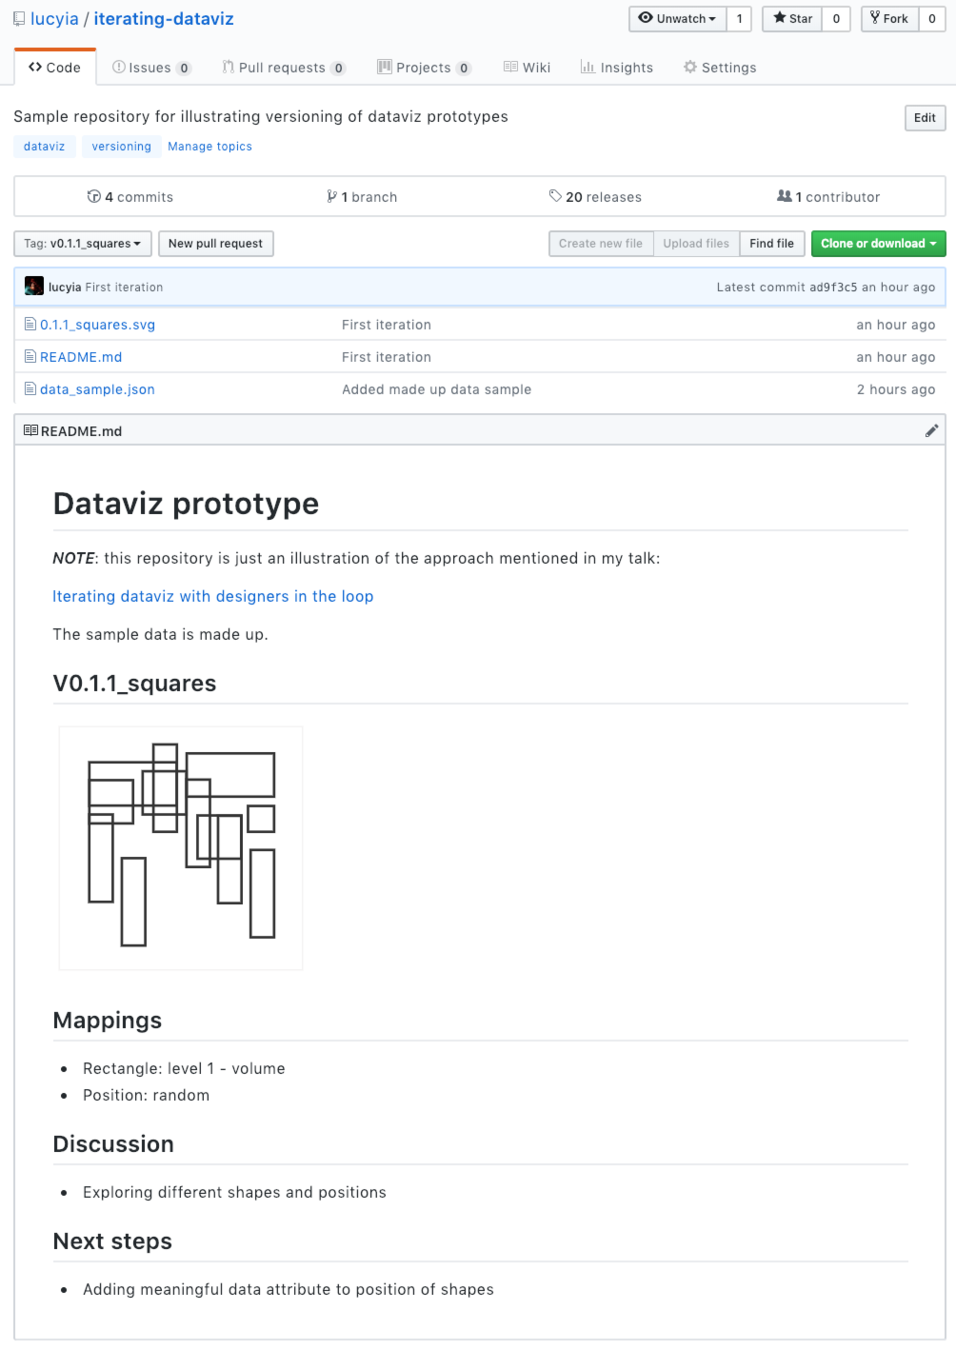
○ version
○ image
○ discussed ideas
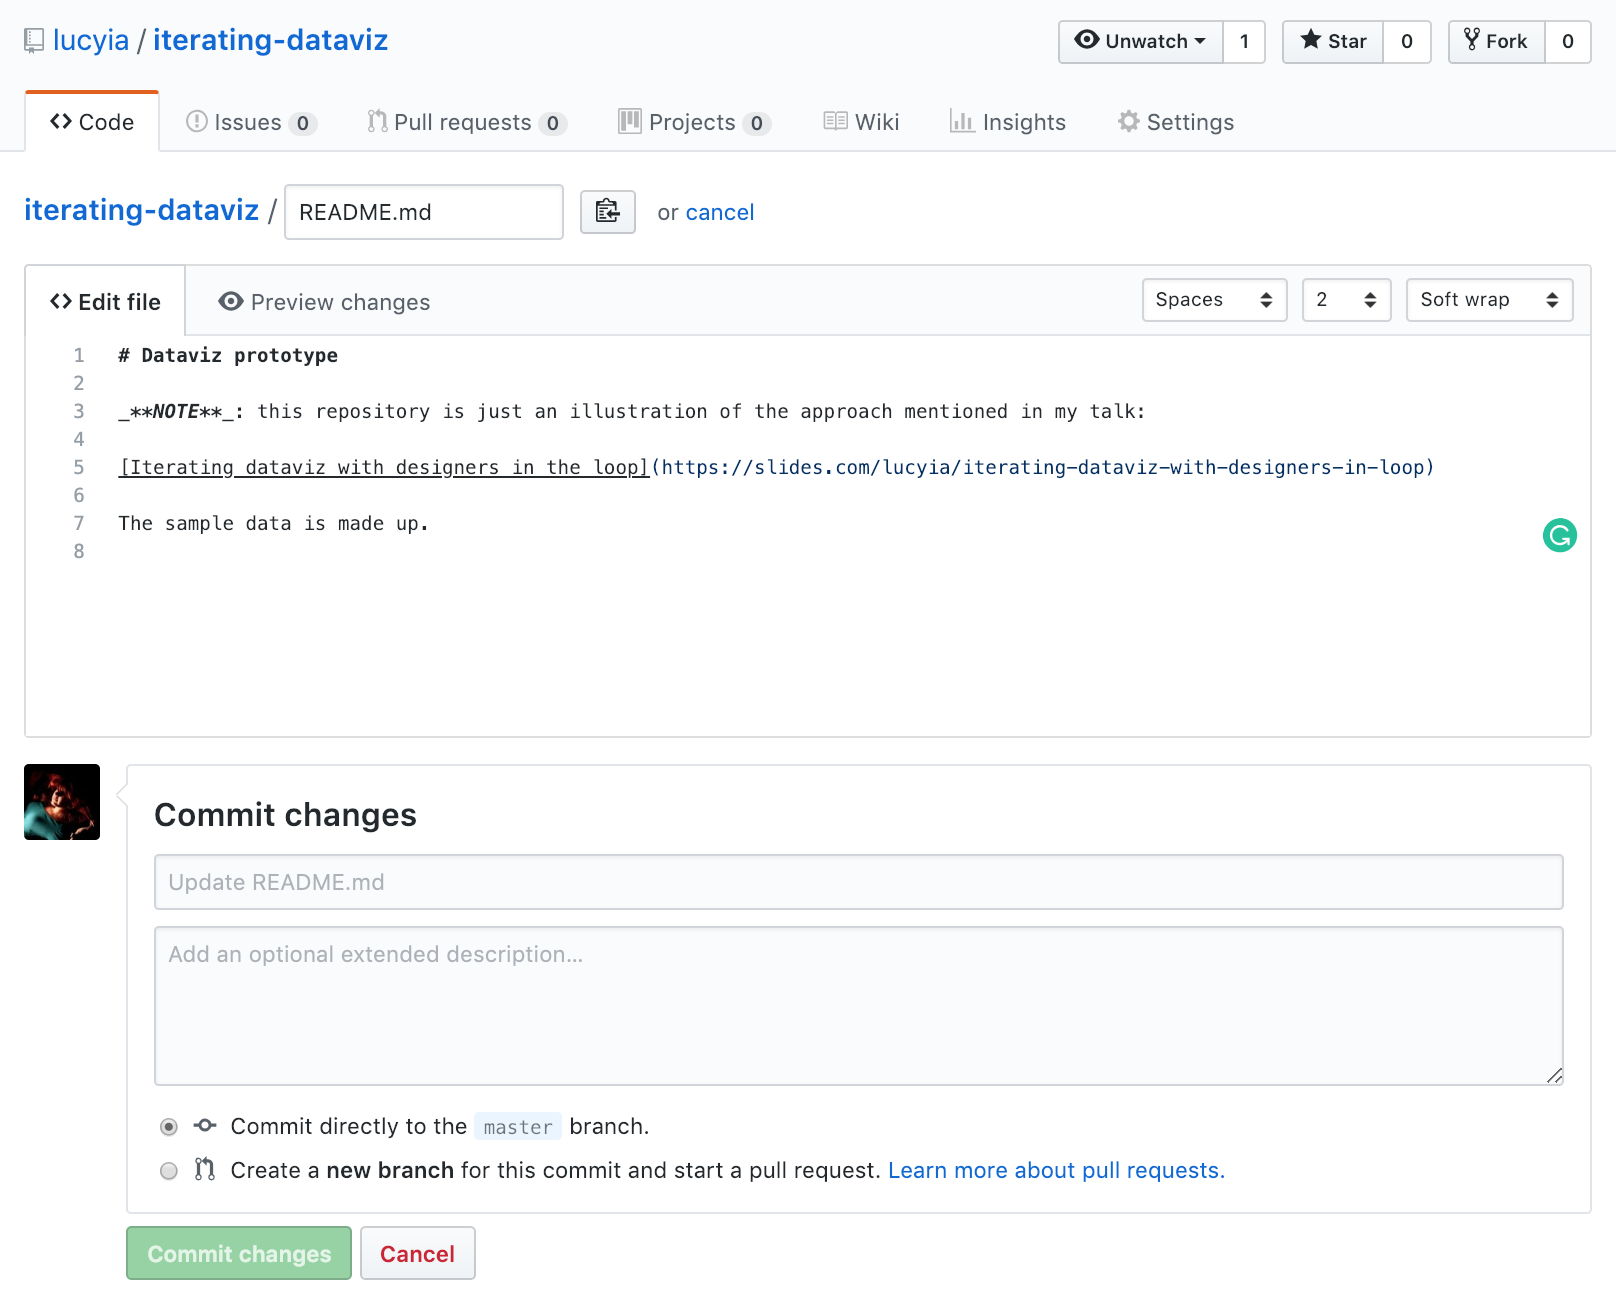
README
○ reasoning
○ ...
○ version
○ image
○ discussed ideas
○ reasoning
○ ...
README
GitHub README
GitHub README
Benefits of combining
○ single source of truth
○ easier to share and discuss
○ easier to come back
○ designers can contribute to Git
○ without necessarily
opening a command line
○ single source of truth
○ easier to share and discuss
○ easier to come back
○ designers can contribute to Git
○ without necessarily
opening a command line
Benefits of combining
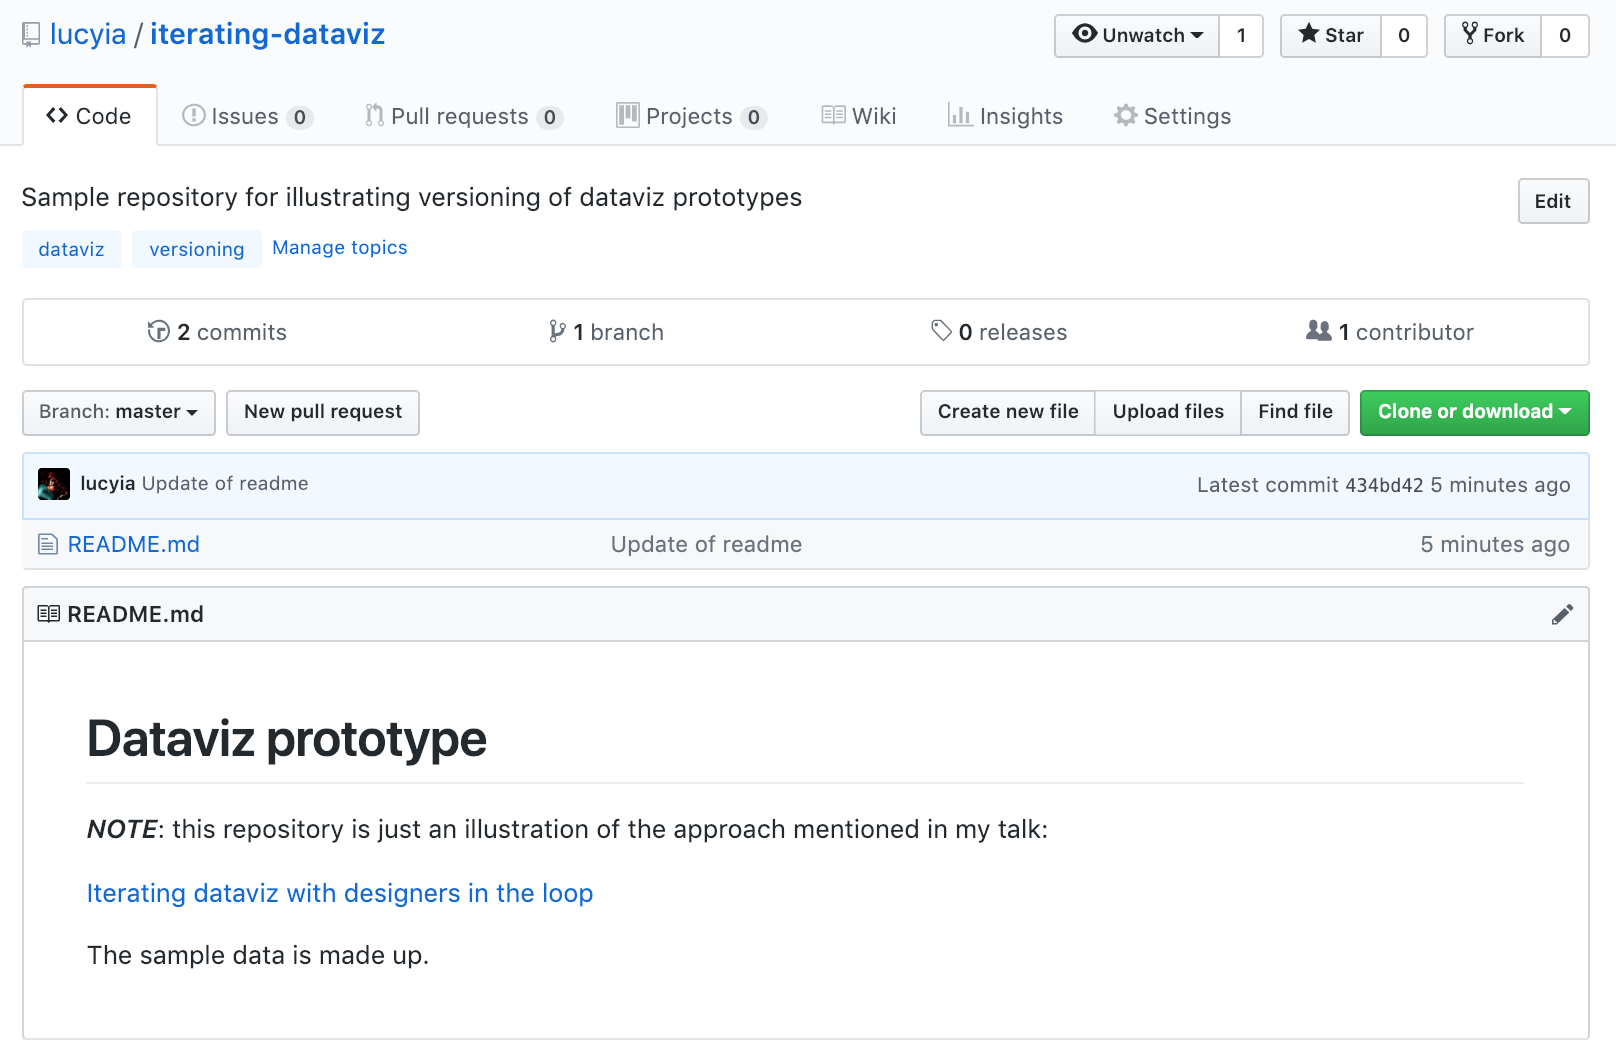
Check the repository:
Independent in this approach
○ you can apply it
into your Git workflow
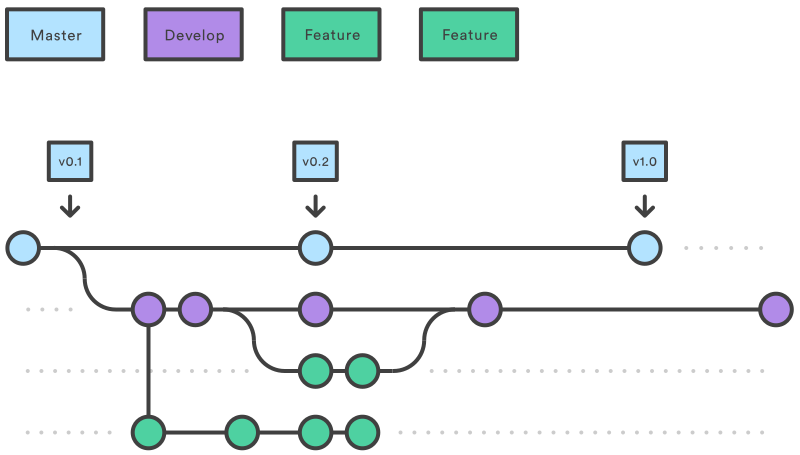
○ ideally branches are used
throughout development
○ you can apply it
into your Git workflow
○ ideally branches are used
throughout development
Independent in this approach
○ there isn't one solution for all
○ experiment and bend the tools
○ the cake is a lie
○ share your ideas & experiments
○ the cake is a lie
○ there isn't one solution for all
○ experiment and bend the tools
○ share your ideas & experiments
About that...
About that...
○ Git tags
○ Markdown for Readme
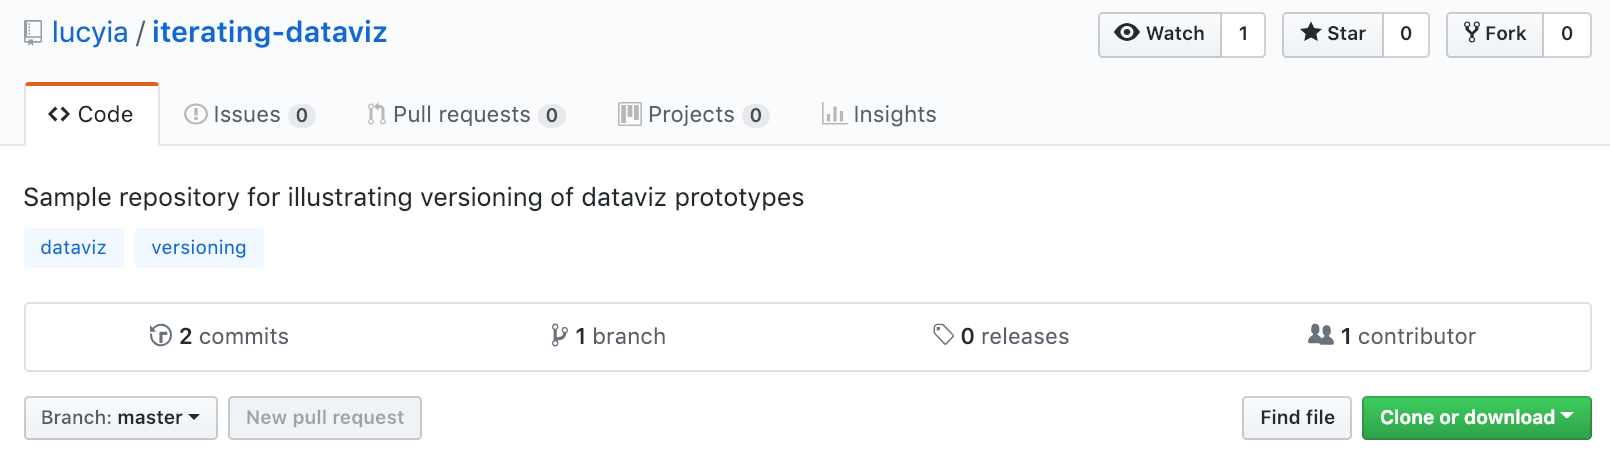
○ Illustrative GitHub repo
○ Gitflow Workflow
Image credits:
○ Semantic versioning
○ Git tags
○ Preattentive attributes (interactive examples)
By Lucia Kocincova
Talk at Data visualization meetup | Microsoft Reactor London
