


Lucia Kocincova
Data Analyst and Data Viz somewhere
lucia kocincova
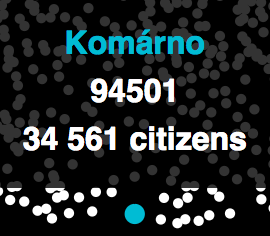
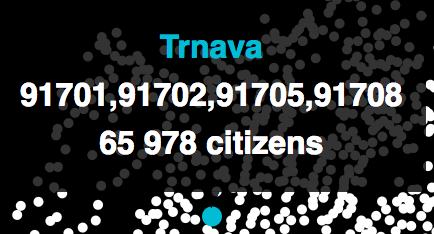
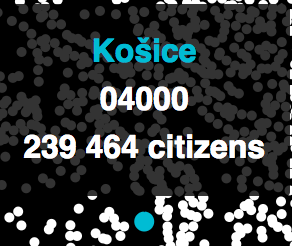
lucyia | zip codes of Slovakia
9
2
1
1
5
Ben Fry | zipdecode
?
9
?
9
?
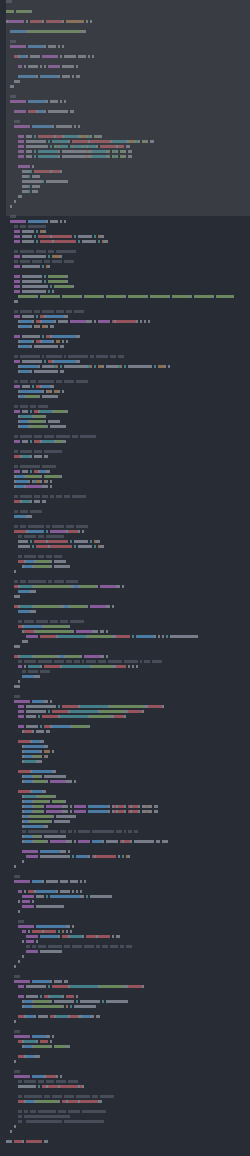
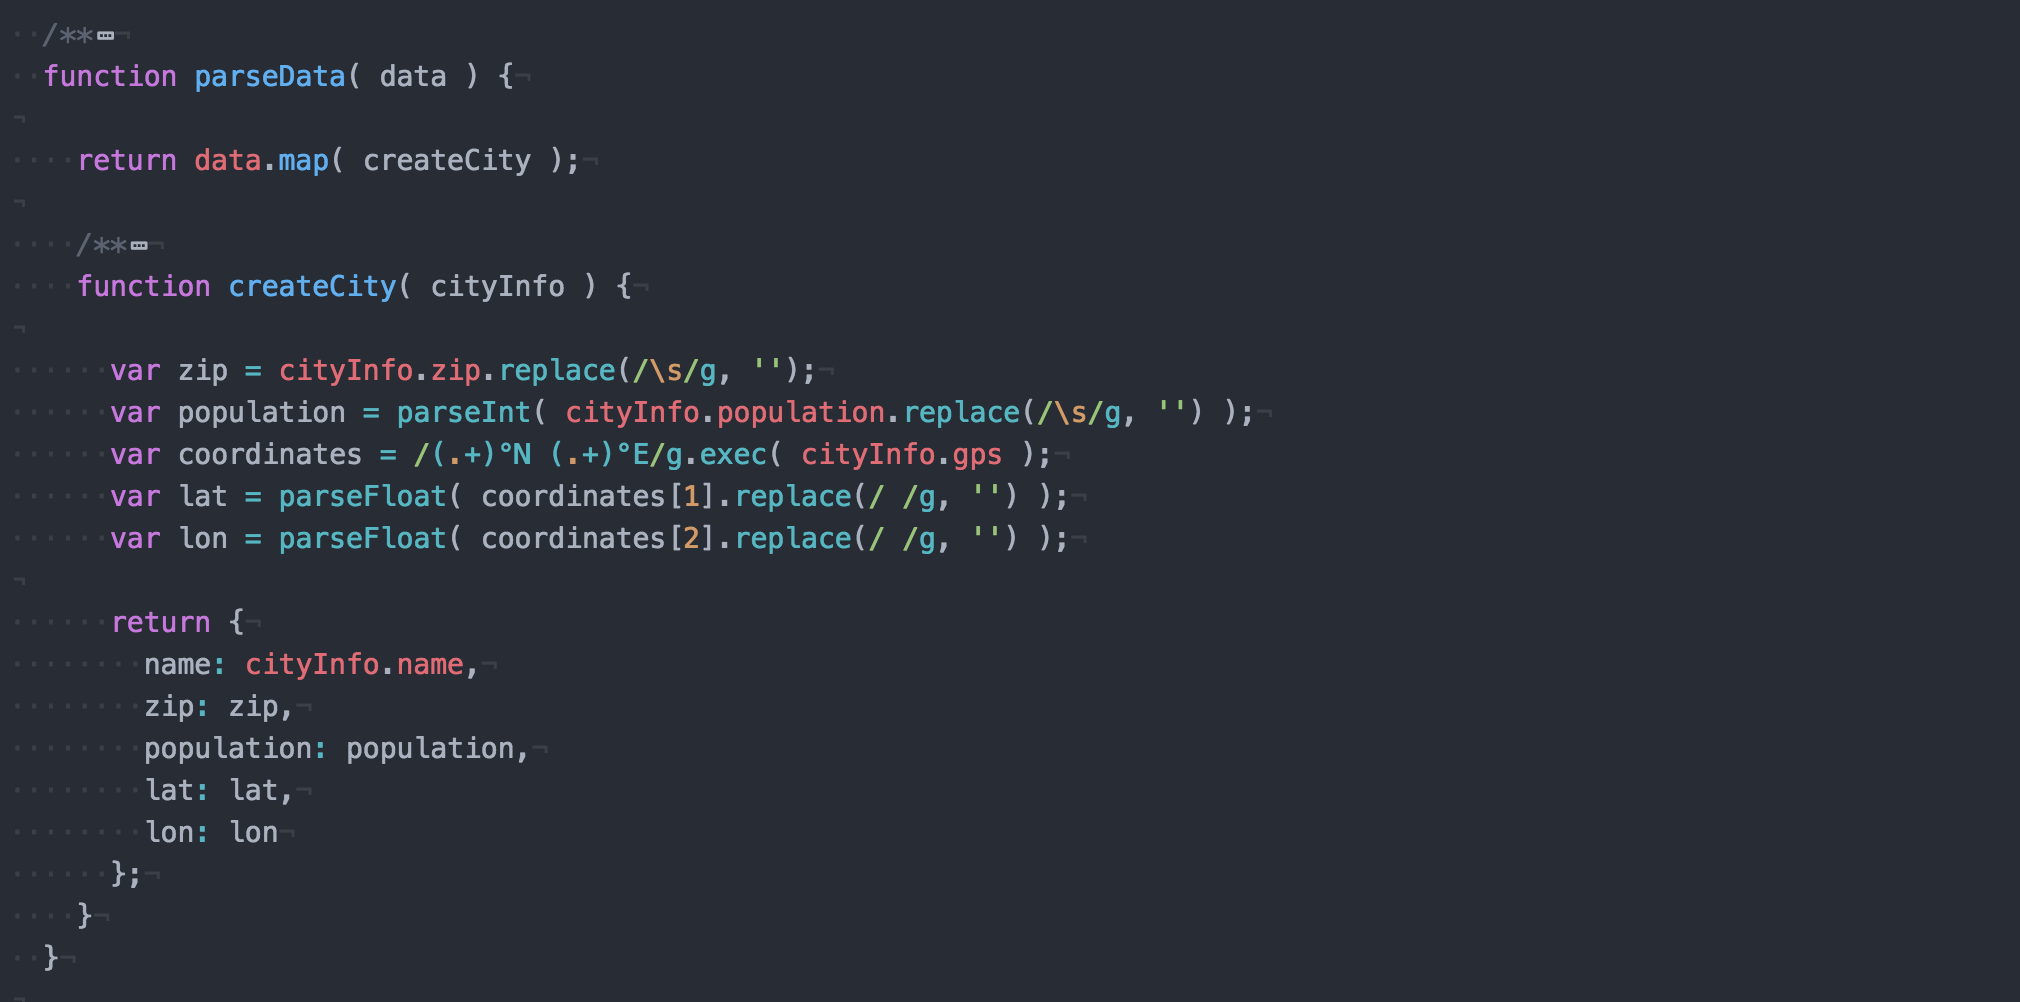
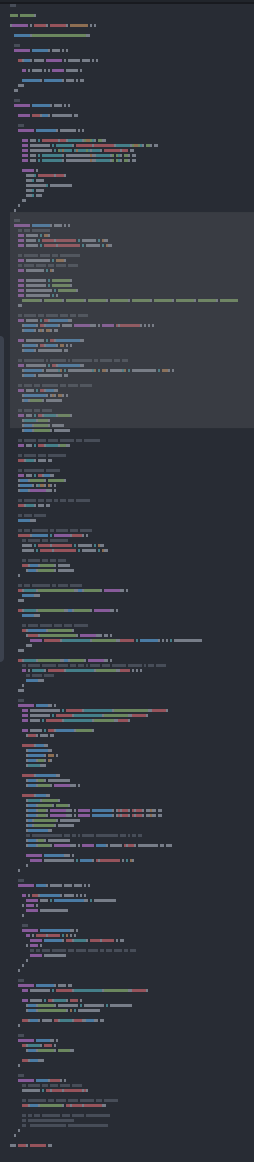
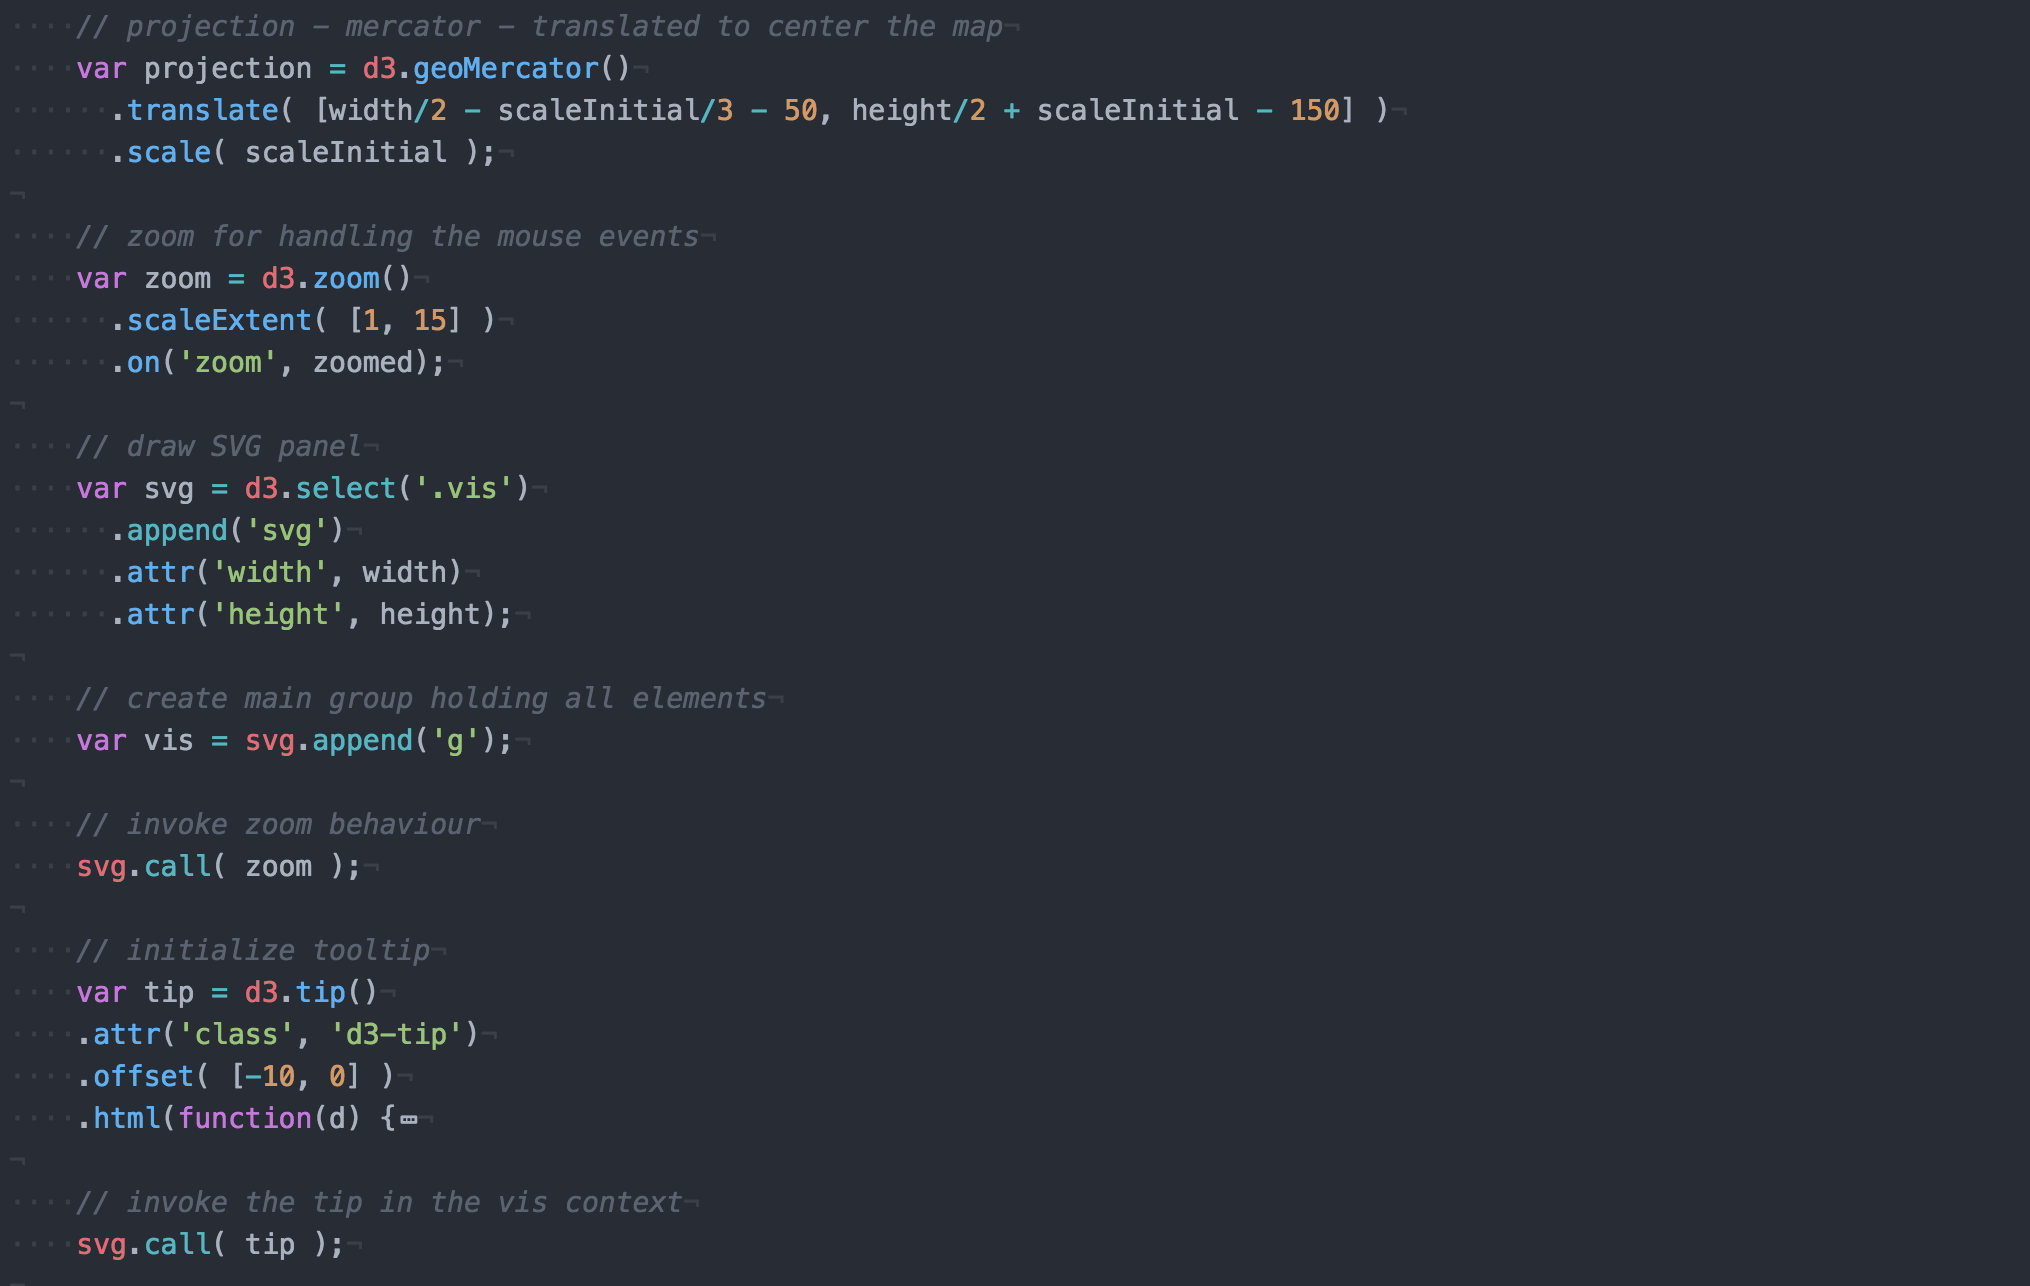
how to create an interactive map with d3.js
[crash course]
1. process / get data
2. setup variables and scales
3. setup projection, zoom handling, tip, ...
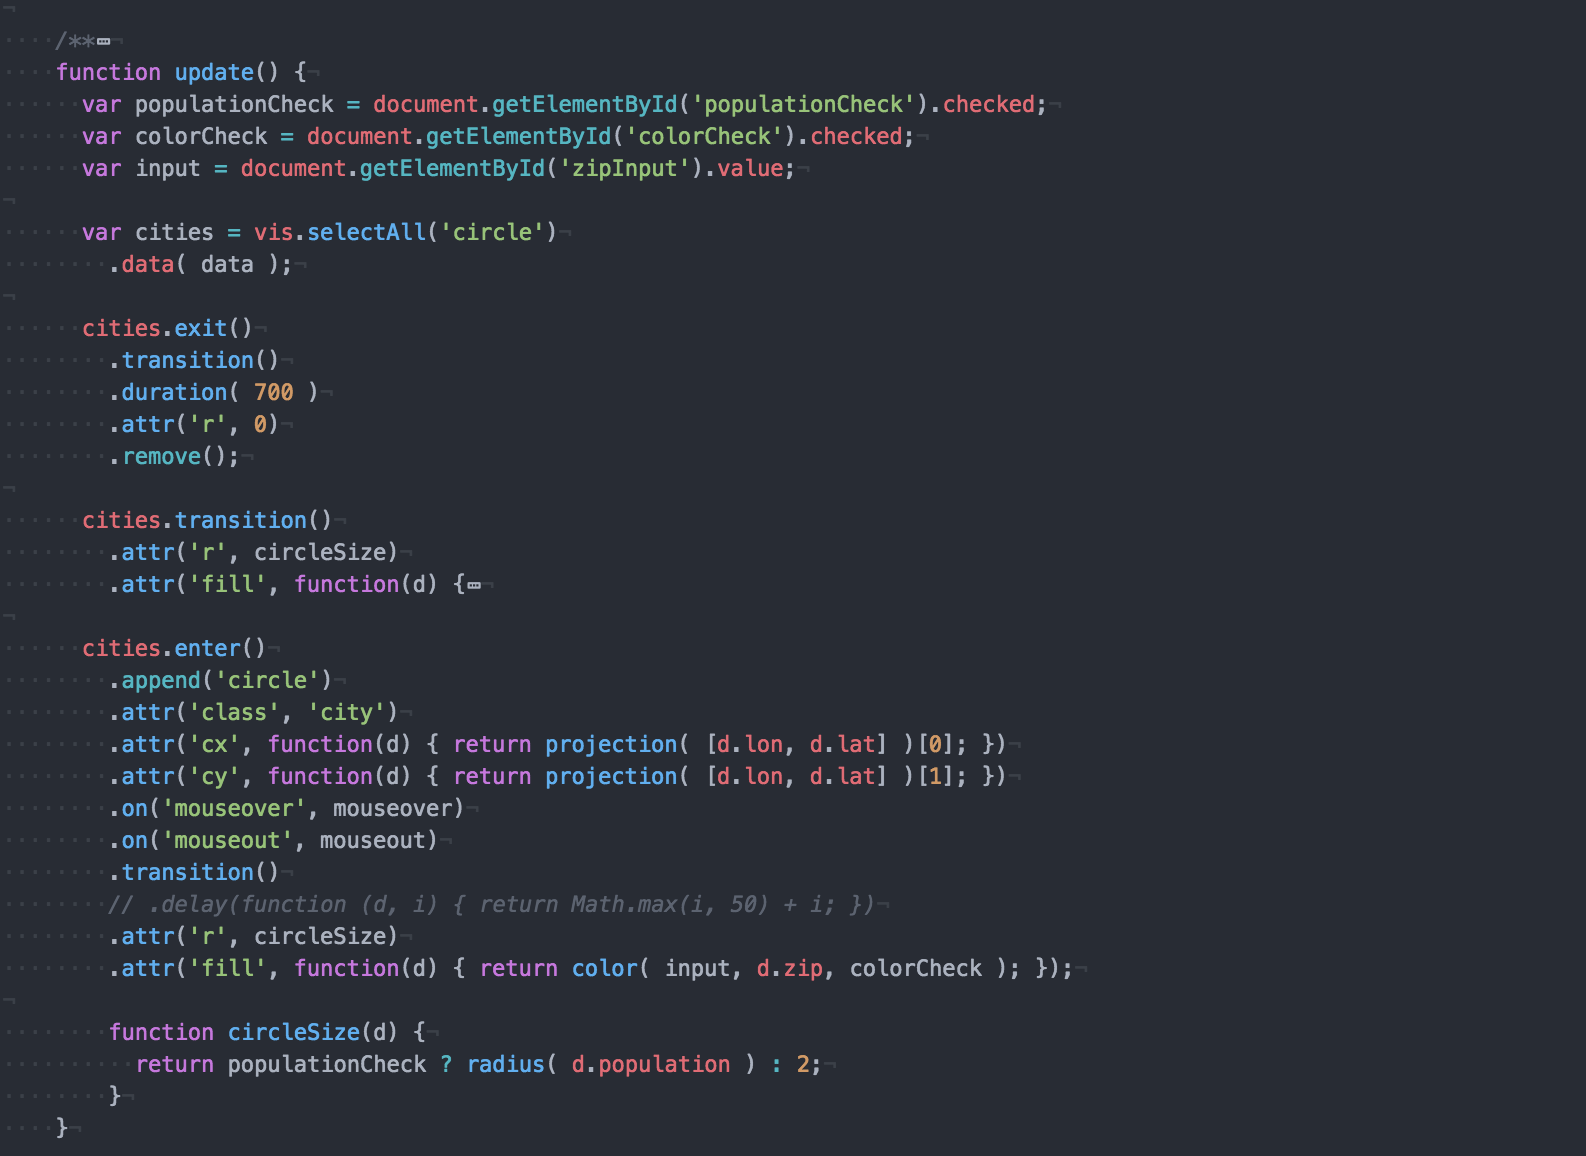
4. draw the data
[d3 update pattern]
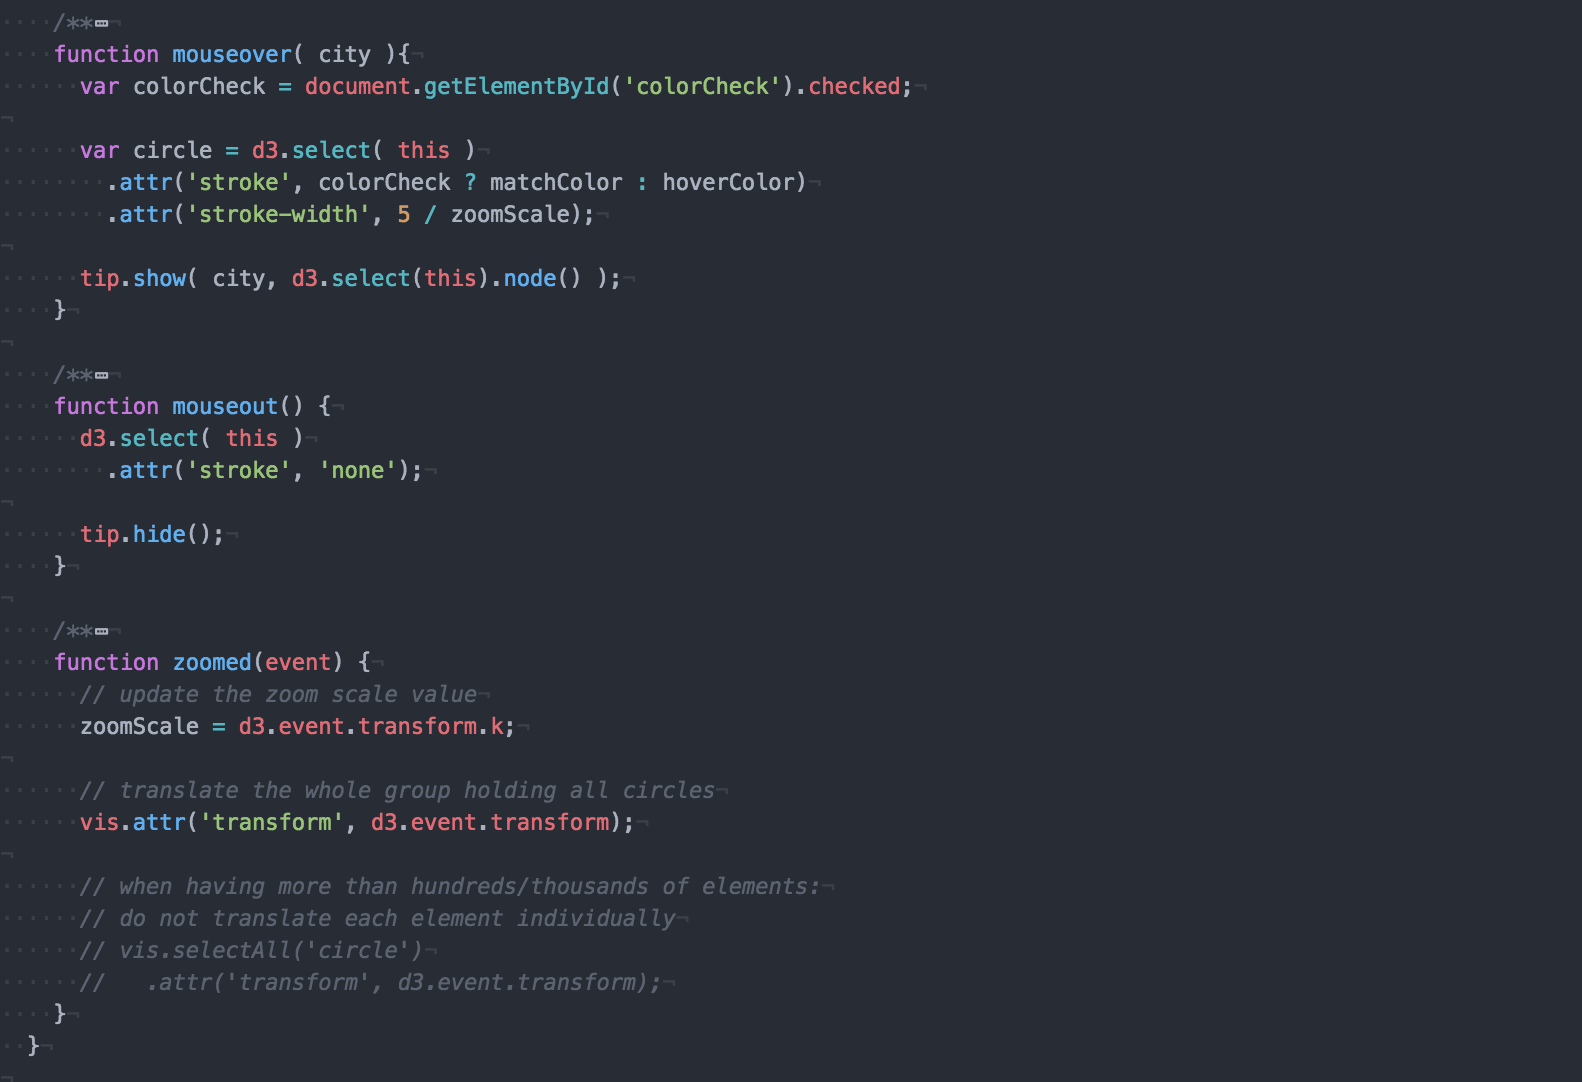
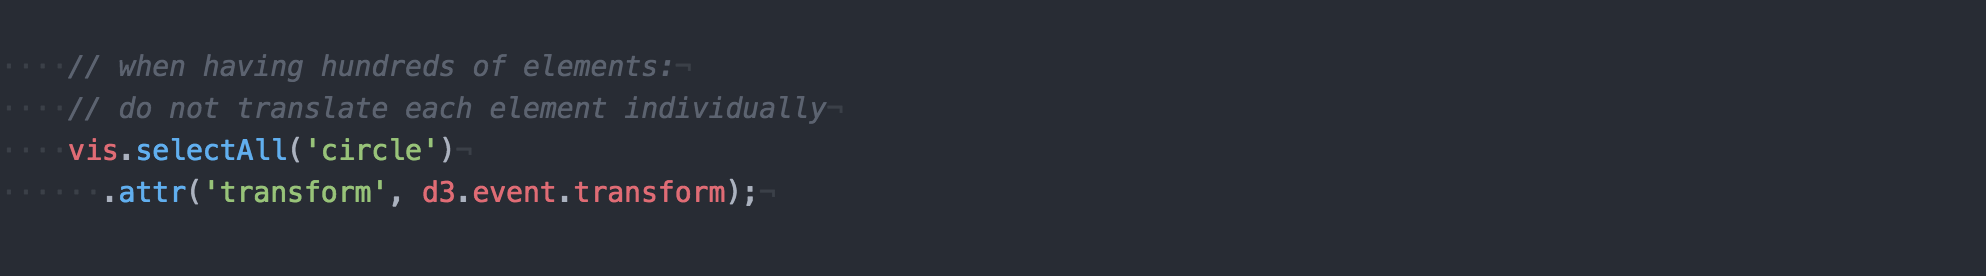
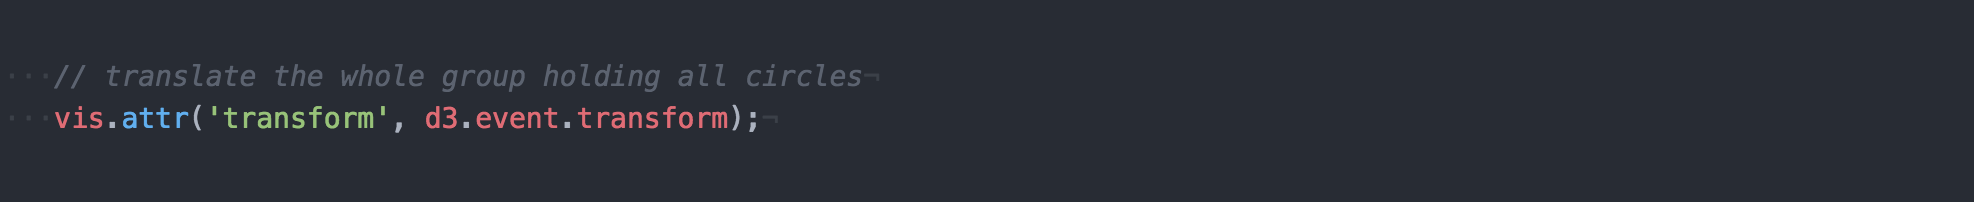
5. handle the behaviour of zoom, mouse, ...
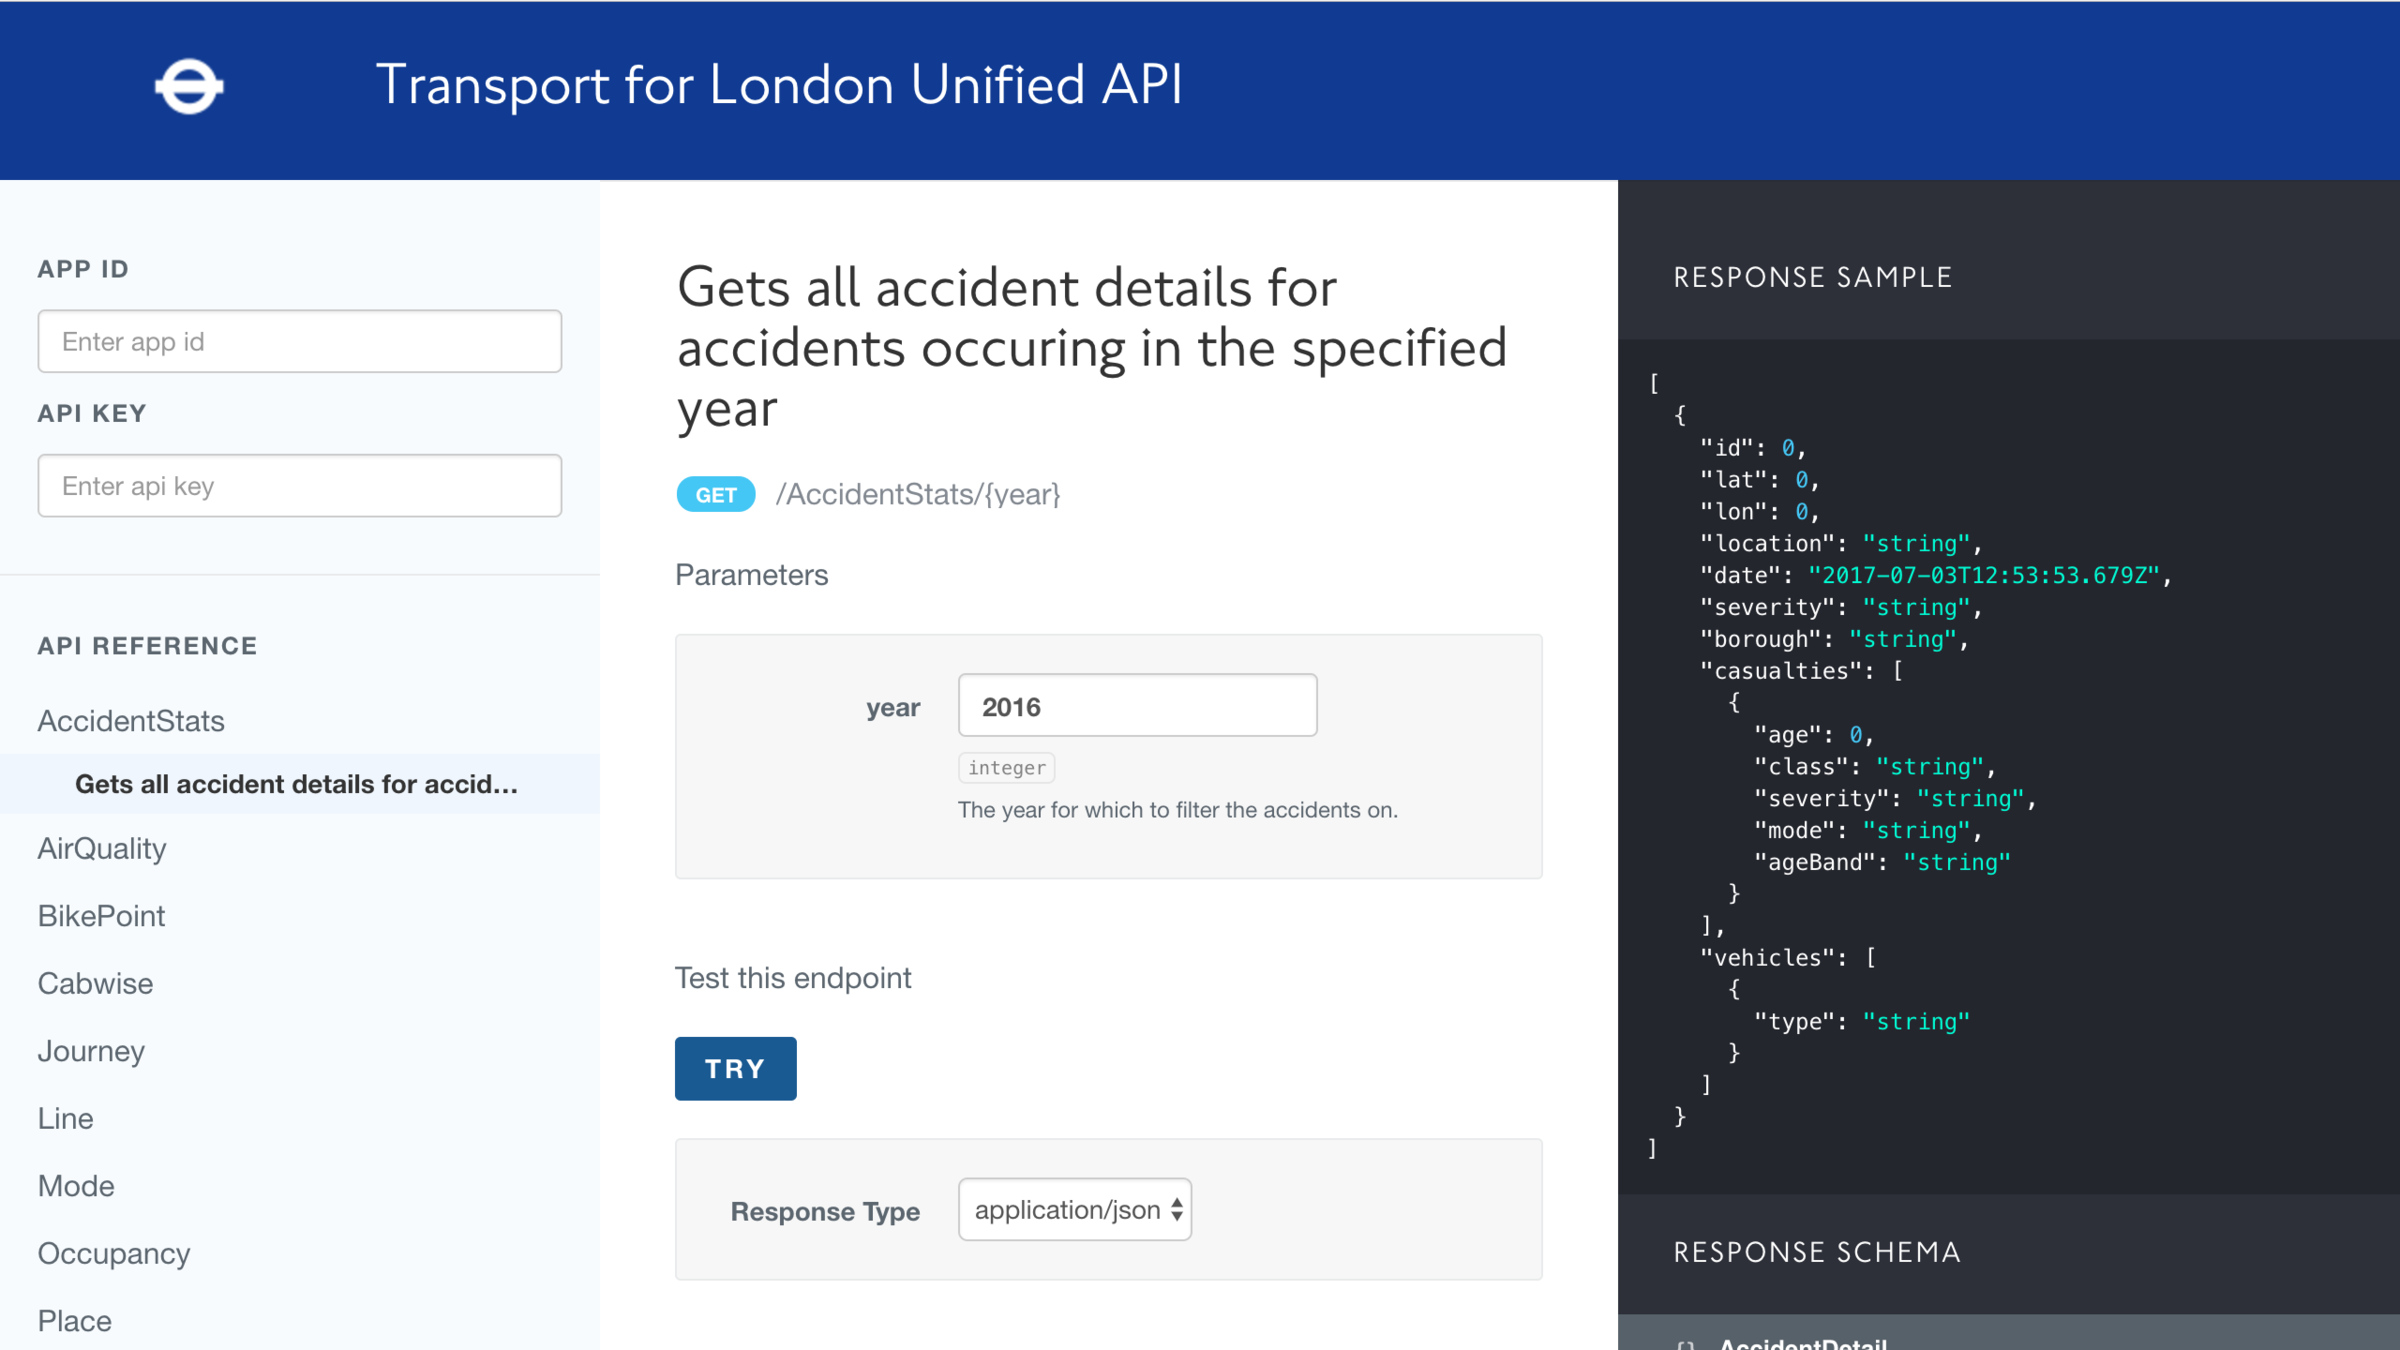
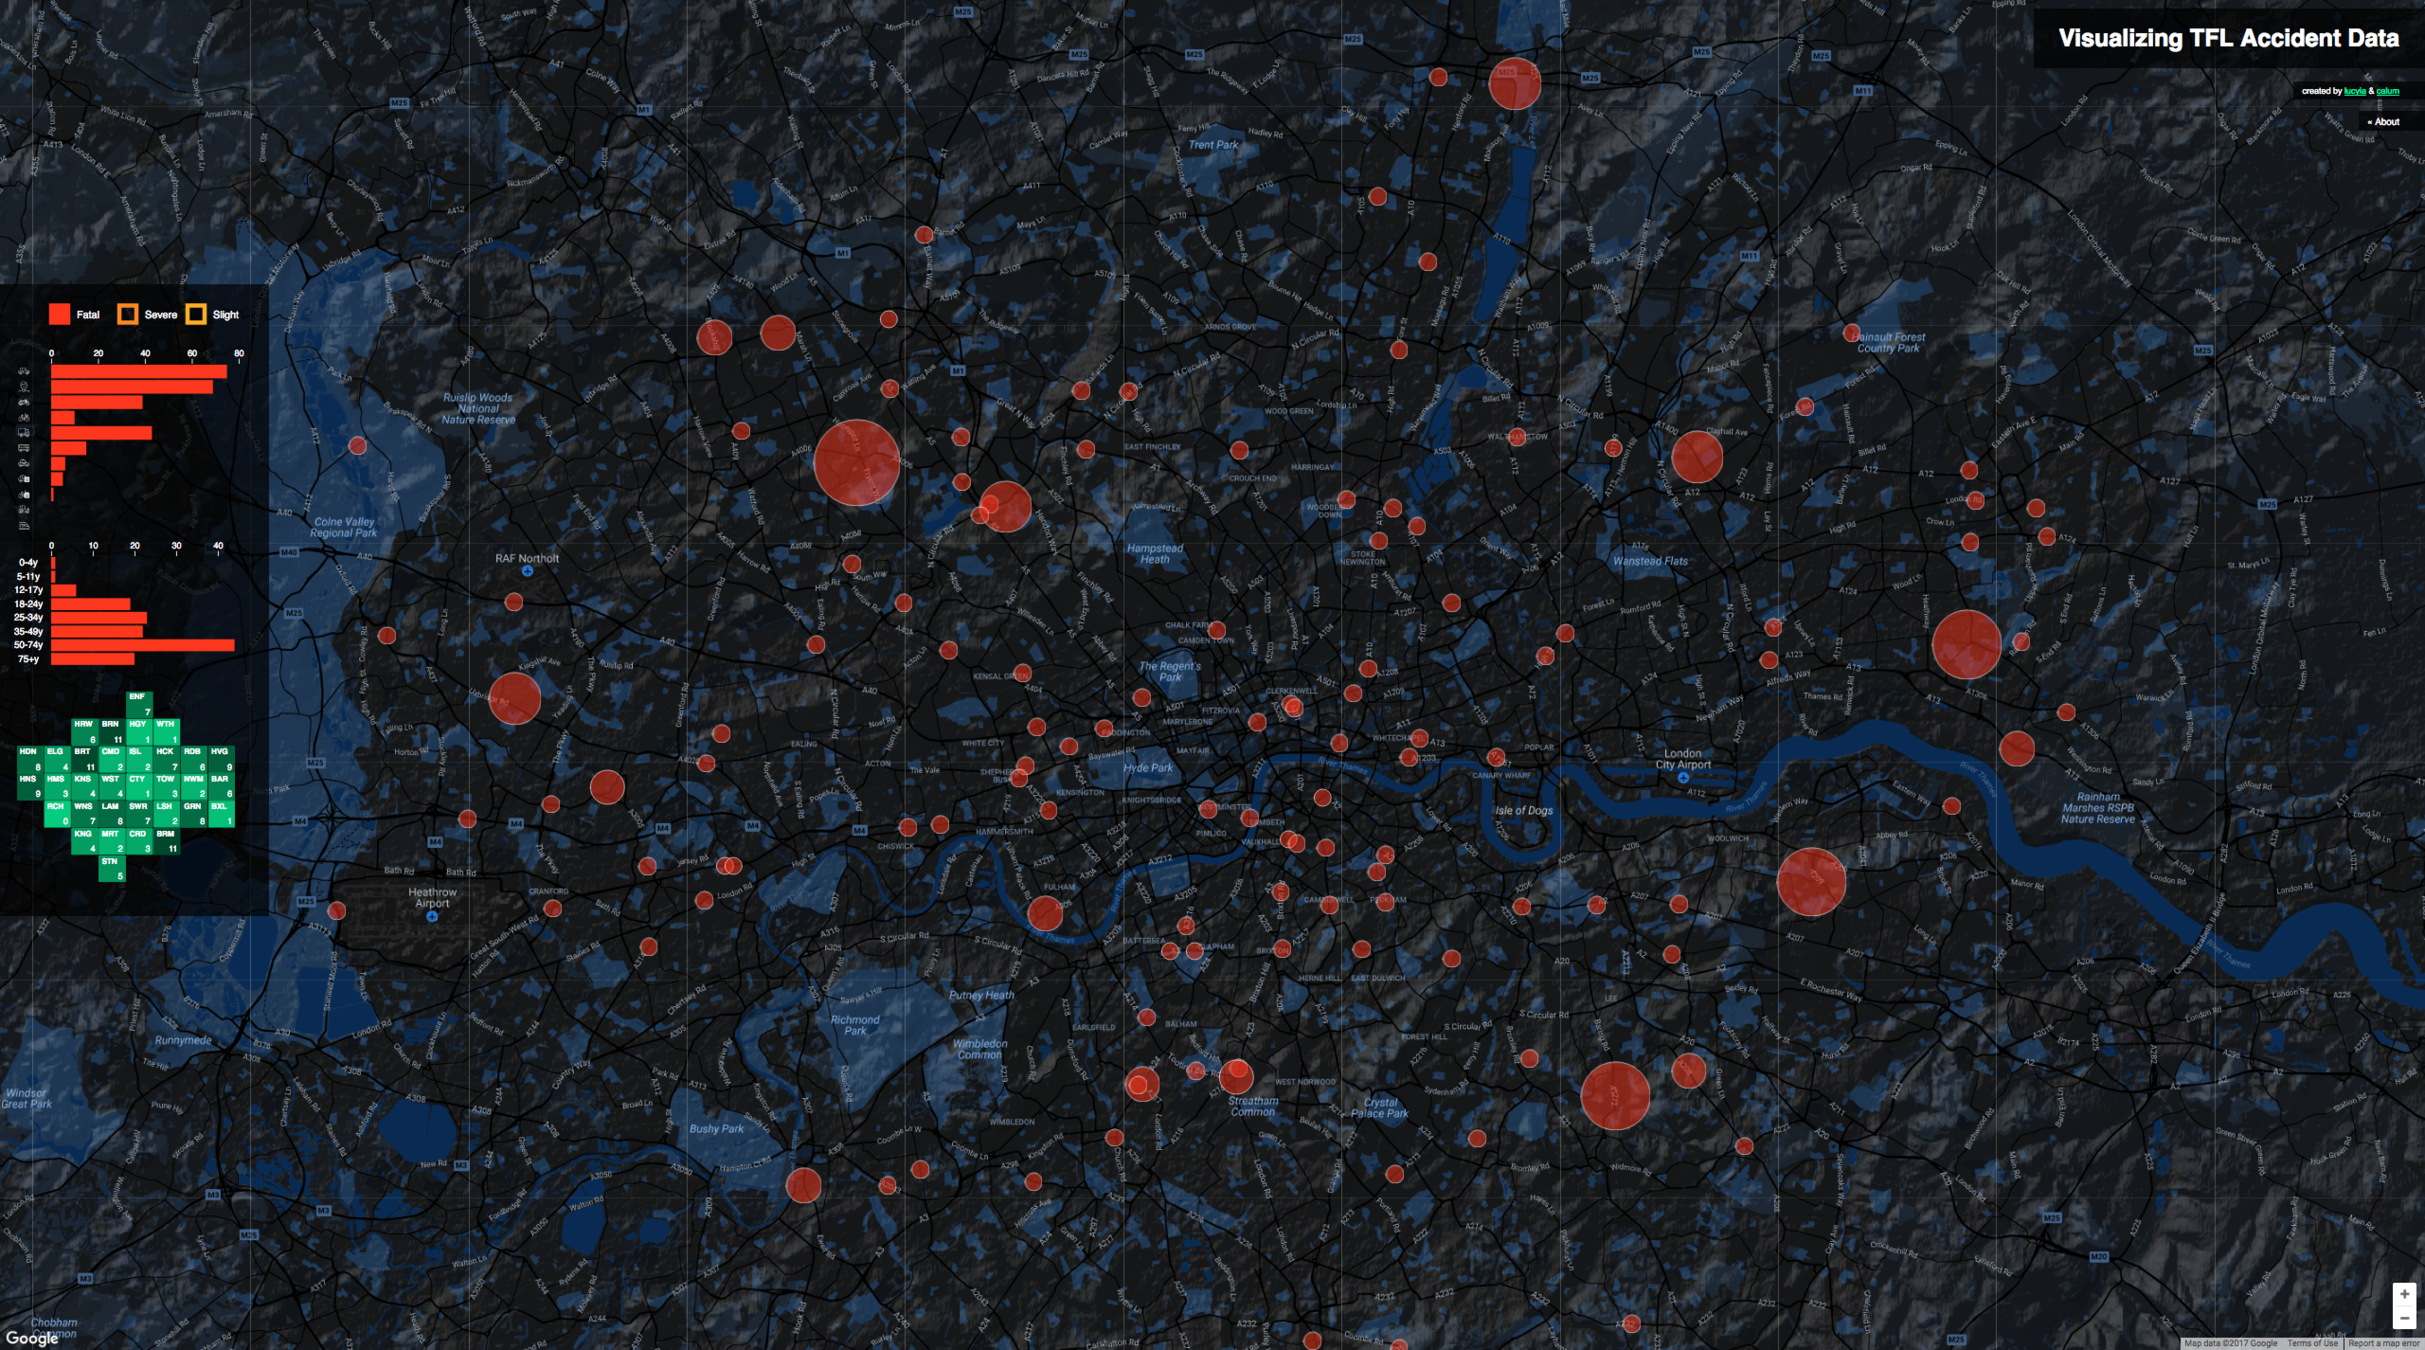
[ Fatal, Severe, Slight ]
[ Westminster, Camden, ... ]
"2017-07-05T10:03:35.692Z"
"Long Lane junction ..."
-0.101061
51.518929
693758
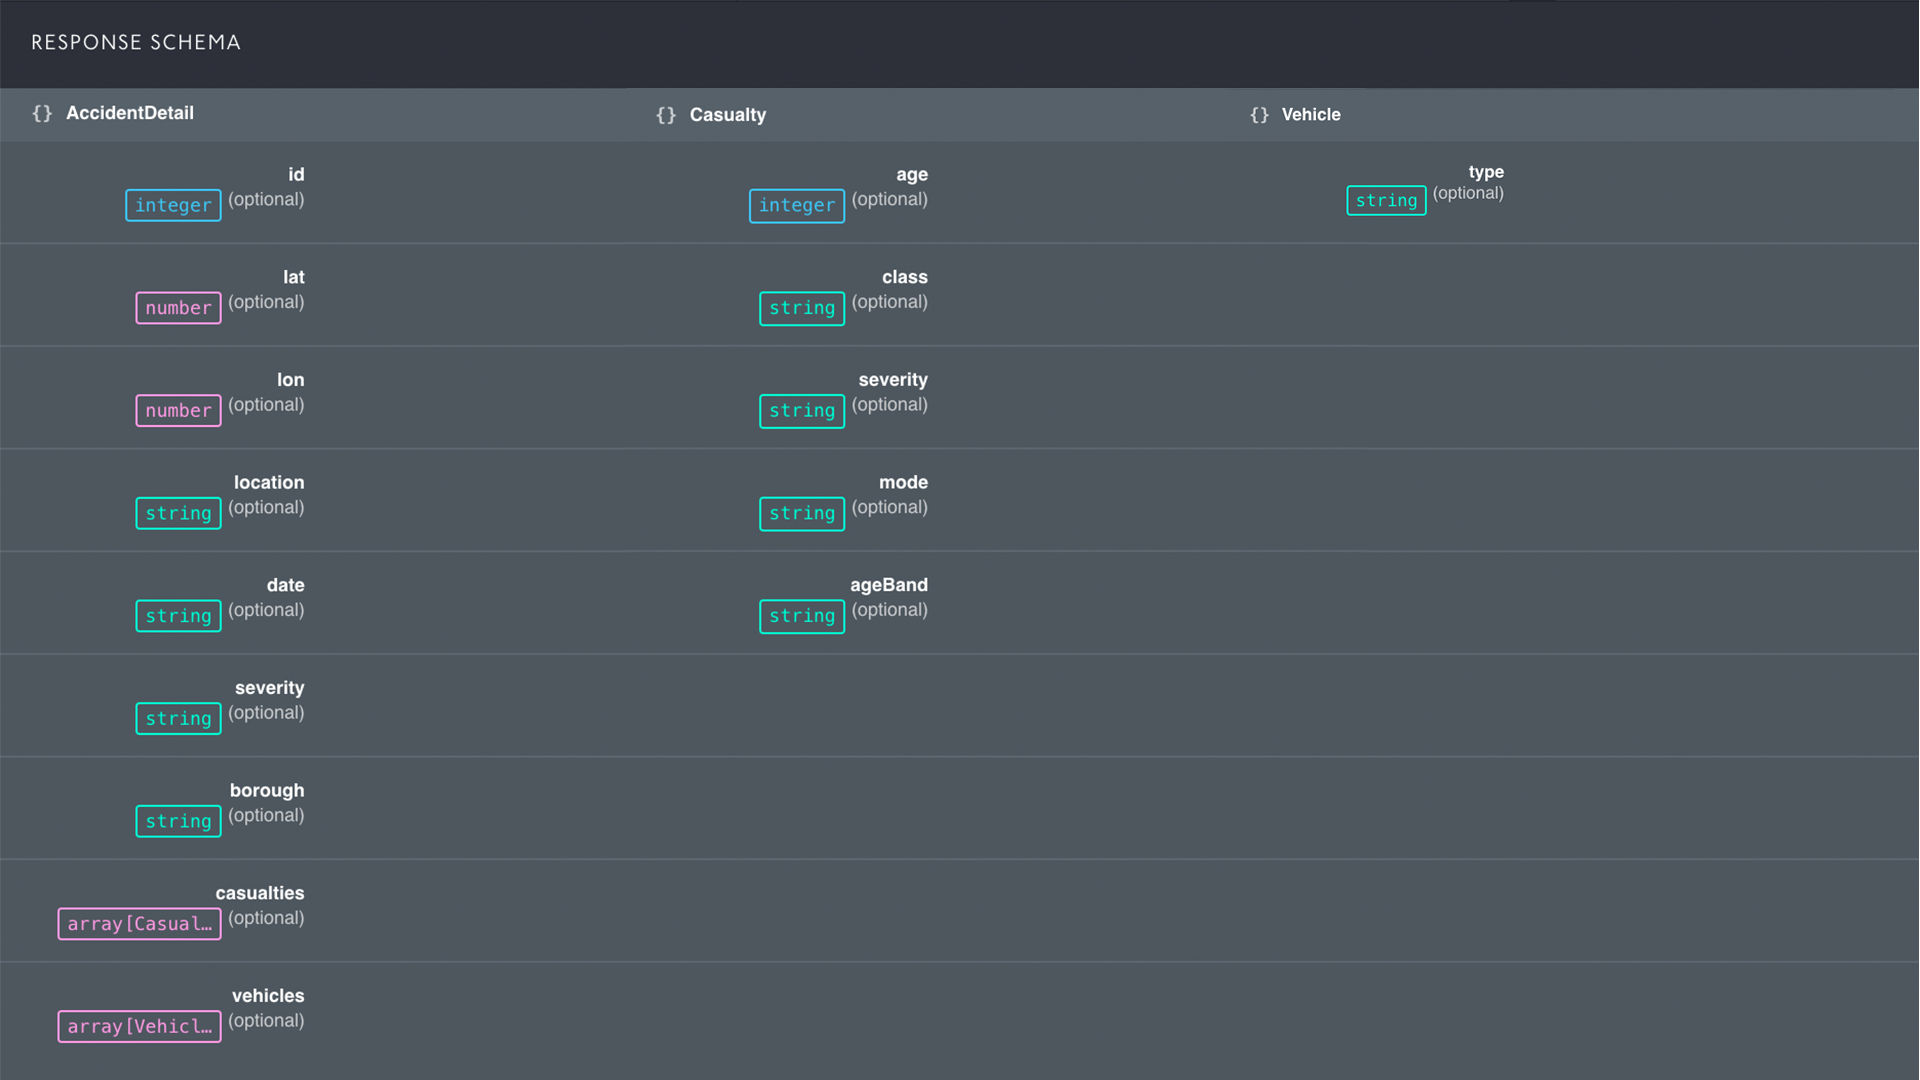
[ Adult, Child, Unknown ]
[ PedalCycle, Car, ... ]
[ Driver, Pedestrian, Passenger ]
[ Fatal, Severe, Slight ]
[ 0 ... 99 ]
[ PedalCycle, Car, ... ]
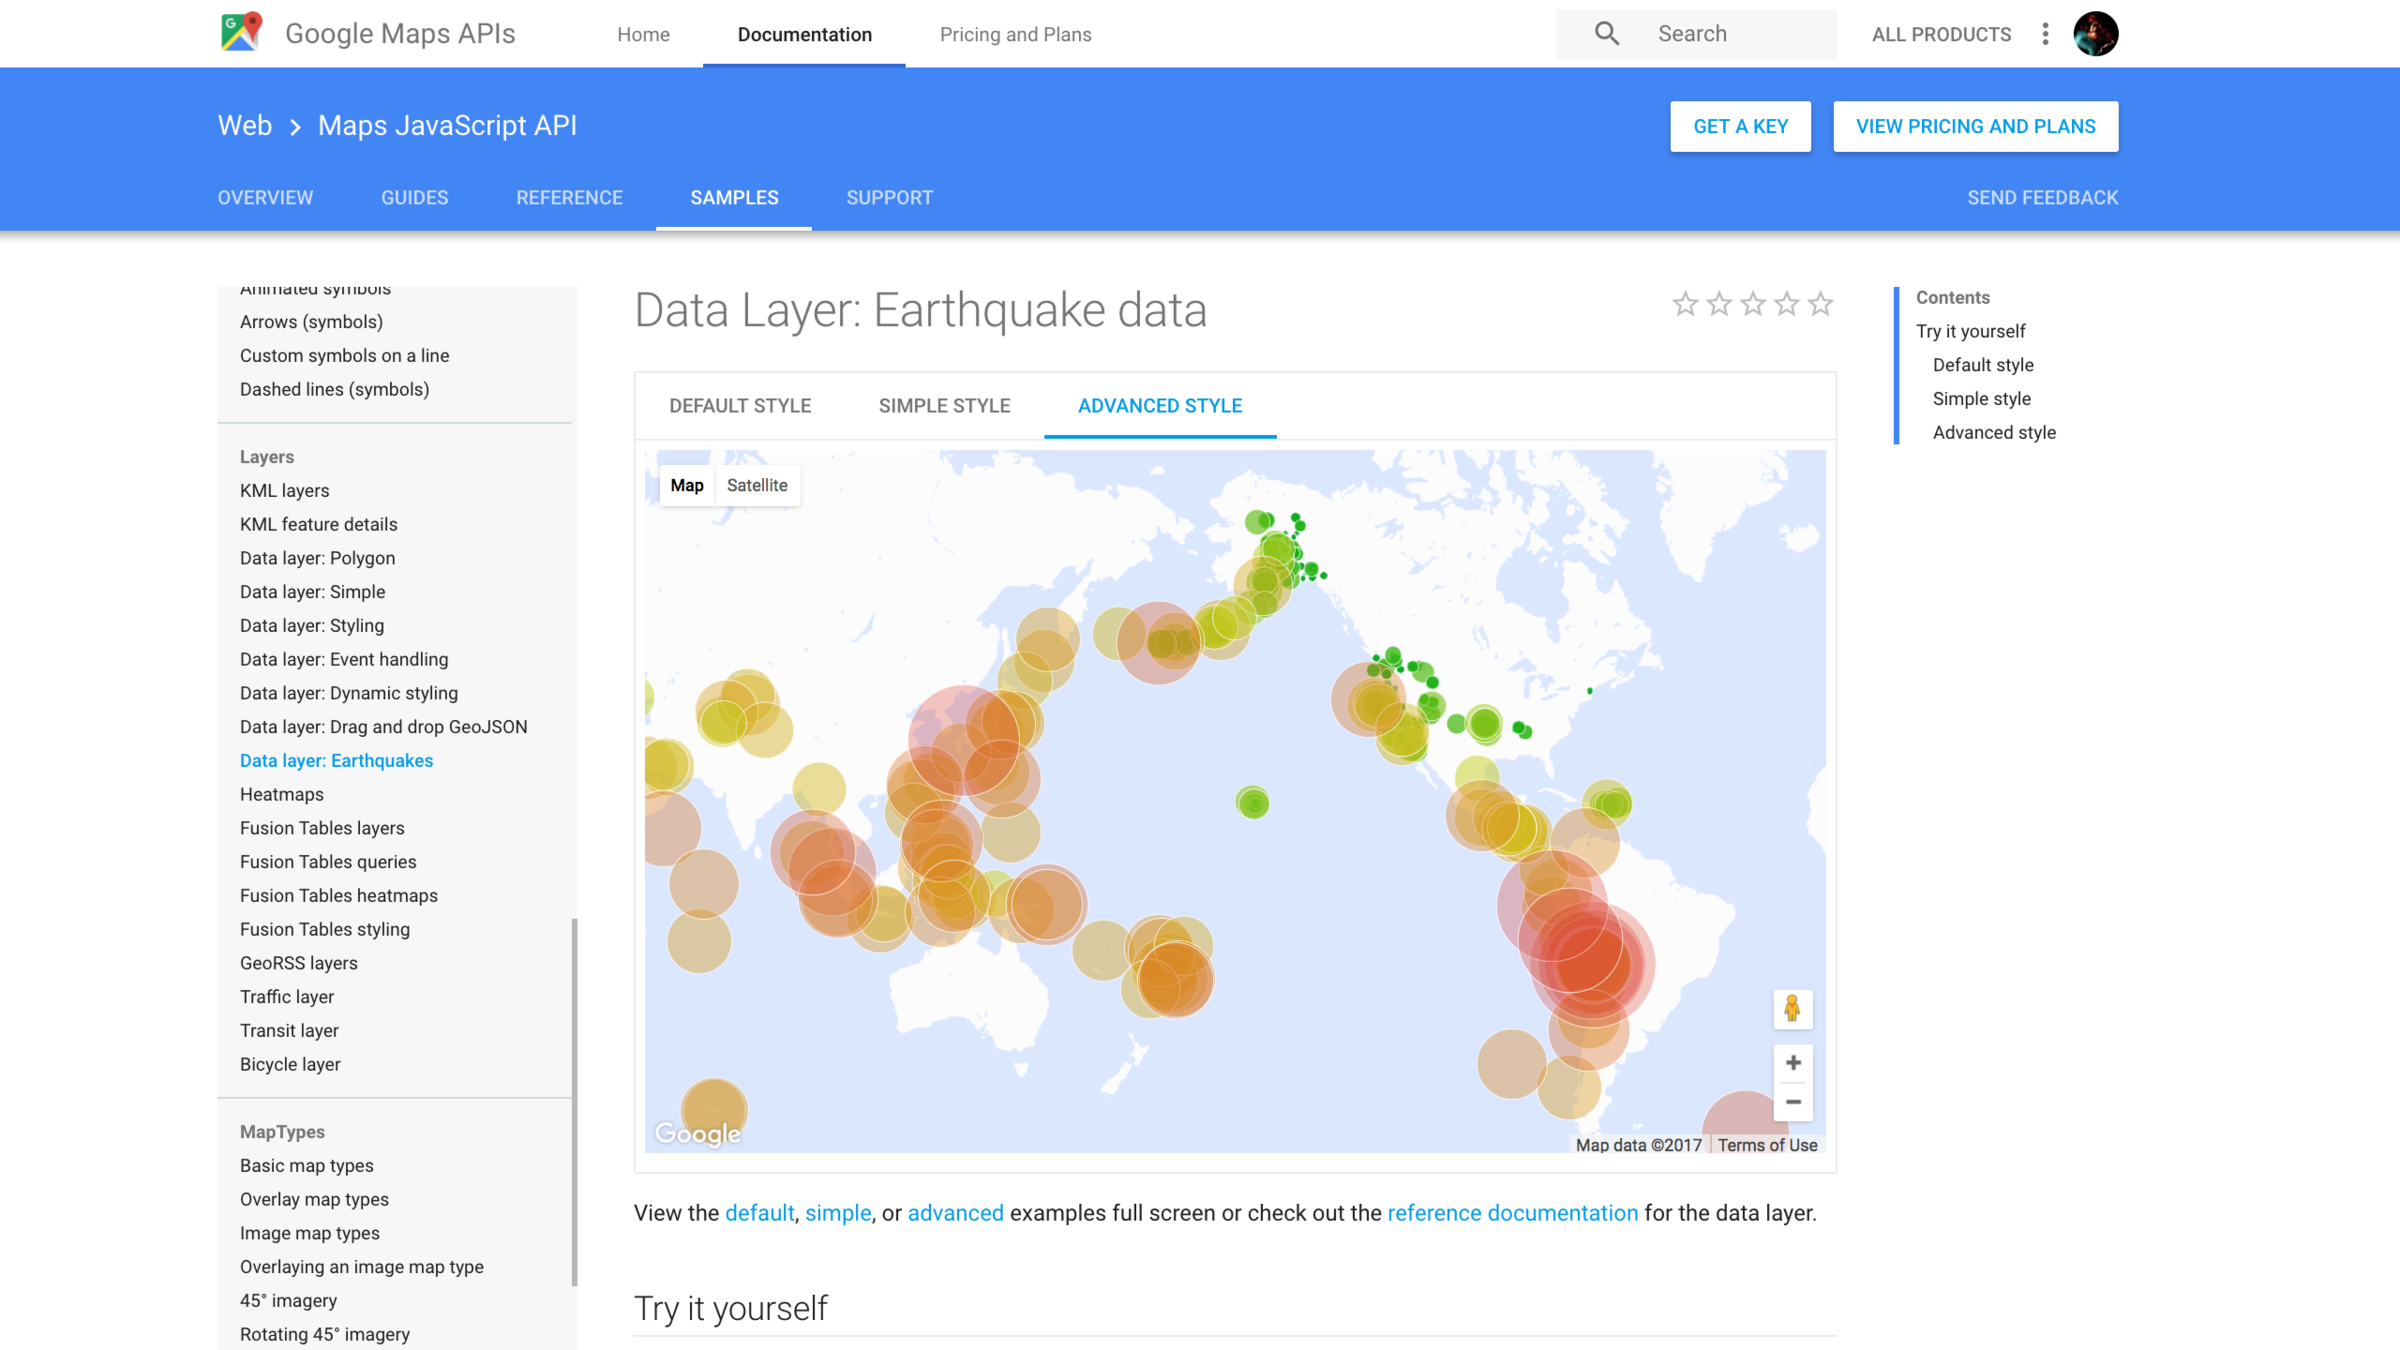
Google Maps + Canvas Layer + d3
Google Maps (+ Google Maps Data Layer) + d3
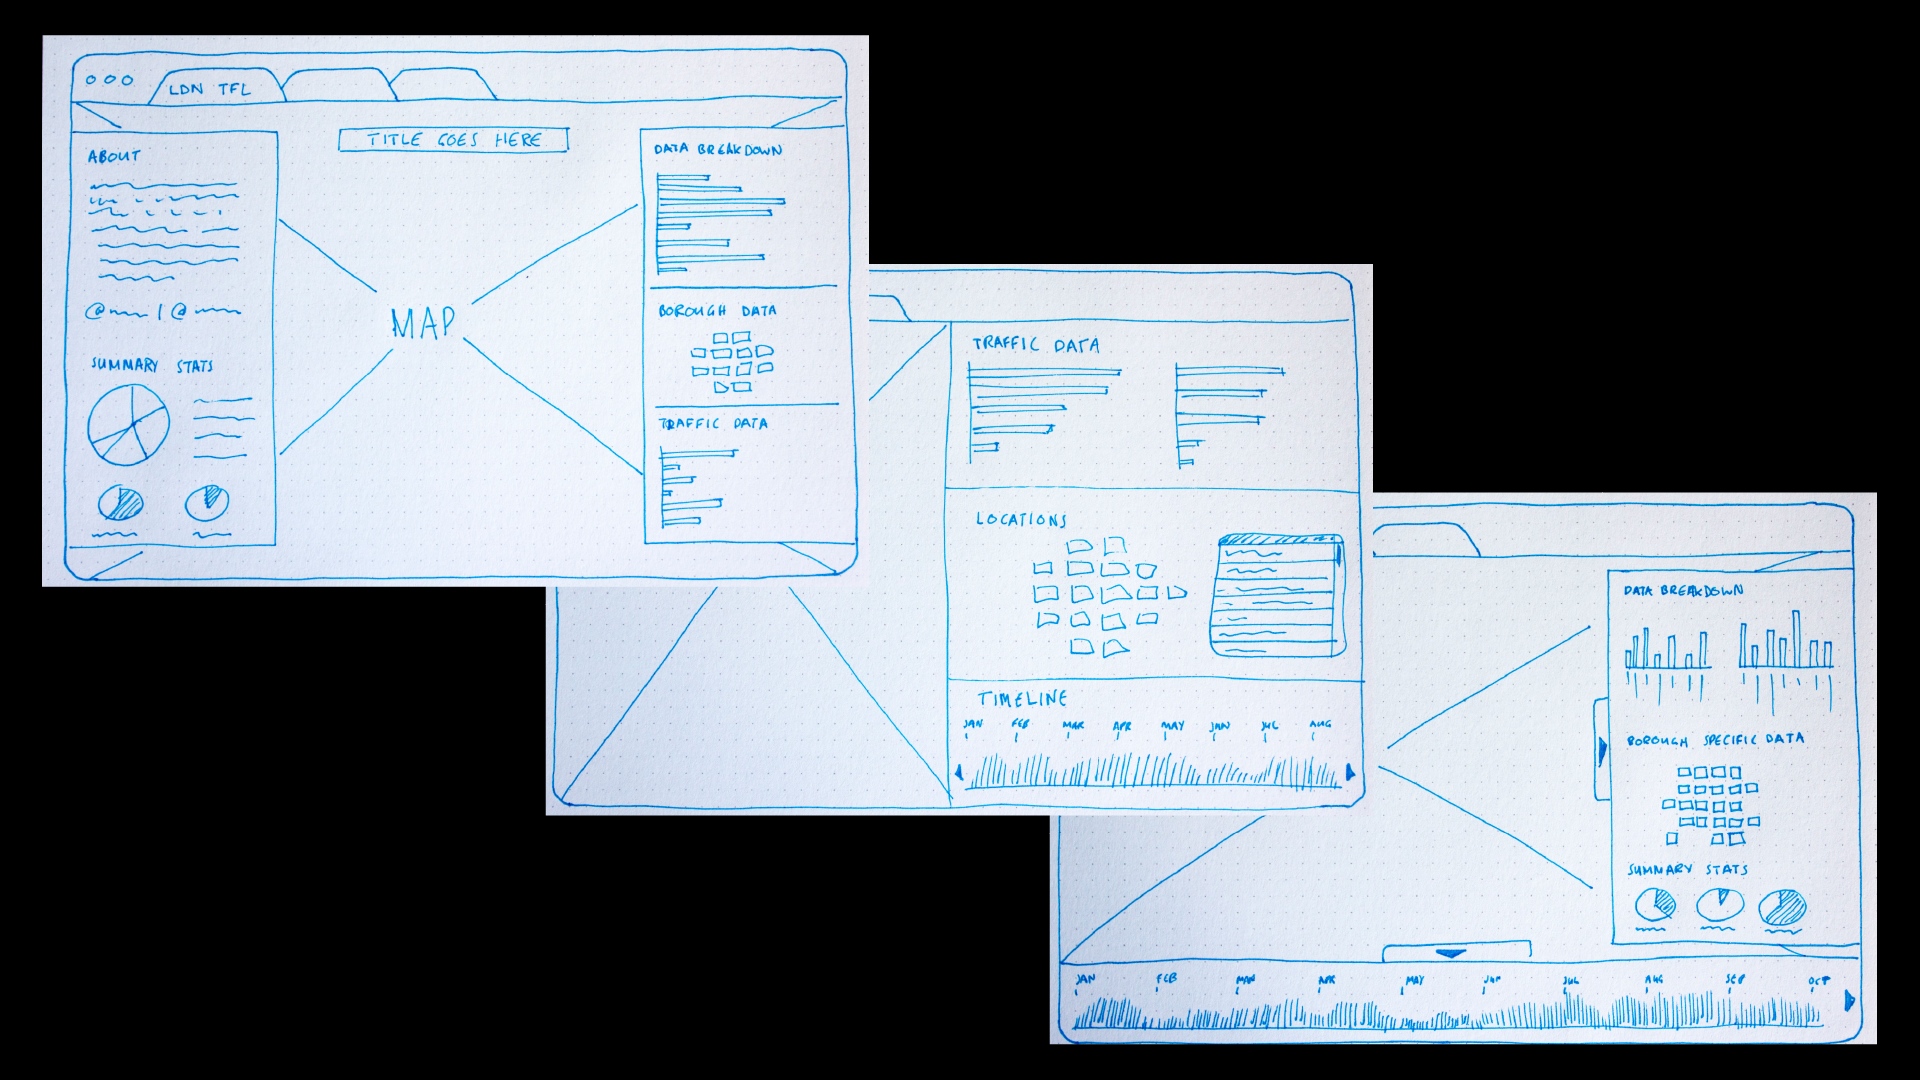
controls
& data viz
data points
map
controls
data points
map
SVG /
Canvas /
HTML / ...
SVG /
Canvas /
Data Map / ...
Map
layers
controls
data points
map
SVG /
Canvas /
HTML / ...
SVG /
Canvas /
Data Map / ...
Map
d3 /
JavaScript /
HTML / ...
d3 /
WebGL /
Data Layer / ...
Google Maps /
OpenStreetMap /
...
layers
tools
small dataset → D3 + SVG
large dataset → D3 + Canvas
custom map layers
Working with D3.js and Canvas: When and How by Irene Ros
By Lucia Kocincova
Talk at Map Design Tools | British Cartographic Society
