


Macklin Hartley
I help top-notch organisations by bringing together crystal-clear objectives, a culture of support, streamlined operations, and adaptable technology.
Macklin Hartley
https://macklin.me
⬛ User-Centric Performance
⬛ Capture Metrics from End User Devices
⬛ Continuous Monitoring
❌ Web Performance Improvement
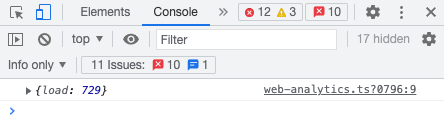
const start = Date.now();

window.addEventListener('load', () => {
  console.log({ load: Date.now() - start });
});https://www.w3.org/TR/navigation-timing-2/
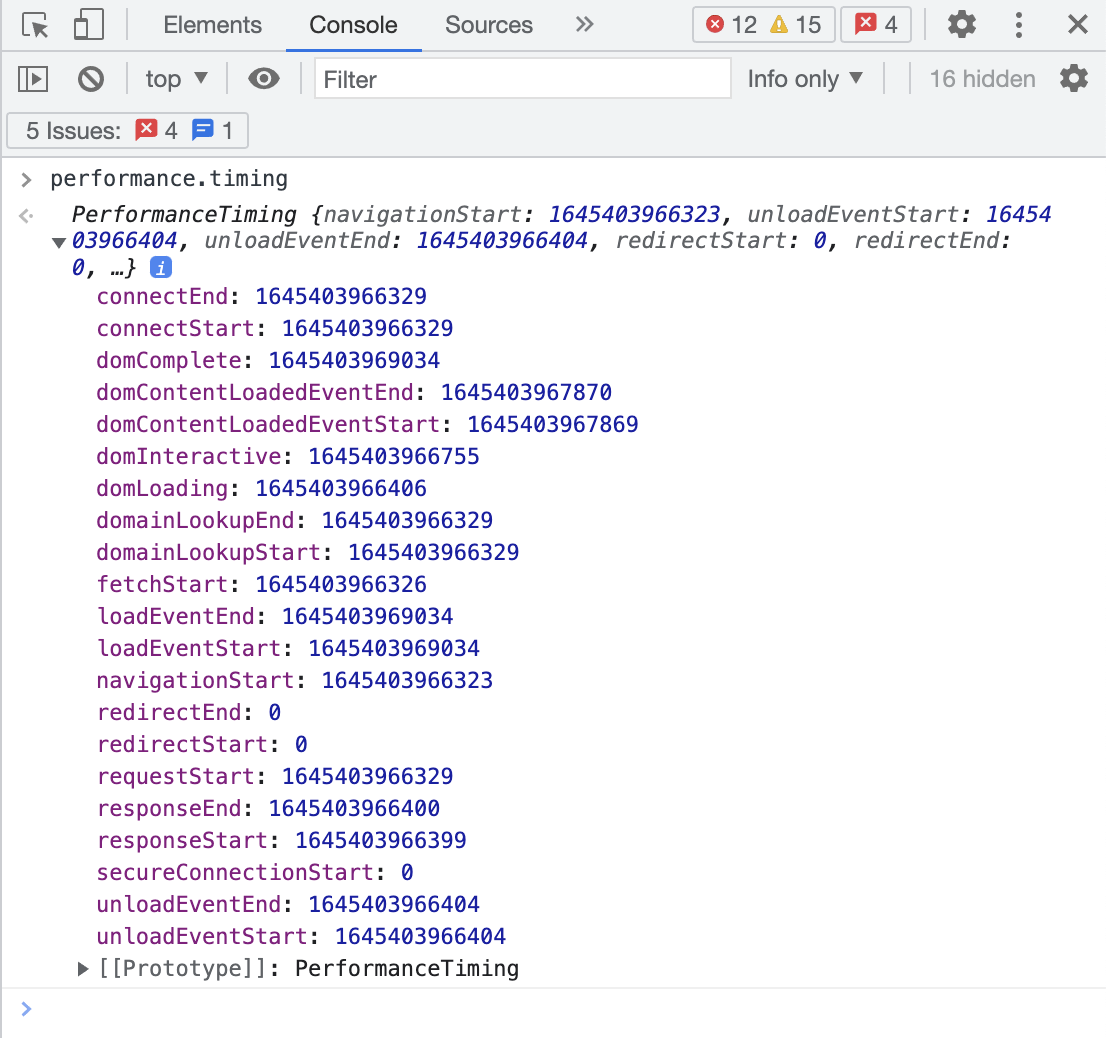
window.performance.timingAdobe
Airbnb Inc
Akamai Technologies
Alibaba Group
Apple, Inc.
Baidu, Inc.
BBC
Cloudflare
Fastly
Google LLC
Microsoft Corporation
Mozilla Foundation
Salesforce
Shopify
The New York Times
Wikimedia Foundation
https://web.dev/user-centric-performance-metrics/
https://web.dev/user-centric-performance-metrics/
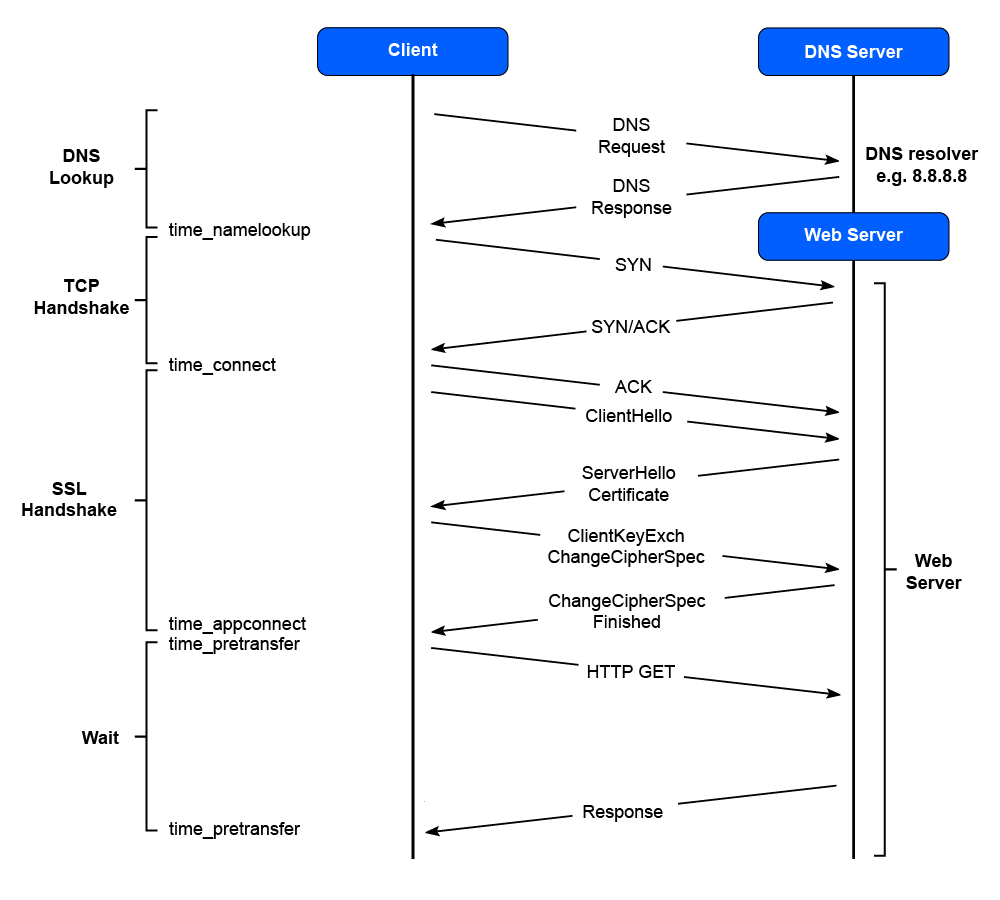
TTFB
Time to First Byte
FCP
First Contentful Paint
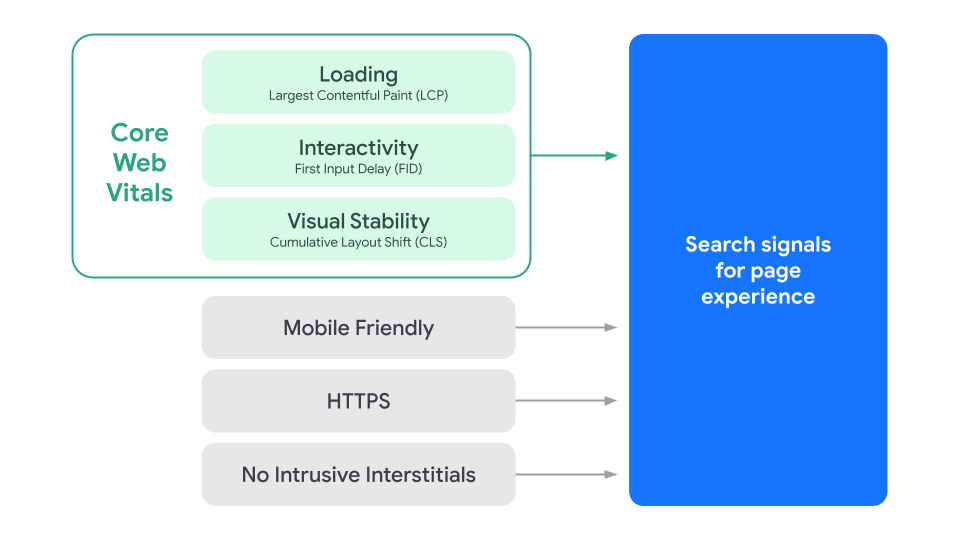
LCP
Last Contentful Paint
FID
First Input Delay
INP
Interaction to Next Paint
CLS
Cumulative Layout Shift
https://developer.mozilla.org/en-US/docs/Glossary/time_to_first_byte
the time between the browser requesting a page and when it receives the first byte of information from the server.
TTFB
Time to First Byte
https://www.mindspun.com/blog/time-to-first-byte-ttfb/
TTFB
Time to First Byte
GOOD
POOR
NEEDS
IMPROVEMENT
800ms
1.8s
https://web.dev/ttfb/
TTFB
Time to First Byte
https://web.dev/fcp/
the time from when the page starts loading to when any part of the page's content is rendered on the screen...
FCP
First Contentful Paint
https://macklin.me/7-useful-tools-for-monitoring-web-performance-user-experience
FCP
First Contentful Paint
GOOD
POOR
NEEDS
IMPROVEMENT
1.8 sec
3.0 sec
https://web.dev/fcp/
FCP
First Contentful Paint
https://calibreapp.com/blog/largest-contentful-paint
...tracks how many seconds it takes for your page’s most data-intensive, above-the-fold element to load.
LCP
Largest Contentful Paint
https://macklin.me/7-useful-tools-for-monitoring-web-performance-user-experience
LCP
Largest Contentful Paint
GOOD
POOR
NEEDS
IMPROVEMENT
2.5 sec
4.0 sec
https://web.dev/lcp/
LCP
Largest Contentful Paint
https://web.dev/fid/
the time from when a user first interacts with a page[...] to the time when the browser is actually able to begin processing event handlers...
FID
First Input Delay
https://requestmetrics.com/web-performance/first-input-delay
FID
First Input Delay
GOOD
POOR
NEEDS
IMPROVEMENT
100ms
300ms
https://web.dev/fid/
FID
First Input Delay
https://web.dev/inp/
...represents a page's overall responsiveness by measuring all click, tap, and keyboard interactions made with a page.
INP
Interaction to Next Paint
https://web.dev/inp/
INP
Interaction to Next Paint
GOOD
POOR
NEEDS
IMPROVEMENT
200ms
500ms
https://web.dev/inp/
INP
Interaction to Next Paint
https://web.dev/cls/
[a calculated score] for every unexpected layout shift that occurs during the entire lifespan of a page...
CLS
Cumulative Layout Shift
https://macklin.me/7-useful-tools-for-monitoring-web-performance-user-experience
CLS
Cumulative Layout Shift
CLS
Cumulative Layout Shift
GOOD
POOR
NEEDS
IMPROVEMENT
0.1
0.25
https://web.dev/cls/
CLS
Cumulative Layout Shift
https://developers.google.com/search/blog/2020/11/timing-for-page-experience
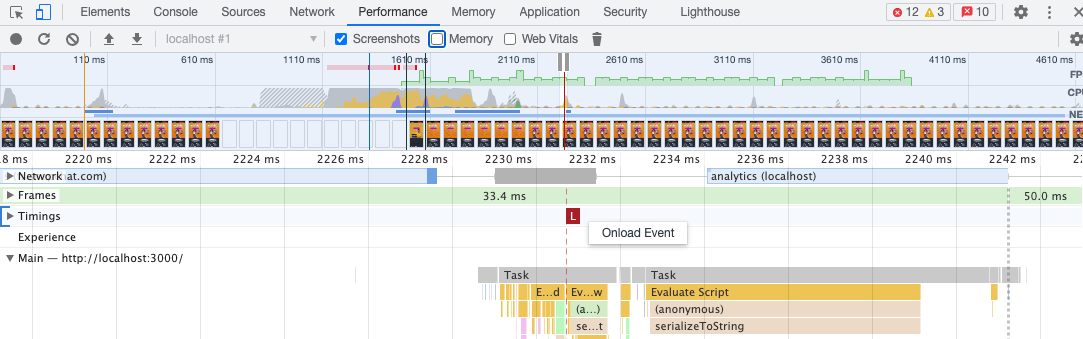
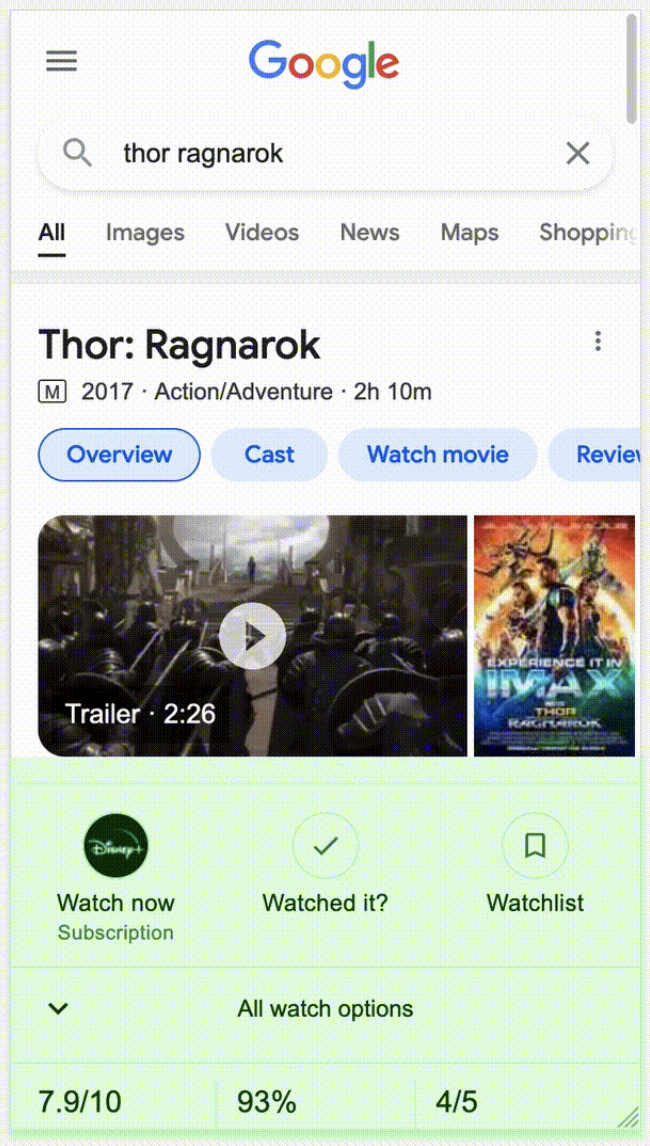
TTFB ≈ 290ms
FCP ≈ 500ms
LCP ≈ 1.625 sec
https://csswizardry.com/2022/08/measure-what-you-impact-not-what-you-influence/
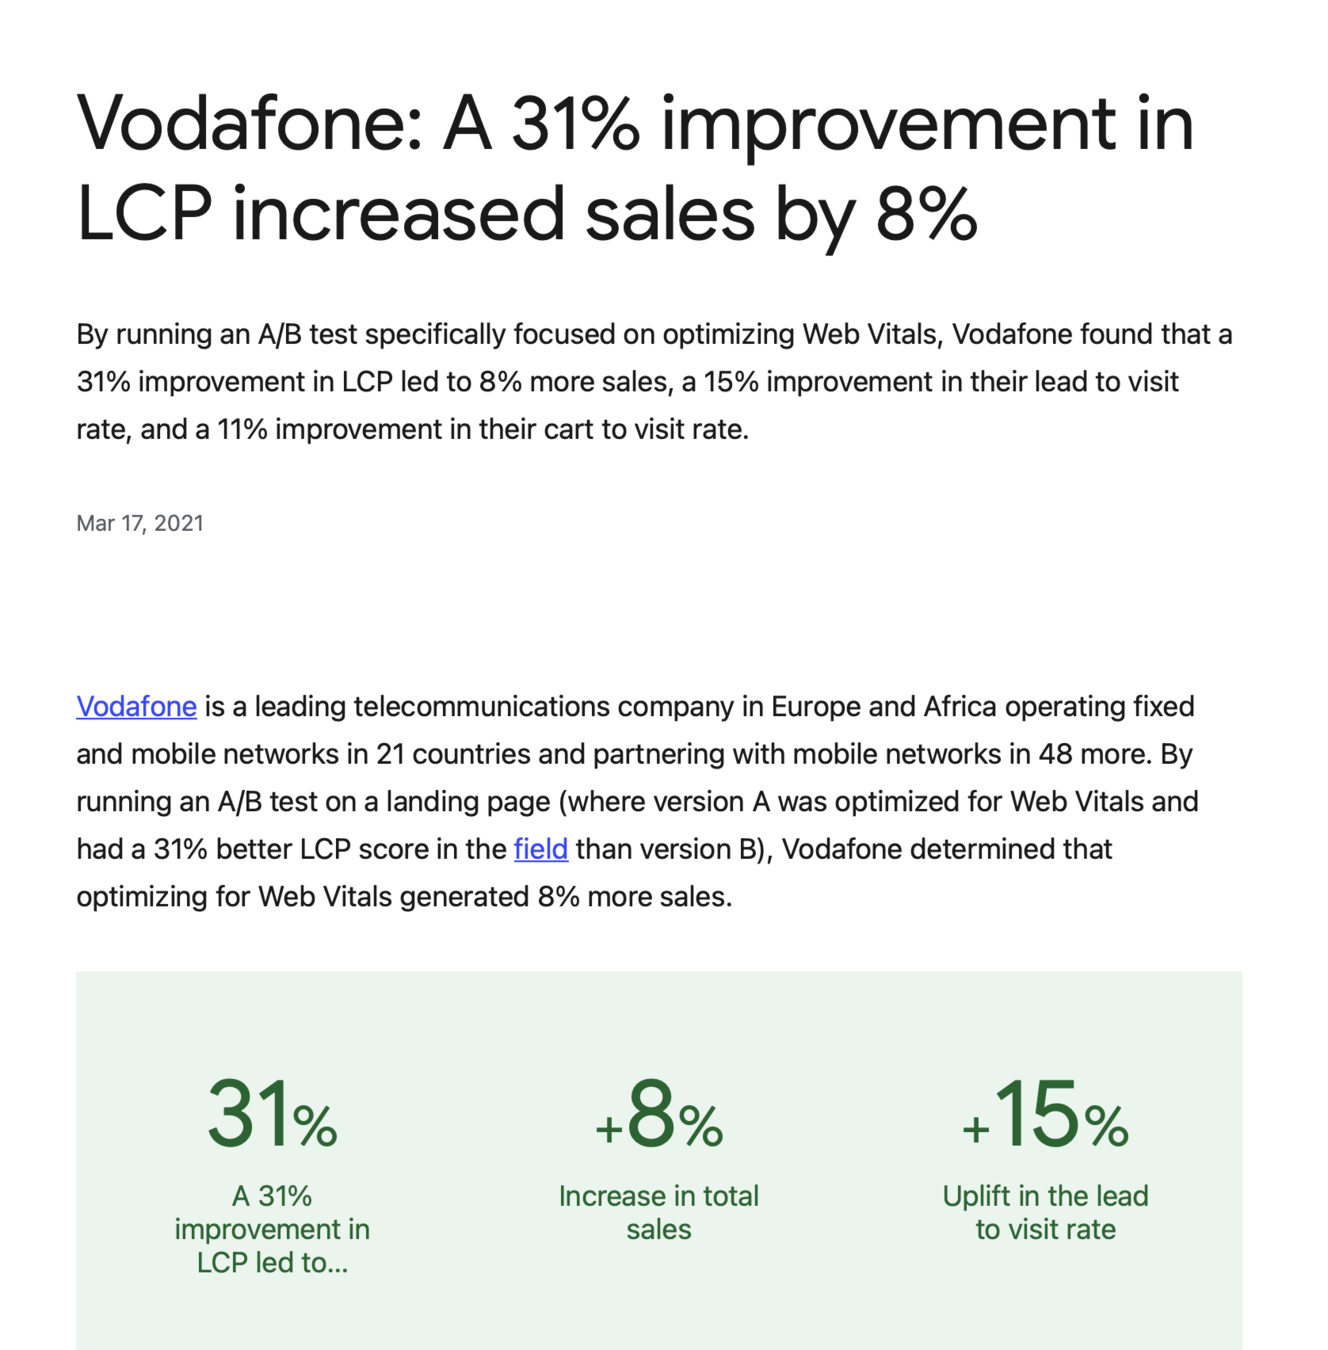
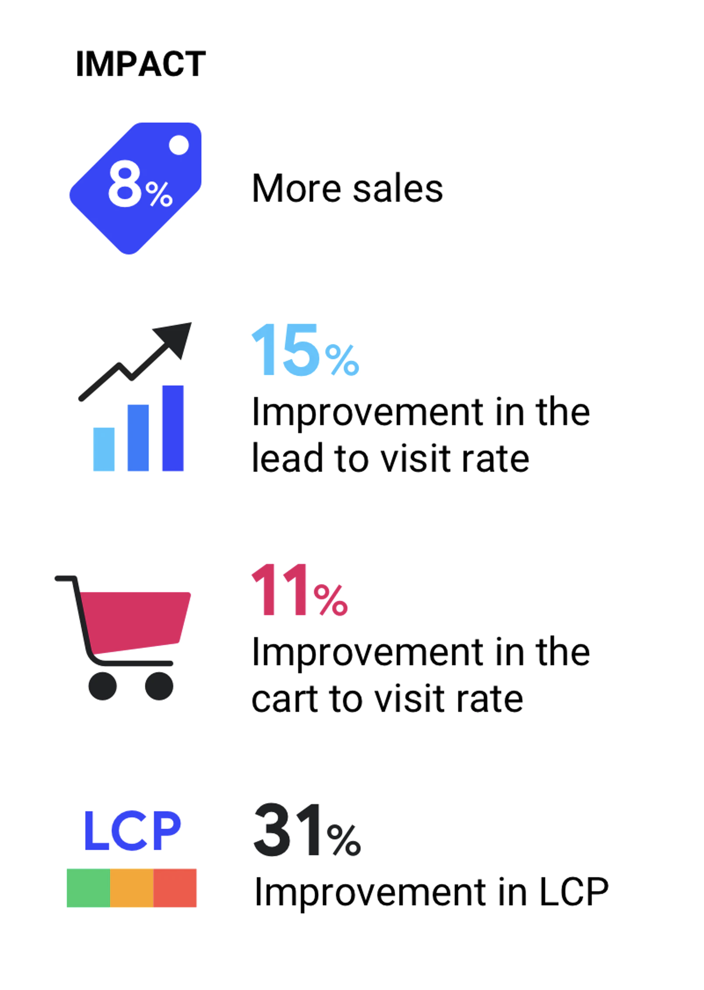
https://web.dev/vodafone/
✅ User-Centric Performance
⬛ Capture Metrics from End User Devices
⬛ Continuous Monitoring
Ad-hoc Testing
Synthetic Monitoring
Real User Monitoring (RUM)
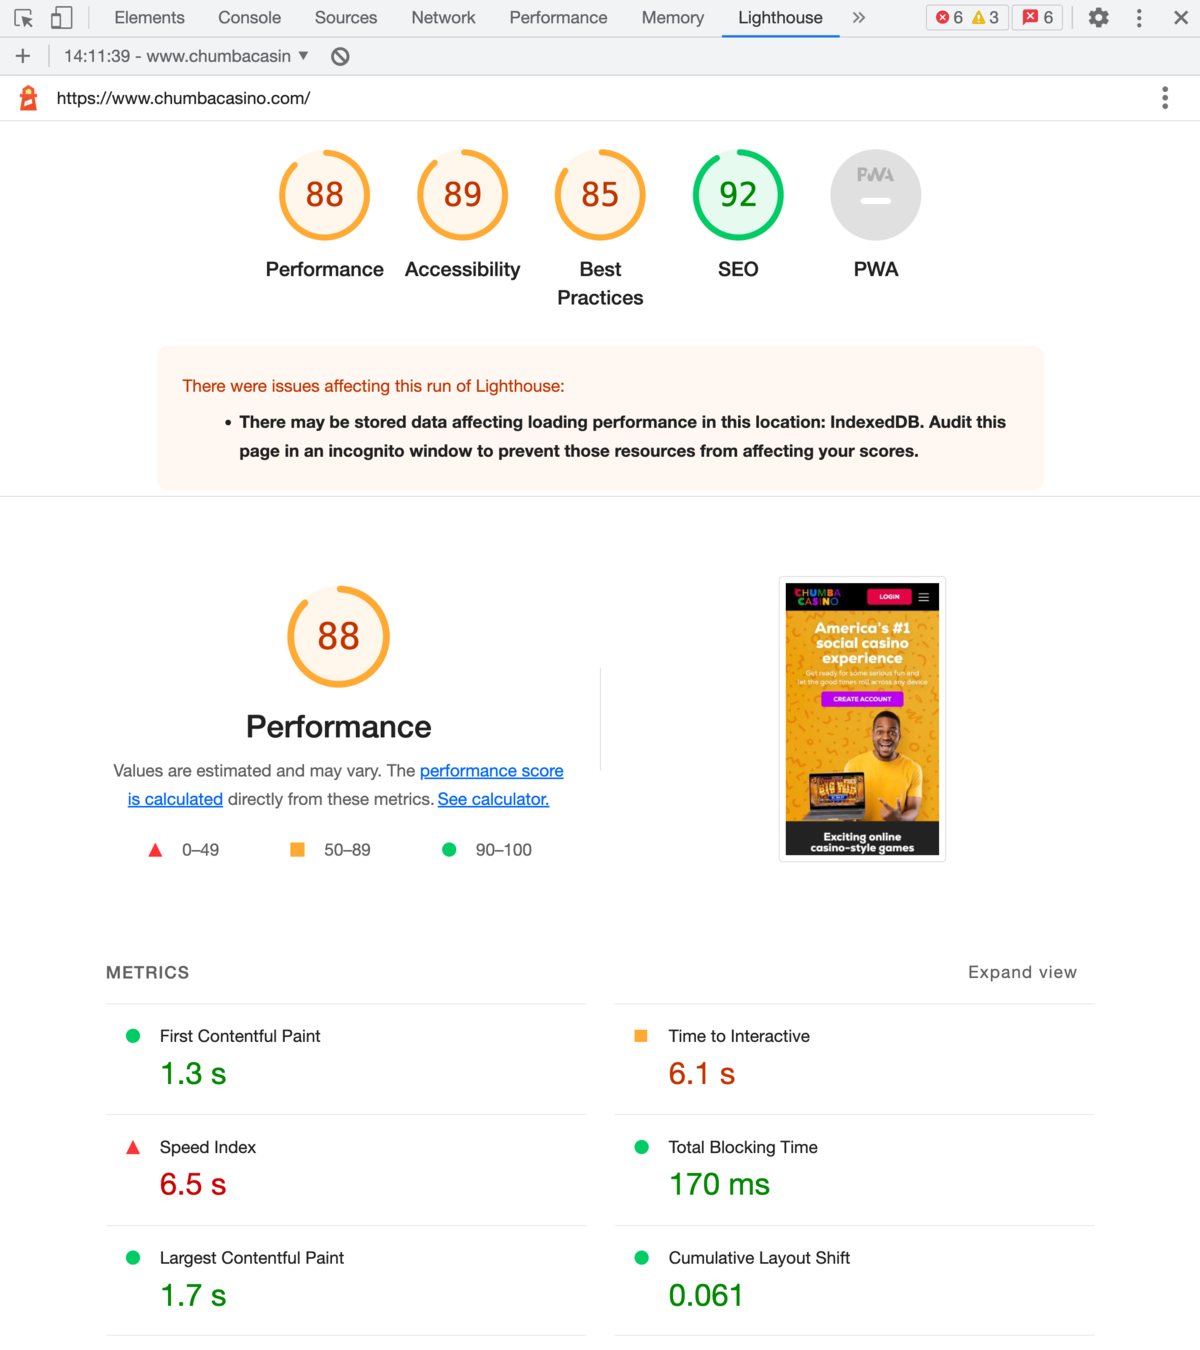
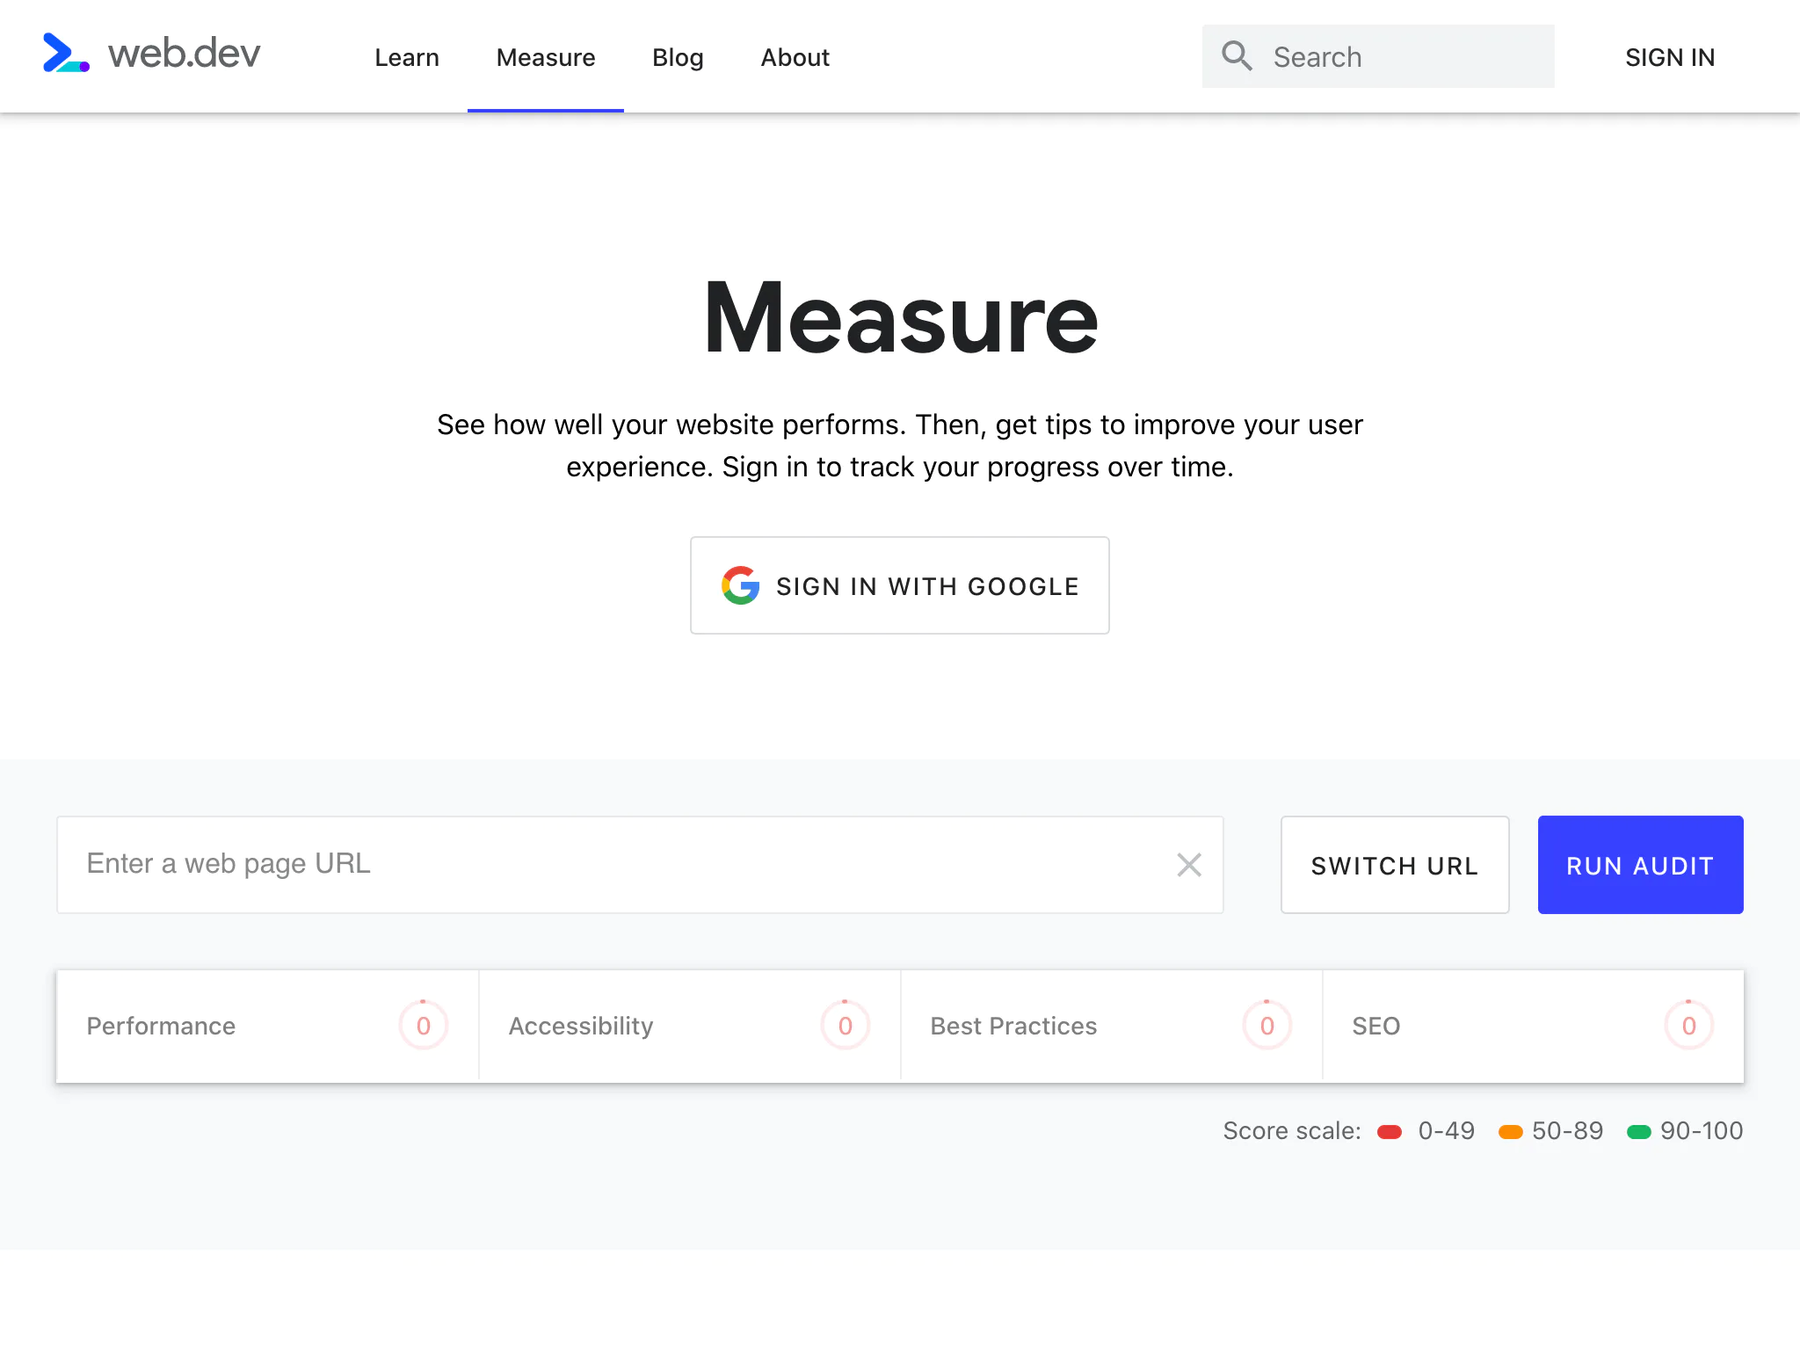
Lighthouse for
Google Chrome
web.dev/measure
👍 Free, no setup required
👎 Once-off, manual tests only
👎 Unlikely to represent real world traffic
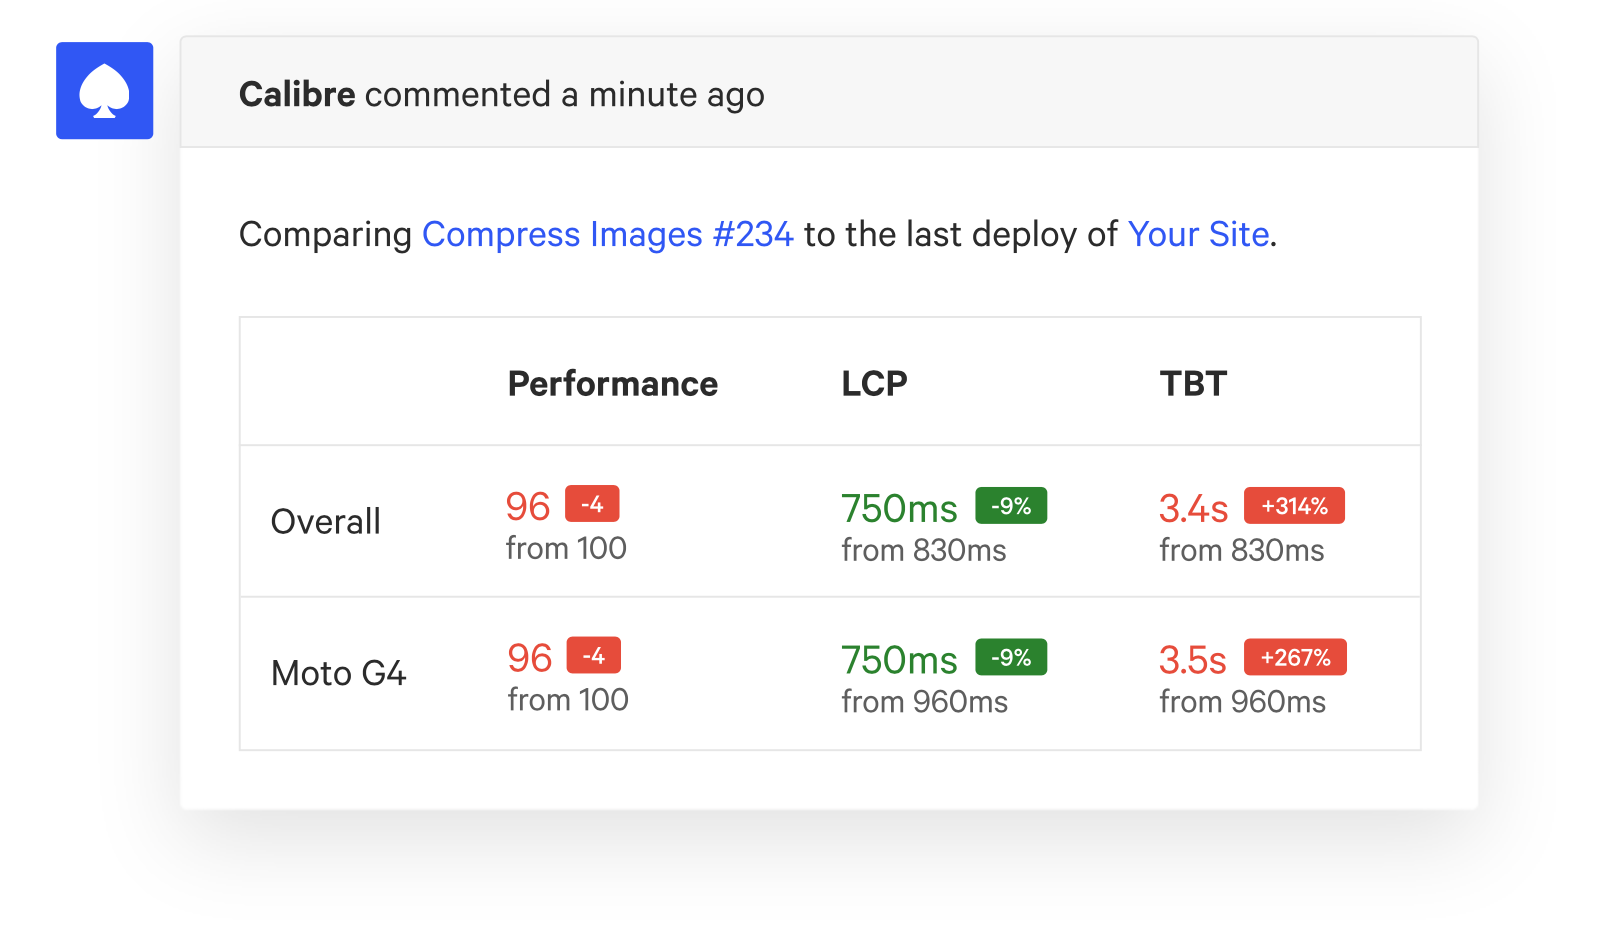
Calibre
https://calibreapp.com/features/pull-request-reviews
👍 CI/CD + scheduled automation
👍 Monitor change over time
👎 Not free, although competitively priced
👎 Still not representative of real world traffic
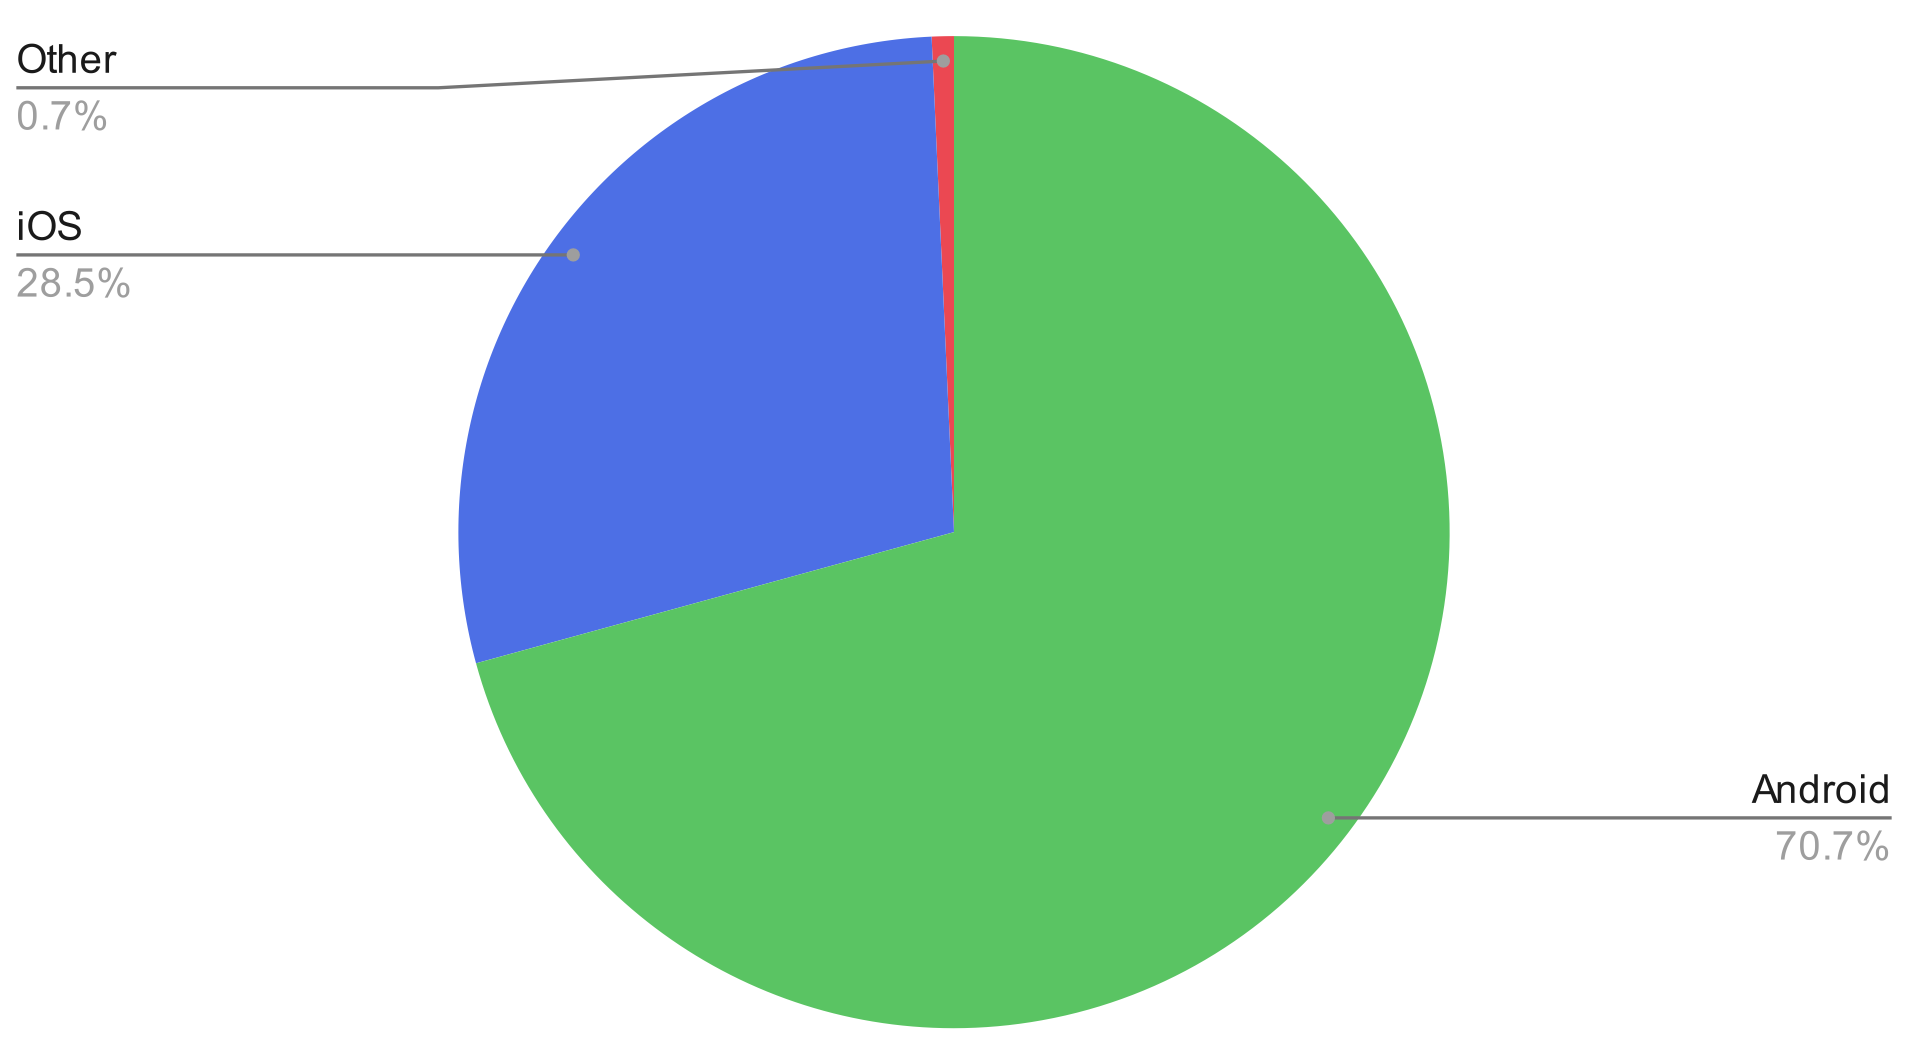
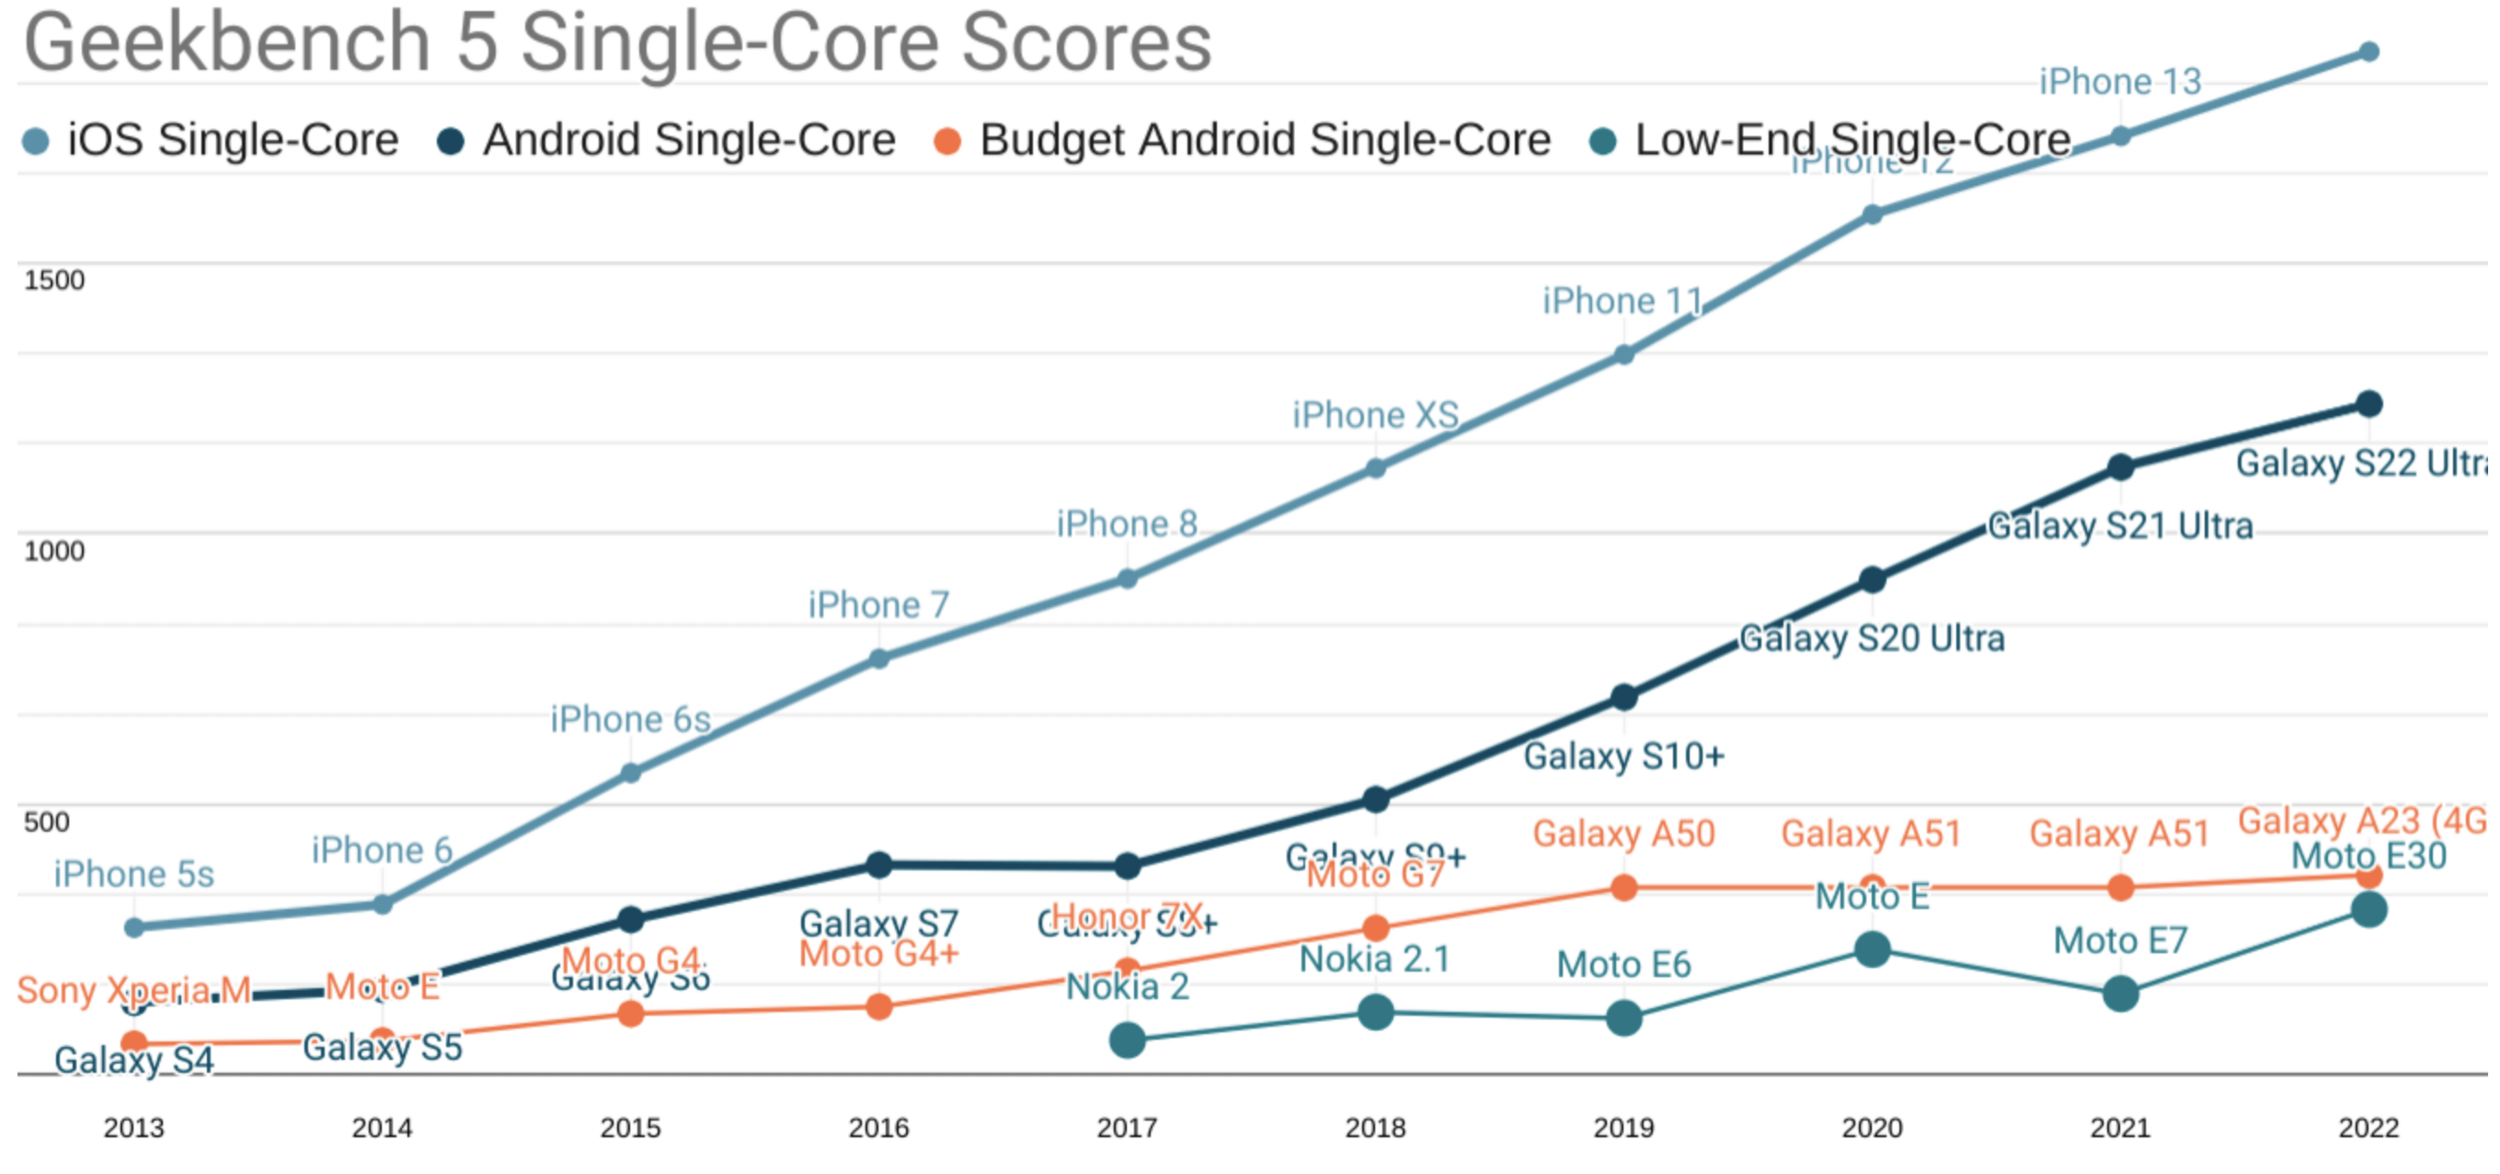
https://engineering.linecorp.com/en/blog/the-baseline-for-web-development-in-2022
Low End Device
Motorola Moto E30
800%
https://infrequently.org/2022/12/performance-baseline-2023/
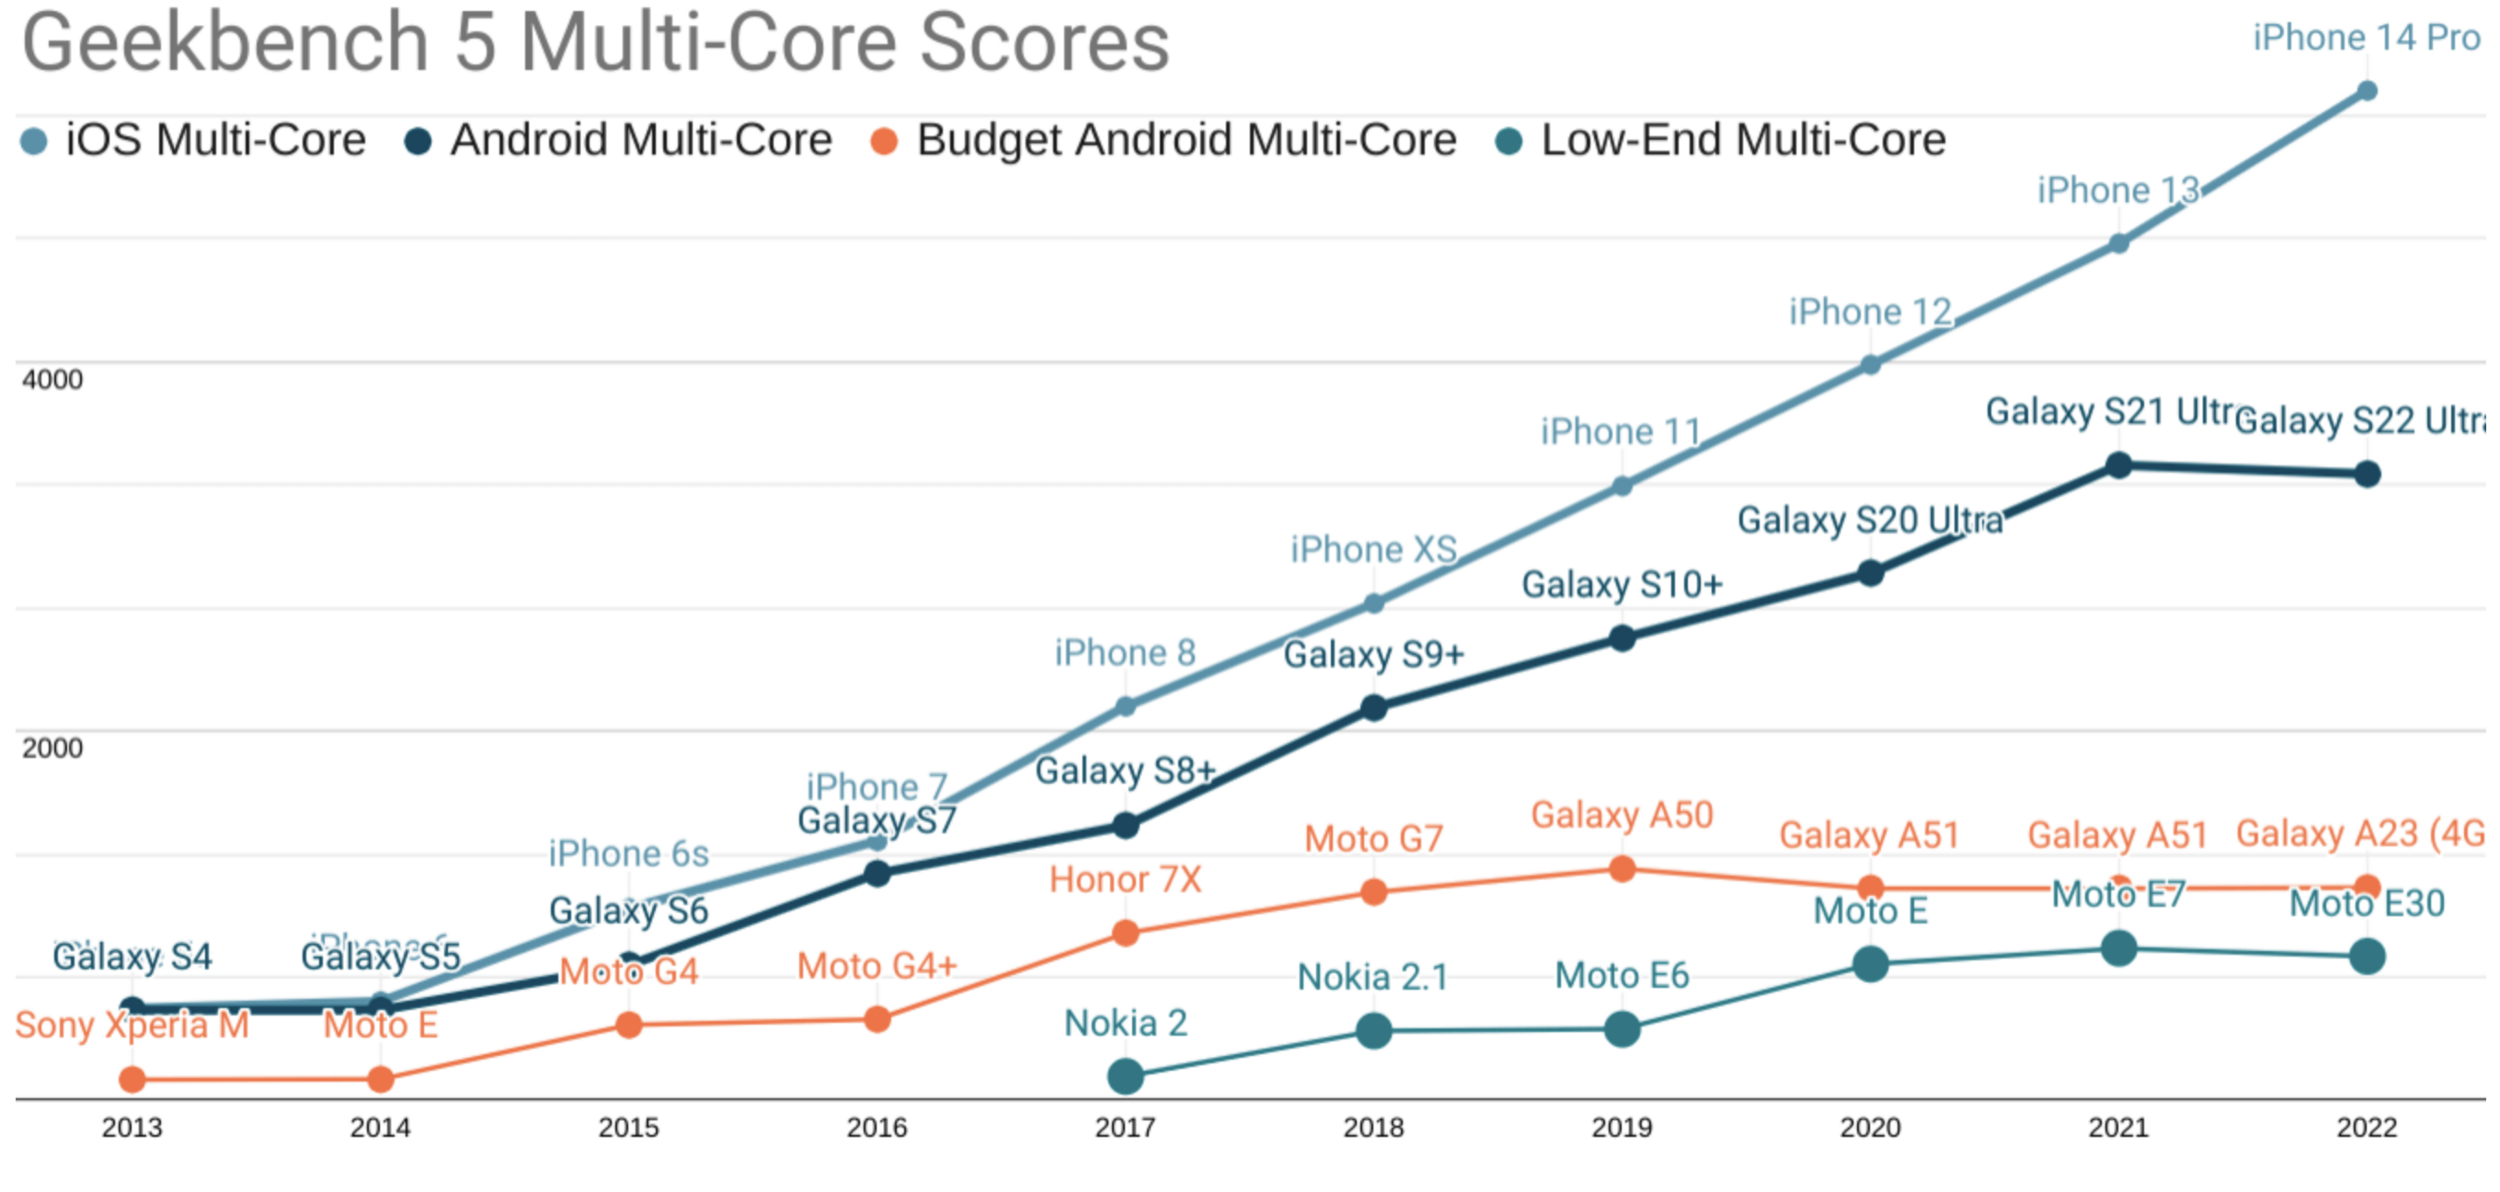
High End Device
Apple iPhone 14 Pro Max
https://infrequently.org/2022/12/performance-baseline-2023/
https://infrequently.org/2022/12/performance-baseline-2023/
# of devices
performance
50th percentile
Apple iPhone 11 (2019)
Samsung Galaxy S20 Ultra (2021)
# of devices
performance
75th percentile
Motorola Moto E30 (2023)
Samsung Galaxy A23 (2023)
Apple iPhone 6 (2015)
Samsung Galaxy S6 (2015)
# of devices
performance
25% of people receive
a poorer experience
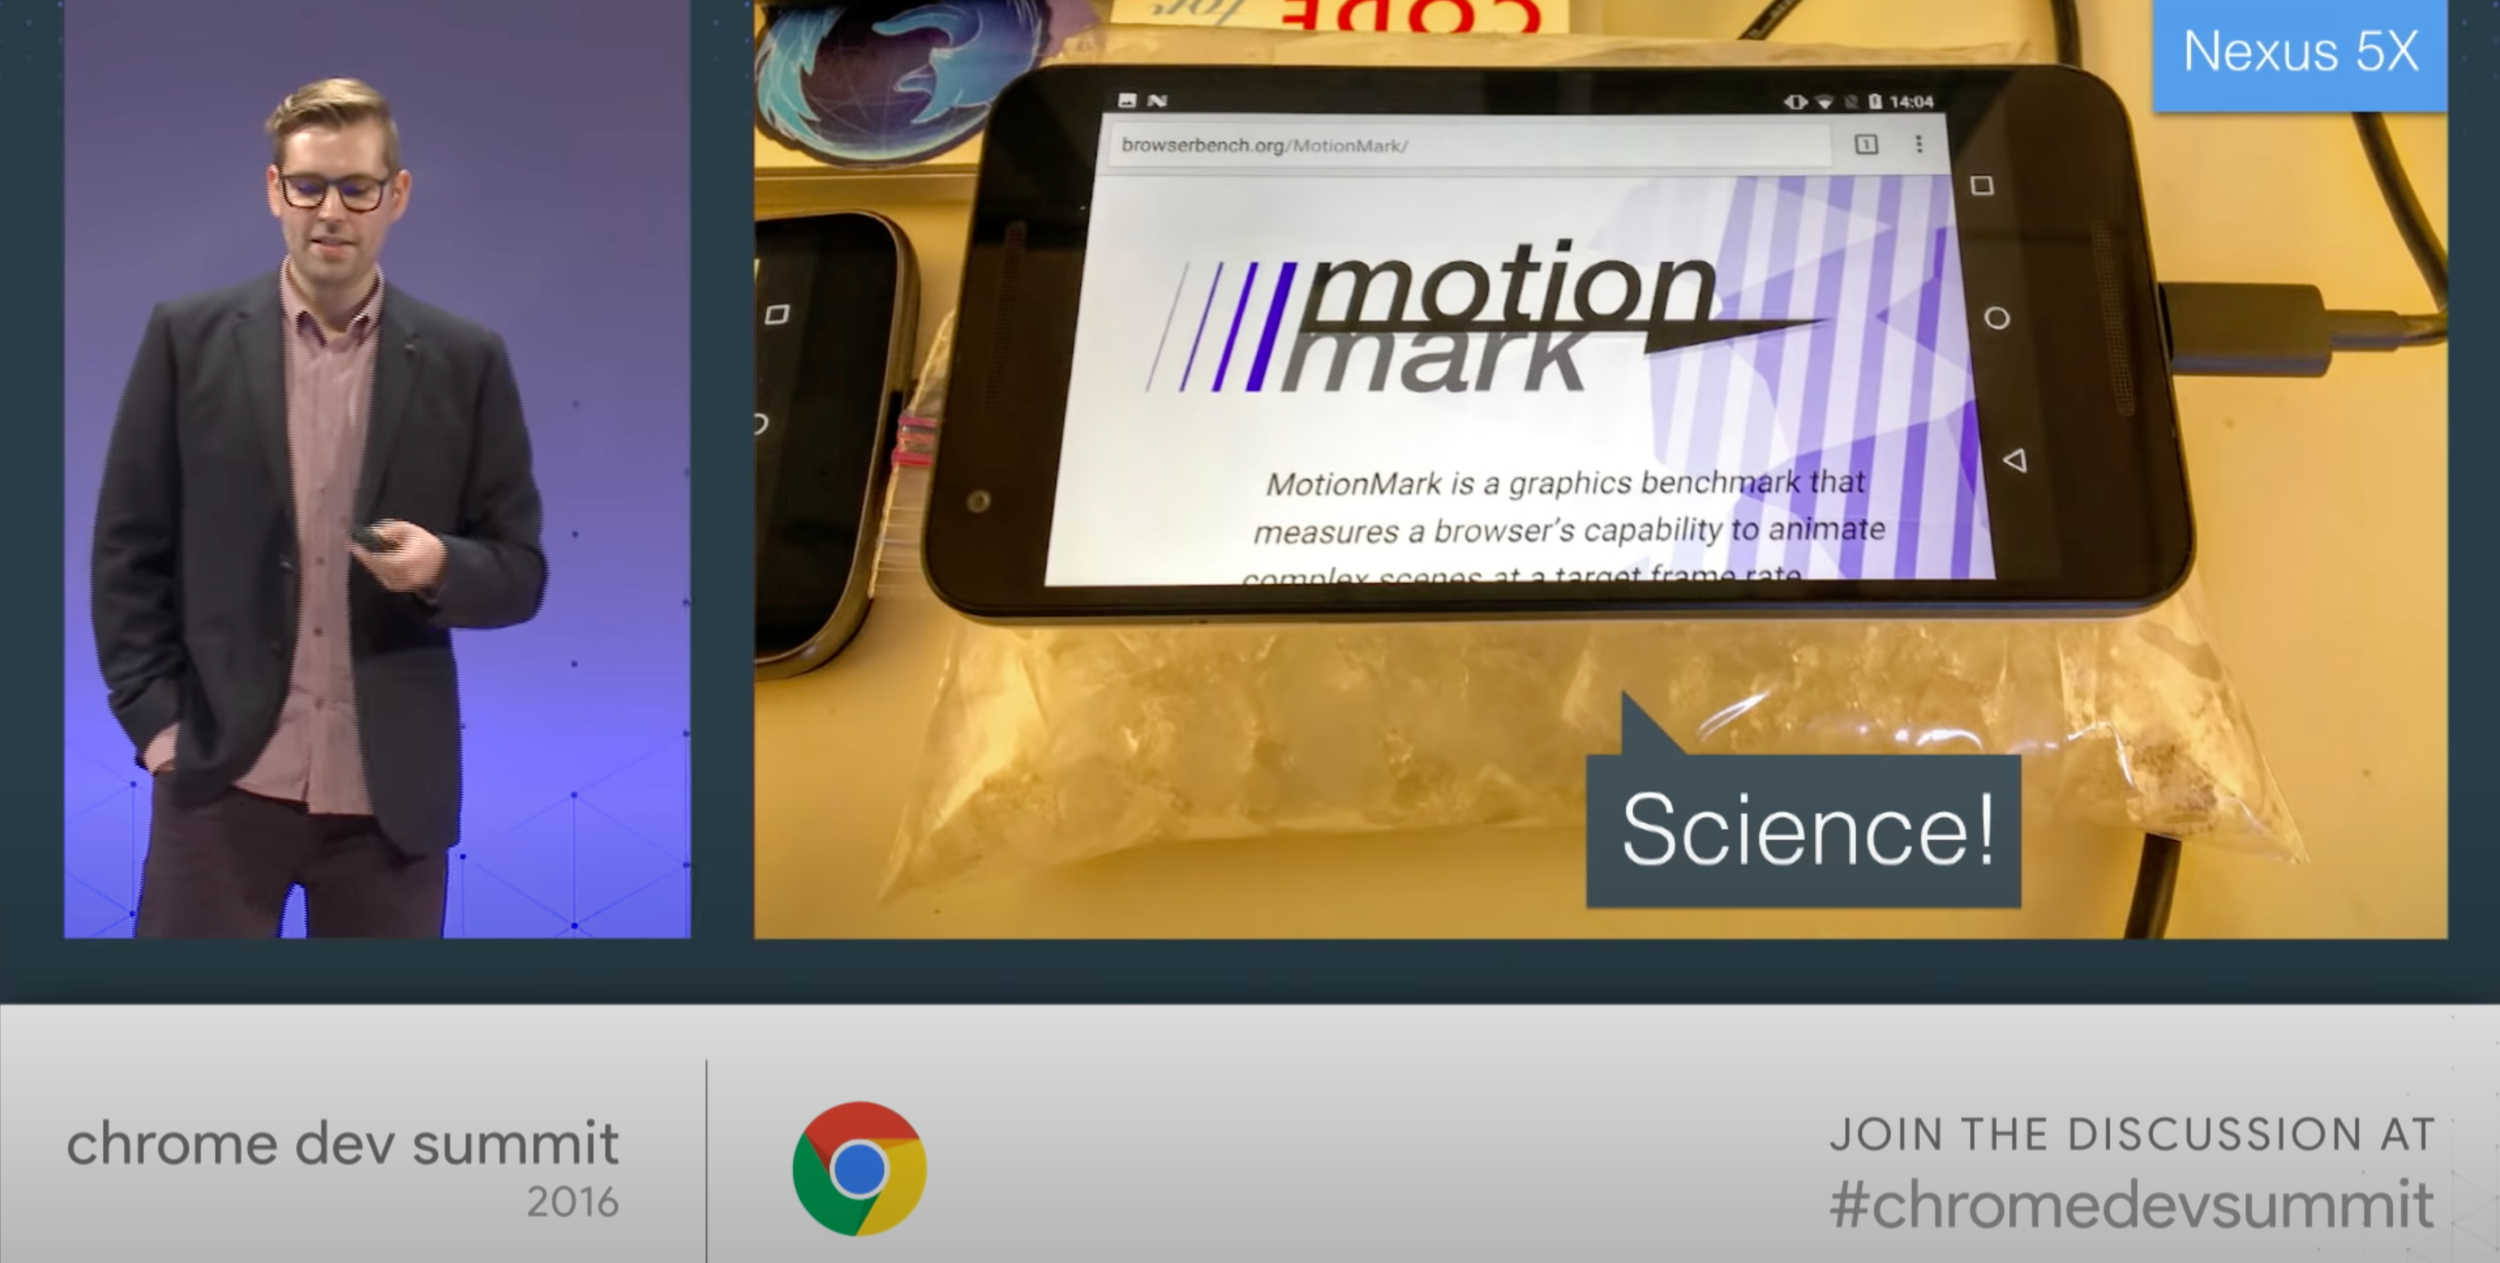
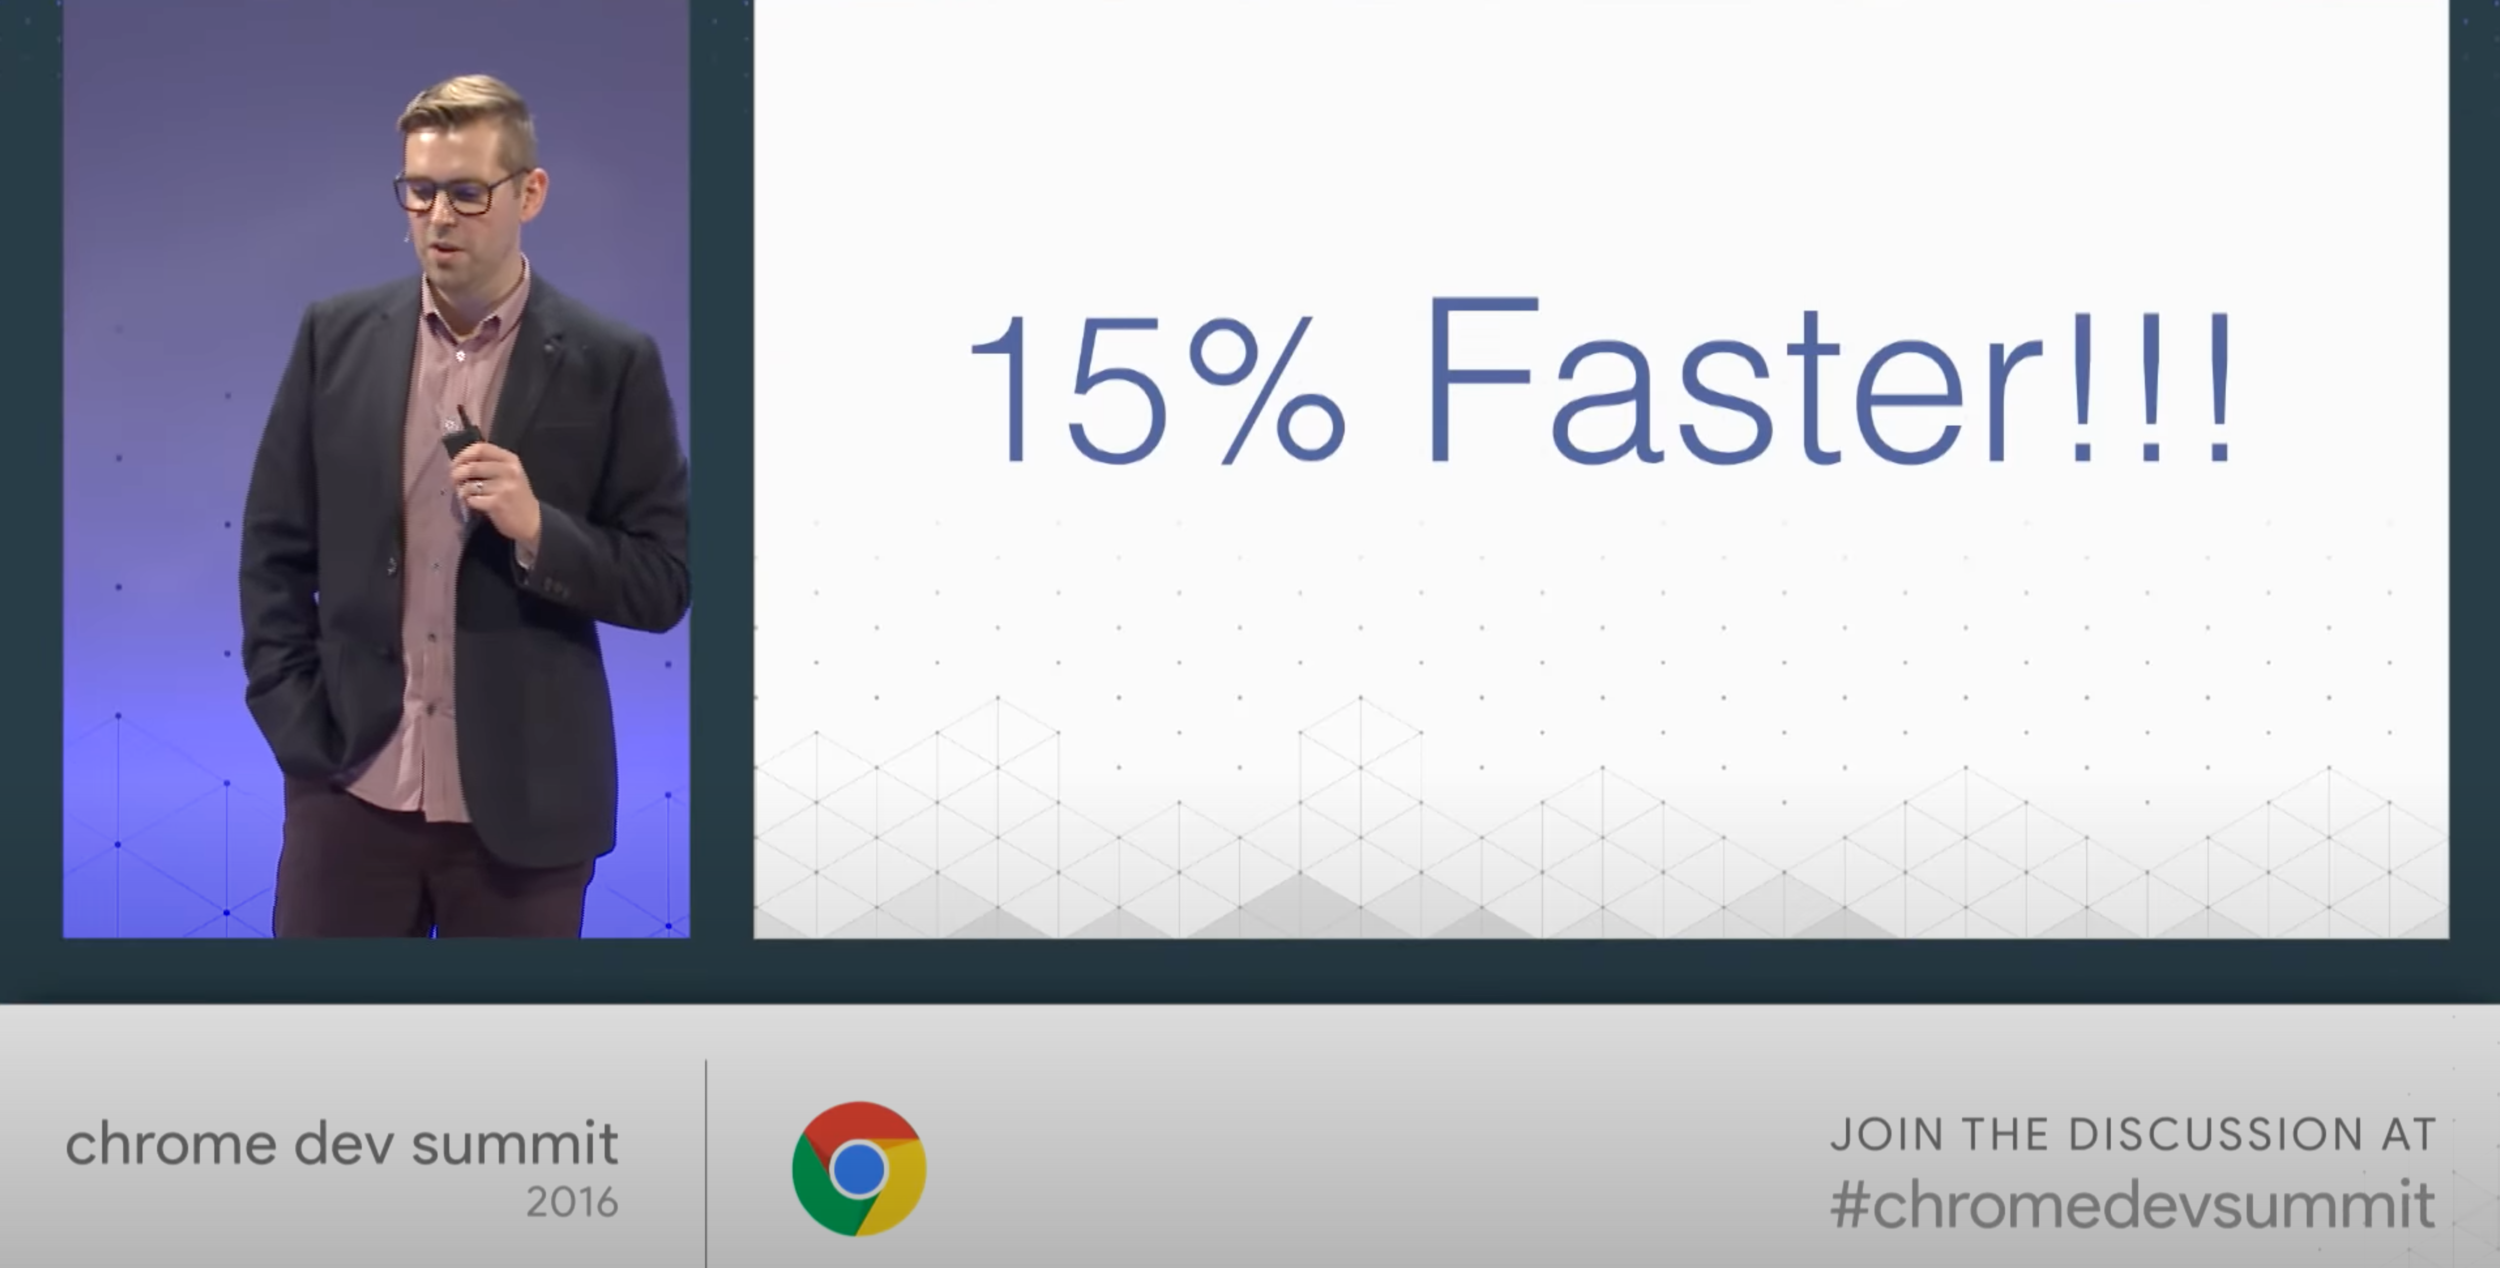
Alex Russel - Progressive Performance (Chrome Dev Summit 2016)
https://www.youtube.com/watch?v=4bZvq3nodf4
https://www.speedtest.net/global-index/united-states
3G
4G
~1 second
~2.3 seconds
4 second budget
5G
less than 1 second
https://engineering.linecorp.com/en/blog/the-baseline-for-web-development-in-2022
86.8%
46.26 Mb/s
Reno, NV
181.74 Mb/s
Glendale, AZ
390%
https://www.speedtest.net/global-index
https://www.speedtest.net/global-index
101 ms
Anchorage, AK
39 ms
Plano, TX
35%
Capturing performance metrics directly from devices in the real world to observe differences in functionality, reliability, and responsiveness.
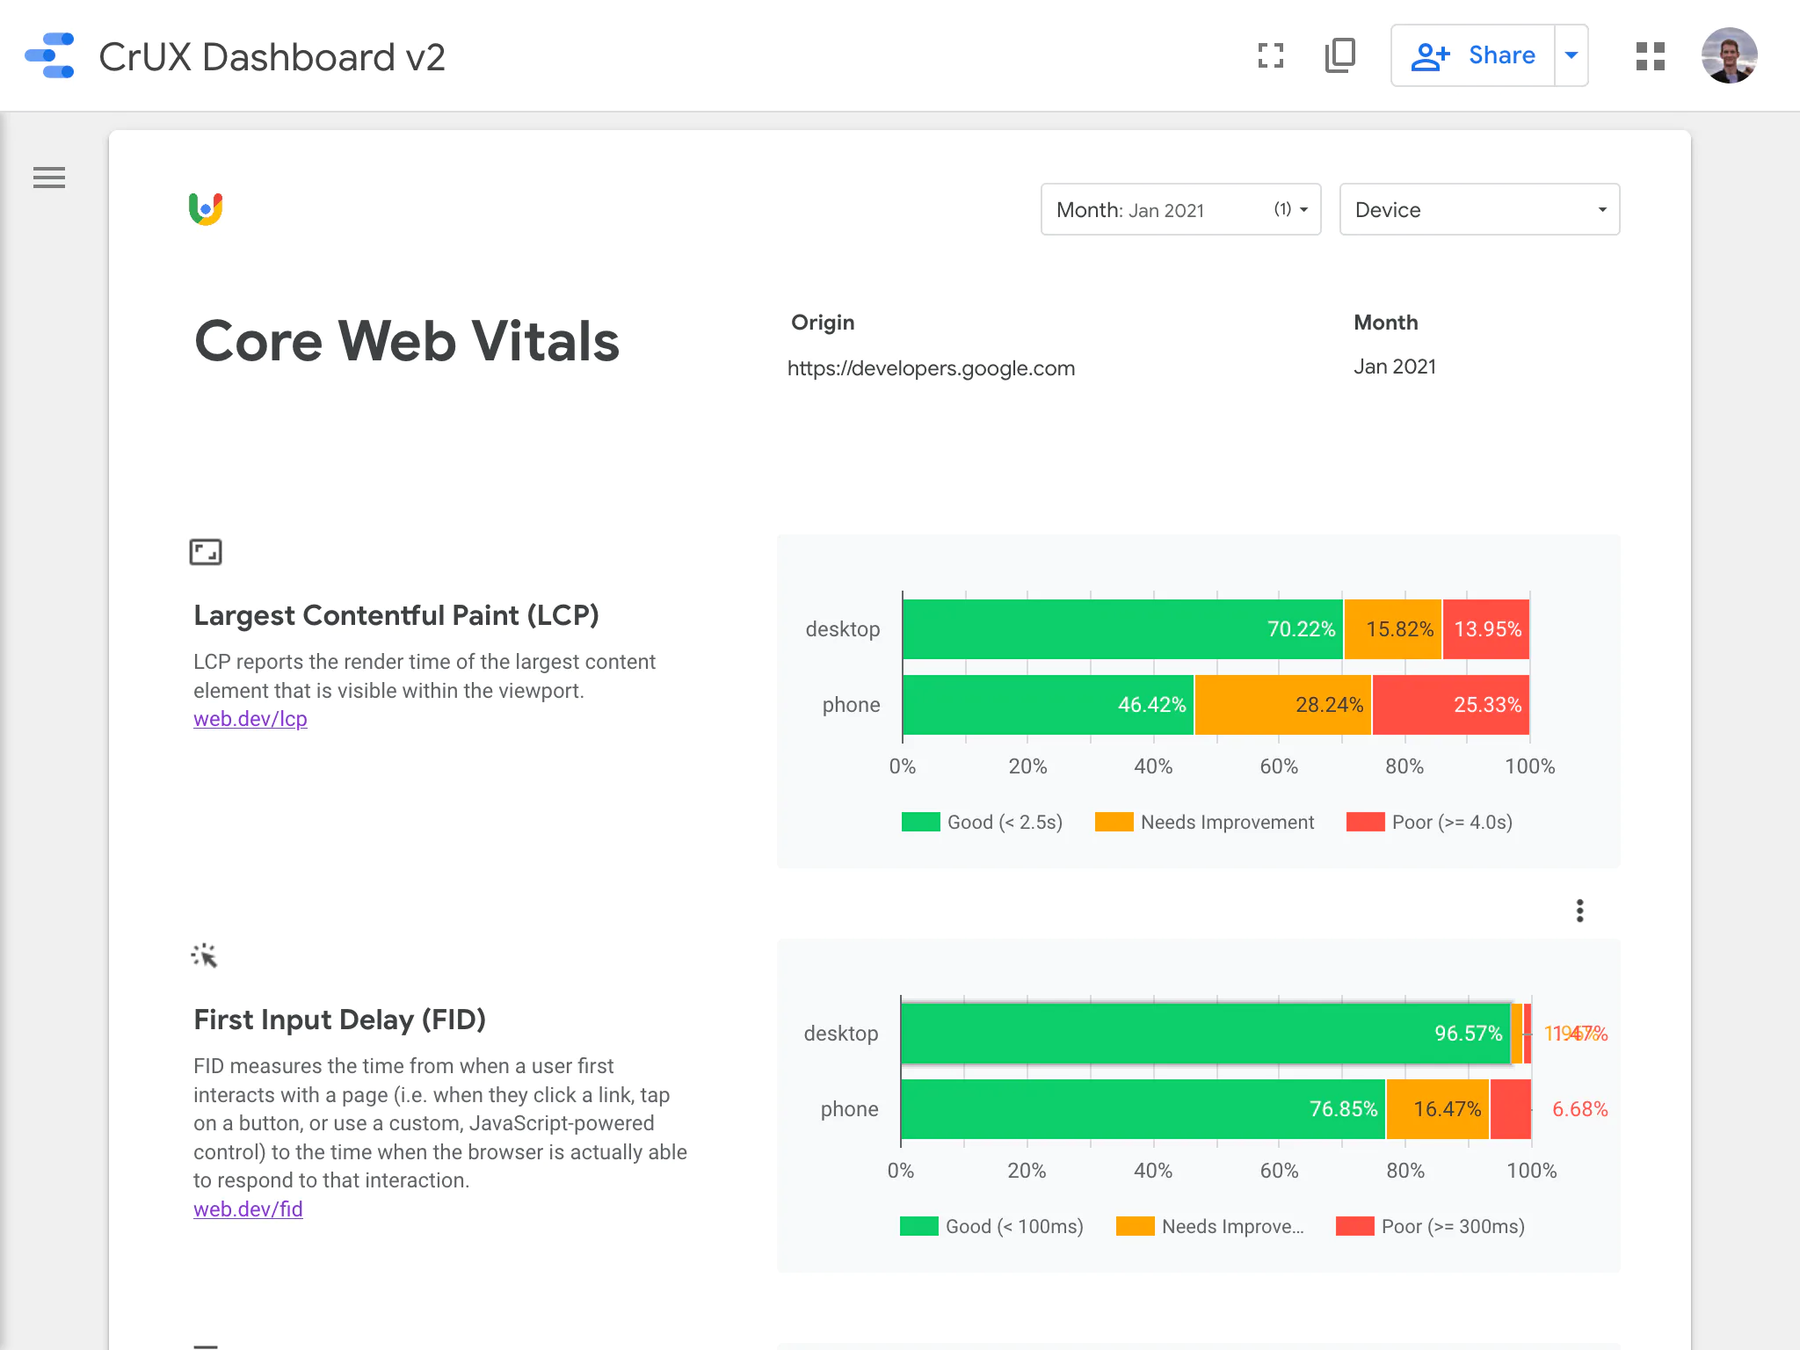
https://developers.google.com/web/tools/chrome-user-experience-report
👍 Free, publicly available data
👎 Frustrating setup process
👎 Delayed, monthly aggregation
👎 Google Chrome devices only
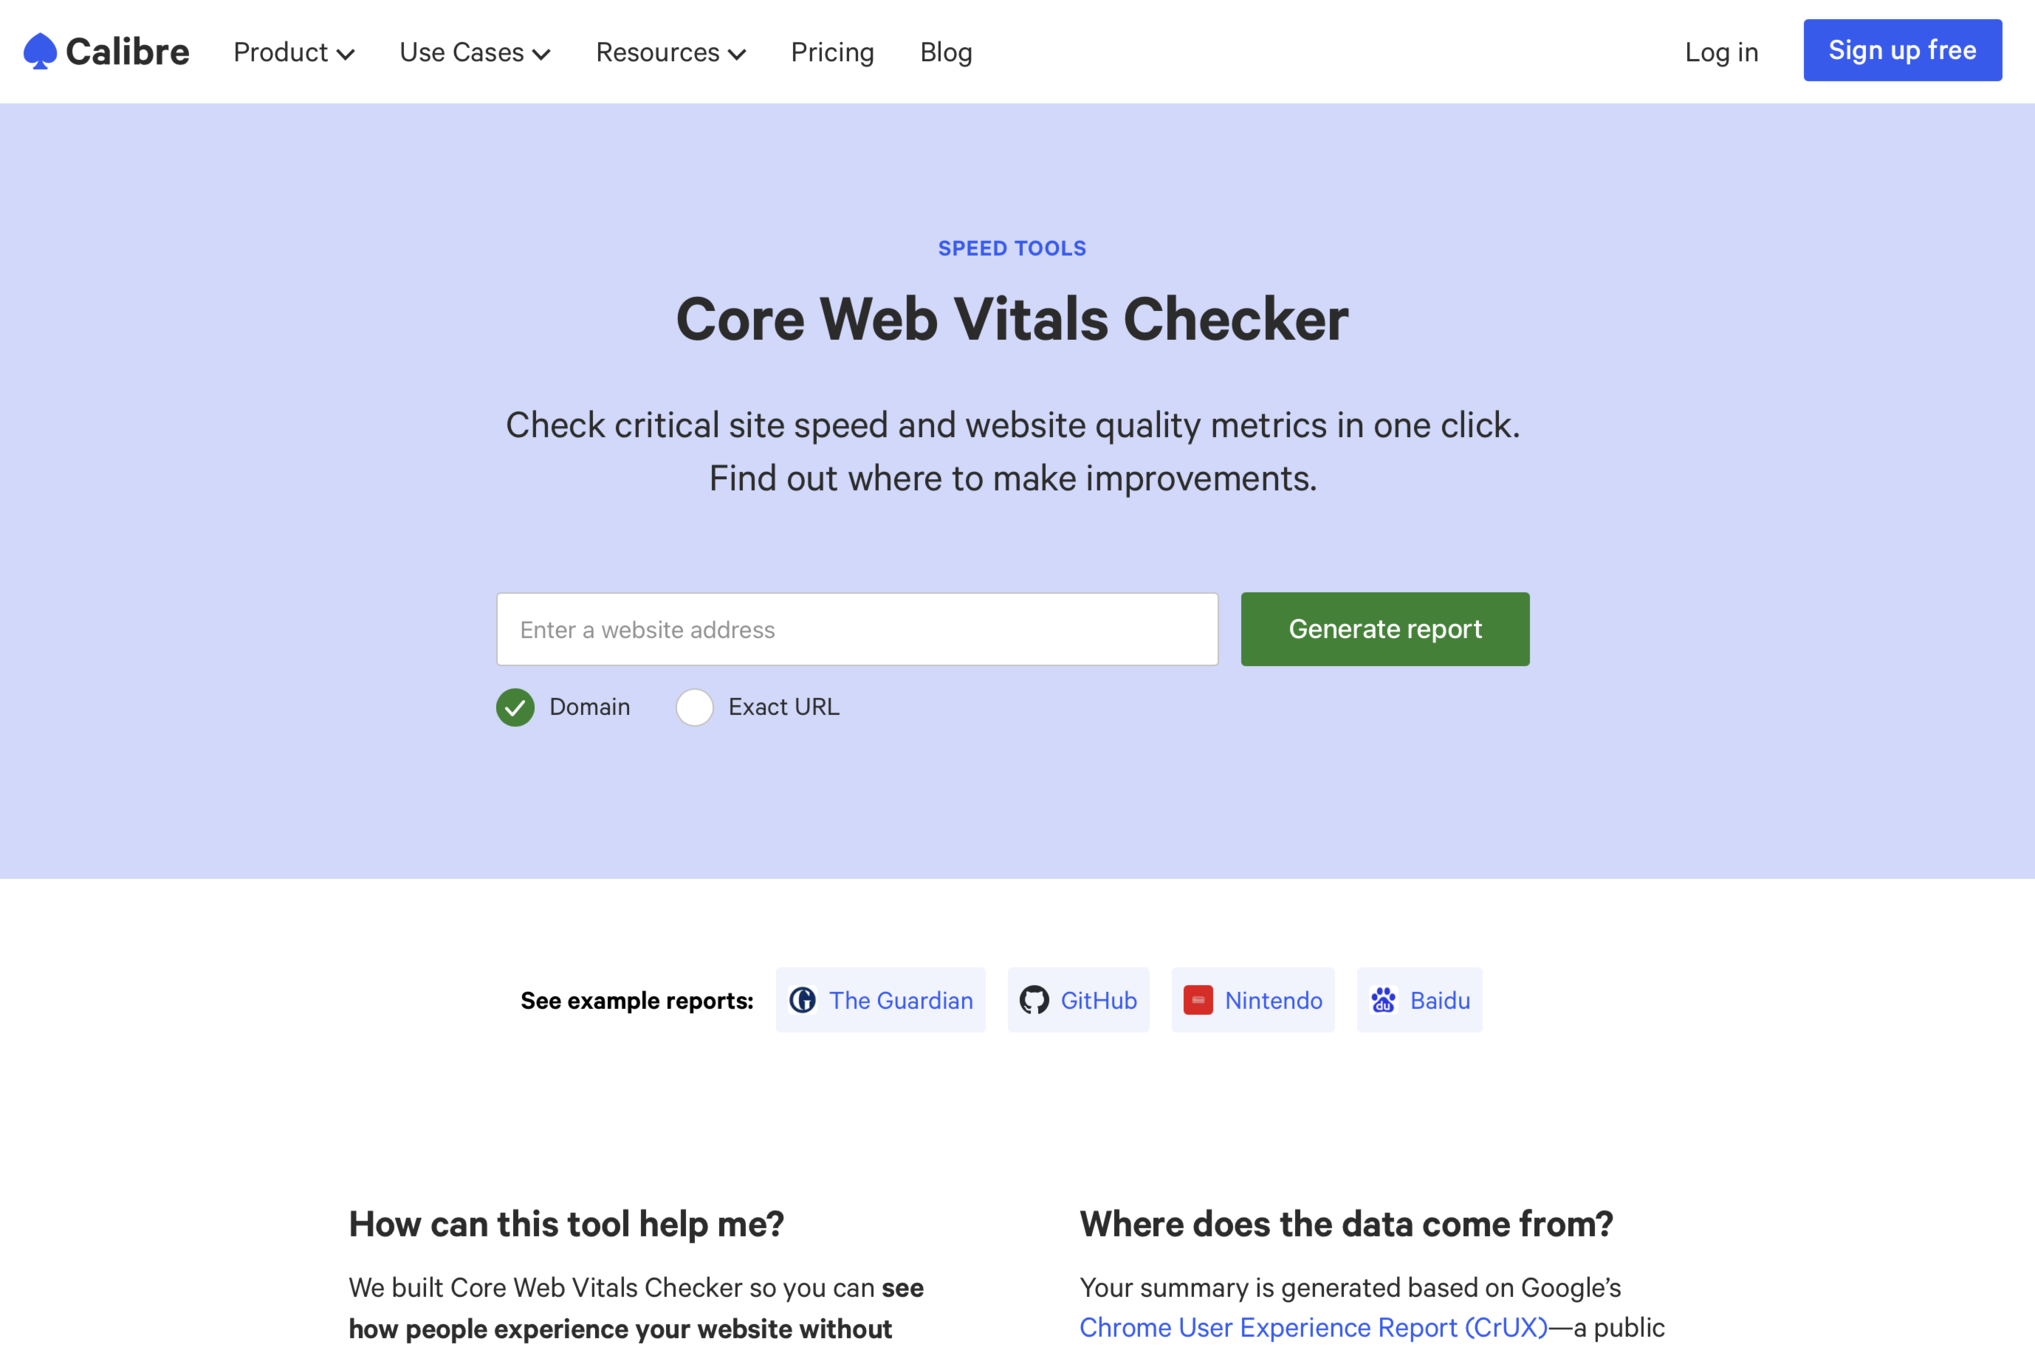
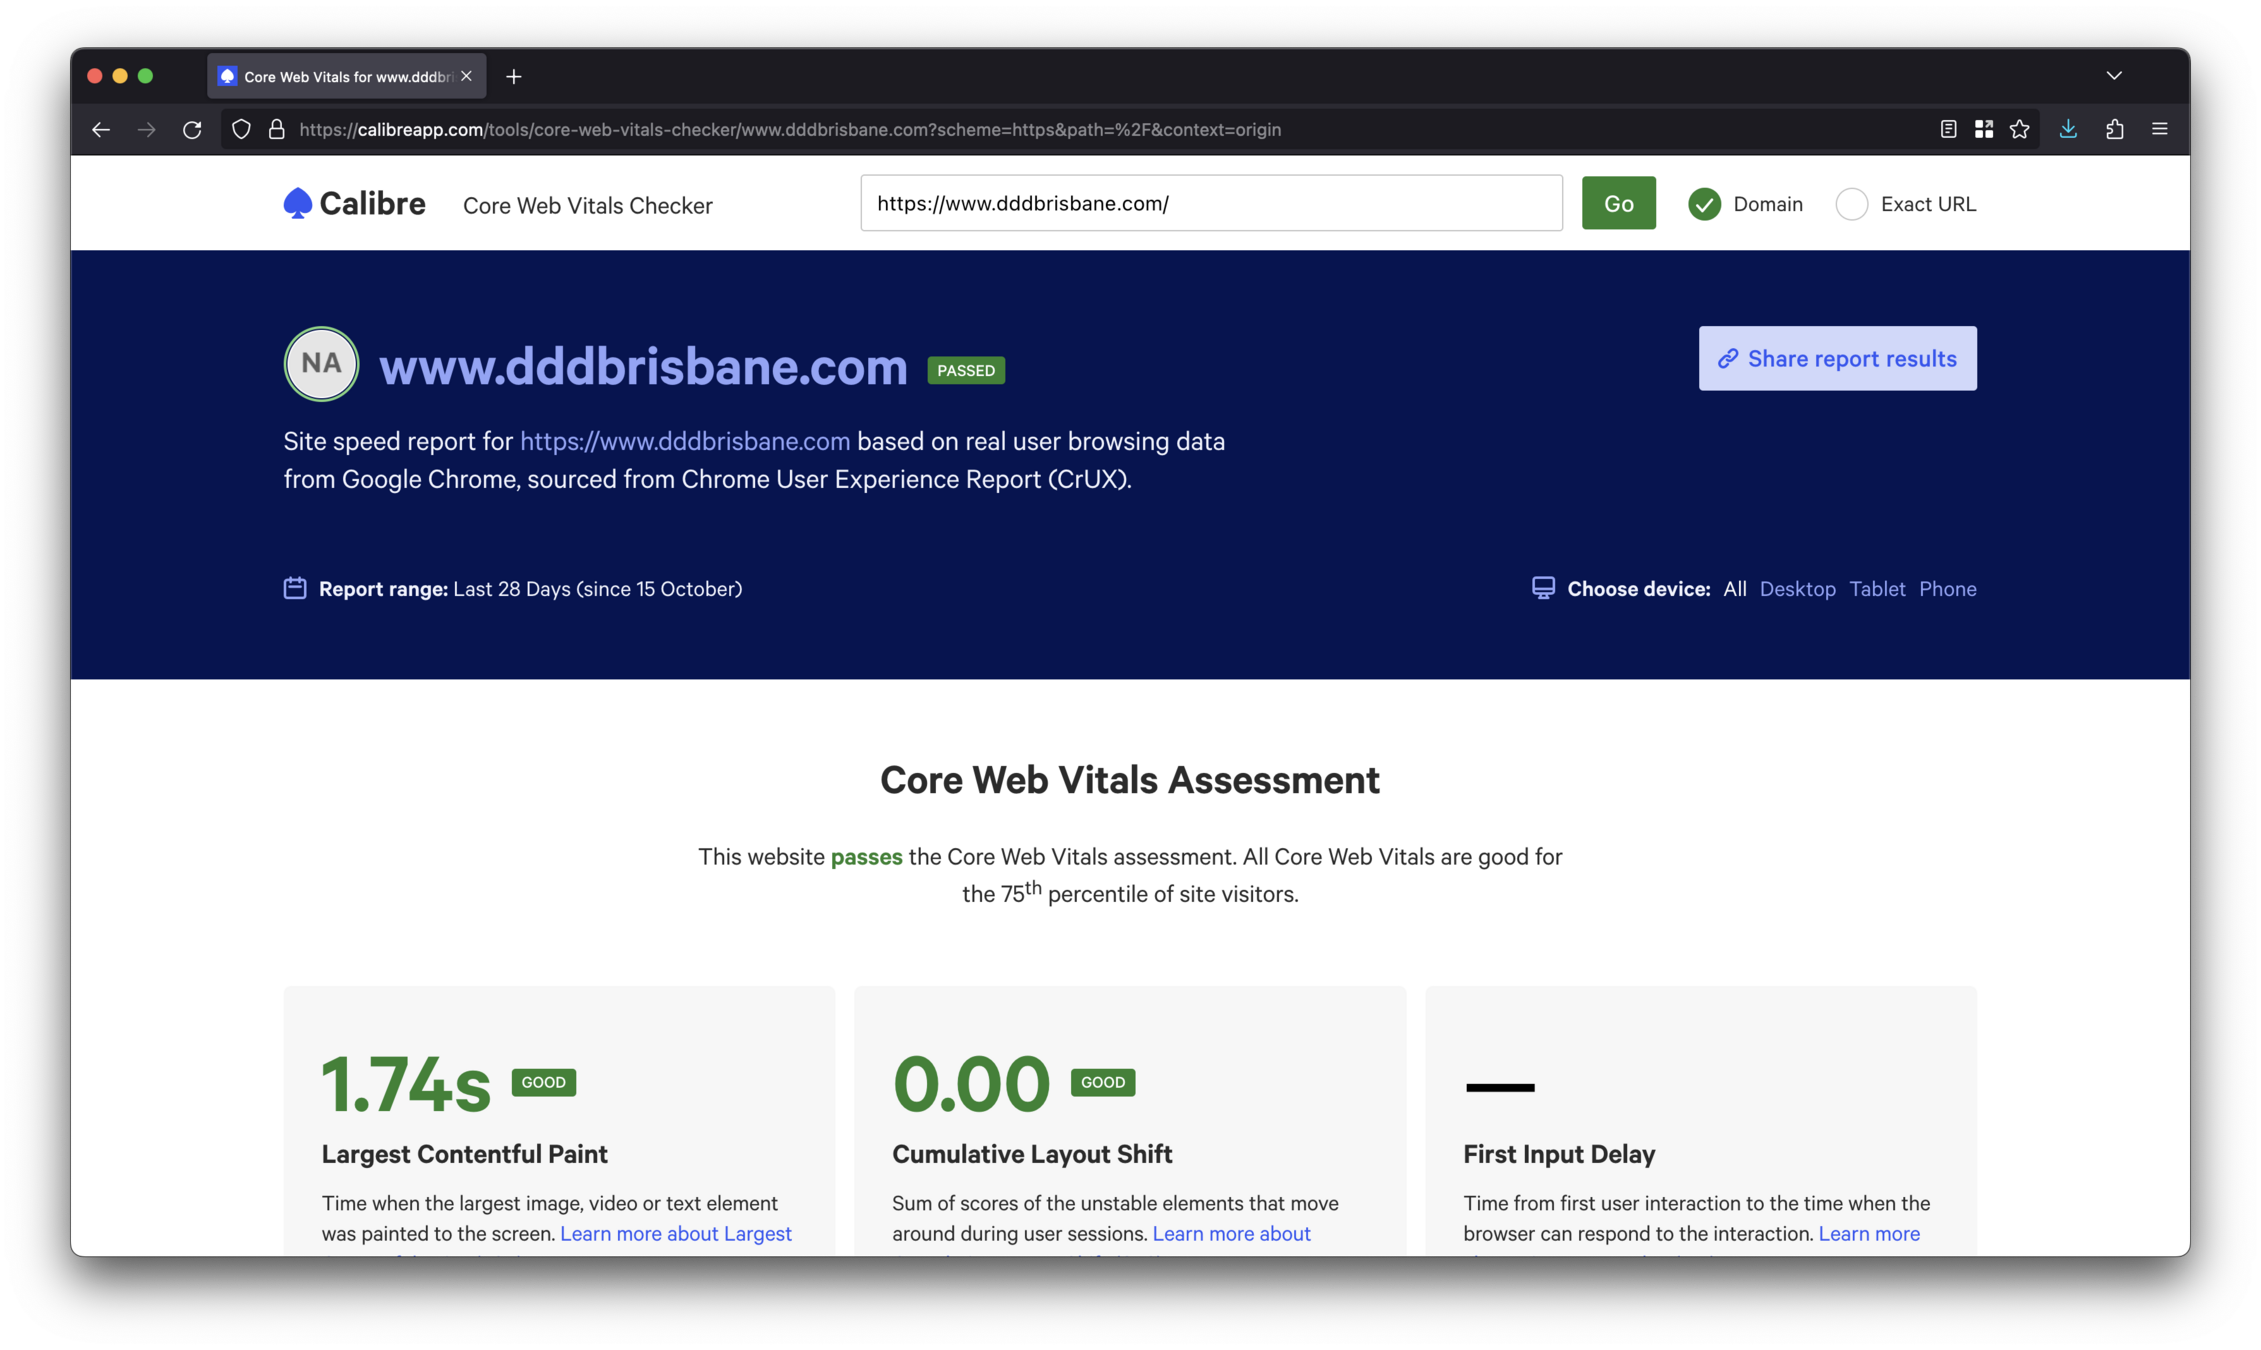
https://calibreapp.com/tools/core-web-vitals-checker
https://calibreapp.com/tools/core-web-vitals-checker
👍 On-demand access
👍 Zero configuration
👎 Same upsides and downsides as CrUX Report
| Sponsor | TTFB | FCP | LCP ↑ | FID | INP | CLS |
|---|---|---|---|---|---|---|
| 🥇 Seq | 🟢 494ms | 🟢 856ms | 🟢 997ms | 🟢 10ms | 🟢 36ms | 🟢 0 |
| 🥈 LMG | 🟡 1.13s | 🟢 1.65s | 🟢 2.04s | 🟢 4ms | 🟢 46ms | 🟢 0 |
| 🥉 Patient Zero | 🟡 1.04s | 🟢 1.63s | 🟢 2.41s | ⚪ | ⚪ | 🟢 0 |
| SSW | 🟡 1.22s | 🟡 1.63s | 🟢 2.44s | 🟢 8ms | 🟢 70ms | 🟢 0.02 |
| YOW! Conferences | 🟡 986ms | 🟡 1.9s | 🟡 2.61s | 🟢 8ms | 🟢 50ms | 🟢 0 |
| Octopus | 🟡 1.18s | 🟡 2.56s | 🟡 2.61s | 🟢 5ms | 🟢 60ms | 🟢 0 |
| Telstra Purple | 🟡 1.29s | 🟡 2.55s | 🟡 2.68s | 🟢 6ms | 🟢 73ms | 🟢 0.03 |
| NDC Sydney | 🟡 1.97s | 🟡 2.4s | 🟡 2.99s | 🟢 13ms | 🟢 92ms | 🟢 0.02 |
| Vald | 🟢 918ms | 🟢 1.78s | 🟡 3.5s | 🟢 11ms | 🟢 105ms | 🔴 0.28 |
| Insight | 🟡 1.56s | 🔴 5.16s | 🔴 5.63s | 🟢 9ms | 🟢 140ms | 🟡 0.12 |
| DevBricks | ⚪ | ⚪ | ⚪ | ⚪ | ⚪ | ⚪ |
| SixPivot | ⚪ | ⚪ | ⚪ | ⚪ | ⚪ | ⚪ |
| Soul Solutions | ⚪ | ⚪ | ⚪ | ⚪ | ⚪ | ⚪ |
✅ User-Centric Performance
✅ Capture Metrics from End User Devices
⬛ Continuous Monitoring
| User Centric Performance | Capture Metrics from Real Users | Continuous Monitoring | |
|---|---|---|---|
| window.onload() | ⬛ | ⬛ | ⬛ |
| Google Lighthouse | ✅ | ⬛ | ⬛ |
| Calibre | ✅ | ⬛ | ⬛ |
| CrUX Report | ✅ | ✅ | ⬛ |
| Web Vitals Checker | ✅ | ✅ | ⬛ |
| ??? | ✅ | ✅ | ✅ |
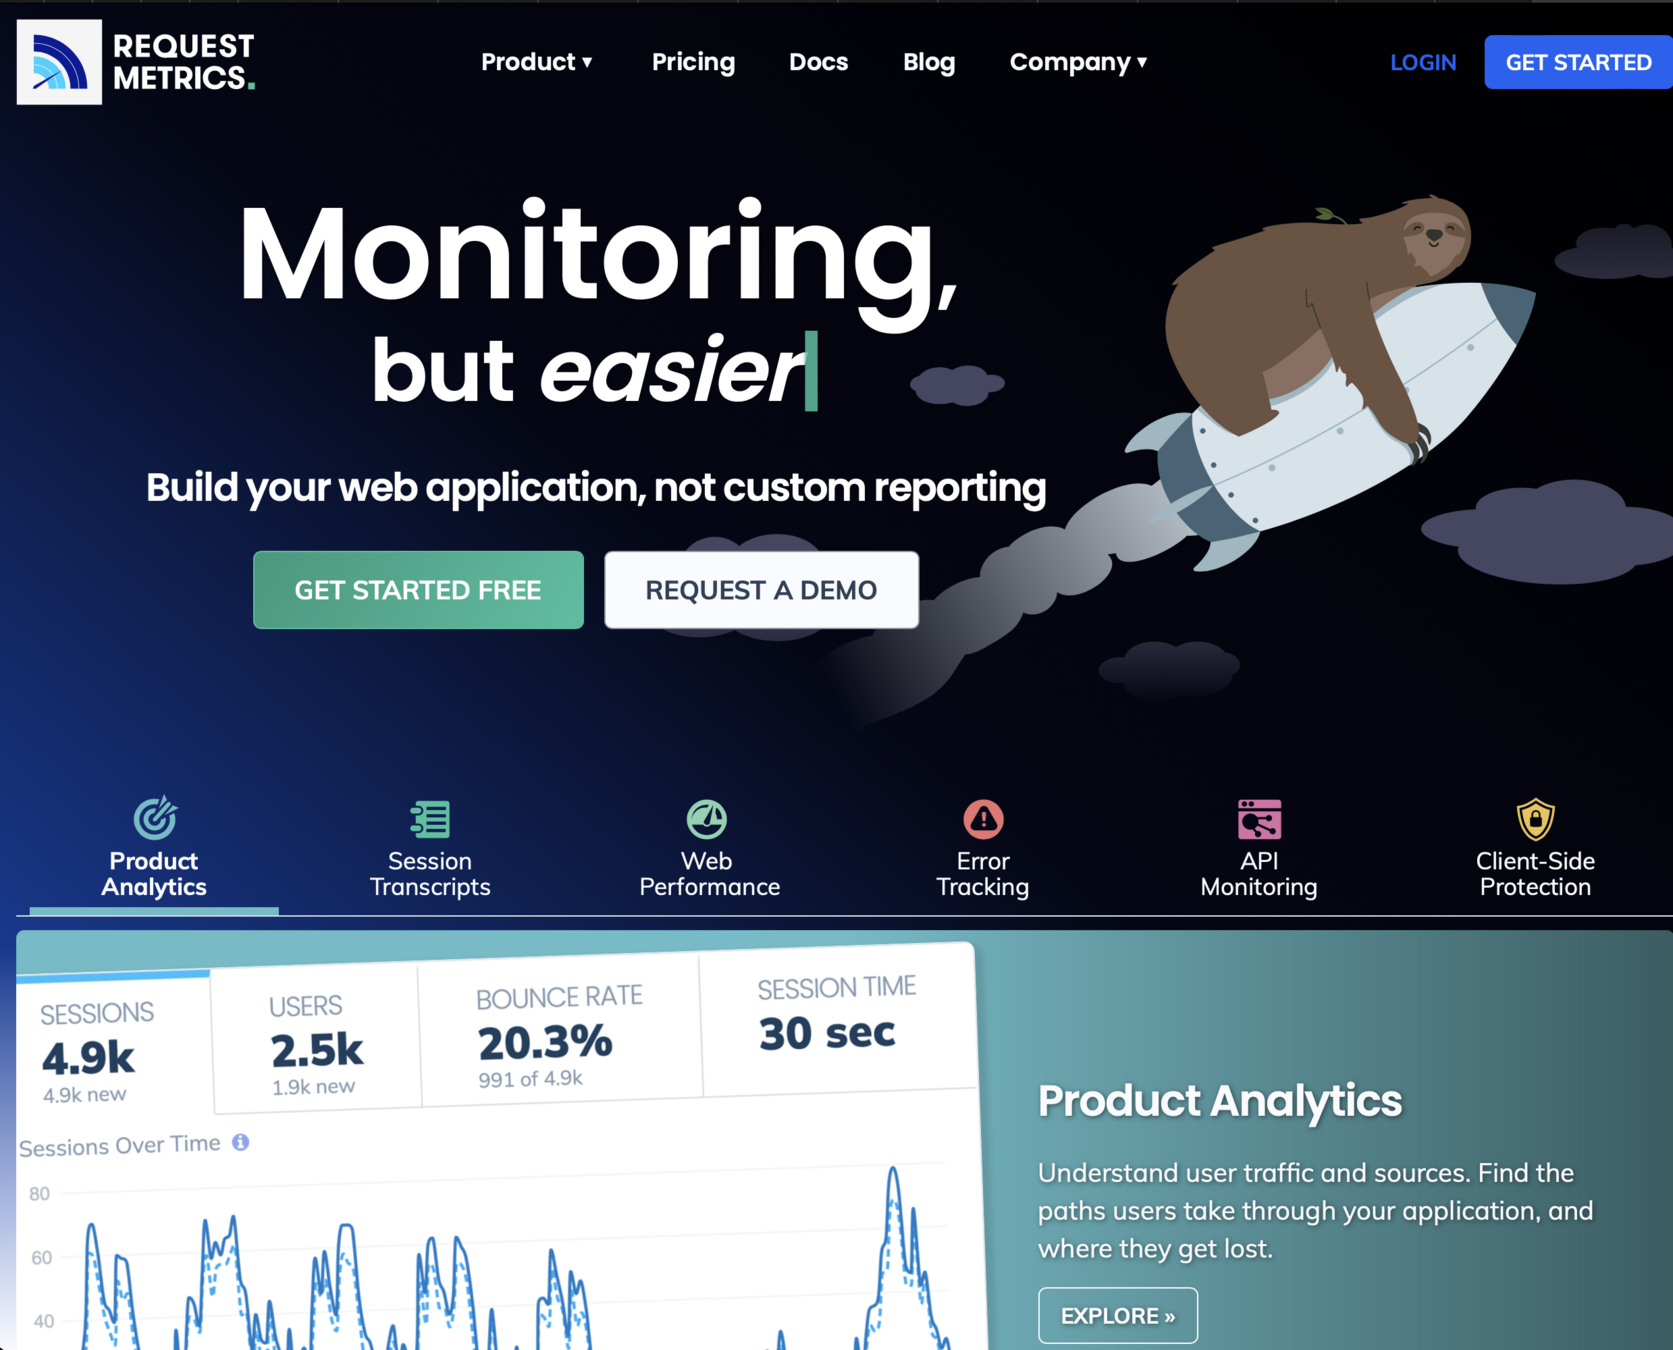
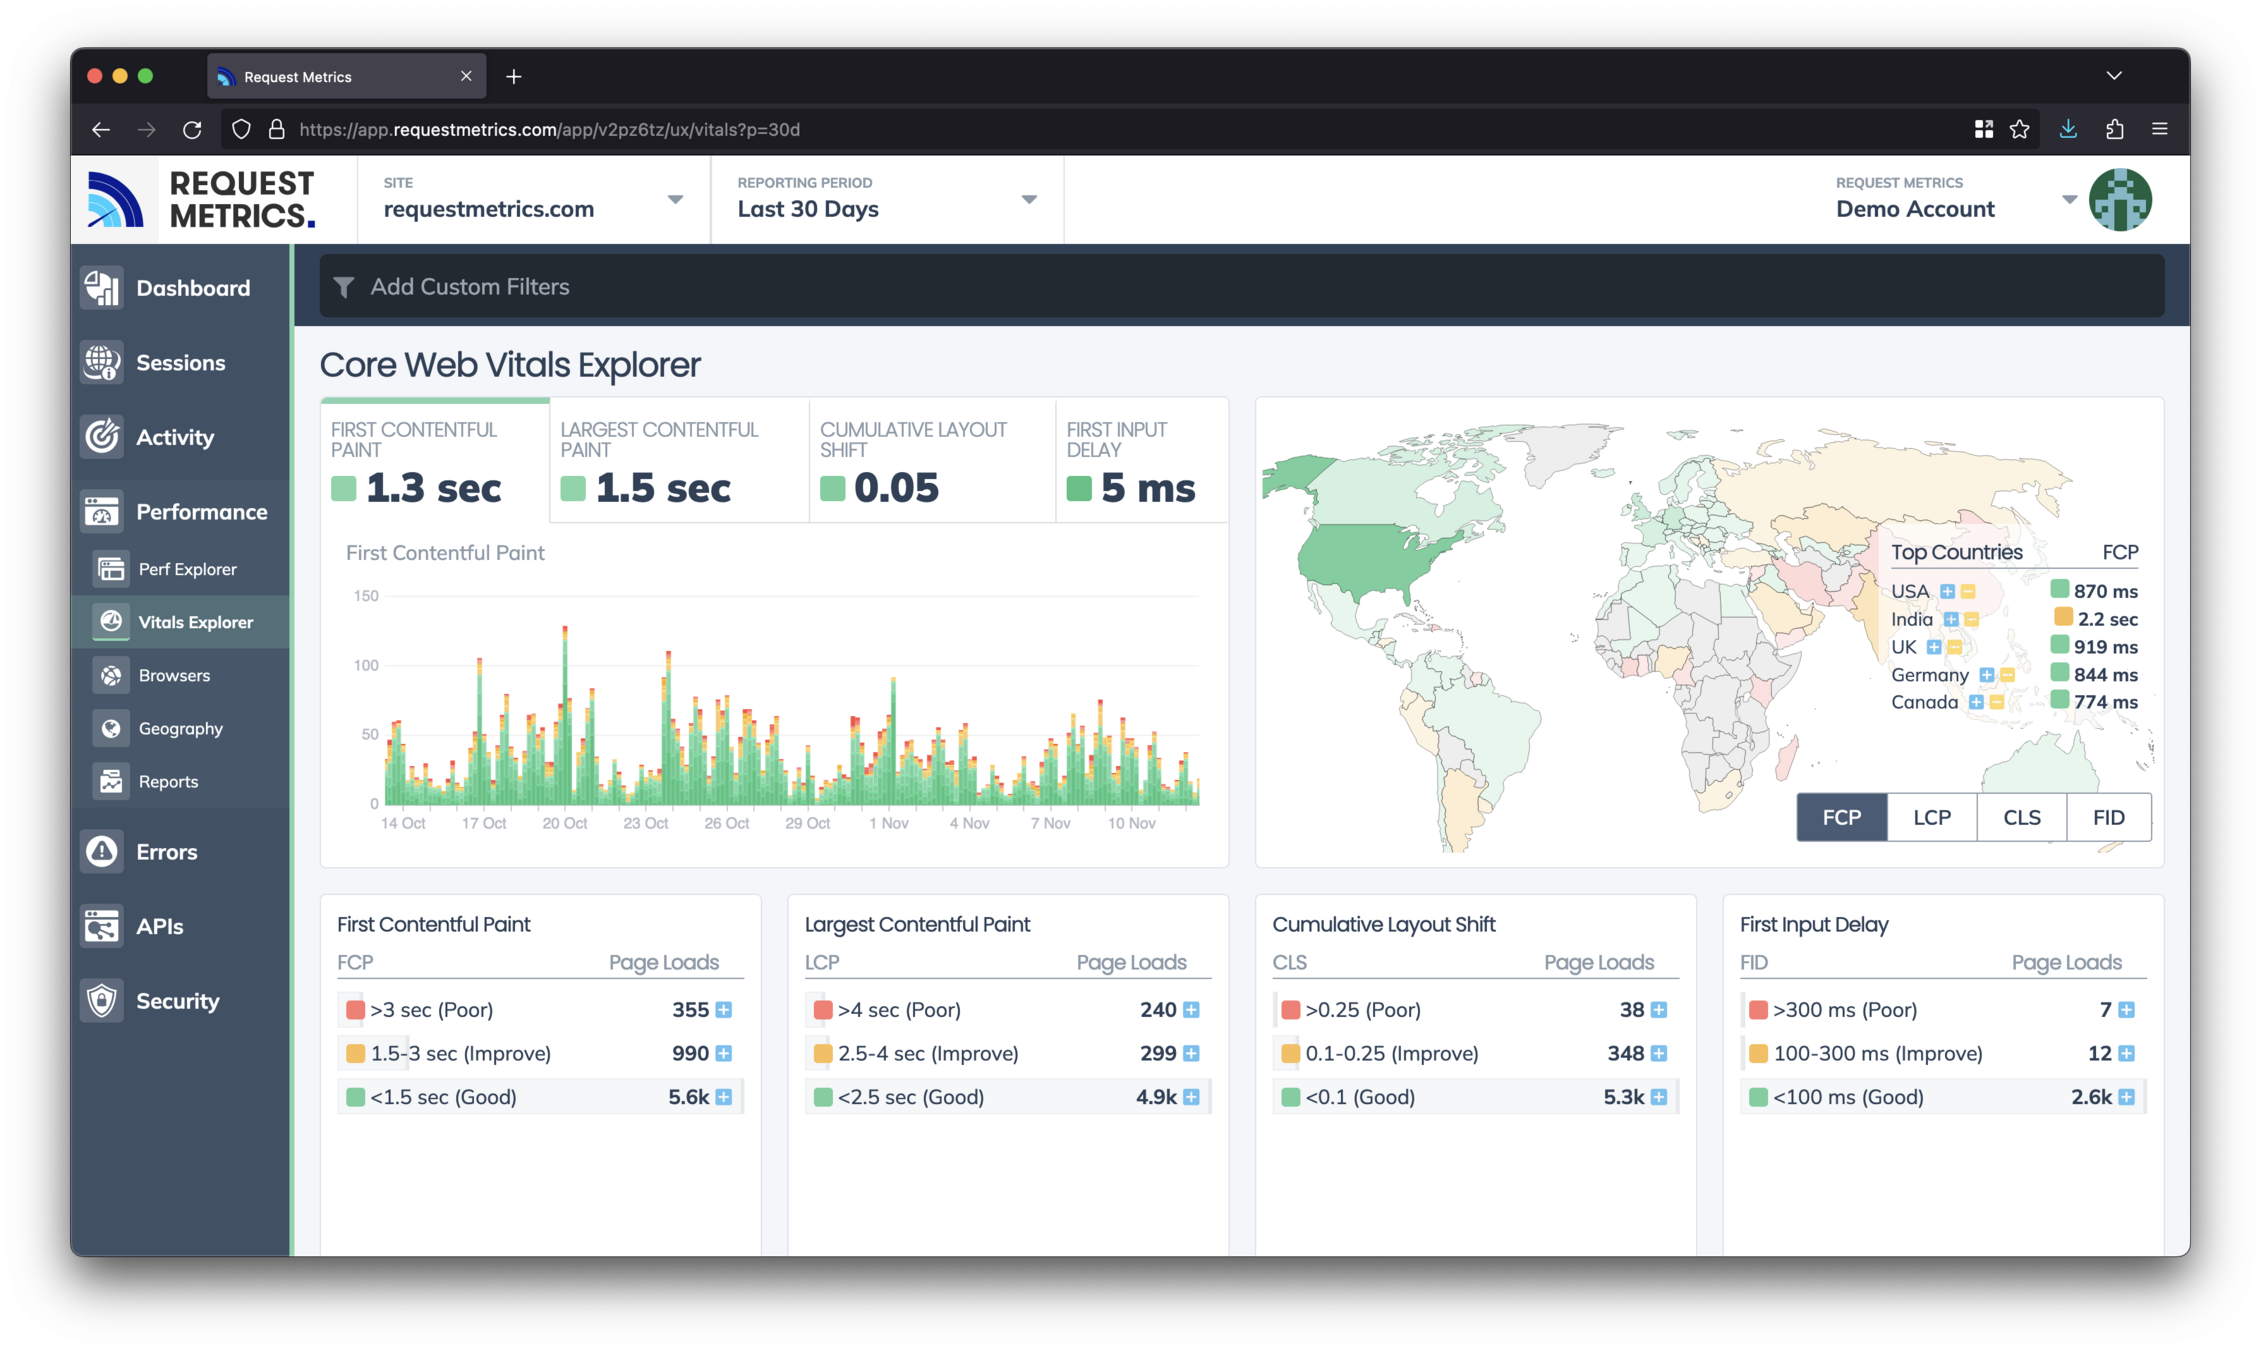
Request Metrics
https://requestmetrics.com
👍 Near real-time continuous monitoring
👍 Detailed reporting with zero sampling
👎 Can be expensive ($200/mo for 1 million sessions)
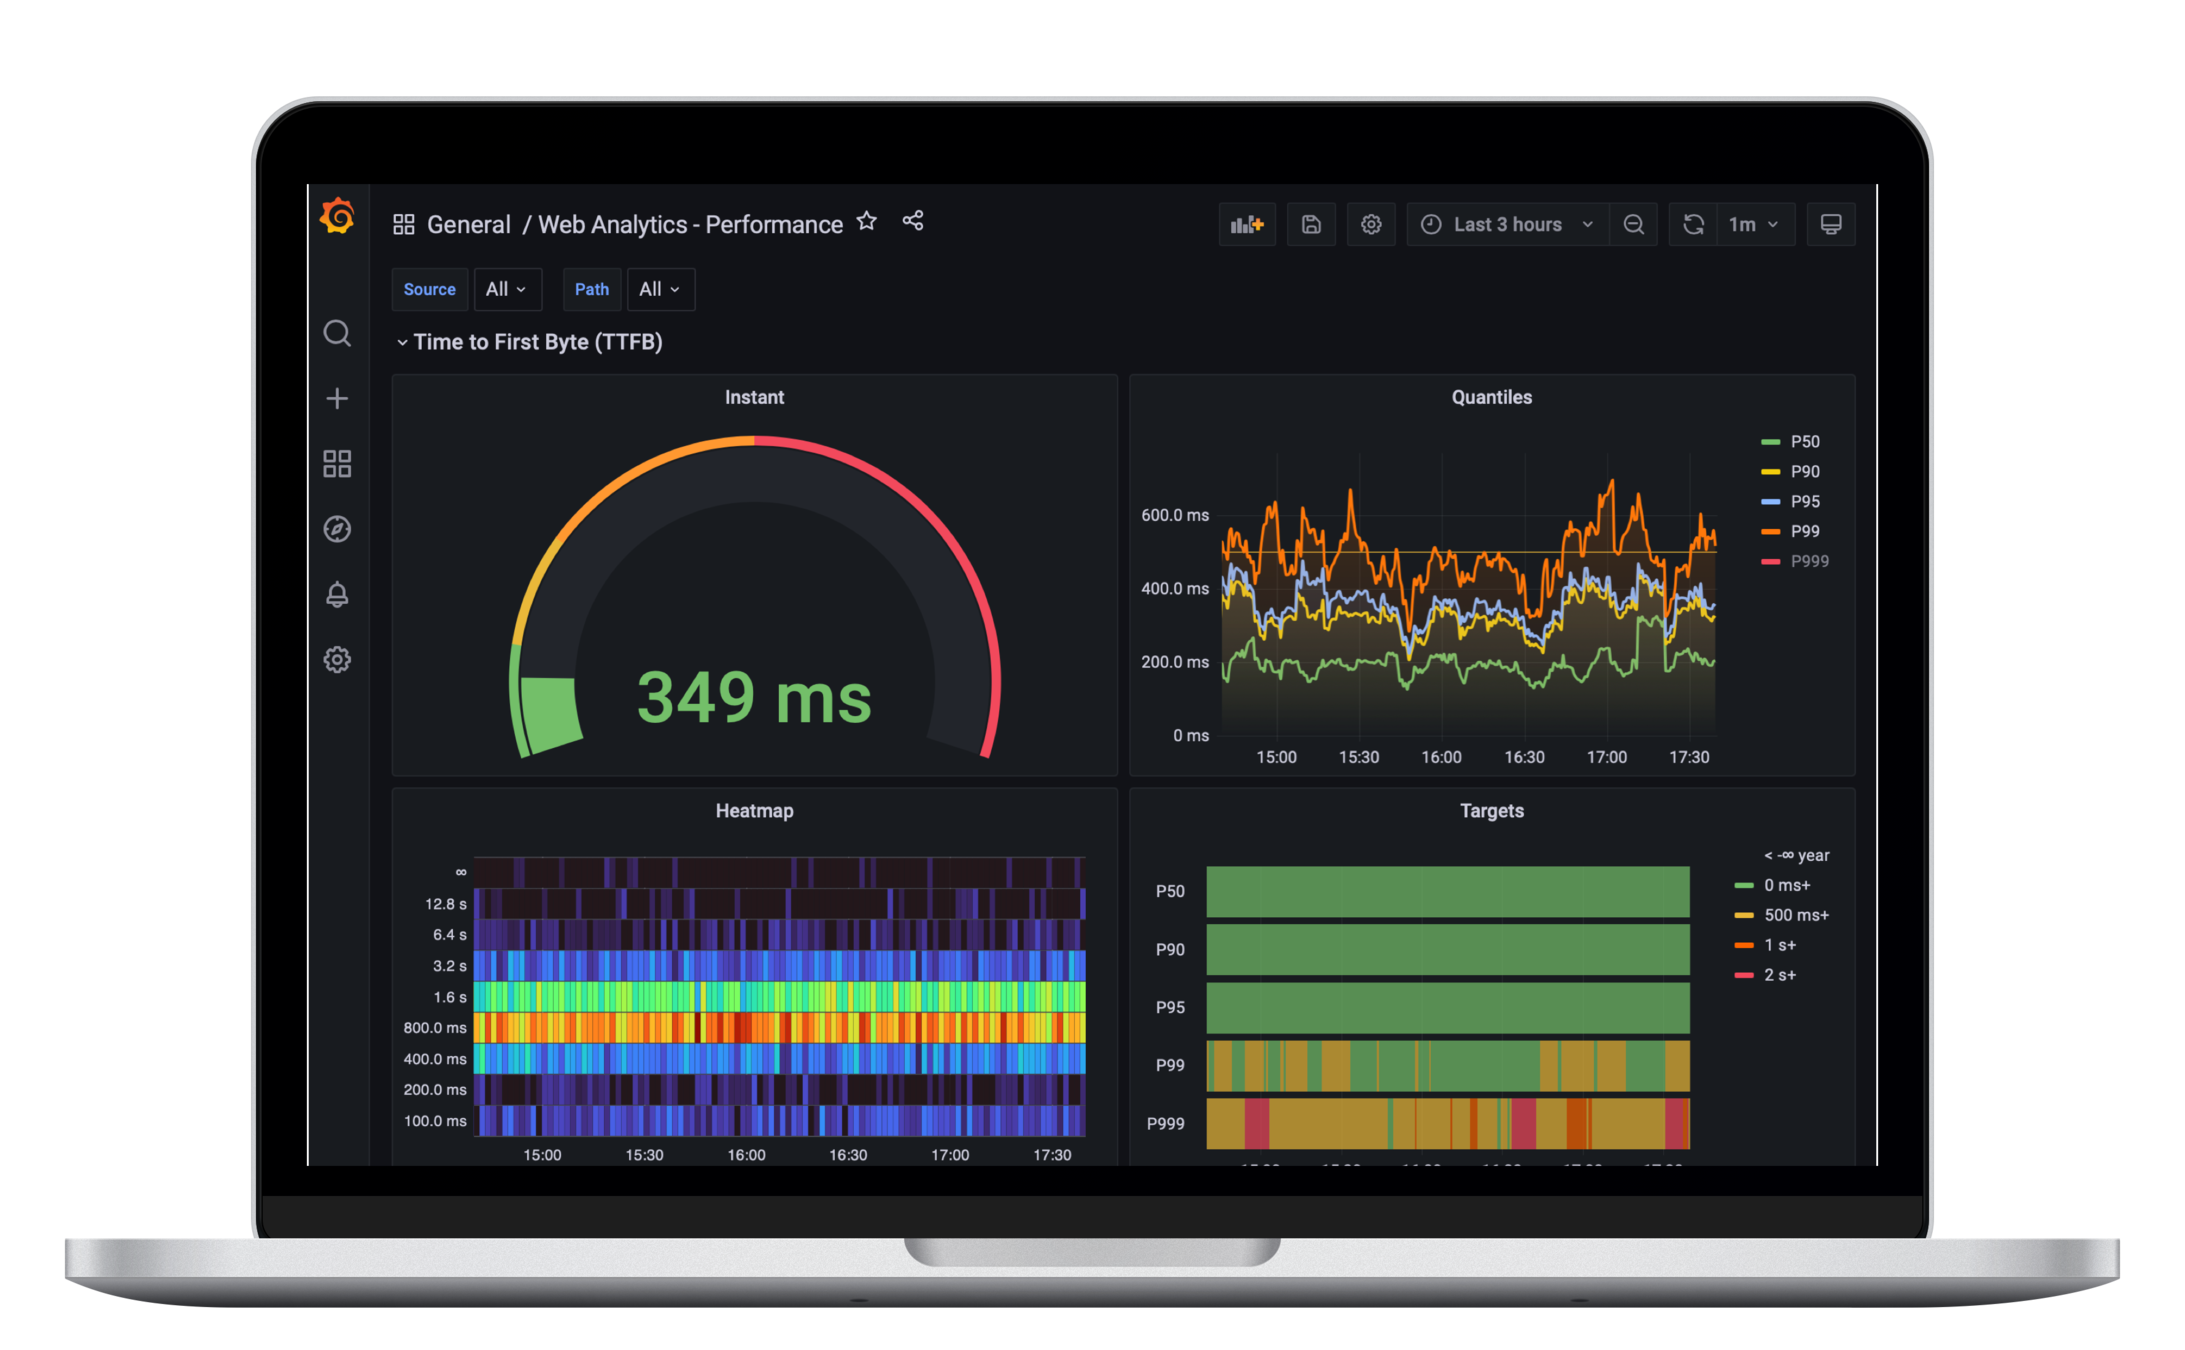
Grafana
Prometheus
GET /metrics
POST /analytics
Analytics Service
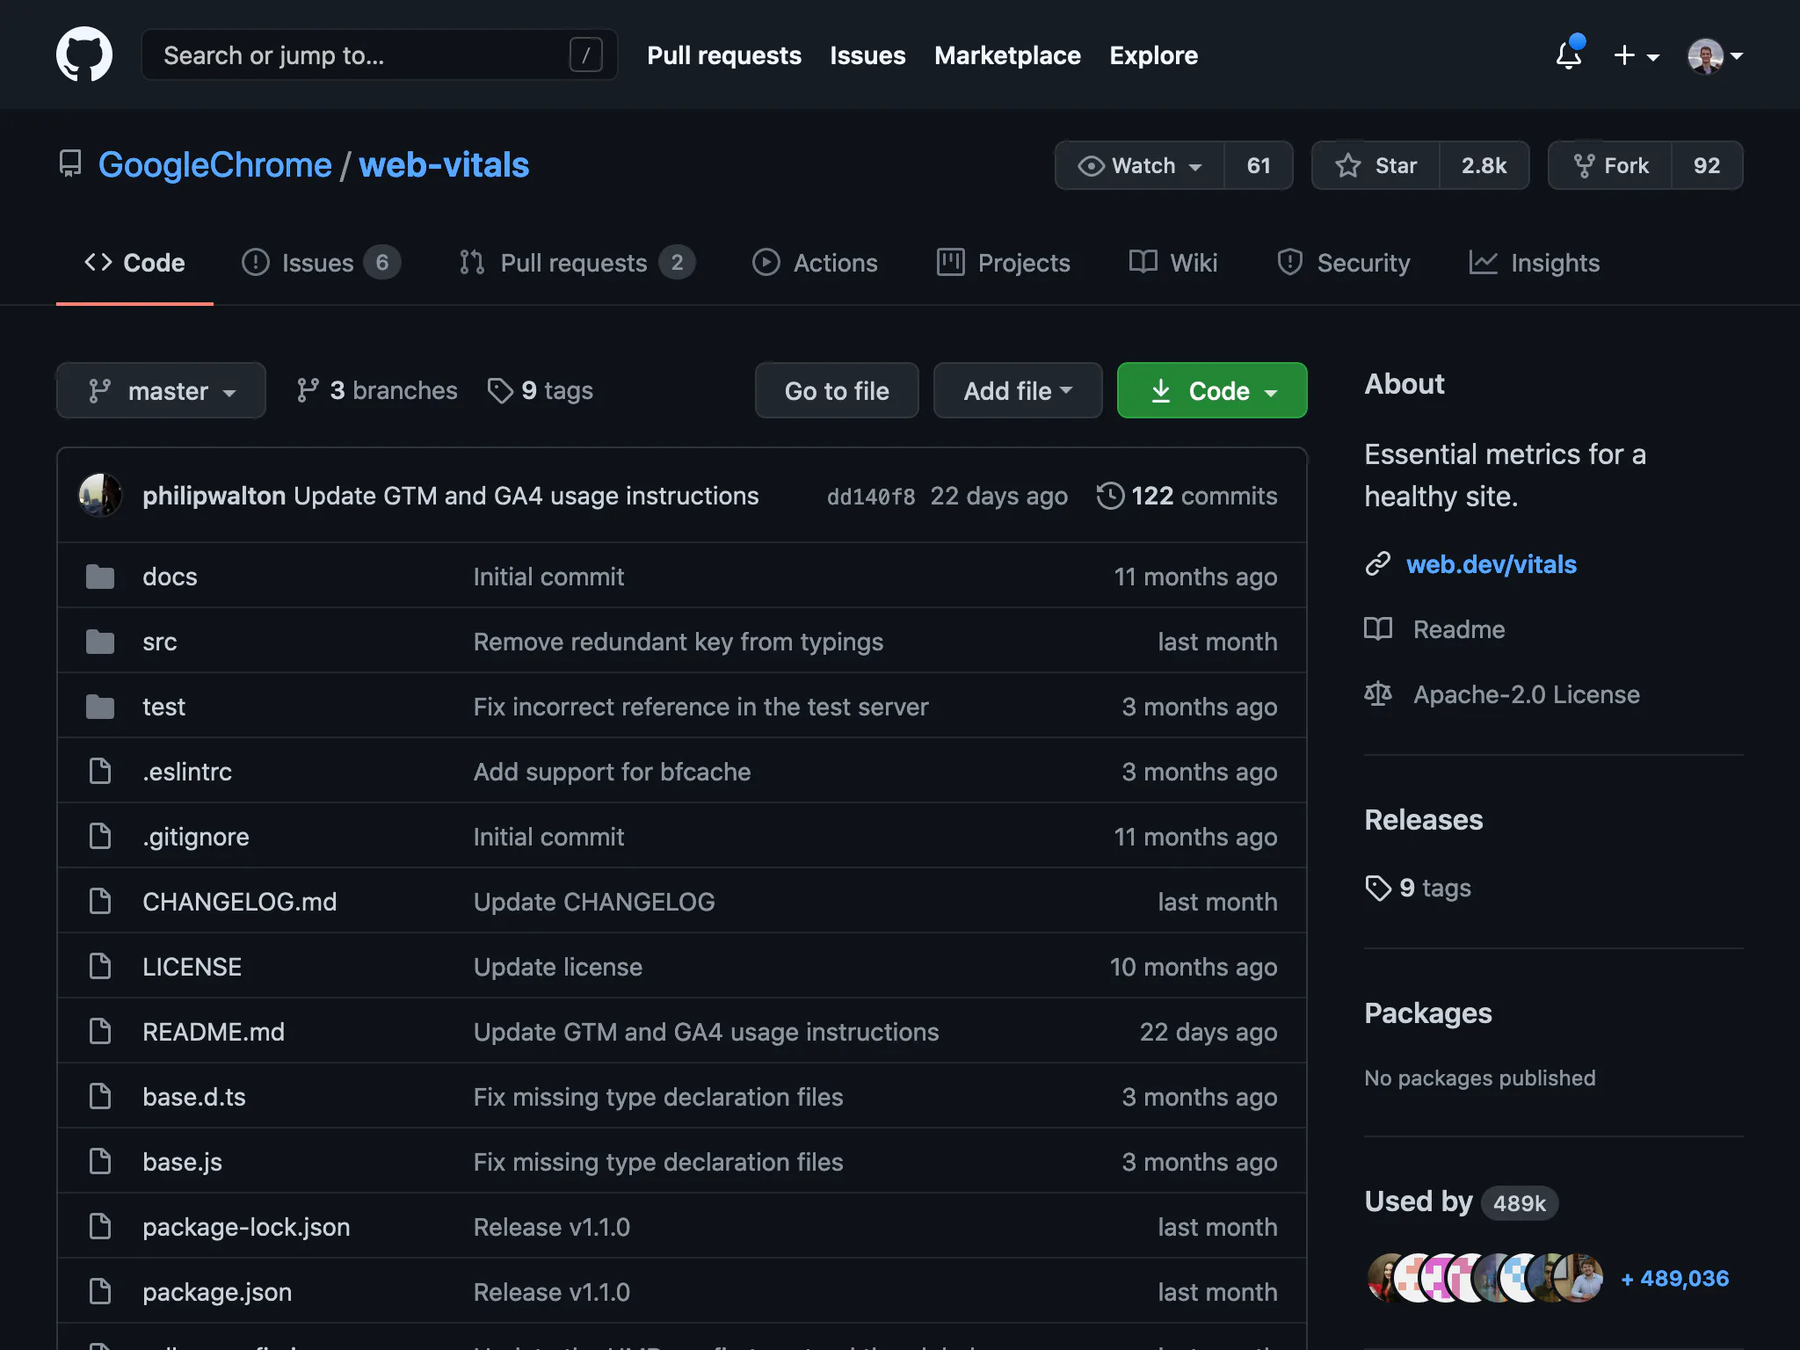
https://github.com/GoogleChrome/web-vitals
import webVitals from 'web-vitals';

webVitals.getTTFB(sendToAnalytics);
webVitals.getFCP(sendToAnalytics);
webVitals.getLCP(sendToAnalytics);
webVitals.getFID(sendToAnalytics);
webVitals.getINP(sendToAnalytics);
webVitals.getCLS(sendToAnalytics);

export const sendToAnalytics =
data => navigator.sendBeacon('/analytics', JSON.stringify(data));import { Summary } from 'prom-client';
const ttfb = new Summary({ name: `ttfb`, labelNames: [`path`] });
const fcp = new Summary({ name: `fcp`, labelNames: [`path`] });
const lcp = new Summary({ name: `lcp`, labelNames: [`path`] });
const fid = new Summary({ name: `fid`, labelNames: [`path`] });
const inp = new Summary({ name: `inp`, labelNames: [`path`] });
const cls = new Summary({ name: `cls`, labelNames: [`path`] });express()
.post(`/analytics`, (req, res) => {
const { path, body: { metric, value } } = req;
switch (metric) {
case `TTFB`: ttfb.labels(path).observe(value); break;
case `FCP`: fcp.labels(path).observe(value); break;
case `LCP`: lcp.labels(path).observe(value); break;
case `FID`: fid.labels(path).observe(value); break;
case `INP`: inp.labels(path).observe(value); break;
case `CLS`: cls.labels(path).observe(value); break;
}
res.status(200).send({});
})
.listen(8000);
Amazon S3
Snowflake
POST /analytics
Analytics Service
👍 Near real-time continuous monitoring
👍 Free open source tooling
👎 Ongoing maintenance cost
👎 Almost certainly a bad idea
✅ User-Centric Performance
✅ Capture Metrics from End User Devices
✅ Continuous Monitoring
Progressive Performance (Chrome Dev Summit 2016) - Alex Russel
The Mobile Web: MIA - Alex Russel
The Performance Inequality Gap, 2023 - Alex Russel
The Baseline for Web Performance in 2022 - Line Engineering Blog
Timing for bringing page experience to Google Search - Google Search Central Blog
Dark Silicon and the end of multicore scaling - IEEExplore
Speed Test Global Index - United States
Fast Load Times: Techniques for improving page load experience - web.dev
Site Speed Topography - CSS Wizardry
Measure What You Impact, Not What You Influence - CSS Wizardry
https://developers.google.com/web/tools/lighthouse
https://calibreapp.com/features/pull-request-reviews
https://developers.google.com/web/tools/chrome-user-experience-report
https://calibreapp.com/tools/core-web-vitals-checker
https://github.com/GoogleChrome/web-vitals
https://macklin.me/7-useful-tools-for-monitoring-web-performance-user-experience
By Macklin Hartley
I presented this talk at DDD Perth 2022. Watch the talk here; https://macklin.me/talk-how-fast-is-your-website-really


