AustinJS
May 21st, 2013
Intro to d3.js & data visualizations
A few slides, then some "live" coding, then we'll dig into one of the best data visualizations that I know about.
by Mark DiMarco
d3.js
data driven documents
d3.js is an open source modern javascript library aimed at turning data into highly interactive visualizations.
It was created by this guy,

Mike Bostock (@mbostock). He works for the New York Times.
How it works
d3.js takes in an arrays of JSON and spits out gobs
of SVG elements.
[{id: 3, value: 200}, {id: 2, value: 201}] ⇓
<svg><g><circle r="200"></circle><circle r="201"></circle></g></svg>
Which in turn can look like this
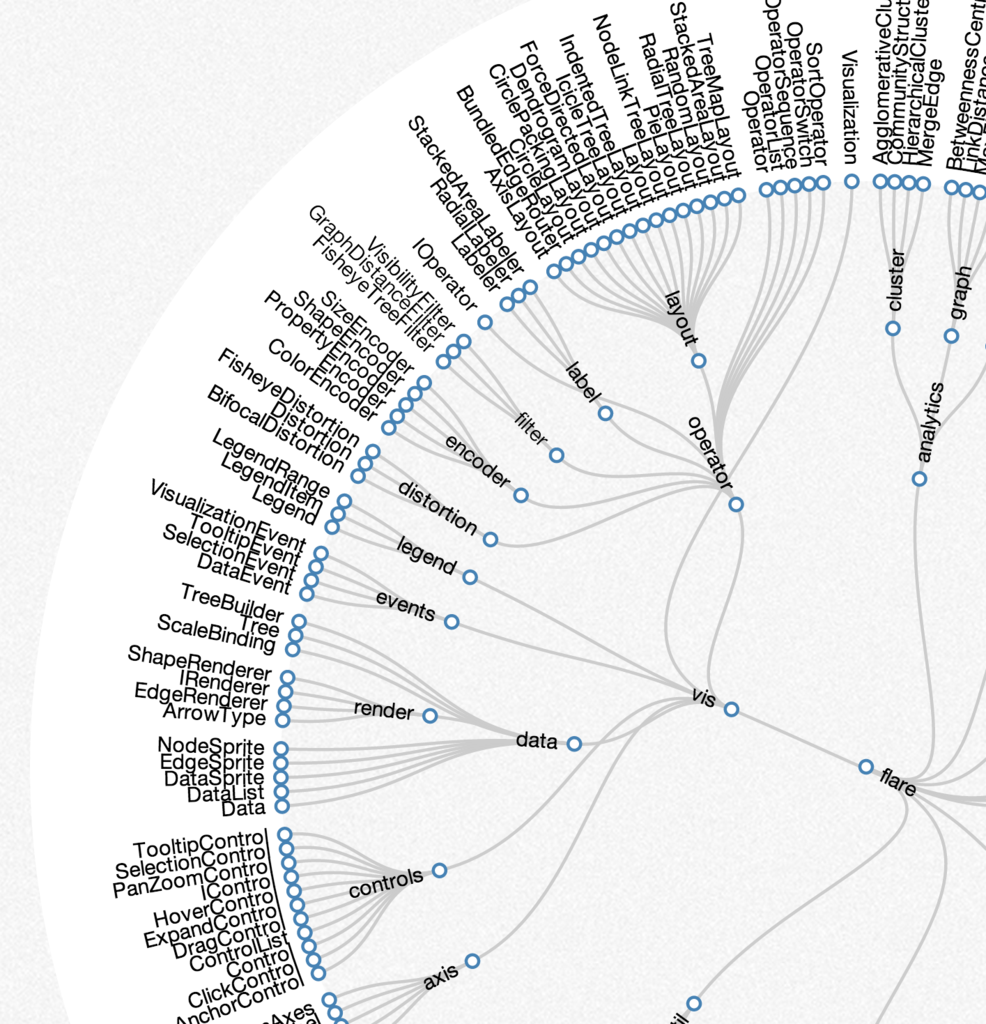
or this
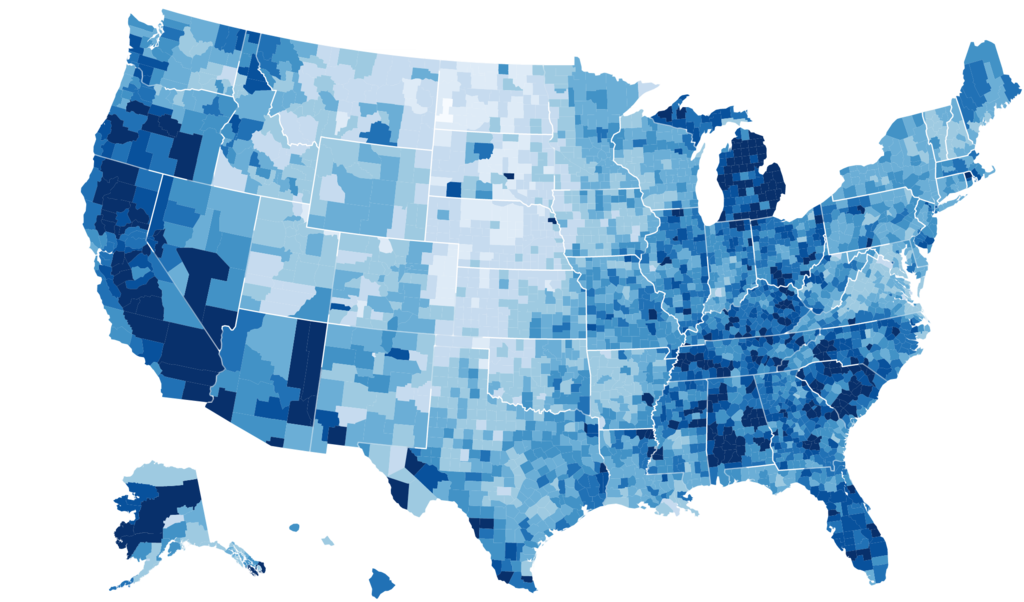
or this
What is SVG?
scalable vector graphics
 <!DOCTYPE html><html lang="en-us">
  <head>
    <meta charset="utf-8">
    <title>SVG</title>
  </head>
  <body>
    <h1>SVG Circle Example</h1>
    <svg width=500 height=500>
      <circle r=200 cx=250 cy=250 stroke=#fa0fa0 fill=#bada55></circle>
    </svg>
  </body>
</html>
SVG is just another DOM element.
SVG elements living natively inside the DOM is awesome because...
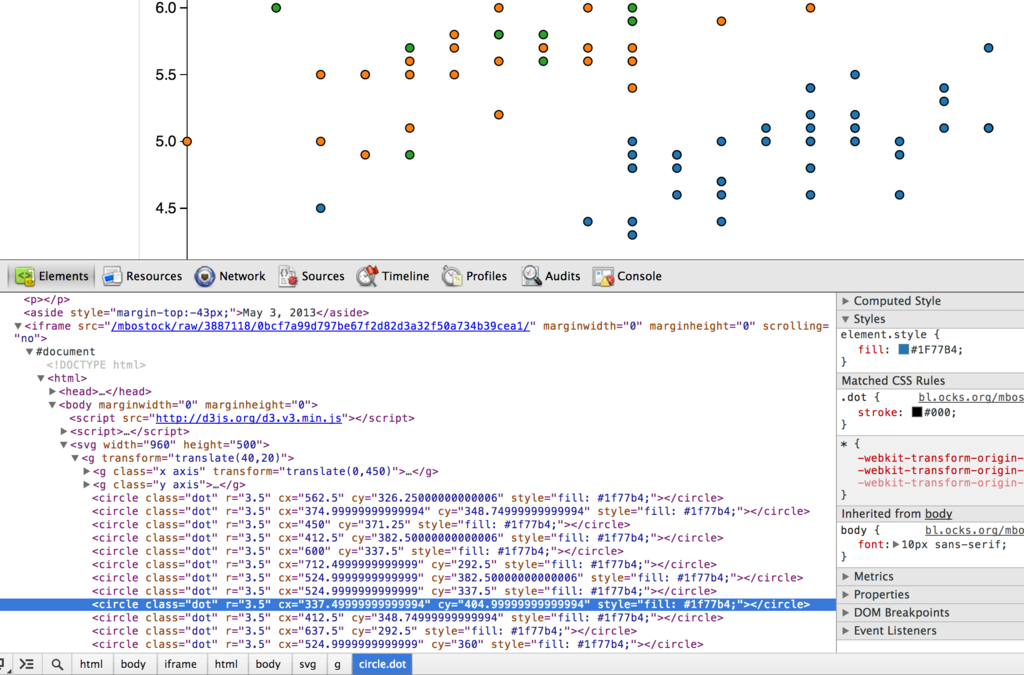
It's debuggable using the tools you already know.
SVG can also be styled by regular CSS.
path {fill: #222;stroke: #bad;stoke-width: 1px;}line, circle, rect {fill: none;}
d3.js is often compared to:
- Raphael
- Three.js
- Highcharts
- Processing.js
- Protoviz
but...
d3.js is very similar to jQuery
d3.js can be used in place of jQuery for many standard tasks.
d3.select(".someclass").style("color", "#fa0fa0");
d3.json("/mydata.json", function(data) { ... });
d3.selectAll(".classy").on("click", function() { ... });- Event handling
- AJAX
- DOM manipulation
- Animation
-
Many underscore.js functions
It also performs a load of other tasks.
- basic DOM based data management
- interlopes 0..1 to #000..#FFF (or any other 2 colors)
- computes areas of drawn elements (& more geometry)
- projects GPS coords into a map (& more geography)
- date/time functionality
- converts raw CSV to usable data
- supports dozens of visualizations out of the box
- random number generation with custom distributions
- timers/intervals
- and many more.
Let's code for a bit
-_-
d3.js
By markmarkoh


