Whatever Happened To Those Dinosaurs?
by Mark DiMarco for Dinosaur.js
I'm Mark
Engineer @ data.world
from Austin, TX
Today we'll be making a full page data visualization
We'll be covering:
D3.js
Dinosaur Extinctions
Data Scraping
Drawing.
Loading.
Scraping.
Why?
Scaling.
Drawing.
Scaling.
367943 Duende
Why Asteroids?
aka
2012 DA14
Title Text
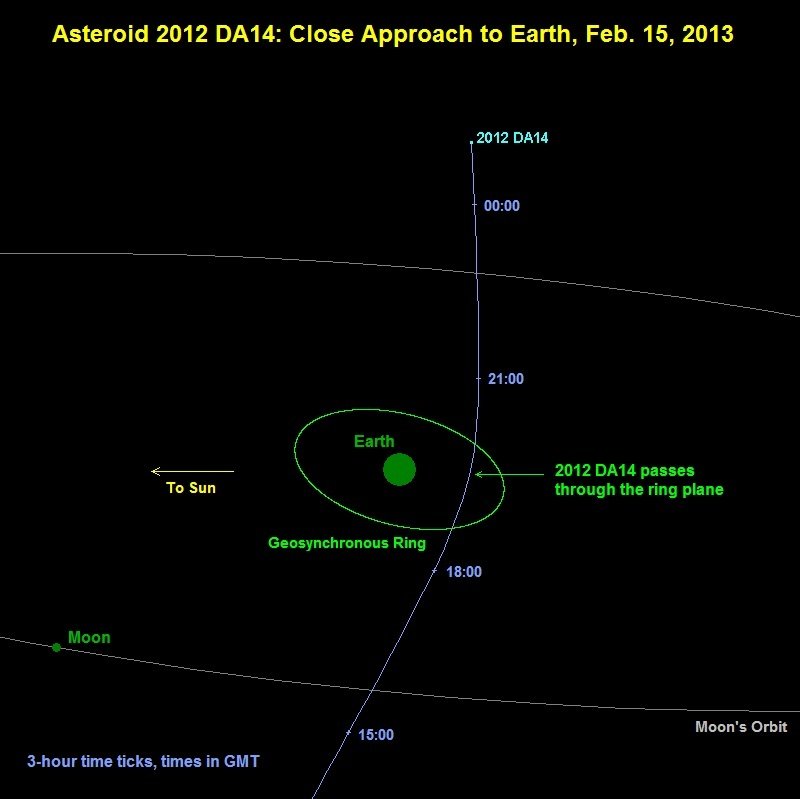
According to NASA scientists, the trajectory of the Russia meteor was significantly different than the trajectory of the asteroid 2012 DA14, making it a completely unrelated object.
- NASA Press Release
Drawing.
Loading.
Scraping.
Why?
Scaling.
Drawing.
Scaling.
// Import needed libraries, set fetch URL
var request = require('request');
var cheerio = require('cheerio');
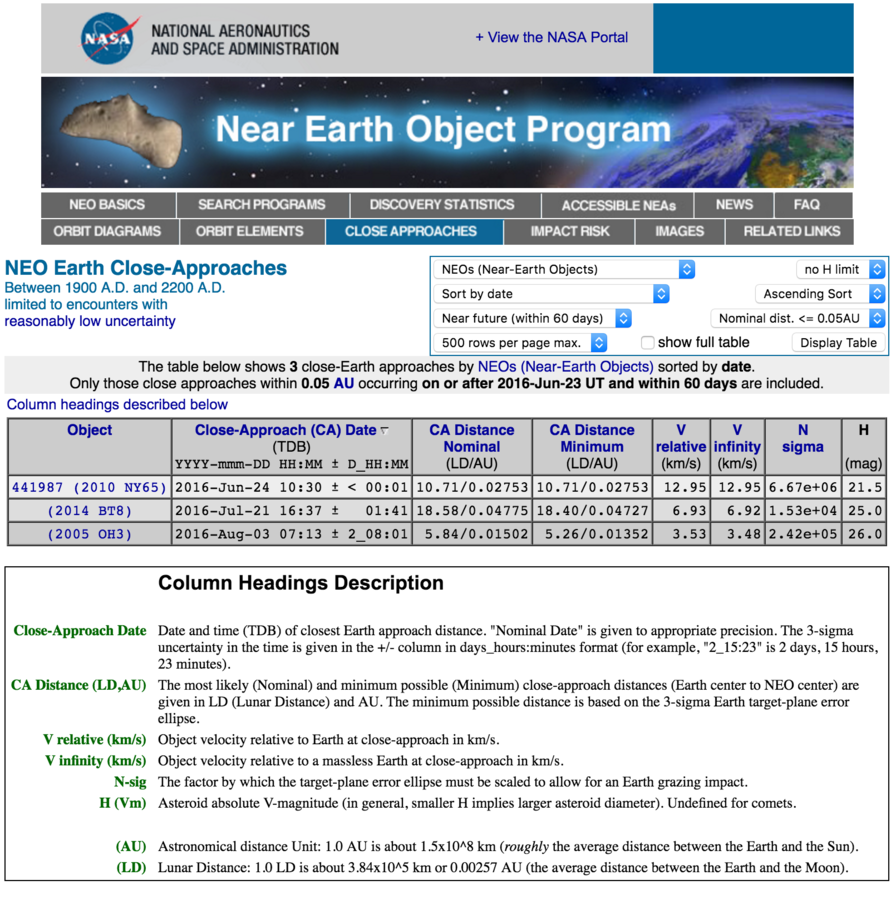
var url = 'http://neo.jpl.nasa.gov/cgi-bin/neo_ca?type=NEO;hmax=all;tlim=far_past;dmax=0.05AU;max_rows=500;fmt=full;action=Display%20Table;show=1&sort=dist&sdir=ASC';
Data Scraping
// Execute request, download contents, load into Cheerio
request(url, function(error, response, body) {
  var $ = cheerio.load(body.data);
  var tableData = convertTableToCsv($)
  printTableData(tableData);
})
// Find the right table, iterate through rows(TR) and columns(TD)
function convertTableToCsv($) {
var data = [];
$($('table')[12]).find('tr').each(function(idx, tr) {
var row = [];
$(tr).find('td').each(function(idx, td) {
row.push( $(td).text().trim() );
});
data.push(row);
});
return data;
}// Print data to stdout
function printTableData(data) {
var csv = '';
data.forEach(function(row) {
csv += row.join(',');
csv += '\n';
});
console.log(csv);
}
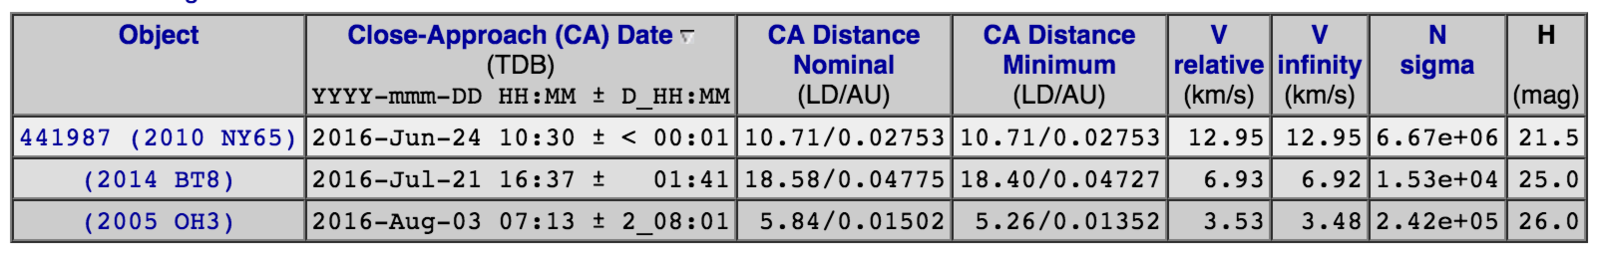
Object,Close-Approach (CA) Date (TDB)YYYY-mmm-DD HH:MM ± D_HH:MM,CA DistanceNominal(LD/AU),CA DistanceMinimum(LD/AU),Vrelative(km/s),Vinfinity(km/s),Nsigma,H(mag),ref,class
(2016 MA),2016-Jun-19 04:34 ±,2.60/0.00669,2.60/0.00667,8.88,8.84,754,27.3,1,APO*
(2016 LV51),2016-Jun-19 23:46 ±,17.23/0.04426,17.11/0.04397,10.90,10.89,305,25.2,1,APO*
(2009 CV),2016-Jun-20 01:31 ±,12.40/0.03186,12.40/0.03186,4.69,4.67,2.19e+05,24.3,26,APO*
(2004 TE10),2016-Jun-20 13:15 ±,17.66/0.04537,17.66/0.04537,14.05,14.05,7.44e+04,24.2,11,APO*
441987 (2010 NY65),2016-Jun-24 10:30 ±,10.71/0.02753,10.71/0.02753,12.95,12.95,6.67e+06,21.5,44,ATE*
(2014 BT8),2016-Jul-21 16:37 ±   01:41,18.58/0.04775,18.40/0.04727,6.93,6.92,1.53e+04,25.0,7,ATE*
(2005 OH3),2016-Aug-03 07:13 ± 2_08:01,5.84/0.01502,5.26/0.01352,3.53,3.48,2.42e+05,26.0,9,AMO*
(2009 ES),2016-Sep-05 19:25 ±,18.83/0.04838,18.82/0.04837,18.06,18.06,6.07e+04,20.5,21,APO*
(2015 KE),2016-Sep-10 08:11 ±   00:29,14.92/0.03835,14.88/0.03823,2.16,2.13,5.04e+03,26.4,10,ATE*
(2016 LX48),2016-Sep-13 09:37 ±   17:47,18.09/0.04648,16.40/0.04214,10.88,10.87,95.3,19.1,2,APO*
(2015 DS53),2016-Sep-22 00:35 ±   03:11,19.33/0.04966,16.43/0.04221,12.93,12.92,1.28e+04,24.1,11,APO*
(2015 SO2),2016-Sep-30 00:17 ±   00:04,17.23/0.04427,16.83/0.04325,6.08,6.07,1.04e+04,23.9,13,ATE*
(2009 UG),2016-Sep-30 05:32 ± 1_03:32,7.33/0.01884,4.81/0.01236,8.89,8.88,2.71e+04,23.2,13,ATE*
Drawing.
Loading.
Scraping.
Why?
Scaling.
Drawing.
Scaling.
<html>
<body>
  <svg id="asteroids"></svg>
  <script src="http://d3js.org/d3.v3.min.js"></script>
  <script>
     /** Code starts here **/
  </script>
</body>
</html>
<html>
<body>
<svg id="asteroids"></svg>
<script src="http://d3js.org/d3.v3.min.js"></script>
<script>
d3.csv('asteroids.csv')
.get(function(err, asteroids) {
console.log(asteroids)
/*
[
{"Object": "(2016 MA)", "H(mag)": "27.2", "Close-Approach (CA) Date (TDB)": "2016-Jun-19 04:34 ± 0:01" ...},
{"Object": "(2016 LV51)", "H(mag)": "25.2", "Close-Approach (CA) Date (TDB)": "2016-Jun-19 23:46 ± 0:01" ...},
]
*/
})
</script>
</body>
</html><html>
<body>
<svg id="asteroids"></svg>
<script src="http://d3js.org/d3.v3.min.js"></script>
<script>
var parseDate = d3.time.format("YYYY-MMMM-DD HH:mm").parse;
d3.csv('asteroids.csv')
.row(function(row) {
return {
h: +d["H(mag)"],
name: d["Object"],
ldMinimum: +(d["CA DistanceMinimum(LD/AU)"].split("/")[0]),
ldNominal: +(d["CA DistanceNominal(LD/AU)"].split("/")[0]),
closeApproach: parseDate(d["Close-Approach (CA) Date (TDB)YYYY-mmm-DD HH:MM ± D_HH:MM"].split("±")[0])
}
})
.get(function(err, asteroids) {
console.log(asteroids)
/*
[
{"name": "(2016 MA)", "closeApproach": 1466378950511, "h": 27.2 ...},
{"name": "(2016 LV51)", "closeApproach": 1466378962134, "h": 25.2 ...},
]
*/
})
</script>
</body>
</html>Drawing.
Loading.
Scraping.
Why?
Scaling.
Drawing.
Scaling.
// continued from the fetching of the csv
.get(function(err, asteroids) {
drawAsteroids(asteroids)
})
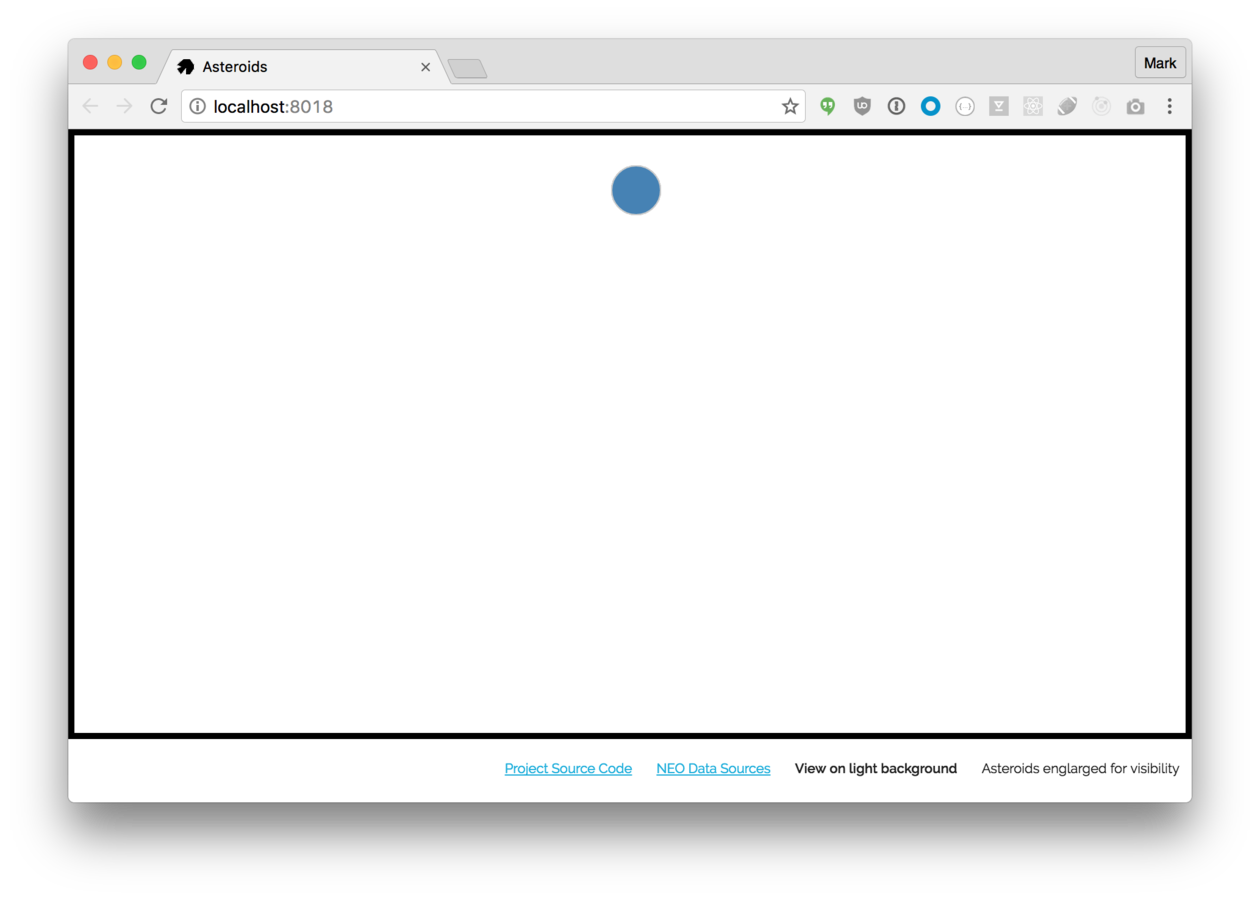
var svg = d3.select("svg").attr("height", 500).attr("width", 500)
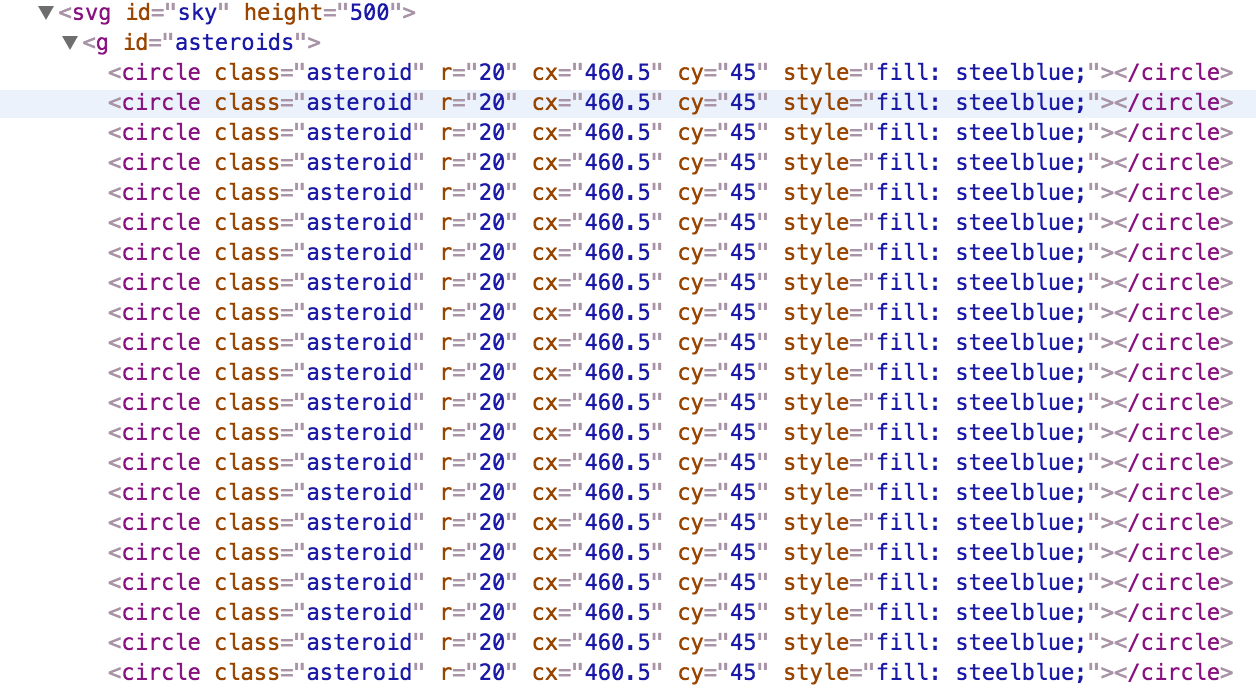
function drawAsteroids(asteroids) {
svg
.append("g")
.attr("id", "asteroids")
.selectAll(".asteroid")
.data(asteroids)
.enter()
.append("circle")
.attr("class", "asteroid")
.attr("r", 20)
.style("fill", "steelblue")
.attr("cx", width / 2)
.attr("cy", 45)
}
  // continued from the fetching of the csv
  .get(function(err, asteroids) {
      drawAsteroids(asteroids)
})

var svg = d3.select("svg").attr("height", 500).attr("width", 500)

function drawAsteroids(asteroids) {
  svg
    // Add a <g> grouping tag
    .append("g")
    // Set the ID in case we need it later
    .attr("id", "asteroids")
    // Make a d3 selection (initially empty)
    .selectAll(".asteroid")
    // Add our asteroids data to the selection
    .data(asteroids)
    // For each data point
    .enter()
      // Append a <circle> element
      .append("circle")
        // Set the classname
        .attr("class", "asteroid")
        // Set an arbitrary radius & color
        .attr("r", 20)
        .attr("cx", width / 2)
        .attr("cy", 45)
        .style("fill", "steelblue")
}
Drawing.
Loading.
Scraping.
Why?
Scaling.
Drawing.
Scaling.
Scaling is one of D3's most powerful features.
It helps translate numbers from the data's domain...
...to coordinates for your user's viewport.
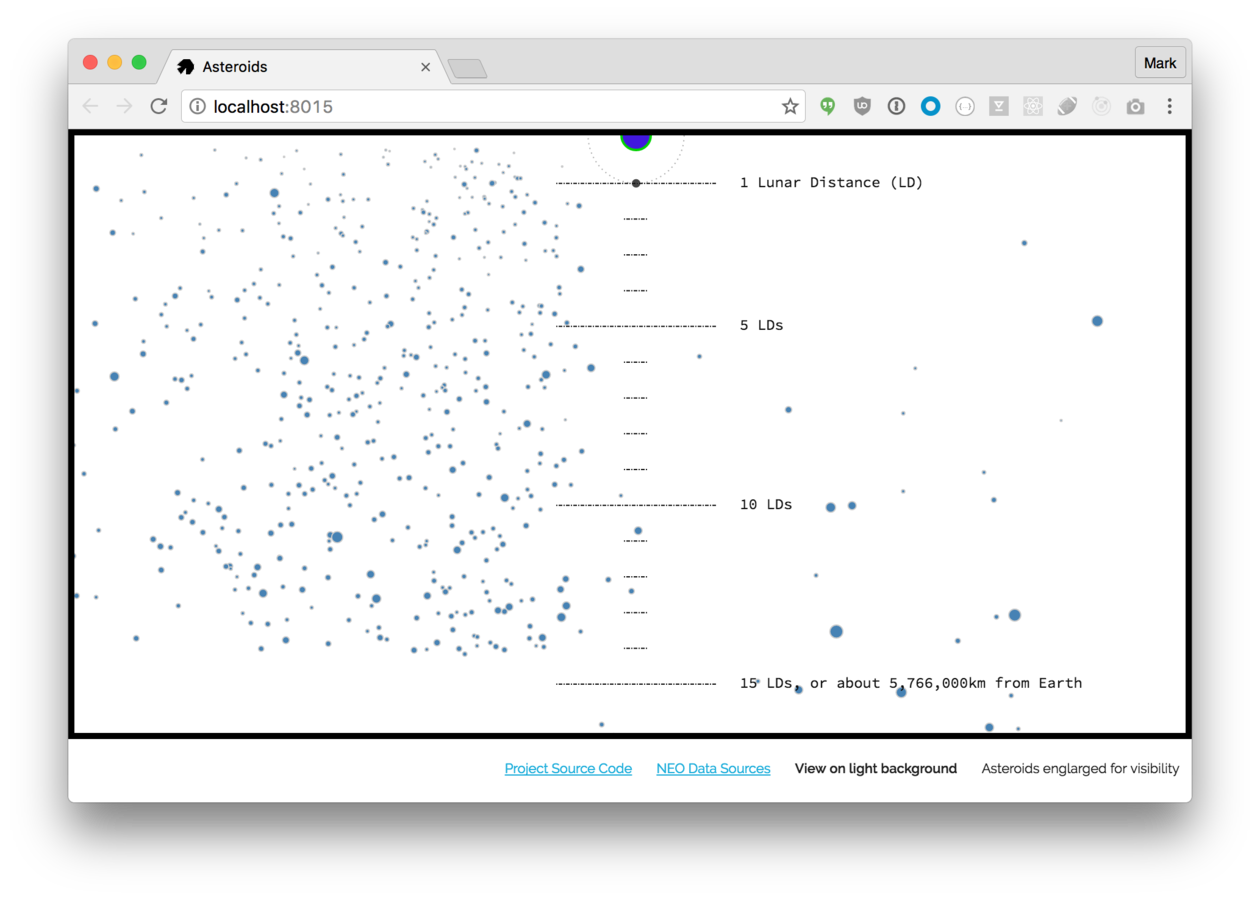
\text{1 Lunar Distance} \approx 384,400km
\text{So, 8.5 LDs} \approx 3,267,400km
\text{Given a 500 pixel high screen}
\text{Where} (0,0) = 0 LDs \text{ and } (0,500) = 10 LDS
\text{Solve for 8.5 LDS}
// Set some constants
const LUNAR_DISTANCE = 384400
const MAX_LDS = 15
const height = 500

// Create a scaling function for lunar distances
const lunarDistance = d3.scale.linear()
  .domain([0, MAX_LDS * LUNAR_DISTANCE])
  .range([10, height - 10]);

// We've mapped values from the domain range 0 to 5,766,000
// to the user's viewport range of 10 to 490


assert( lunarDistance(0) === 10 )
assert( lunarDistance( 5766000) === 490 )
assert( lunarDistance(8.5 * LUNAR_DISTANCE) === 259.33 )
const LUNAR_DISTANCE = 384400
const MAX_LDS = 15
// Create a scaling function for lunar distances
const lunarDistance = d3.scale.linear()
.domain([0, MAX_LDS * LUNAR_DISTANCE])
.range([10, height - 10]);
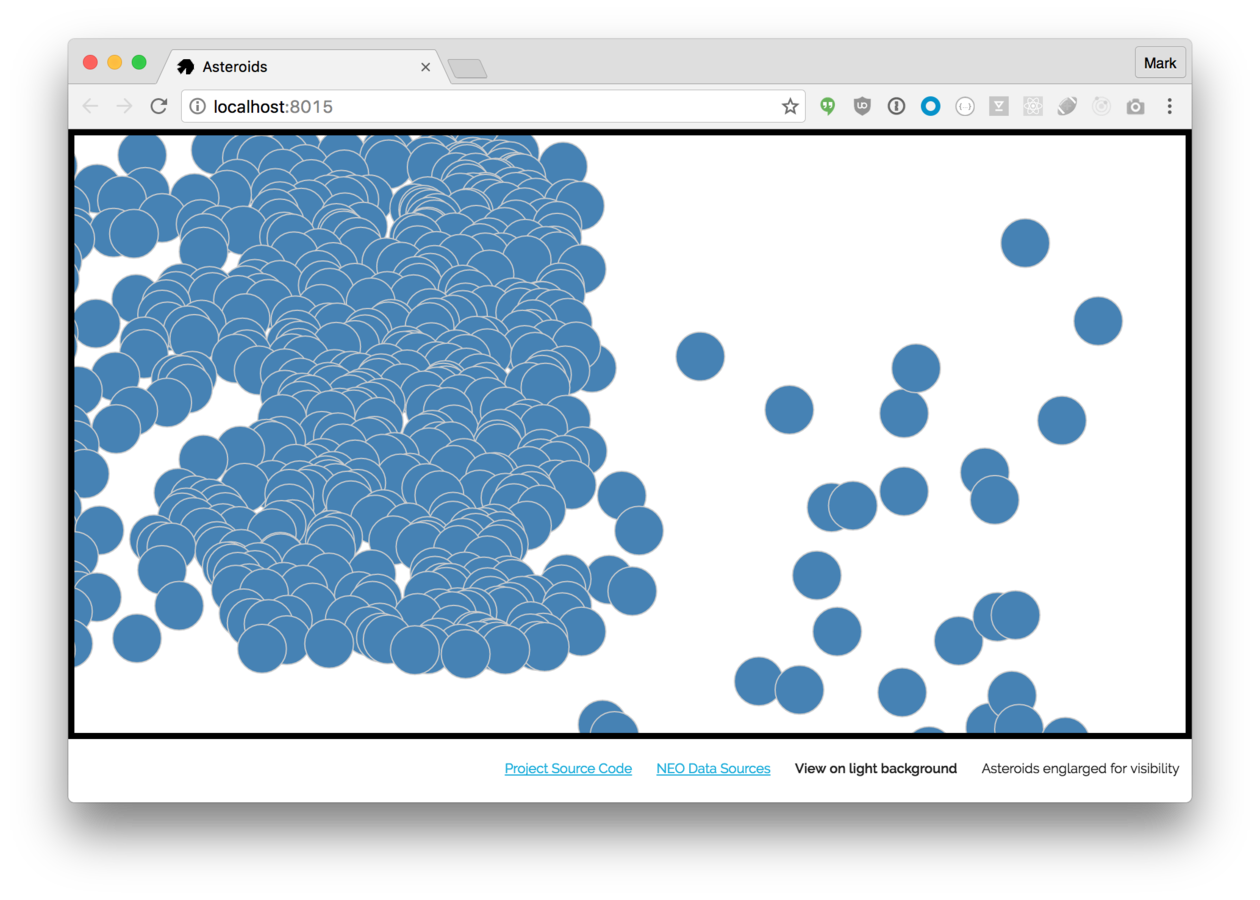
function drawAsteroids(asteroids) {
svg
.append("g")
.attr("id", "asteroids")
.selectAll(".asteroid")
.data(asteroids)
.enter()
.append("circle")
.attr("class", "asteroid")
.attr("r", 20)
.attr("cx", width / 2)
.attr("cy", function(d) {
return lunarDistance(d.ldNominal * LUNAR_DISTANCE)
})
.style("fill", "steelblue")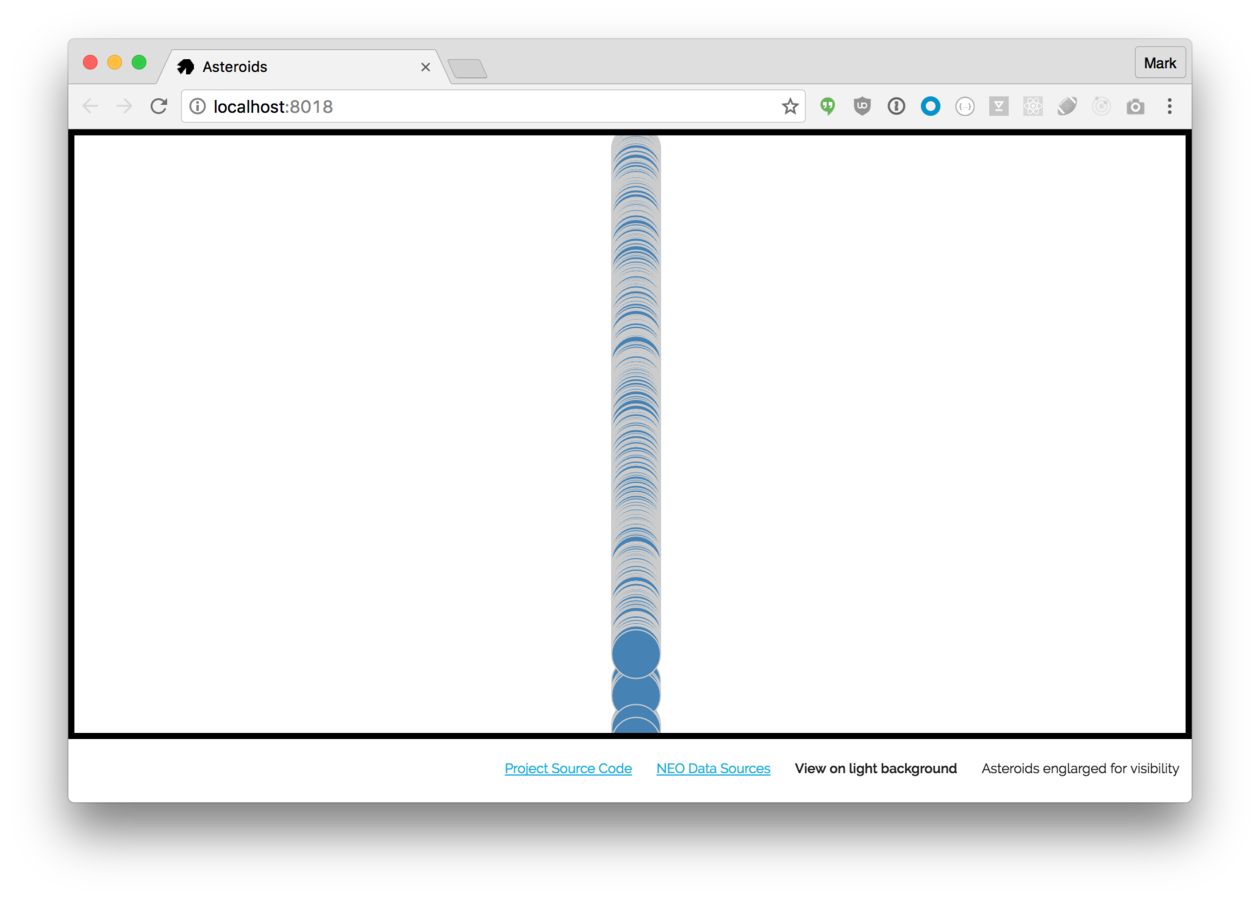
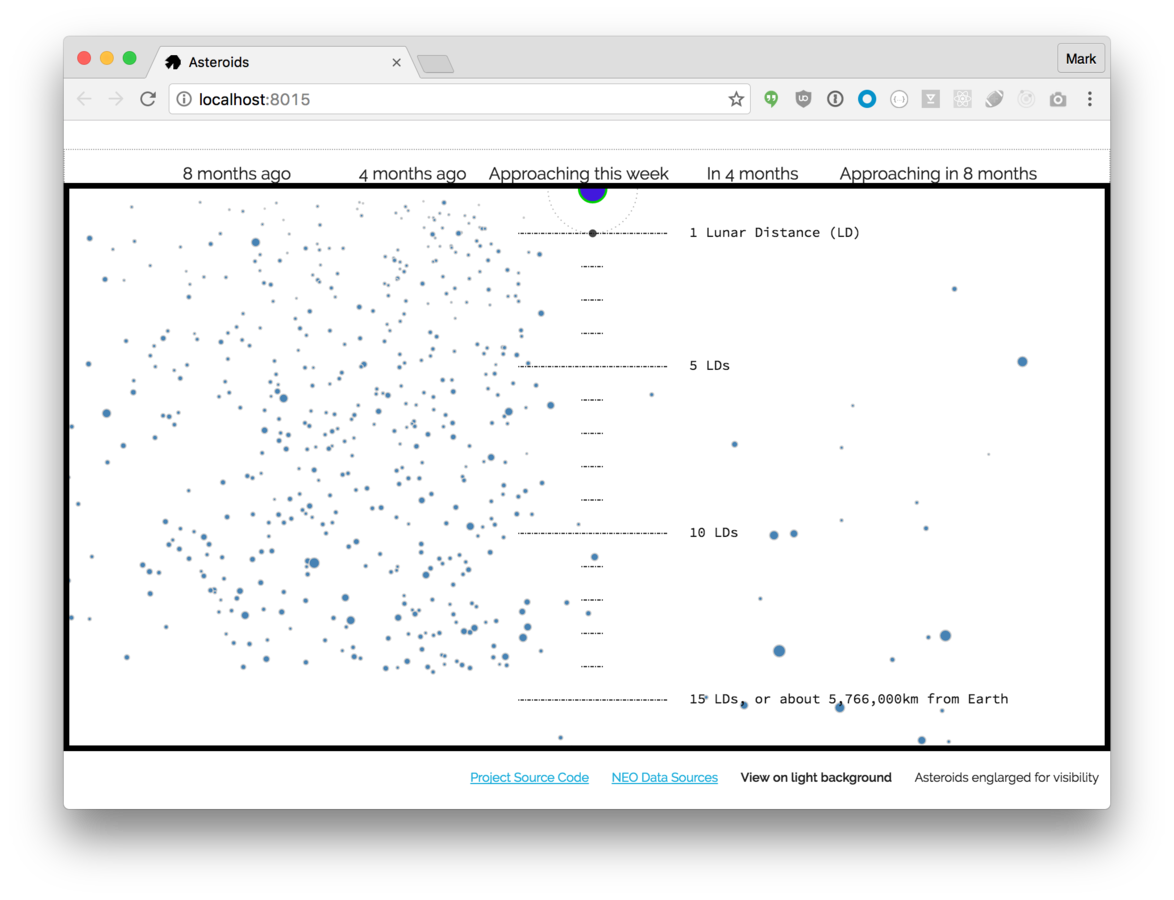
\text{Today's date} \approx \text{June 24, 2016}
\text{8.5 months ago} \approx \text{October 8, 2015}
\text{Given a 500 pixel wide screen}
\text{Where (0, 0) = 1 year ago}
\text{Solve for 8.5 months ago}
\text{ and (500, 0) = 1 year in the future}
// Set some constants
const width = 500;
const date = new Date();

// Create our scale
const timeScale = d3.time.scale()
  .domain([d3.time.year.offset(date, 1),  d3.time.year.offset(date, -1)])
  .rangeRound([width, 0]);

// Today's date should be right in the middle
assert( timeScale(new Date()) === 250 )

// One year behind, one year ahead
assert( timeScale(new Date('June 24, 2015')) === 0 )
assert( timeScale(new Date('June 24, 2016')) === 500 )

// About 8.5 months ago
assert( timeScale(new Date('October 8, 2015')) === 73.1 )
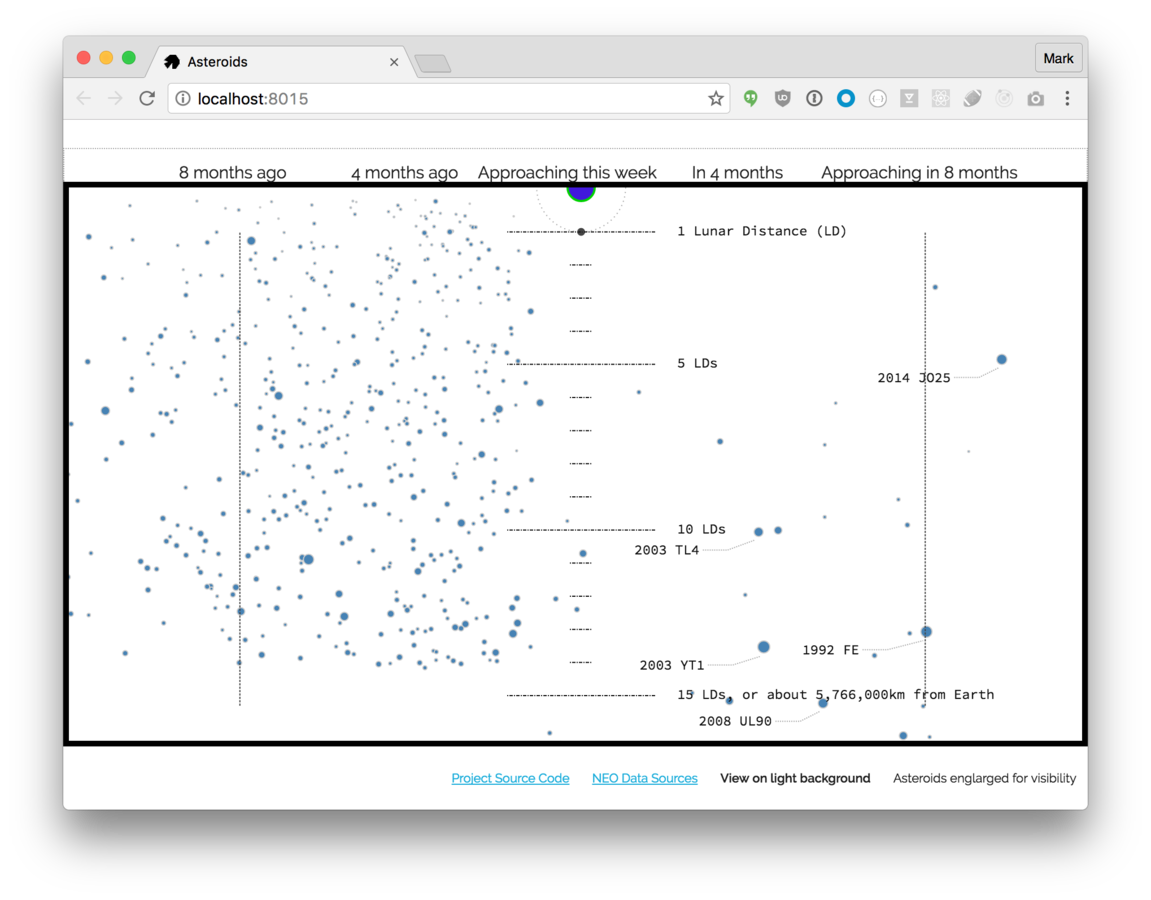
\text{H Magnitude represents asteroid diameter}
\text{Smaller H values mean larger asteroids}
\text{From the range of .75 pixels to 7 pixels}
\text{Where a H value of 30 = .75 pixels}
\text{Solve for an H value of 23.43}
\text{ and a H value of 17 = 7 pixels}
// Instead of a linear scale, we can use a logarithmic scale
const sizeScale = d3.scale.log()
  .domain([30, 17])
  .range([0.75, 7]);


// Smallest asteroid in our domain
assert( sizeScale(30) === 0.75 )

// Largest asteroid we've seen
assert( sizeScale(17) === 7 )

// An asteroid with an H value of 23.42 should be rendered at 3.4746 pixels
assert( sizeScale(23.42) === 3.4746256837631755 )
// Add the size scale
const sizeScale = d3.scale.log()
.domain([30, 17])
.range([0.75, 7]);
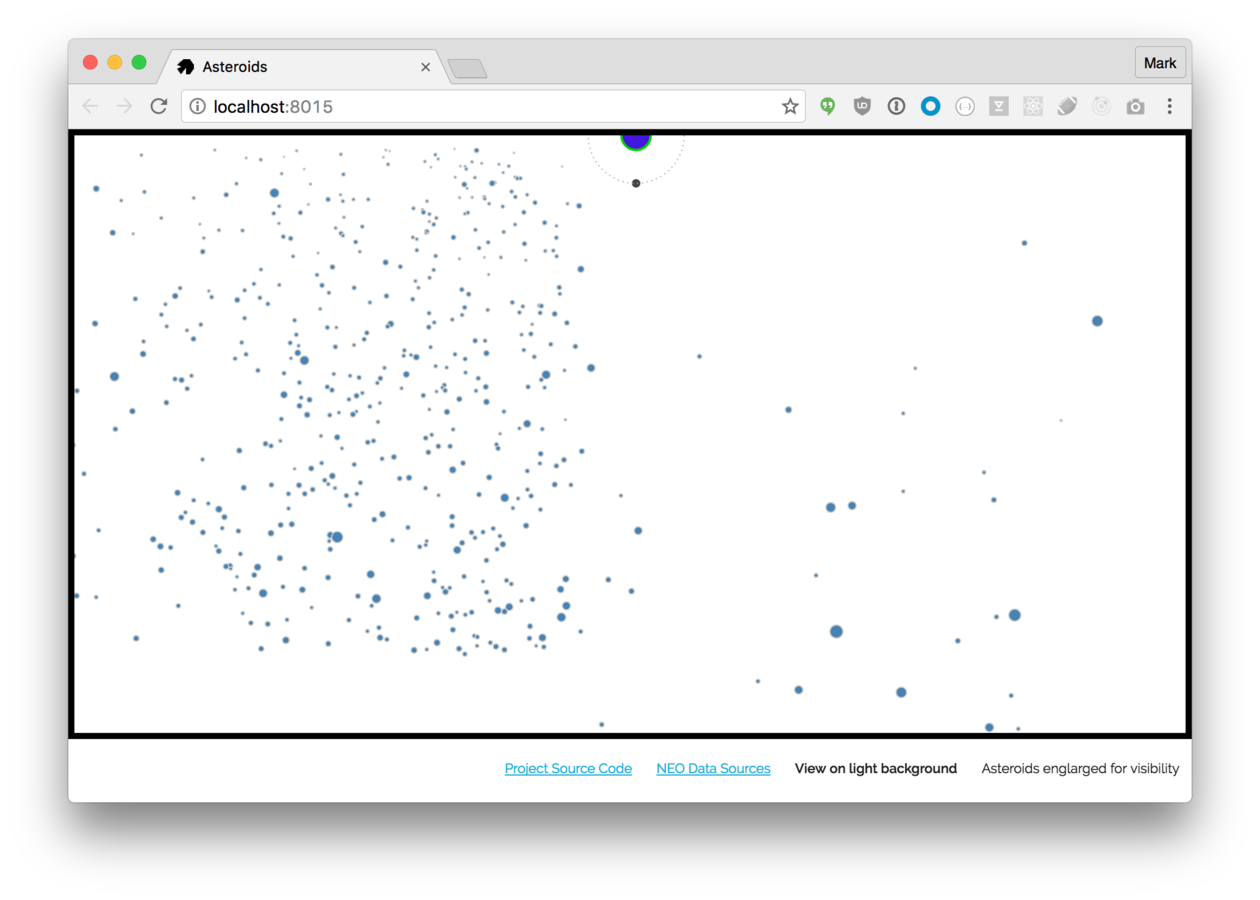
function drawAsteroids(asteroids) {
svg
.append("g")
.attr("id", "asteroids")
.selectAll(".asteroid")
.data(asteroids)
.enter()
.append("circle")
.attr("class", "asteroid")
// Set the radius
.attr("r", function(d) {
return sizeScale(d.h)
})
.attr("cx", function(d) {
return timeScale(d.closeApproach)
})
.attr("cy", function(d) {
return lunarDistance(d.ldNominal * LUNAR_DISTANCE)
})
.style("fill", "steelblue")
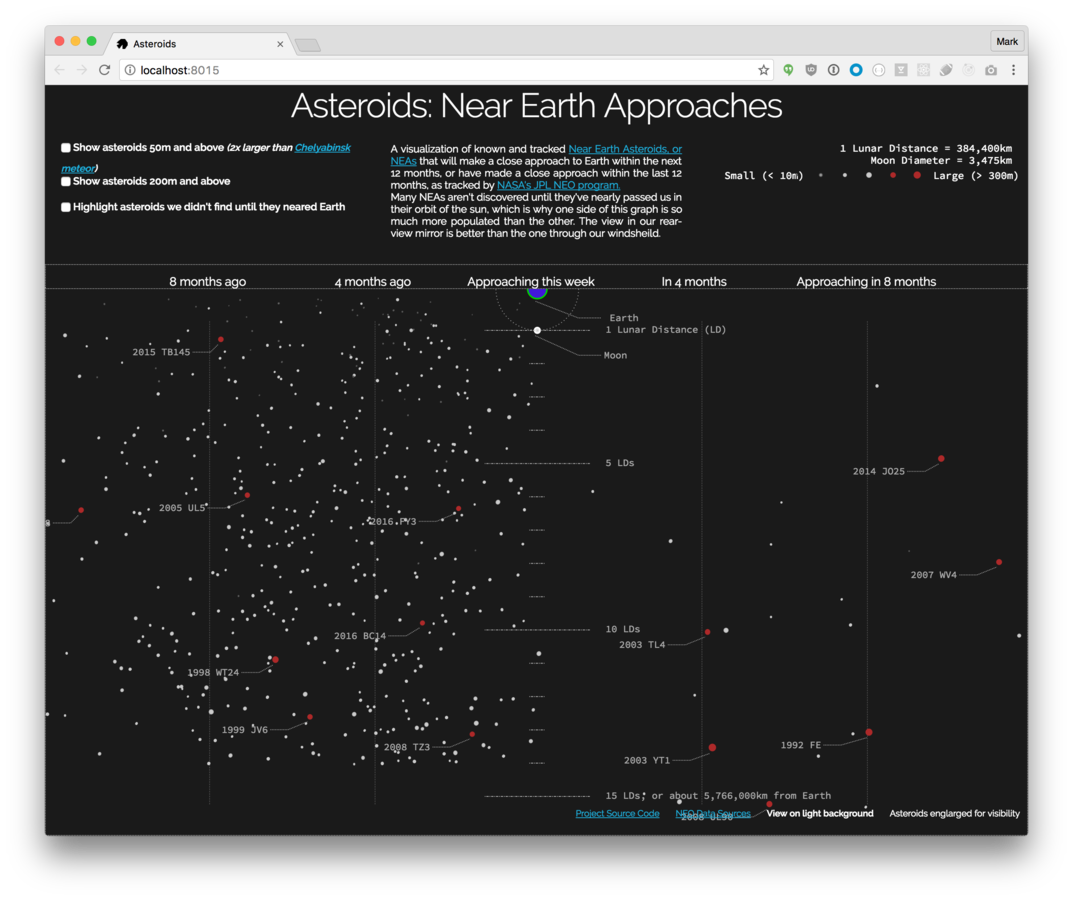
function drawEarthAndMoon() {
    var earthAndMoon = svg.append("g").attr("class", "earth-and-moon");

    // Add the Earth
    earthAndMoon.append("circle")
      .attr("class", "earth")
      .attr("r", 12)
      .attr("cx", width / 2)
      .attr("cy", 0)

    // Add the moon
    earthAndMoon.append("circle")
      .attr("class", "moon")
      .attr("r", 3.5)
      .attr("cx", width / 2)
      .style("fill", "#444")
      .attr("cy", lunarDistance(LUNAR_DISTANCE))

    // Add the moon's orbital line
    earthAndMoon.append("circle")
      .attr("class", "moon-orbit")
      .attr("r", lunarDistance(LUNAR_DISTANCE))
      .attr("cx", width / 2)
      .attr("cy", 0);
 }

github: markmarkoh/asteroids
Demo & Source Code
Thanks!
Whatever Happened To Those Dinosaurs?
By markmarkoh


