
\textbf{Naresh Kumar Devulapally}
\text{CSE 4/574: Intro to Machine Learning}
\text{From classical ML to Generative AI}
\text{Naresh Kumar Devulapally}
\text{Apr. 28, 2026}
\text{CSE 4/574: Machine Learning, Sp. 26}
\text{What is Generative AI?}

\( \text{Agenda of this Lecture:}\)
\text{July 10, 2025}
- Where does data come from?
- What is the structure of a data? What is a distribution?
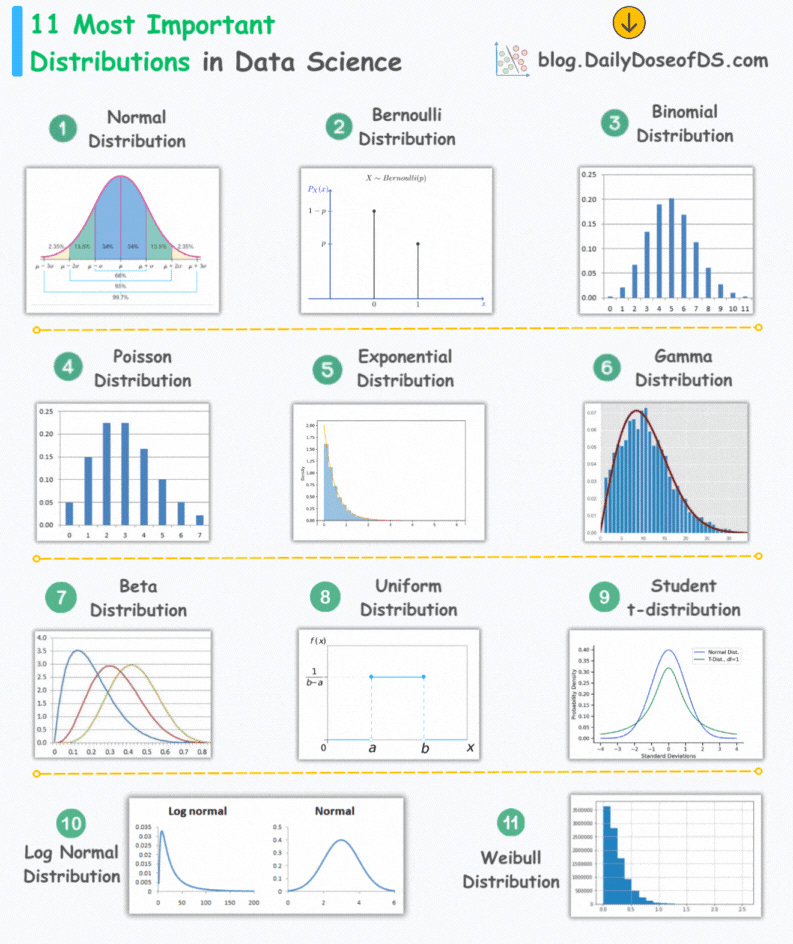
- Types of distributions
- Approximating a distribution
- Why Gaussian Distribution is ubiquitous?
- Bayes rule and Marginalization
- Images as data points
- Interpolation for data generation
- The power of Sampling
- The Gaussian Distribution
- Properties of Gaussian Distribution
- Variational AutoEncoders
- Quick intro to Diffusion Models
\text{March 31, 2026}
\text{CSE 4/555: Pattern Recognition, Sp. 26}
\text{Naresh Kumar Devulapally}
\text{Apr. 28, 2026}
\text{CSE 4/574: Machine Learning, Sp. 26}
\text{July 10, 2025}
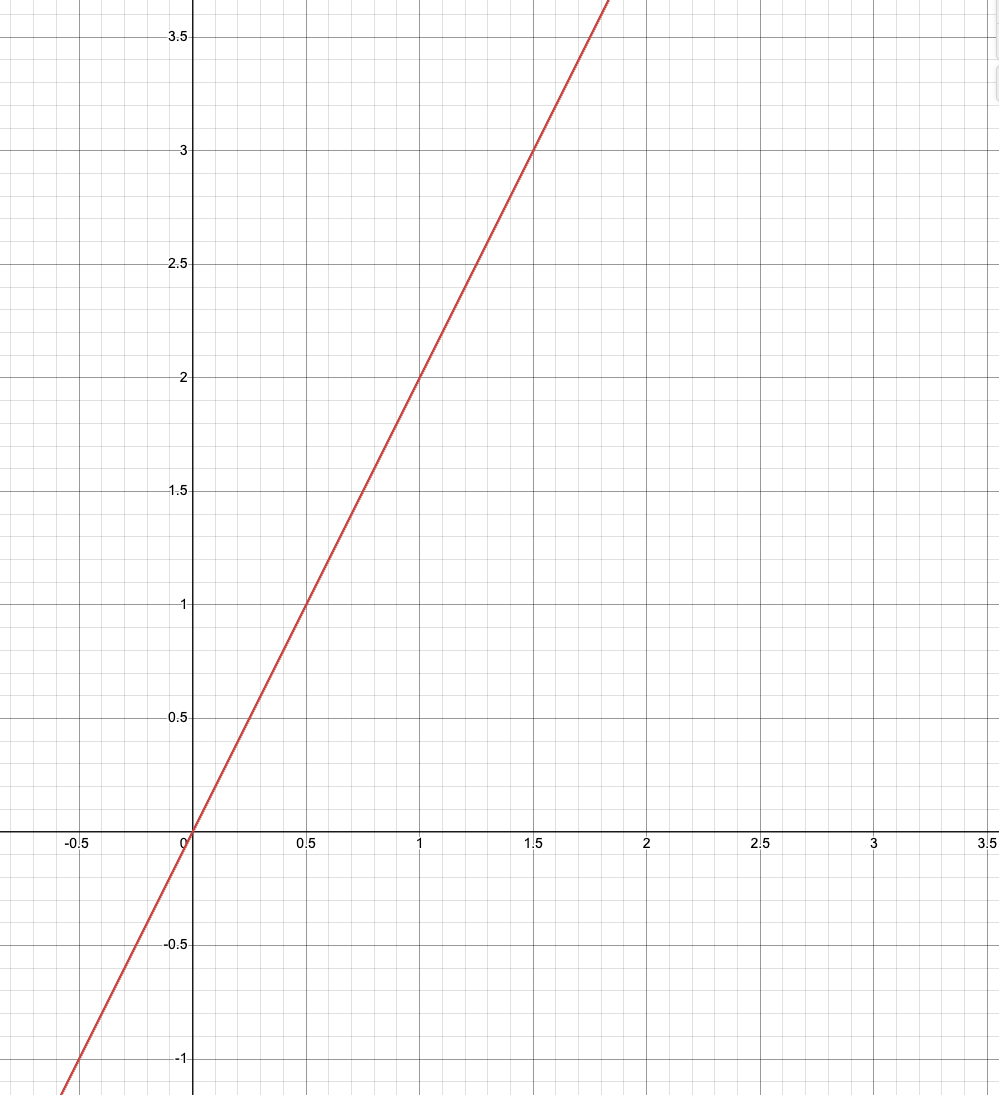
\text{Function Approximators. (Recap)}
y = f(x)
(1, 2)
(1.5, 3)
(-0.5, -1)
Let's say you are given a bunch of data points:
\text{March 31, 2026}
\text{CSE 4/555: Pattern Recognition, Sp. 26}
\text{Naresh Kumar Devulapally}
\text{Apr. 28, 2026}
\text{CSE 4/574: Machine Learning, Sp. 26}
\text{July 10, 2025}
\text{Function Approximators. (Recap)}
y = f(x)
(1, 2)
(1.5, 3)
(-0.5, -1)
?
(0.5, ?)
\text{March 31, 2026}
\text{CSE 4/555: Pattern Recognition, Sp. 26}
\text{Naresh Kumar Devulapally}
\text{Apr. 28, 2026}
\text{CSE 4/574: Machine Learning, Sp. 26}
\text{July 10, 2025}
\text{Function Approximators. (Recap)}
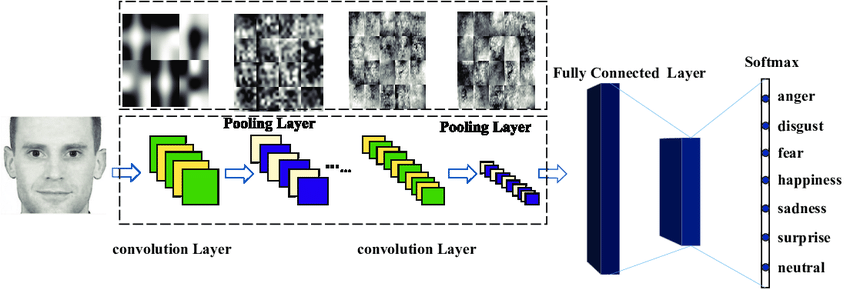
\text{Neural Networks}
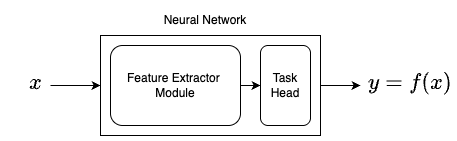
Neural Networks have two components:
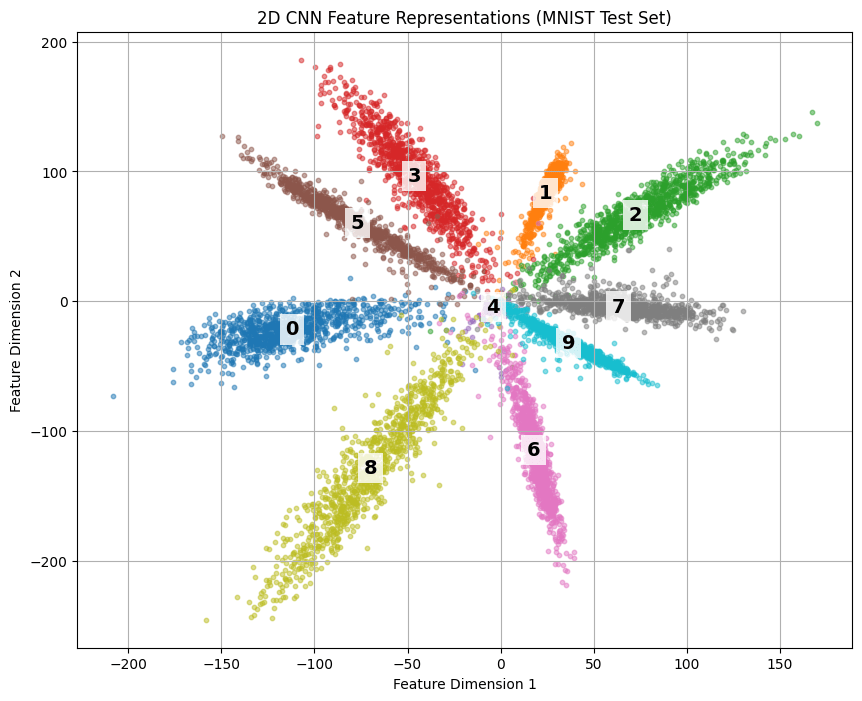
- Feature Extractor Module
- Task specific head
You can experiment with simple neural networks at Tensorflow Playground
Usually extracted features are of
lower dimension than data (x)
\text{March 31, 2026}
\text{Naresh Kumar Devulapally}
\text{Apr. 28, 2026}
\text{CSE 4/574: Machine Learning, Sp. 26}
\text{July 10, 2025}
\text{Function Approximators. (Recap)}
\text{March 31, 2026}
\text{Naresh Kumar Devulapally}
\text{Apr. 28, 2026}
\text{CSE 4/574: Machine Learning, Sp. 26}
\text{July 10, 2025}
\text{Function Approximators. (Recap)}
A simple example of a Neural Network
\text{March 31, 2026}
\text{Naresh Kumar Devulapally}
\text{Apr. 28, 2026}
\text{CSE 4/574: Machine Learning, Sp. 26}
\text{July 10, 2025}
\text{Intro to GenAI: Data Distribution}
but, what does it mean when two images are closer to each other?
\text{March 31, 2026}
\text{CSE 4/555: Pattern Recognition, Sp. 26}
\text{Naresh Kumar Devulapally}
\text{Apr. 28, 2026}
\text{CSE 4/574: Machine Learning, Sp. 26}
\text{July 10, 2025}
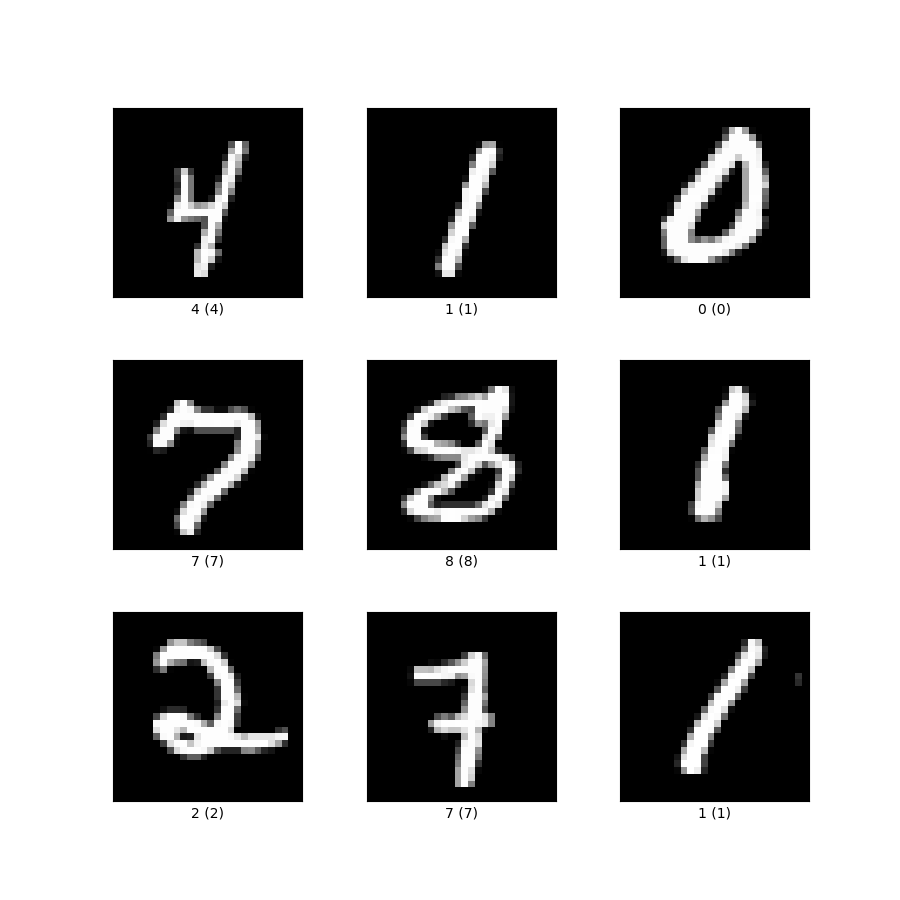
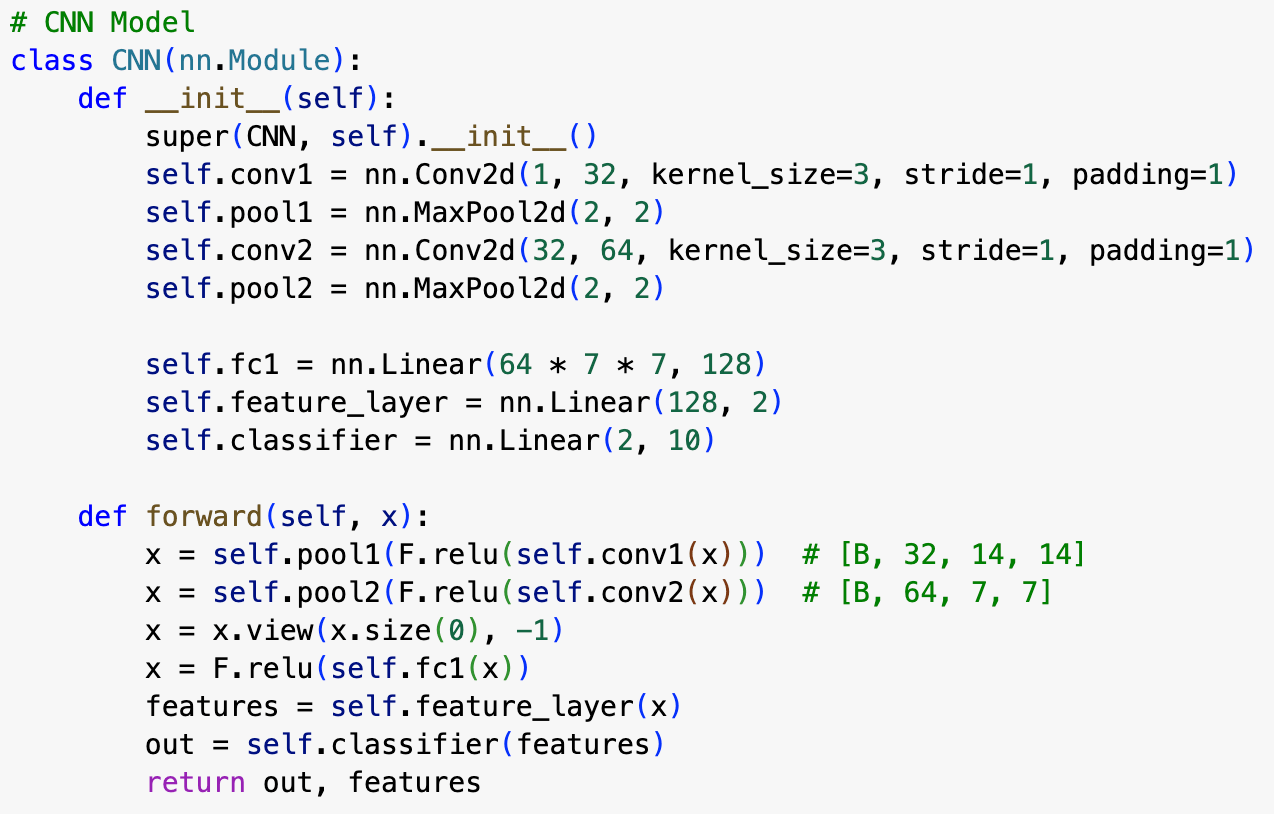
\text{PyTorch Code sample - Feature Extraction - NNs}
\text{March 31, 2026}
\text{CSE 4/555: Pattern Recognition, Sp. 26}
\text{Naresh Kumar Devulapally}
\text{Apr. 28, 2026}
\text{CSE 4/574: Machine Learning, Sp. 26}
\text{July 10, 2025}
\text{PyTorch Code sample - Feature Extraction - NNs}
Let's do a small experiment...
\text{March 31, 2026}
\text{CSE 4/555: Pattern Recognition, Sp. 26}
\text{Naresh Kumar Devulapally}
\text{Apr. 28, 2026}
\text{CSE 4/574: Machine Learning, Sp. 26}
\text{July 10, 2025}
\text{Function Approximators. (Recap)}
\text{Discriminative v/s Generative models}
y = f(x)
We have very powerful discriminator models:
- E.g., Image classification models
x = f^{-1}(y)
What about generative models?
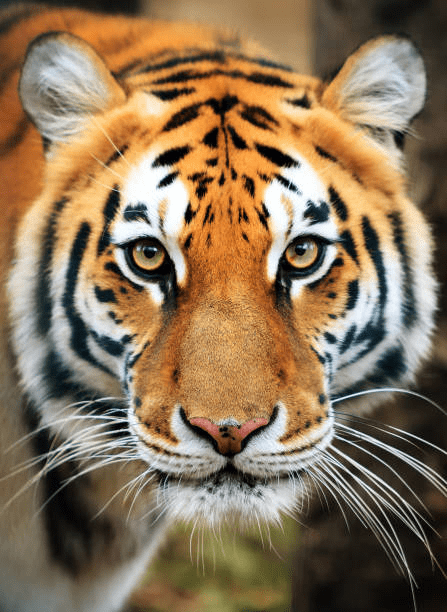
Given a label (e.g., "cat"), can we
generate a data point (image)?
\text{March 31, 2026}
\text{CSE 4/555: Pattern Recognition, Sp. 26}
\text{Naresh Kumar Devulapally}
\text{Apr. 28, 2026}
\text{CSE 4/574: Machine Learning, Sp. 26}
\text{July 10, 2025}
\text{Intro to GenAI: Data Distribution}
x
y
1
2
3
4
5
6
1
2
3
4
5
Line Fit
\text{March 31, 2026}
\text{CSE 4/555: Pattern Recognition, Sp. 26}
\text{Naresh Kumar Devulapally}
\text{Apr. 28, 2026}
\text{CSE 4/574: Machine Learning, Sp. 26}
\text{July 10, 2025}
\text{Intro to GenAI: Data Distribution}
x
1
2
3
4
5
6
Where does the data come from?
\text{March 31, 2026}
\text{CSE 4/555: Pattern Recognition, Sp. 26}
\text{Naresh Kumar Devulapally}
\text{Apr. 28, 2026}
\text{CSE 4/574: Machine Learning, Sp. 26}
\text{July 10, 2025}
\text{Intro to GenAI: Data Distribution}
x
1
2
3
4
5
6
Where does the data come from?
Random Experiment
and
Random Variable
\text{March 31, 2026}
\text{CSE 4/555: Pattern Recognition, Sp. 26}
\text{Naresh Kumar Devulapally}
\text{Apr. 28, 2026}
\text{CSE 4/574: Machine Learning, Sp. 26}
\text{July 10, 2025}
\text{Intro to GenAI: Data Distribution}
Heads, Tails, Tails, Heads, Heads ......
Guess the random Experiment that gives:
\text{March 31, 2026}
\text{CSE 4/555: Pattern Recognition, Sp. 26}
\text{Naresh Kumar Devulapally}
\text{Apr. 28, 2026}
\text{CSE 4/574: Machine Learning, Sp. 26}
\text{Intro to GenAI: Data Distribution}
Heads, Tails, Tails, Heads, Heads ......
Guess the random Experiment that gives:
Flipping a coin - of course
\text{CSE 4/555: Pattern Recognition, Sp. 26}
\text{Naresh Kumar Devulapally}
\text{Apr. 28, 2026}
\text{CSE 4/574: Machine Learning, Sp. 26}
\text{July 10, 2025}
\text{Intro to GenAI: Data Distribution}
Heads
x
Tails
\text{freq.}(x)
What can we expect about the outcome?
\text{March 31, 2026}
\text{CSE 4/555: Pattern Recognition, Sp. 26}
\text{Naresh Kumar Devulapally}
\text{Apr. 28, 2026}
\text{CSE 4/574: Machine Learning, Sp. 26}
\text{July 10, 2025}
\text{Intro to GenAI: Data Distribution}
\text{March 31, 2026}
\text{Naresh Kumar Devulapally}
\text{Apr. 28, 2026}
\text{CSE 4/574: Machine Learning, Sp. 26}
\text{Law of Large Numbers?}
\text{July 10, 2025}
In probability theory, the law of large numbers is a mathematical law that states that the average of the results obtained from a large number of independent random samples converges to the true value.
Let \(X_1,X_2,\dots\) be independent and identically distributed random variables with finite mean \(\mu=\mathbb{E}[X_1]\).
\overline{X}_n \;=\; \frac{1}{n}\sum_{i=1}^{n} X_i
Define the sample average:
\( \mu \) be the true mean. Then according to the law:
\overline{X}_n \longrightarrow \mu \text{ as } n \to \infty
\text{March 31, 2026}
\text{CSE 4/555: Pattern Recognition, Sp. 26}
\text{Naresh Kumar Devulapally}
\text{Apr. 28, 2026}
\text{CSE 4/574: Machine Learning, Sp. 26}
\text{July 10, 2025}
\text{Intro to GenAI: Data Distribution}
x
y
\( \text{class 0}\)
\( \text{class 1}\)
1
2
3
4
5
6
1
2
3
4
5
Decision Boundary
\text{March 31, 2026}
\text{CSE 4/555: Pattern Recognition, Sp. 26}
\text{Naresh Kumar Devulapally}
\text{Apr. 28, 2026}
\text{CSE 4/574: Machine Learning, Sp. 26}
\text{July 10, 2025}
\text{Intro to GenAI: Data Distribution}
x
1
2
3
5
6
4
Where does the data come from?
\text{March 31, 2026}
\text{CSE 4/555: Pattern Recognition, Sp. 26}
\text{Naresh Kumar Devulapally}
\text{Apr. 28, 2026}
\text{CSE 4/574: Machine Learning, Sp. 26}
\text{July 10, 2025}
\text{Intro to GenAI: Data Distribution}
x
1
2
3
5
6
4
Interpolation for data generation
Can I interpolate between data points?
x_{\text{new}} = (1 - \lambda) x_1 + \lambda x_2,\quad \lambda \in [0, 1].
Basic idea behind morphing images, style mixing, data augmentation
\text{March 31, 2026}
\text{CSE 4/555: Pattern Recognition, Sp. 26}
\text{Naresh Kumar Devulapally}
\text{Apr. 28, 2026}
\text{CSE 4/574: Machine Learning, Sp. 26}
\text{July 10, 2025}
\text{Intro to GenAI: Data Distribution}
x
1
2
3
5
6
4
\text{March 31, 2026}
\text{CSE 4/555: Pattern Recognition, Sp. 26}
\text{Naresh Kumar Devulapally}
\text{Apr. 28, 2026}
\text{CSE 4/574: Machine Learning, Sp. 26}
\text{July 10, 2025}
\text{Intro to GenAI: Data Distribution}
x
1
2
3
5
6
4
\text{freq.}(x)
What is the Data Distribution?
\text{March 31, 2026}
\text{CSE 4/555: Pattern Recognition, Sp. 26}
\text{Naresh Kumar Devulapally}
\text{Apr. 28, 2026}
\text{CSE 4/574: Machine Learning, Sp. 26}
\text{July 10, 2025}
\text{Intro to GenAI: Data Distribution}
What is a Probability Distribution?
A probability distribution describes how the probability mass (discrete) or probability density (continuous) is assigned to different possible outcomes of a random variable.
For a discrete variable X:
P(X = x) \quad \text{gives the probability that } X \text{ takes the value } x.
For a continuous variable X with PDF \( p(x) \):
P(a \leq X \leq b) = \int_a^b p(x)\,dx
\quad \text{with} \quad p(x) \geq 0,
\quad \int_{-\infty}^{\infty} p(x) dx = 1.
\text{March 31, 2026}
\text{CSE 4/555: Pattern Recognition, Sp. 26}
\text{Naresh Kumar Devulapally}
\text{Apr. 28, 2026}
\text{CSE 4/574: Machine Learning, Sp. 26}
\text{Intro to GenAI: Data Distribution}
What is a Probability Distribution?
p_\theta(x) = \frac{e^{-f_\theta(x)}}{Z_\theta}
- \( p_\theta(x)\) : probability density or mass function parameterized by \( \theta \).
- \( f_\theta(x) \) : energy function or negative log probability
- \( Z_\theta \) : partition function (normalization constant) that ensures the total probability integrates or sums to 1.
\text{March 31, 2026}
\text{CSE 4/555: Pattern Recognition, Sp. 26}
\text{Naresh Kumar Devulapally}
\text{Apr. 28, 2026}
\text{CSE 4/574: Machine Learning, Sp. 26}
\text{July 10, 2025}
\text{Intro to GenAI: Data Distribution}
\text{Types of Distributions}
\text{March 31, 2026}
\text{CSE 4/555: Pattern Recognition, Sp. 26}
\text{Naresh Kumar Devulapally}
\text{Apr. 28, 2026}
\text{CSE 4/574: Machine Learning, Sp. 26}
\text{July 10, 2025}
\text{Intro to GenAI: Data Distribution}
\text{Gaussian Distribution}
Mean - \( \mu \)
Variance - \( \sigma^2 \)
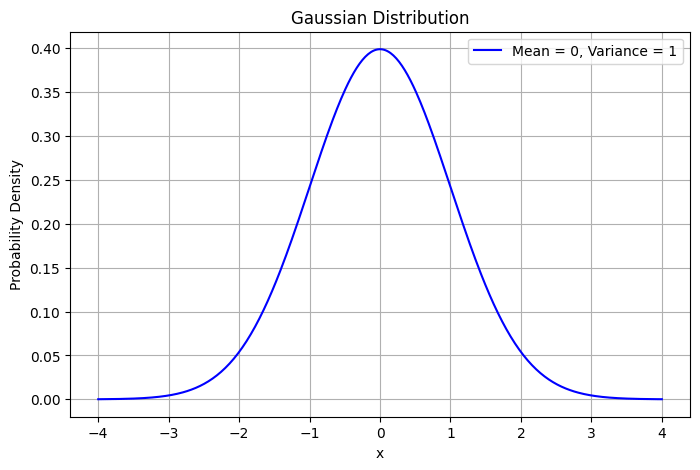
f(x) = \frac{1}{\sqrt{2 \pi \sigma^2}} \exp\left(-\frac{(x - \mu)^2}{2 \sigma^2}\right)
\text{March 31, 2026}
\text{CSE 4/555: Pattern Recognition, Sp. 26}
\text{Naresh Kumar Devulapally}
\text{Apr. 28, 2026}
\text{CSE 4/574: Machine Learning, Sp. 26}
\text{July 10, 2025}
\text{Intro to GenAI: Data Distribution}
\text{Useful notations}
Mean - \( \mu \)
Variance - \( \sigma^2 \)
x \sim \mathcal{N}(\mu, \sigma^2 I)
\mathcal{N}(x ; \mu, \sigma^2 I)
\mathcal{N}(x \mid \mu, \sigma^2 I)
All of these denote Gaussian distributions
A sample from the above distribution:
z = \mu + \sigma \cdot \varepsilon, \quad \text{where} \quad \varepsilon \sim \mathcal{N}(0,1)
\text{March 31, 2026}
\text{CSE 4/555: Pattern Recognition, Sp. 26}
\text{Naresh Kumar Devulapally}
\text{Apr. 28, 2026}
\text{CSE 4/574: Machine Learning, Sp. 26}
\text{July 10, 2025}
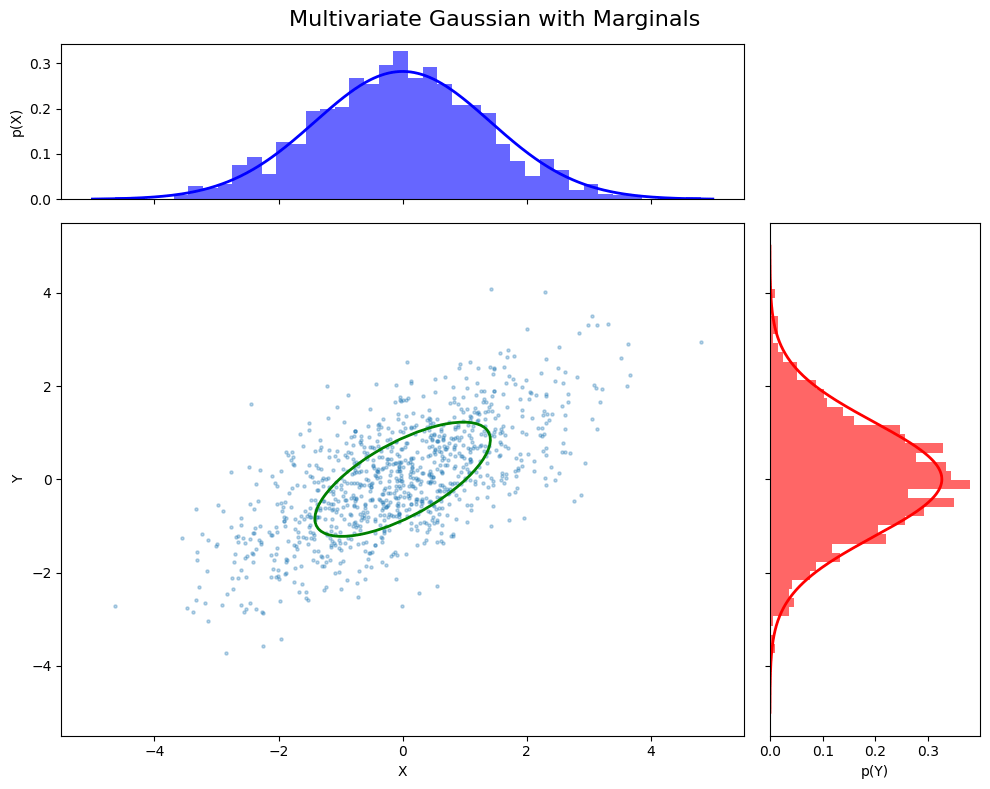
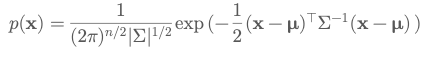
\text{Intro to GenAI: Data Distribution}
Multivariate Gaussian
\text{March 31, 2026}
\text{CSE 4/555: Pattern Recognition, Sp. 26}
\text{Naresh Kumar Devulapally}
\text{Apr. 28, 2026}
\text{CSE 4/574: Machine Learning, Sp. 26}
\text{July 10, 2025}
\text{Intro to GenAI: Data Distribution}
Bayes Rule:
Bayes’ Theorem relates conditional probabilities in both directions
p(x | y) = \frac{p(y | x) \, p(x)}{p(y)}
Prior
Evidence
Likelihood
Posterior
\text{March 31, 2026}
\text{CSE 4/555: Pattern Recognition, Sp. 26}
\text{Naresh Kumar Devulapally}
\text{Apr. 28, 2026}
\text{CSE 4/574: Machine Learning, Sp. 26}
\text{July 10, 2025}
\text{Intro to GenAI: Data Distribution}
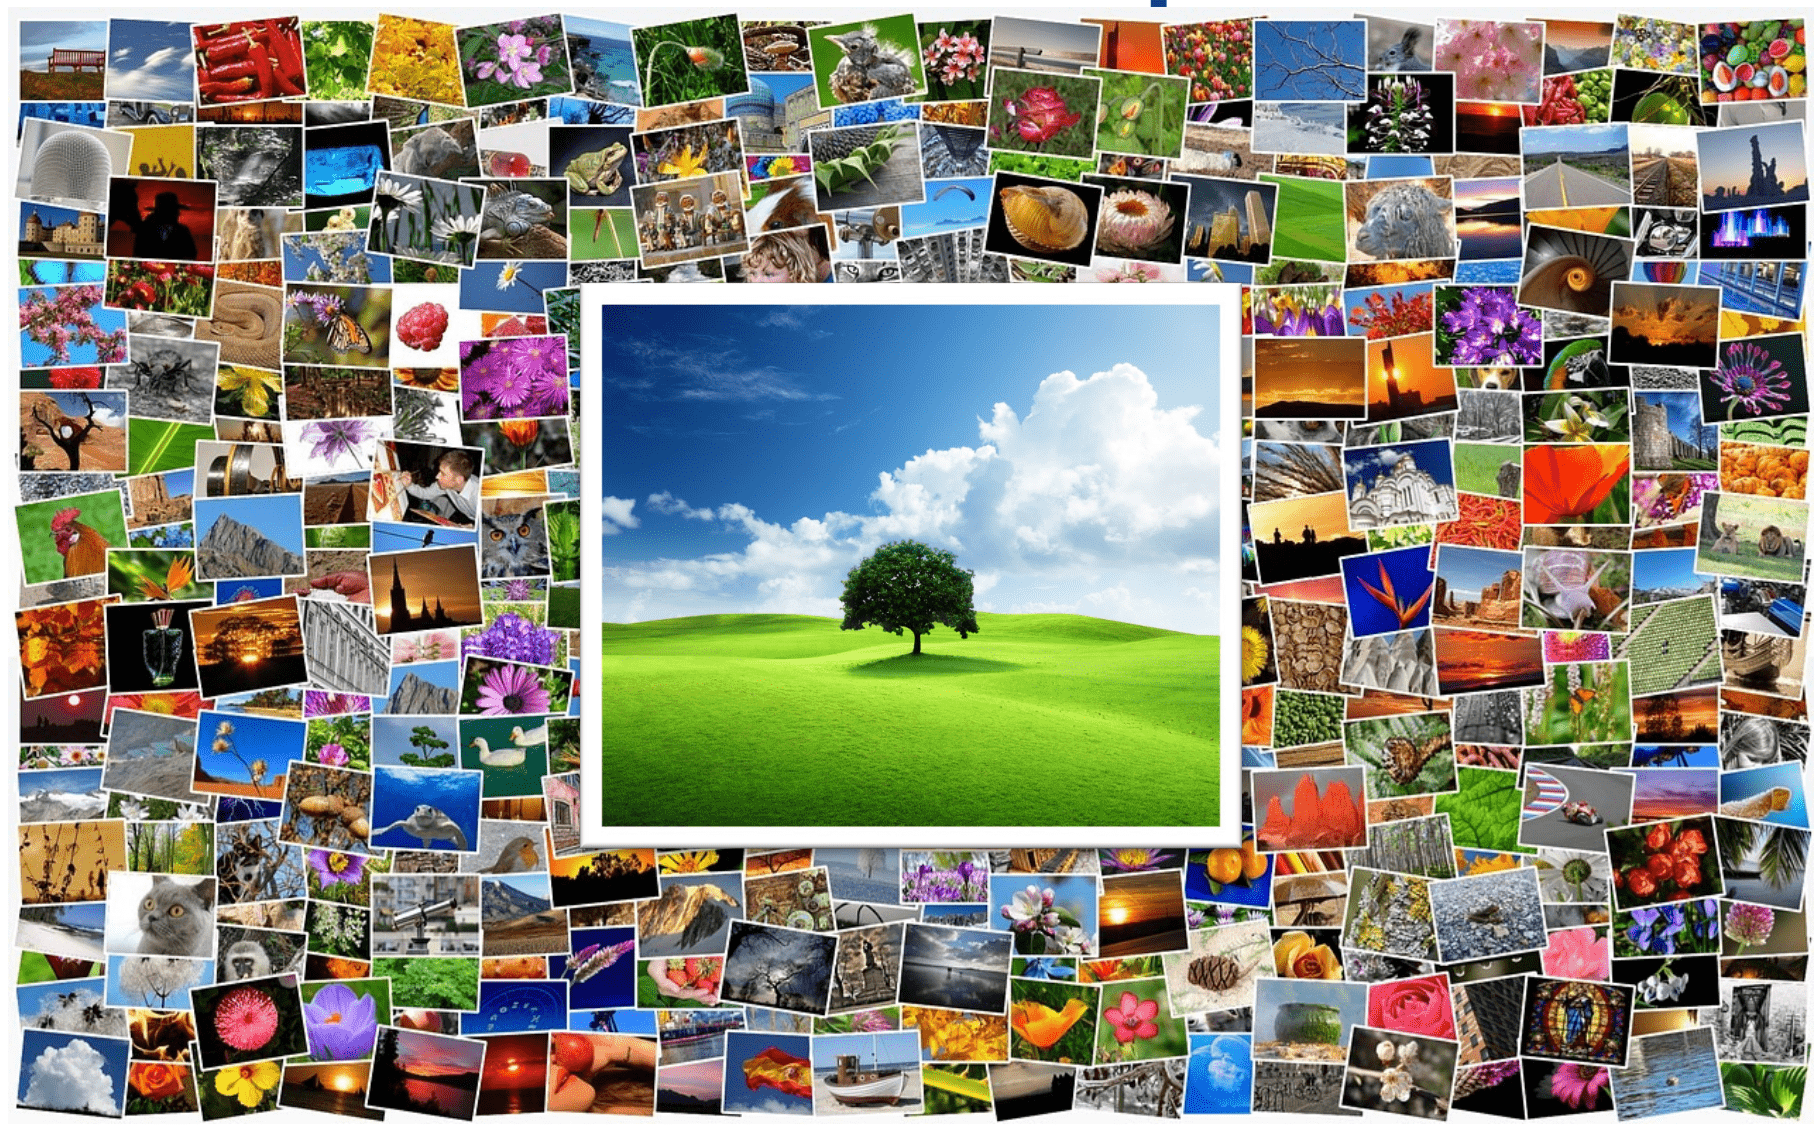
But, what about images?
Where does your sample come from?

\text{March 31, 2026}
\text{CSE 4/555: Pattern Recognition, Sp. 26}
\text{Naresh Kumar Devulapally}
\text{Apr. 28, 2026}
\text{CSE 4/574: Machine Learning, Sp. 26}
\text{July 10, 2025}
\text{Intro to GenAI: Data Distribution}
But, what about images?
\text{Generative Models}
Where does your sample come from?
\text{Data Distribution}
unknown
\text{Generative Models}
Where does your sample come from?
\text{Data Distribution}
unknown
\text{March 31, 2026}
\text{CSE 4/555: Pattern Recognition, Sp. 26}
\text{Naresh Kumar Devulapally}
\text{Apr. 28, 2026}
\text{CSE 4/574: Machine Learning, Sp. 26}
\text{July 10, 2025}
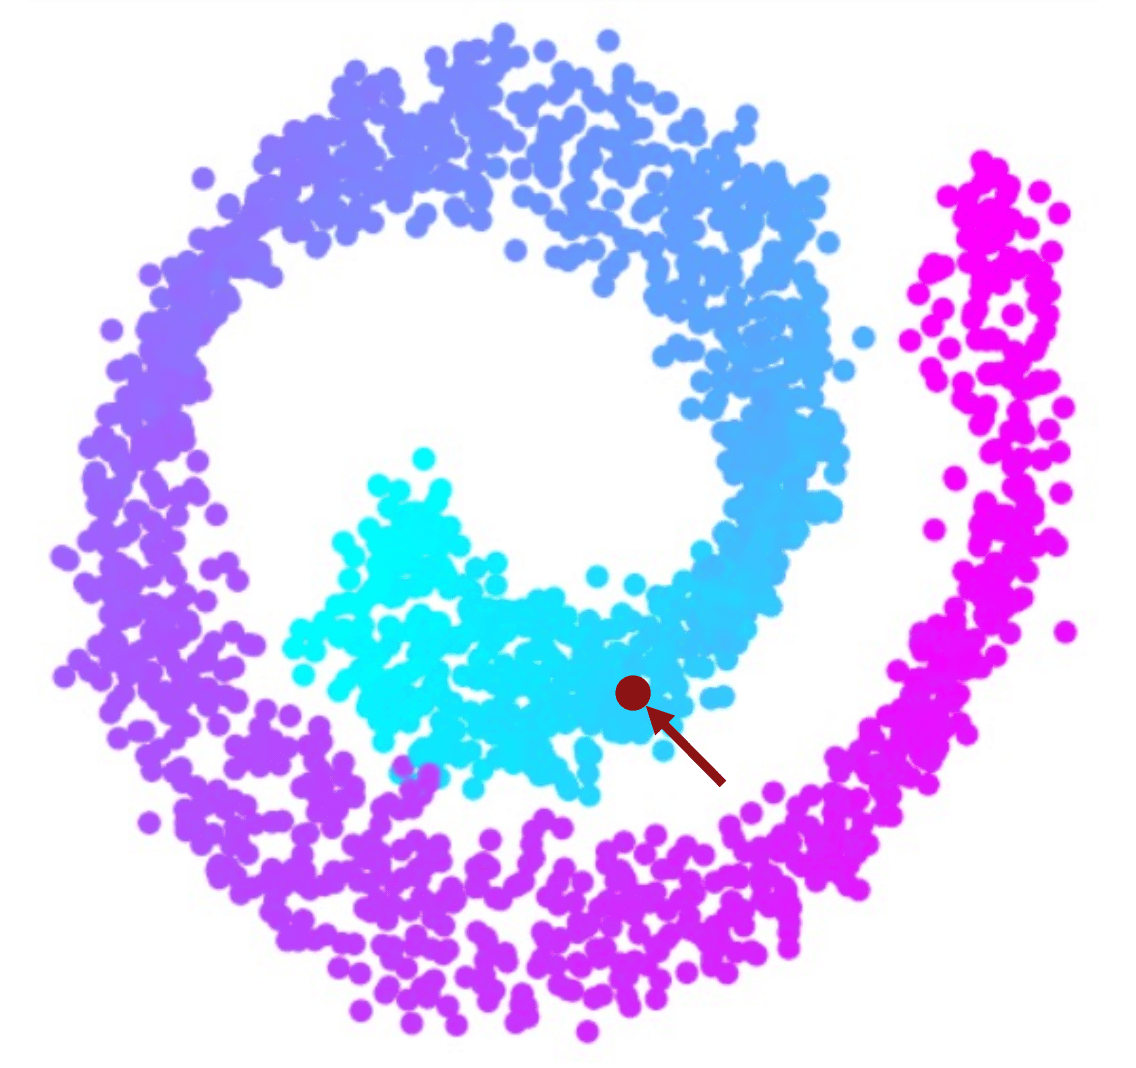
\text{Intro to GenAI: Data Distribution}
But, what about images?
Images are multidimensional vectors
but, what does it mean when two images are closer to each other?
\text{March 31, 2026}
\text{CSE 4/555: Pattern Recognition, Sp. 26}
\text{Naresh Kumar Devulapally}
\text{Apr. 28, 2026}
\text{CSE 4/574: Machine Learning, Sp. 26}
\text{July 10, 2025}
\text{Encoding and Decoding Data}
\text{March 31, 2026}
\text{CSE 4/555: Pattern Recognition, Sp. 26}
\text{Naresh Kumar Devulapally}
\text{Apr. 28, 2026}
\text{CSE 4/574: Machine Learning, Sp. 26}
\text{July 10, 2025}
\text{Variational AutoEncoders for Data Generation}
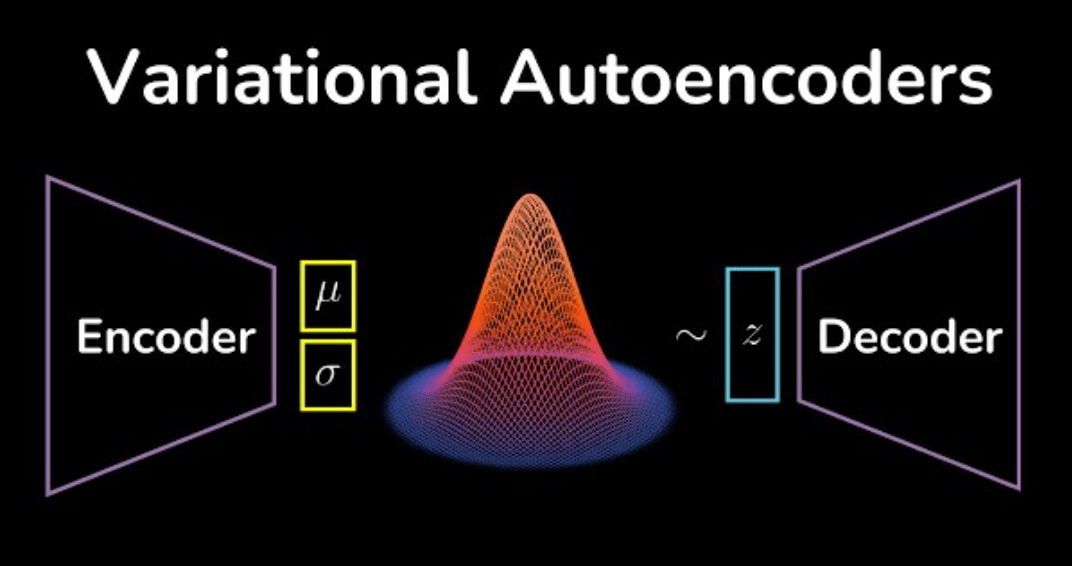
\( \mu \) and \( \sigma\) can be multi -dimensional
\text{March 31, 2026}
\text{CSE 4/555: Pattern Recognition, Sp. 26}
\text{Naresh Kumar Devulapally}
\text{Apr. 28, 2026}
\text{CSE 4/574: Machine Learning, Sp. 26}
\text{July 10, 2025}
\text{Intro to GenAI: Data Distribution}
The power of sampling.....
\text{March 31, 2026}
\text{CSE 4/555: Pattern Recognition, Sp. 26}
\text{Naresh Kumar Devulapally}
\text{Apr. 28, 2026}
\text{CSE 4/574: Machine Learning, Sp. 26}
\text{July 10, 2025}
\text{Variational AutoEncoders}
\text{March 31, 2026}
\text{CSE 4/555: Pattern Recognition, Sp. 26}
\text{Naresh Kumar Devulapally}
\text{Apr. 28, 2026}
\text{CSE 4/574: Machine Learning, Sp. 26}
\text{July 10, 2025}
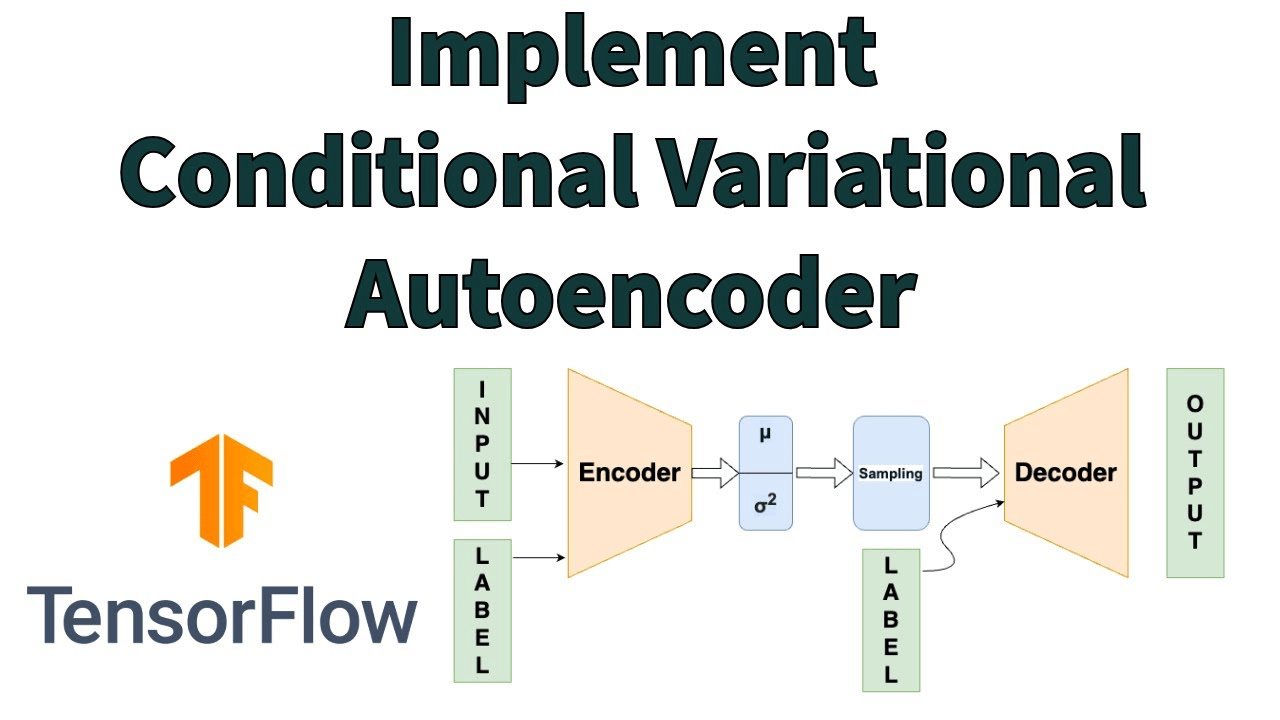
\text{Variational AutoEncoders for Data Generation}
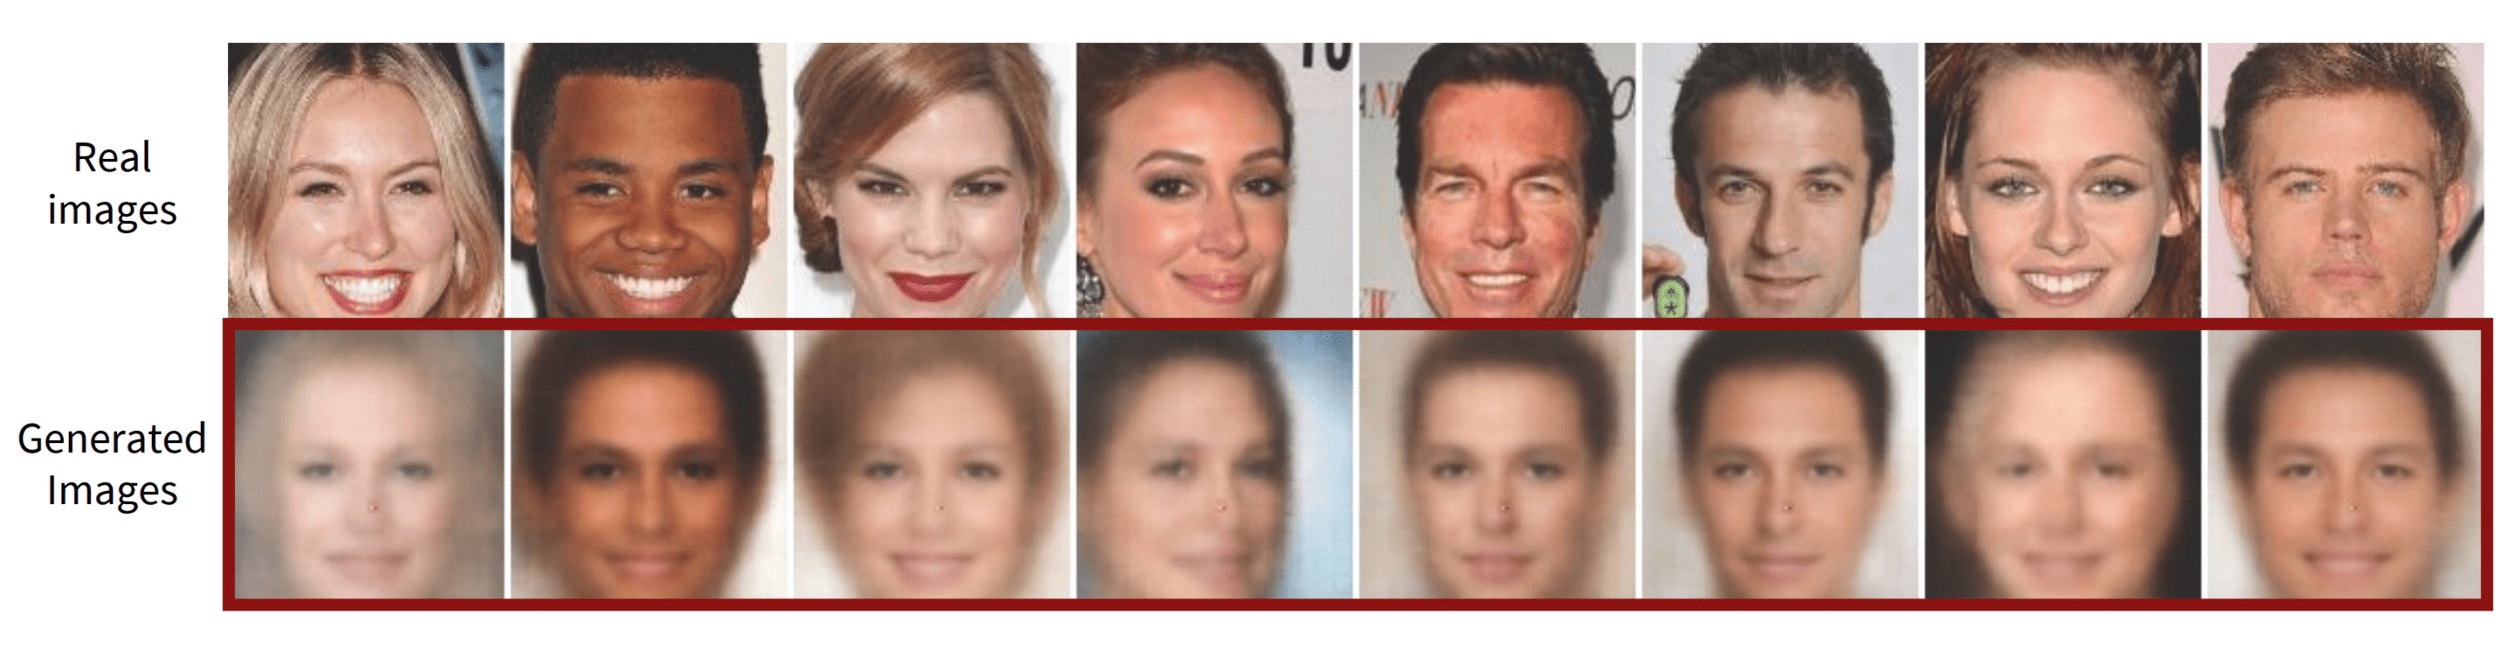
Data reconstruction using VAEs
\text{March 31, 2026}
\text{CSE 4/555: Pattern Recognition, Sp. 26}
\text{Naresh Kumar Devulapally}
\text{Apr. 28, 2026}
\text{CSE 4/574: Machine Learning, Sp. 26}
\text{July 10, 2025}
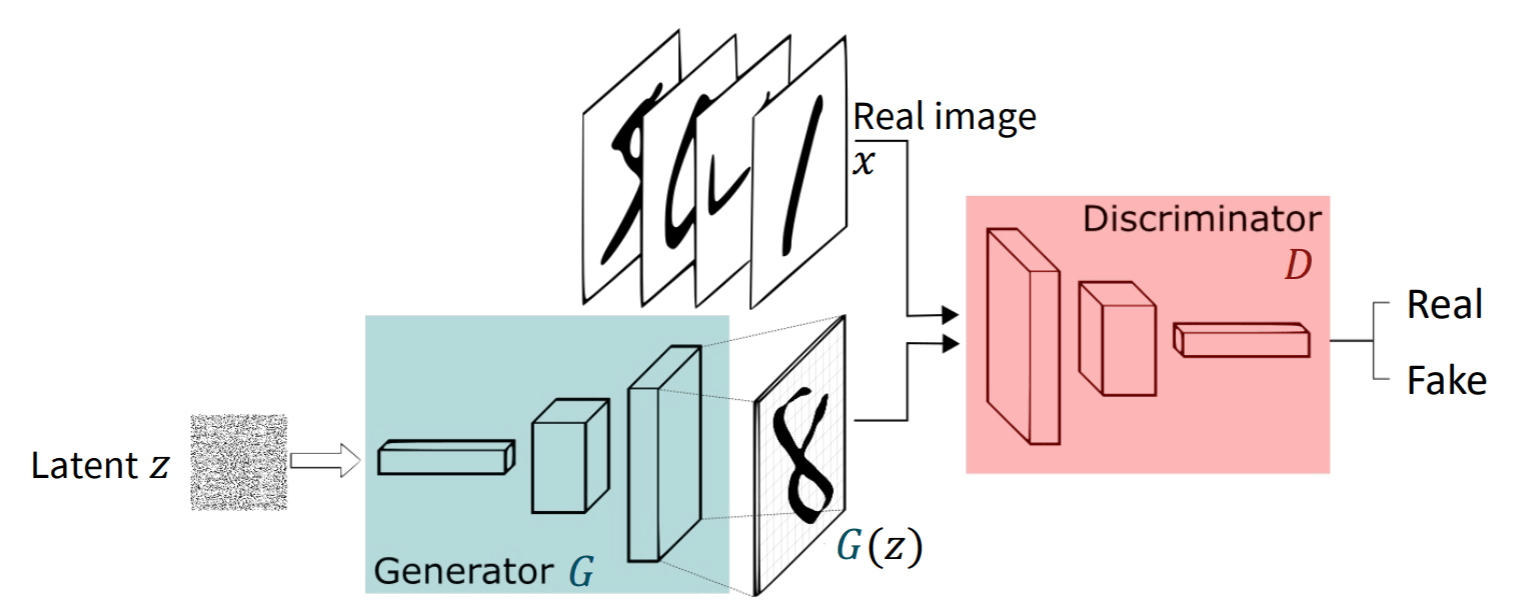
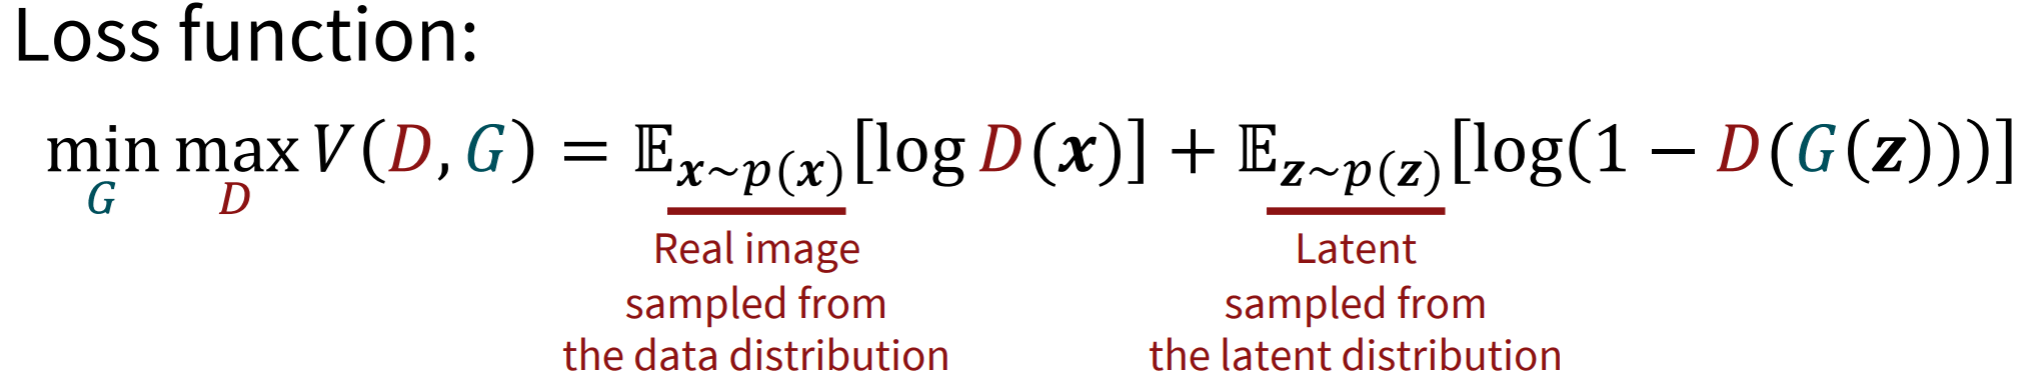
\text{Generative Adversarial Networks}
\text{March 31, 2026}
\text{CSE 4/555: Pattern Recognition, Sp. 26}
\text{Naresh Kumar Devulapally}
\text{Apr. 28, 2026}
\text{CSE 4/574: Machine Learning, Sp. 26}
\text{July 10, 2025}
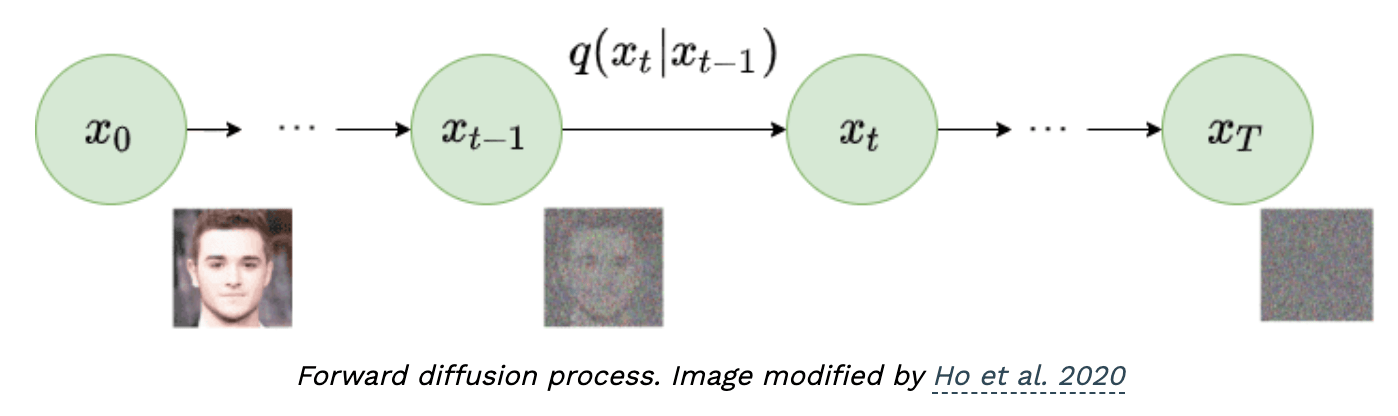
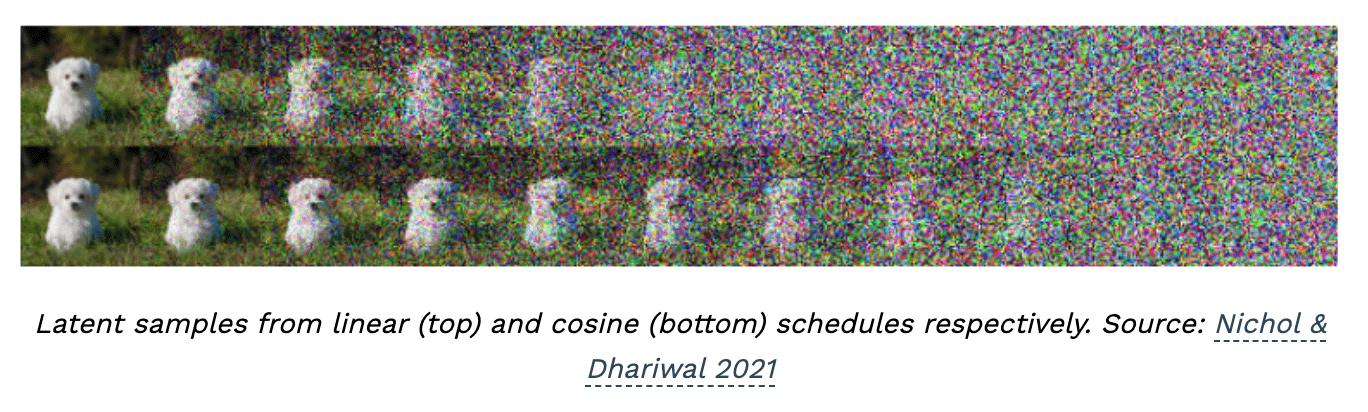
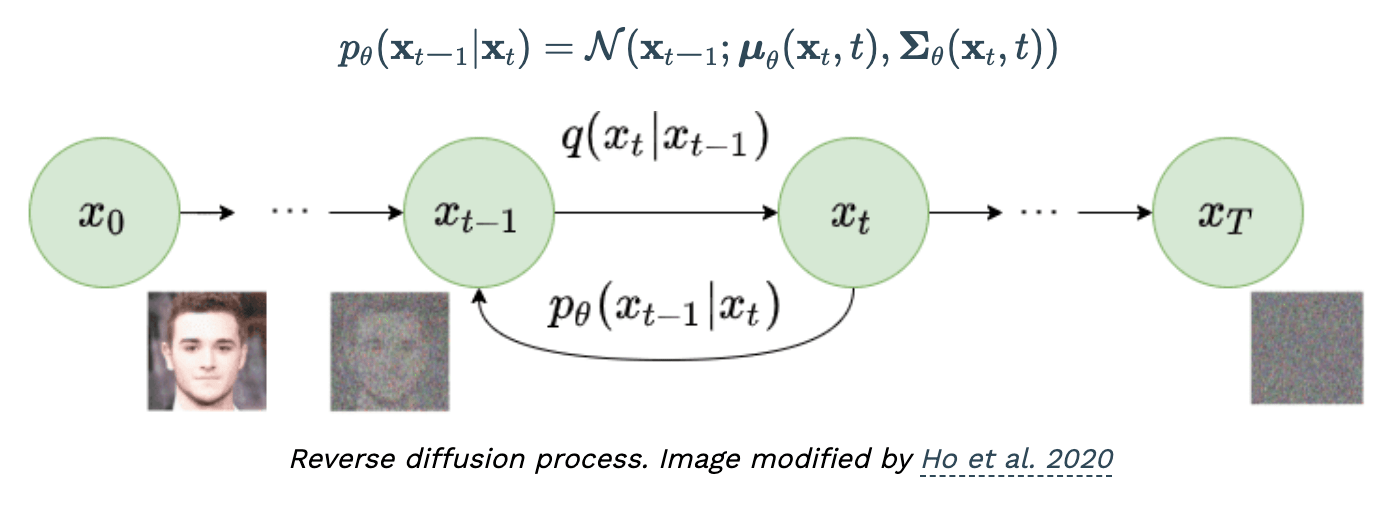
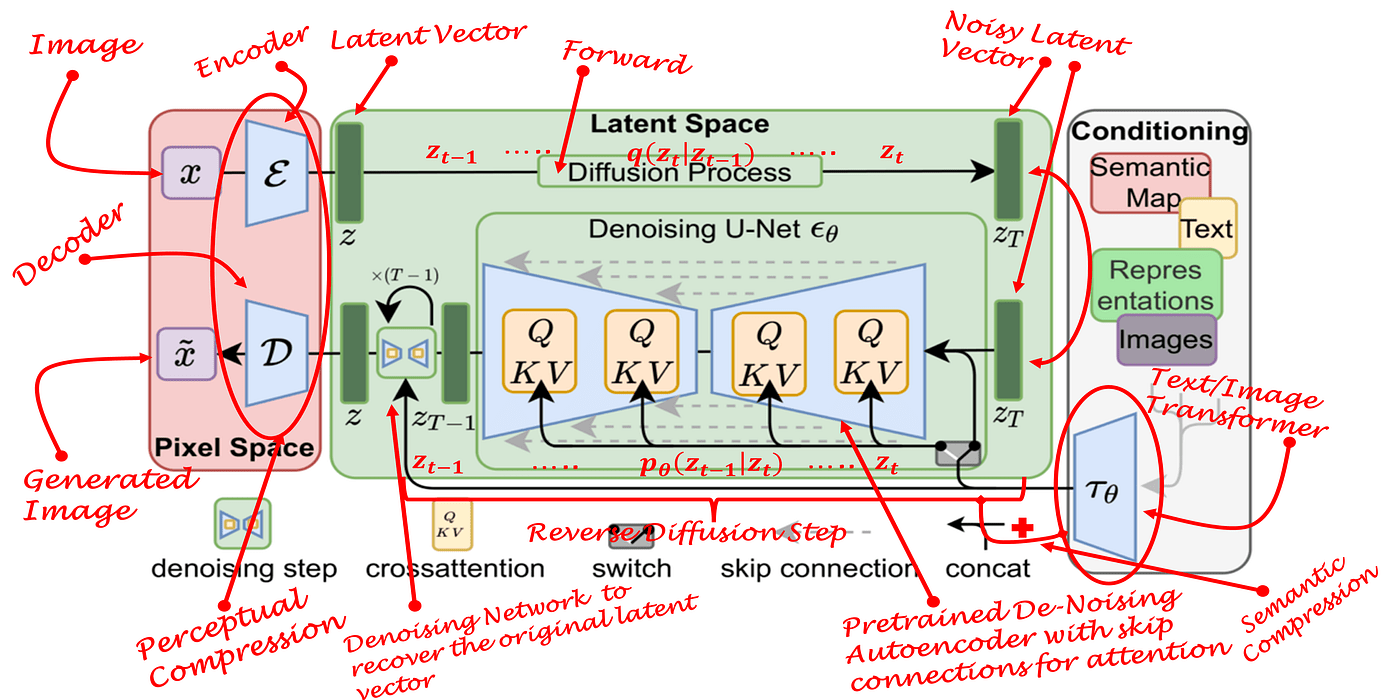
\text{Diffusion Models}
\text{March 31, 2026}
\text{CSE 4/555: Pattern Recognition, Sp. 26}
\text{Naresh Kumar Devulapally}
\text{Apr. 28, 2026}
\text{CSE 4/574: Machine Learning, Sp. 26}
\text{July 10, 2025}
\text{Diffusion Models}
\text{March 31, 2026}
\text{CSE 4/555: Pattern Recognition, Sp. 26}
\text{Naresh Kumar Devulapally}
\text{Apr. 28, 2026}
\text{CSE 4/574: Machine Learning, Sp. 26}
\text{July 10, 2025}
\text{Diffusion Models}
\text{March 31, 2026}
\text{CSE 4/555: Pattern Recognition, Sp. 26}
\text{Naresh Kumar Devulapally}
\text{Apr. 28, 2026}
\text{CSE 4/574: Machine Learning, Sp. 26}
\text{July 10, 2025}
\text{Diffusion Models for Video Generation}
\text{March 31, 2026}
\text{CSE 4/555: Pattern Recognition, Sp. 26}
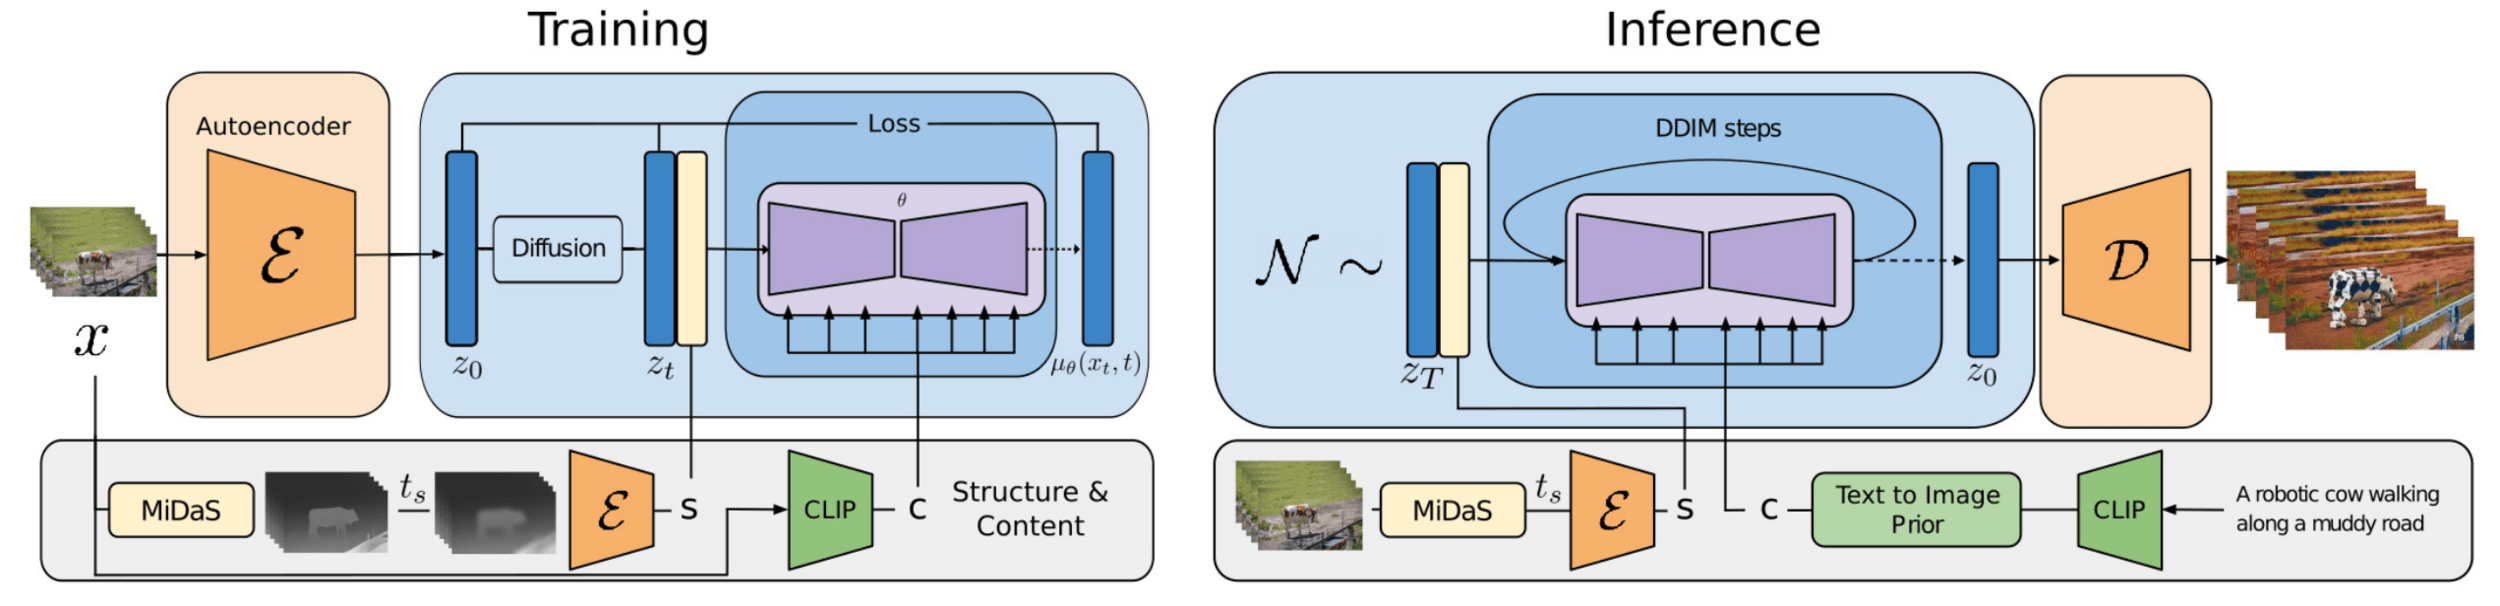
Source:
https://lilianweng.github.io/posts/2024-04-12-diffusion-video/
\text{Naresh Kumar Devulapally}
\text{Apr. 28, 2026}
\text{CSE 4/574: Machine Learning, Sp. 26}
\text{July 10, 2025}
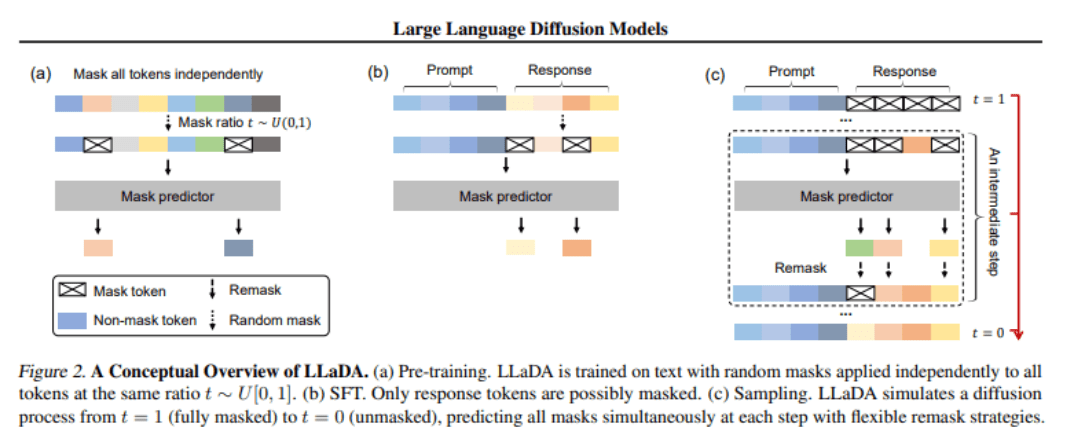
\text{Diffusion Models for Text Generation}
\text{March 31, 2026}
\text{CSE 4/555: Pattern Recognition, Sp. 26}
\text{Naresh Kumar Devulapally}
\text{Apr. 28, 2026}
\text{CSE 4/574: Machine Learning, Sp. 26}
Guest Lecture: CSE 574
By Naresh Kumar Devulapally
Guest Lecture: CSE 574
Invited Guest Lecture - CSE 555 Pattern Recognition - Spring 2025


