Monitoring 101
Nir Cohen
@
@nir0s

Agenda
- Why are we here?
- What is monitoring?
- Why monitor?
- Metrics
- Pipeline
- Some basic math
- Metrics vs. Logs
Why?
- Increase BigPanda's SLA
- A neglected area in software
- NOT to become experts
To monitor is to
observe and check the progress or quality of (something) over a period of time; keep under systematic review.
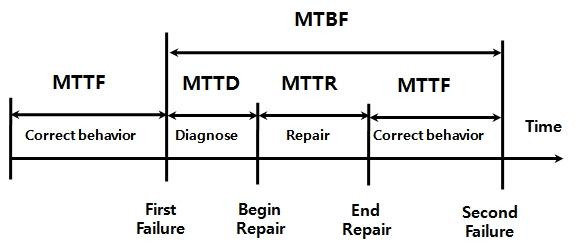
What is a Monitoring Pipline?

+ IMPROVEMENT
Monitor What (in software)?
- Infra (CPU, Memory, inodes, Network, IOPS, disk space, etc..)
- Middleware (Web-server request count, thread count, etc..)
- Product (user events, functional performance, etc..)
- Business KPIs (revenue, SLA, etc..)
MEME PLACEHOLDER FOR ERIK
Why Monitor?
- Visibility (System Failure, Proactivitiy → Prevention)
- Feedback Loops (automatic and manual)
Metrics
- What is a metric
- Namespace History
- Formats
- Dimensionality & Tags
- Types of metrics (Counters, Gauges, Timers, Histograms, (Sets))
- Functions (sum, upper, mean, etc..)
- Naming conventions
Naming
1932819231 correlation.incidents_copied_count 13|c1932819231 correlation.kafka_to_rabbit_copy 13|cincidents_copied_count,service=corr,host=prod-corr-11,org=intel 13|cPipeline[collecting]
- Push vs. Scrape
- Agents
- Code
Pipeline[shipping]
- Protocols (TCP, UDP, HTTP)
- Aggregation/Bucketing
- Sampling
Pipeline[storing]
- What is a Timeseries?
- What is a Timeseries Database? (TSDB)
- How much data to keep? And at what resolution?
- Why not use a relational database?
- Buckets
- Downsampling (storage schemas)
- Retention Periods (technical limits and system/business requirements)
Pipeline[graphing]
- Graph Chaos
- Coloring
- Y Scales
- !Screen Resolution

GRAPH CHAOS!
MOAR CHAOS!
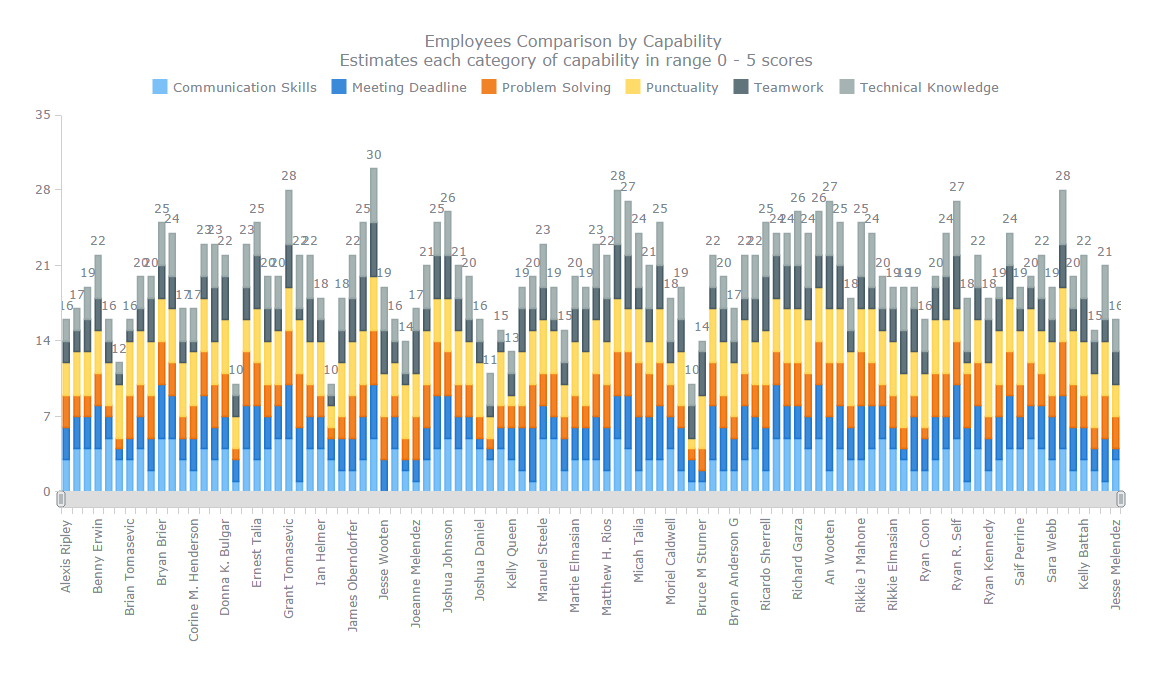
DASH CHAOS!
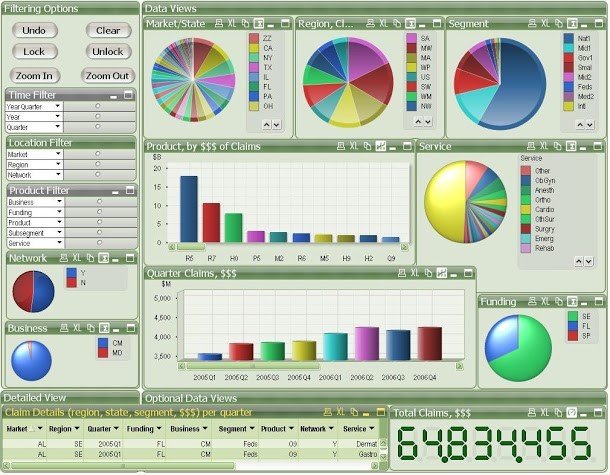
Graph Color

Dash Color
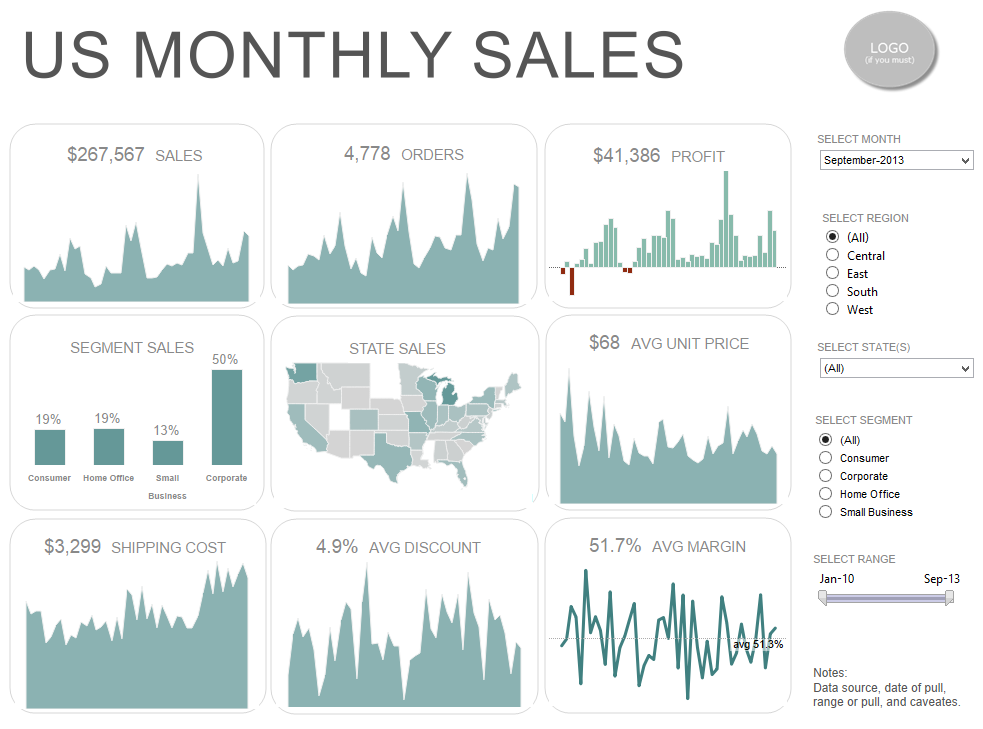
Dual-Y

Pipeline[alerting]
- What is an alert
- Alert Criterion
- Law of Actionability
- Time Spans
- Alert Hierarchy (and channeling)
- Fatigue
- Levels*
Some Math
- Vectors vs. Scalars
- Functions vs. aggregators
- Intro to averages vs. percentiles
- Correlation vs. Causation
- Derivatives vs. Hard Thresholds
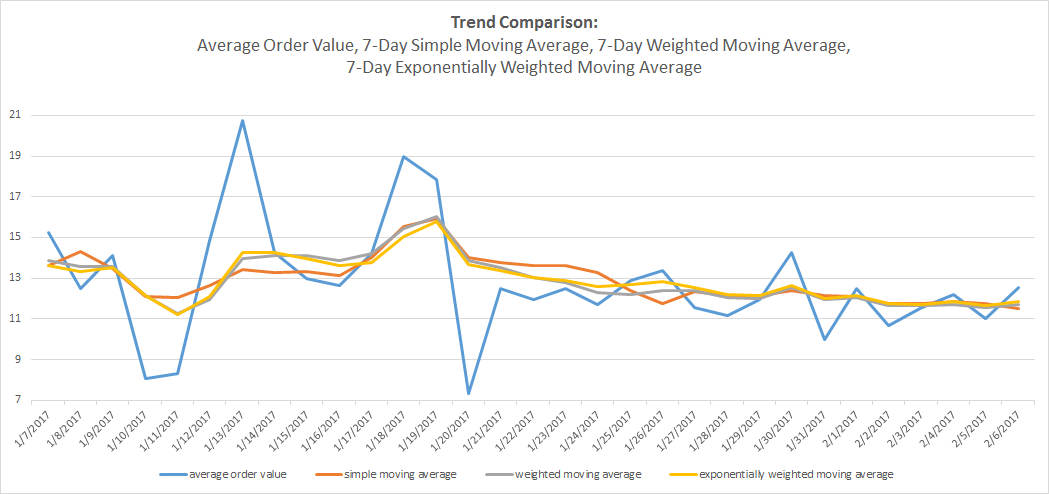
Averages
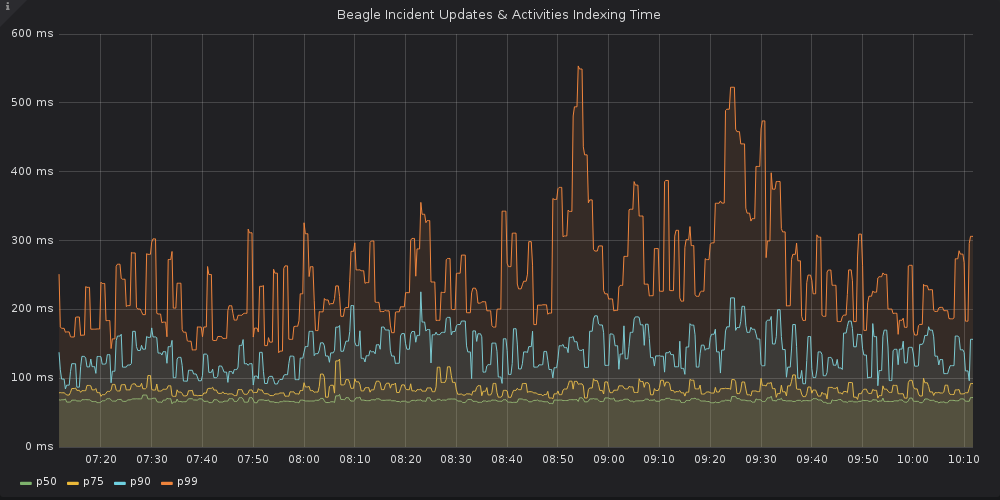
Percentiles
Metrics vs. Logs
{
  "timestamp": 12391238121,
  "message": "Received Incoming Event",
  "org": "AWS",
  "metadata" : {
    "method": "POST",
    "service": "consumer",
    "params": [...]
  }

  ...
}
incoming_events_count,service=consumer,method=POST,... 1|c~=
Monitoring 101
By Nir Cohen
Monitoring 101
A summary of logging problems and solutions
- 2,735


