

AAAI2020:
Main concerns:
- Generation of bounding boxes from contour is not clear
- No info about neighboring ROIs in linking module
- FrRCNN+FPN+RA is better than PlotNet in most classes
CVPR2020:
Changes: AAAI paper + detailed explanation on CV method
Main concerns:
- Need more ablation study and discussion about PlotNet
- Are there any other methods for OD over plots?
- Limited contribution, novelty is incremental
ECCV2020:
Changes: CVPR paper + AN-ROI layer (info about neighbouring ROIs) + Custom Loss + Extensive ablation study with IoU based regression losses
Main concerns:
- Contribution & Ablation study of: (i) CV method; (ii) custom loss, (iii) linking module; is missing.
- description of CV based method was very vague
- Why are we evaluating existing OD models on plots?
Our Current State:
- we have ablation study of linking module
- we have comparison with latest IoU based loss functions (CIoU, DIoU, GIoU)
- we can write more about the thinking process which led us to our CV-based method
- Custom loss does not give significant improvement (our main concern)
| PlotNet | FrRCNN+FPN+RA | MaskRCNN | RetinaNet | Yolo-V3 | |
|---|---|---|---|---|---|
| L1 loss | |||||
| -log IoU | |||||
| 1 - IoU | |||||
| Custom Loss | |||||
| GIoU | |||||
| L1 loss - log IoU | |||||
| L1 loss + 1 - IoU | |||||
| L1 loss + Custom loss | |||||
| L1 loss + GIoU |
- Old linking module (v2) + loss
- understand mAP properly
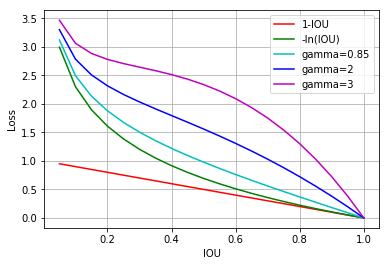
- try different loss functions (log IOU, etc.)
- mAP with an average pool
- visualize why our ground-truth mAP@0.9 is not 100%
- are beta1 and beta2 such that both the losses are in the same range
- Custom: -(1+IOU)**gamma * log(IOU)
| mAP@0.9 | mAP@0.75 | mAP@0.5 |
|---|
FrRCNN_FPN_RA
| bar | dotline | legend-label | line | preview | title | xlabel | xticklabel | ylabel | yticklabel |
|---|
| 90.95 | 43.43 | 99.12 | - | 98.00 | 0.24 | 99.87 | 98.44 | 99.68 | 99.36 |
| 94.31 | 60.18 | 99.82 | - | 99.49 | 0.19 | 99.99 | 99.61 | 99.67 | 99.88 |
| 81.01% | 95.34% | 98.11% |
|---|
| 85.54% | 27.86% | 93.68% | - | 96.30% | 0.22% | 99.09% | 96.04% | 99.46% | 96.80% |
GIOU
Smooth L1
Log IOU
| 83.68% | 97.16% | 98.20% |
|---|
| 94.13 | 57.97 | 99.80 | - | 99.39 | 0.19 | 99.99 | 99.60 | 99.67 | 99.88 |
1-IOU
| 83.40% | 97.05% | 98.20% |
|---|
| 77.22% | 94.58% | 97.76% |
|---|
| 91.77% | 44.68% | 99.44% | - | 98.87% | 0.24% | 99.83% | 98.63% | 99.66% | 99.65% |
Custom Loss
gamma=2
| 81.42% | 95.69% | 98.14% |
|---|
| 92.18 | 47.45 | 99.39 | - | 98.71 | 0.21 | 99.90 | 99.26 | 99.74 | 99.69 |
SL1 + - log IOU
| 81.84% | 95.95% | 98.27% |
|---|
| 91.31 | 47.05 | 99.38 | - | 98.96 | 0.21 | 99.92 | 99.17 | 99.77 | 99.72 |
SL1 + GIOU
| 81.72% | 96.02% | 98.23% |
|---|
| 91.47 | 48.64 | 99.44 | - | 98.86 | 0.21 | 99.90 | 99.22 | 99.92 | 99.68 |
SL1 + 1-IOU
| 81.93% | 96.07% | 98.24% |
|---|
| 91.23 | 48.90 | 99.57 | - | 98.95 | 0.24 | 99.94 | 99.29 | 99.67 | 99.72 |
SL1 + custom loss
| 81.95% | 95.94% | 98.20% |
|---|
| mAP |
|---|
| 97.76% |
|---|
| 94.58% |
| 77.22% |
| IOU |
|---|
| bar | dotline | legend-label | line | preview | title | xlabel | xticklabel | ylabel | yticklabel |
|---|
FrRCNN_FPN_RA
| 95.84% | 84.28% | 99.99% | - | 99.95% | 100.00% | 99.99% | 99.92% | 99.90% | 99.99% |
| 85.54% | 27.86% | 93.68% | - | 96.30% | 0.22% | 99.09% | 96.04% | 99.46% | 96.80% |
| 94.30% | 78.59% | 99.96% | - | 99.94% | 78.83% | 99.99% | 99.74% | 99.90% | 99.97% |
| 0.5 |
| 0.75 |
| 0.9 |
| 0.5 |
| 0.75 |
| 0.9 |
| 98.11% |
|---|
| 97.21% |
| 83.89% |
| 95.33% | 91.60% | 98.96% | - | 99.27% | 99.76% | 99.02% | 99.77% | 99.69% | 99.57% |
| 91.02% | 31.69% | 97.08% | - | 81.57% | 99.36% | 96.06% | 85.33% | 82.00% | 90.95% |
| 95.04% | 86.46% | 98.64% | - | 99.08% | 99.73% | 97.30% | 99.59% | 99.63% | 99.39% |
PlotNet v2
Analysis of different object detection models (PlotQA)
PlotNet v0
| 95.52% | 91.24% | 99.66% | - | 99.52% | 99.87% | 98.27% | 99.83% | 99.62% | 99.77% |
| 95.52% | 91.24% | 99.45% | - | 99.52% | 99.56% | 97.44% | 99.83% | 99.62% | 99.77% |
| 95.52% | 91.24% | 99.79% | - | 99.52% | 99.97% | 99.68% | 99.83% | 99.62% | 99.78% |
| 98.33% |
|---|
| 98.14% |
| 97.99% |
| 0.5 |
| 0.75 |
| 0.9 |
#FLOPs: 283.85G
#Param: 43.81M
#FLOPs: 100.927G
#Param: 131.944M
Only
Smooth L1
PlotNet v12
| 95.24% | 88.94% | 99.01% | - | 99.42% | 99.83% | 98.06% | 99.79% | 99.75% | 99.64% |
| 92.16% | 61.18% | 98.38% | - | 93.46% | 99.44% | 97.21% | 94.21% | 95.45% | 96.02% |
| 95.40% | 91.06% | 99.29% | - | 99.51% | 99.96% | 99.56% | 99.83% | 99.75% | 99.77% |
| 98.24% |
|---|
| 97.74% |
| 91.94% |
| 0.5 |
| 0.75 |
| 0.9 |
CVPR
Paper
PlotNet v30
| 95.27% | 85.59% | 99.23% | - | 99.48% | 99.89% | 97.91% | 99.77% | 99.80% | 99.31% |
| 92.07% | 56.89% | 92.50% | - | 93.94% | 99.55% | 73.97% | 88.80% | 83.75% | 58.36% |
| 95.43% | 91.09% | 99.54% | - | 99.50% | 99.98% | 99.59% | 99.82% | 99.83% | 99.78% |
| 98.28% |
|---|
| 97.36% |
| 82.20% |
| 0.5 |
| 0.75 |
| 0.9 |
PlotNet v31
| 95.24% | 89.67% | 99.11% | - | 99.44% | 99.25% | 98.09% | 99.77% | 99.87% | 99.63% |
| 92.93% | 67.94% | 98.24% | - | 95.29% | 98.38% | 97.16% | 94.55% | 97.82% | 96.06% |
| 95.40% | 90.98% | 99.33% | - | 99.49% | 99.57% | 99.58% | 99.81% | 99.87% | 99.78% |
| 98.20% |
|---|
| 97.79% |
| 93.15% |
| 0.5 |
| 0.75 |
| 0.9 |
Only Custom Loss (gamma = 0.85)
Only Custom Loss (gamma = 0.85)
L1 + 0.6*Custom Loss (gamma = 0.85)
PlotNet v32
| 95.18% | 84.77% | 99.32% | - | 99.44% | 99.84% | 98.07% | 99.76% | 99.68% | 99.68% |
| 91.88% | 61.44% | 96.44% | - | 95.58% | 99.52% | 97.19% | 90.64% | 97.55% | 87.66% |
| 95.45% | 91.51% | 99.54% | - | 99.45% | 99.95% | 99.63% | 99.82% | 99.68% | 99.78% |
| 98.31% |
|---|
| 97.30% |
| 90.88% |
| 0.5 |
| 0.75 |
| 0.9 |
Only Custom Loss (gamma = 0.85)
Only Custom Loss (gamma = 2.0)
PlotNet v36
L1 + 0.6*Custom Loss (gamma = 2.0)
| 95.19% | 86.04% | 98.32% | - | 99.49% | 97.42% | 94.41% | 99.77% | 99.60% | 99.67% |
| 92.68% | 61.05% | 97.02% | - | 96.05% | 94.93% | 93.62% | 93.29% | 97.13% | 95.37% |
| 95.37% | 91.22% | 98.69% | - | 99.52% | 98.35% | 95.90% | 99.81% | 99.65% | 99.76% |
| 97.59% |
|---|
| 96.66% |
| 91.24% |
| 0.5 |
| 0.75 |
| 0.9 |
Analysis of different object detection models (PlotQA)
Only
Smooth L1
PlotNet v12
| 95.24% | 88.94% | 99.01% | - | 99.42% | 99.83% | 98.06% | 99.79% | 99.75% | 99.64% |
| 92.16% | 61.18% | 98.38% | - | 93.46% | 99.44% | 97.21% | 94.21% | 95.45% | 96.02% |
| 95.40% | 91.06% | 99.29% | - | 99.51% | 99.96% | 99.56% | 99.83% | 99.75% | 99.77% |
| 98.24% |
|---|
| 97.74% |
| 91.94% |
| 0.5 |
| 0.75 |
| 0.9 |
| mAP |
|---|
| 97.76% |
|---|
| 94.58% |
| 77.22% |
| IOU |
|---|
| bar | dotline | legend-label | line | preview | title | xlabel | xticklabel | ylabel | yticklabel |
|---|
FrRCNN_FPN_RA
| 95.84% | 84.28% | 99.99% | - | 99.95% | 100.00% | 99.99% | 99.92% | 99.90% | 99.99% |
| 85.54% | 27.86% | 93.68% | - | 96.30% | 0.22% | 99.09% | 96.04% | 99.46% | 96.80% |
| 94.30% | 78.59% | 99.96% | - | 99.94% | 78.83% | 99.99% | 99.74% | 99.90% | 99.97% |
| 0.5 |
| 0.75 |
| 0.9 |
Only
log IOU
PlotNet v28
| 95.24% | 82.69% | 99.08% | - | 99.46% | 99.85% | 97.94% | 99.77% | 99.90% | 98.82% |
| 91.83% | 45.78% | 91.48% | - | 94.15% | 98.95% | 74.24% | 87.19% | 89.34% | 50.11% |
| 95.41% | 91.02% | 99.42% | - | 99.49% | 99.97% | 99.56% | 99.82% | 99.91% | 99.77% |
| 98.26% |
|---|
| 96.97% |
| 80.34% |
| 0.5 |
| 0.75 |
| 0.9 |
Only
1 - IOU
PlotNet v29
| 95.22% | 78.38% | 99.02% | - | 99.44% | 99.71% | 98.10% | 99.71% | 99.64% | 98.21% |
| 91.79% | 41.86% | 93.74% | - | 94.64% | 98.29% | 83.11% | 85.69% | 89.32% | 49.36% |
| 95.41% | 90.61% | 99.35% | - | 99.49% | 99.95% | 99.67% | 99.80% | 99.71% | 99.78% |
| 98.20% |
|---|
| 96.38% |
| 80.87% |
| 0.5 |
| 0.75 |
| 0.9 |
PlotNet v30
| 95.27% | 85.59% | 99.23% | - | 99.48% | 99.89% | 97.91% | 99.77% | 99.80% | 99.31% |
| 92.07% | 56.89% | 92.50% | - | 93.94% | 99.55% | 73.97% | 88.80% | 83.75% | 58.36% |
| 95.43% | 91.09% | 99.54% | - | 99.50% | 99.98% | 99.59% | 99.82% | 99.83% | 99.78% |
| 98.28% |
|---|
| 97.36% |
| 82.20% |
| 0.5 |
| 0.75 |
| 0.9 |
Only Custom Loss (gamma = 0.85)
Only Custom Loss (gamma = 0.85)
PlotNet v32
| 95.18% | 84.77% | 99.32% | - | 99.44% | 99.84% | 98.07% | 99.76% | 99.68% | 99.68% |
| 91.88% | 61.44% | 96.44% | - | 95.58% | 99.52% | 97.19% | 90.64% | 97.55% | 87.66% |
| 95.45% | 91.51% | 99.54% | - | 99.45% | 99.95% | 99.63% | 99.82% | 99.68% | 99.78% |
| 98.31% |
|---|
| 97.30% |
| 90.88% |
| 0.5 |
| 0.75 |
| 0.9 |
Only Custom Loss (gamma = 0.85)
Only Custom Loss (gamma = 2.0)
PlotNet v50
| 0.5 |
| 0.75 |
| 0.9 |
Only GIOU
Analysis of different object detection models (PlotQA)
| mAP |
|---|
| IOU |
|---|
| bar | dotline | legend-label | line | preview | title | xlabel | xticklabel | ylabel | yticklabel |
|---|
PlotNet v24
| 95.18% | 85.48% | 98.83% | - | 99.26% | 99.76% | 97.64% | 99.59% | 99.62% | 97.92% |
| 90.69% | 45.15% | 96.30% | - | 86.56% | 99.17% | 95.72% | 83.11% | 85.37% | 51.12% |
| 95.32% | 91.38% | 98.21% | - | 99.41% | 99.88% | 99.50% | 99.81% | 99.89% | 99.75% |
| 98.13% |
|---|
| 97.03% |
| 81.46% |
| 0.5 |
| 0.75 |
| 0.9 |
PlotNet v25
| 95.23% | 86.66% | 98.77% | - | 98.37% | 99.17% | 97.62% | 99.50% | 99.71% | 97.25% |
| 90.89% | 45.56% | 91.78% | - | 86.33% | 99.40% | 89.91% | 79.53% | 88.12% | 50.27% |
| 95.25% | 91.23% | 99.13% | - | 98.80% | 99.87% | 99.44% | 99.80% | 99.91% | 99.44% |
| 98.10% |
|---|
| 96.92% |
| 80.20% |
| 0.5 |
| 0.75 |
| 0.9 |
PlotNet v26
| 95.22% | 87.02% | 98.95% | - | 99.30% | 99.78% | 97.88% | 99.63% | 99.91% | 97.94% |
| 91.83% | 45.95% | 94.36% | - | 89.83% | 99.27% | 95.99% | 83.71% | 87.84% | 51.24% |
| 95.38% | 91.61% | 99.21% | - | 99.73% | 99.91% | 99.55% | 99.87% | 99.93% | 99.78% |
| 98.33% |
|---|
| 97.30% |
| 82.18% |
| 0.5 |
| 0.75 |
| 0.9 |
PlotNet v40
| 95.14% | 86.69% | 98.87% | - | 97.75% | 99.83% | 97.76% | 99.69% | 99.26% | 99.26% |
| 91.65% | 48.10% | 96.51% | - | 86.53% | 99.39% | 96.29% | 86.78% | 87.19% | 72.21% |
| 95.42% | 90.73% | 99.14% | - | 97.83% | 99.96% | 99.24% | 99.75% | 99.35% | 99.76% |
| 97.91% |
|---|
| 97.14% |
| 84.96% |
| 0.5 |
| 0.75 |
| 0.9 |
log IoU
without AN-ROI layer
1 - IoU
Custom Loss (gamma = 0.85)
SL1 + log IoU
SL1 + 1 - IoU
PlotNet v41
| 95.07% | 86.32% | 98.32% | - | 97.16% | 99.80% | 97.77% | 99.69% | 99.62% | 98.48% |
| 91.32% | 51.92% | 96.77% | - | 85.84% | 99.28% | 96.43% | 89.75% | 78.33% | 71.63% |
| 95.39% | 90.39% | 98.74% | - | 98.24% | 99.92% | 99.42% | 99.77% | 99.62% | 98.91% |
| 97.82% |
|---|
| 96.92% |
| 84.59% |
| 0.5 |
| 0.75 |
| 0.9 |
SL1 + Custom
PlotNet v39
| 95.17% | 87.37% | 98.91% | - | 97.92% | 99.86% | 97.78% | 99.73% | 99.81% | 99.31% |
| 91.94% | 51.98% | 97.49% | - | 90.01% | 99.59% | 96.68% | 89.78% | 87.25% | 73.92% |
| 95.54% | 91.11% | 99.26% | - | 98.25% | 99.97% | 99.46% | 99.79% | 99.83% | 99.91% |
| 98.12% |
|---|
| 97.32% |
| 86.51% |
| 0.5 |
| 0.75 |
| 0.9 |
Analysis of different object detection models (PlotQA)
| mAP |
|---|
| IOU |
|---|
| bar | dotline | legend-label | line | preview | title | xlabel | xticklabel | ylabel | yticklabel |
|---|
PlotNet v30
| 95.27% | 85.59% | 99.23% | - | 99.48% | 99.89% | 97.91% | 99.77% | 99.80% | 99.31% |
| 92.07% | 56.89% | 92.50% | - | 93.94% | 99.55% | 73.97% | 88.80% | 83.75% | 58.36% |
| 95.43% | 91.09% | 99.54% | - | 99.50% | 99.98% | 99.59% | 99.82% | 99.83% | 99.78% |
| 98.28% |
|---|
| 97.36% |
| 82.20% |
| 0.5 |
| 0.75 |
| 0.9 |
Only Custom Loss (gamma = 0.85)
Only Custom Loss (gamma = 0.85)
PlotNet v32
| 95.18% | 84.77% | 99.32% | - | 99.44% | 99.84% | 98.07% | 99.76% | 99.68% | 99.68% |
| 91.88% | 61.44% | 96.44% | - | 95.58% | 99.52% | 97.19% | 90.64% | 97.55% | 87.66% |
| 95.45% | 91.51% | 99.54% | - | 99.45% | 99.95% | 99.63% | 99.82% | 99.68% | 99.78% |
| 98.31% |
|---|
| 97.30% |
| 90.88% |
| 0.5 |
| 0.75 |
| 0.9 |
Only Custom Loss (gamma = 0.85)
Only Custom Loss (gamma = 2.0)
PlotNet v34
| 95.22% | 85.95% | 99.15% | - | 99.39% | 99.82% | 97.59% | 99.75% | 99.78% | 99.36% |
| 92.27% | 65.13% | 93.99% | - | 95.82% | 99.26% | 91.31% | 89.00% | 95.39% | 65.82% |
| 95.42% | 91.37% | 99.42% | - | 99.42% | 99.93% | 99.50% | 99.81% | 99.79% | 99.76% |
| 98.27% |
|---|
| 97.33% |
| 87.55% |
| 0.5 |
| 0.75 |
| 0.9 |
Only Custom Loss (gamma = 0.85)
Only Custom Loss (gamma = 3.0)
PlotNet v35
| 95.29% | 83.75% | 99.07% | - | 88.56% | 99.72% | 98.03% | 99.66% | 99.73% | 99.68% |
| 92.50% | 59.76% | 97.03% | - | 86.39% | 99.31% | 96.74% | 89.70% | 96.94% | 92.89% |
| 95.47% | 91.59% | 99.25% | - | 88.60% | 99.82% | 99.62% | 99.70% | 99.79% | 99.77% |
| 97.07% |
|---|
| 95.94% |
| 90.14% |
| 0.5 |
| 0.75 |
| 0.9 |
Only Custom Loss (gamma = 0.85)
Only Custom Loss (gamma = 4.0)
PlotNet v44
| 94.98% | 85.00% | 99.26% | - | 99.47% | 99.55% | 98.01% | 99.73% | 99.94% | 99.45% |
| 92.03% | 60.37% | 95.23% | - | 95.11% | 98.85% | 97.02% | 88.88% | 96.50% | 81.45% |
| 95.14% | 90.11% | 99.50% | - | 99.51% | 99.82% | 99.58% | 99.82% | 99.95% | 99.77% |
| 98.13% |
|---|
| 97.27% |
| 89.49% |
| 0.5 |
| 0.75 |
| 0.9 |
Only Custom Loss (gamma = 0.85)
Only Custom Loss (gamma = 1.0)
PlotNet v45
| 95.14% | 79.49% | 99.08% | - | 99.50% | 99.76% | 97.65% | 99.73% | 99.60% | 98.59% |
| 92.14% | 55.59% | 93.69% | - | 95.57% | 99.43% | 90.24% | 84.96% | 91.33% | 58.70% |
| 95.31% | 91.25% | 99.33% | - | 99.51% | 99.88% | 99.54% | 99.81% | 99.67% | 99.72% |
| 98.22% |
|---|
| 96.50% |
| 84.63% |
| 0.5 |
| 0.75 |
| 0.9 |
Only Custom Loss (gamma = 0.85)
Only Custom Loss (gamma = 1.25)
PlotNet v46
| 95.27% | 78.47% | 98.08% | - | 99.35% | 96.95% | 96.31% | 99.75% | 99.56% | 99.02% |
| 92.06% | 51.74% | 94.84% | - | 94.98% | 94.84% | 93.31% | 89.53% | 93.79% | 55.31% |
| 95.43% | 91.50% | 99.22% | - | 99.35% | 97.92% | 97.95% | 99.81% | 99.58% | 99.73% |
| 97.83% |
|---|
| 95.94% |
| 84.49% |
| 0.5 |
| 0.75 |
| 0.9 |
Only Custom Loss (gamma = 0.85)
Only Custom Loss (gamma = 1.5)
PlotNet v47
| 95.01% | 82.51% | 98.96% | - | 99.46% | 99.85% | 98.00% | 99.76% | 99.66% | 99.59% |
| 91.99% | 56.92% | 95.70% | - | 95.67% | 99.49% | 96.43% | 92.12% | 95.34% | 87.63% |
| 95.22% | 91.12% | 99.41% | - | 99.51% | 99.95% | 99.53% | 99.82% | 99.67% | 99.74% |
| 98.22% |
|---|
| 96.98% |
| 90.14% |
| 0.5 |
| 0.75 |
| 0.9 |
Only Custom Loss (gamma = 0.85)
Only Custom Loss (gamma = 1.75)
Analysis of different object detection models (PlotQA)
| mAP |
|---|
| IOU |
|---|
| bar | dotline | legend-label | line | preview | title | xlabel | xticklabel | ylabel | yticklabel |
|---|
PlotNet v42
| 95.24% | 85.56% | 99.04% | - | 99.36% | 95.66% | 97.03% | 99.76% | 99.90% | 99.42% |
| 92.94% | 59.12% | 94.87% | - | 95.58% | 92.46% | 94.46% | 94.29% | 95.36% | 76.85% |
| 95.37% | 91.08% | 99.28% | - | 99.53% | 96.88% | 98.77% | 99.79% | 99.90% | 99.75% |
| 97.82% |
|---|
| 96.78% |
| 88.44% |
| 0.5 |
| 0.75 |
| 0.9 |
SL1 + log IOU
PlotNet v43
| 95.21% | 89.84% | 99.42% | - | 99.51% | 99.84% | 98.13% | 99.80% | 99.92% | 99.69% |
| 92.80% | 70.11% | 98.47% | - | 96.33% | 99.27% | 97.31% | 94.12% | 97.66% | 94.42% |
| 95.38% | 91.19% | 99.60% | - | 99.52% | 99.97% | 99.66% | 99.82% | 99.93% | 99.77% |
| 98.32% |
|---|
| 97.93% |
| 93.39% |
| 0.5 |
| 0.75 |
| 0.9 |
PlotNet v48
SL1 + Custom Loss (gamma = 2.0)
SL1 + 1- IOU
| 95.23% | 89.30% | 99.35% | - | 99.49% | 99.80% | 96.80% | 99.79% | 99.86% | 99.63% |
| 92.78% | 68.26% | 97.75% | - | 95.90% | 99.04% | 93.64% | 92.97% | 96.24% | 93.12% |
| 95.44% | 91.25% | 99.60% | - | 99.53% | 99.97% | 98.39% | 99.82% | 99.88% | 99.77% |
| 98.18% |
|---|
| 97.70% |
| 92.19% |
| 0.5 |
| 0.75 |
| 0.9 |
PlotNet v51
| 0.5 |
| 0.75 |
| 0.9 |
SL1 + Only GIOU
| mAP |
|---|
| 97.76% |
|---|
| 94.58% |
| 77.22% |
| IOU |
|---|
| bar | dotline | legend-label | line | preview | title | xlabel | xticklabel | ylabel | yticklabel |
|---|
FrRCNN_FPN_RA
| 95.84% | 84.28% | 99.99% | - | 99.95% | 100.00% | 99.99% | 99.92% | 99.90% | 99.99% |
| 85.54% | 27.86% | 93.68% | - | 96.30% | 0.22% | 99.09% | 96.04% | 99.46% | 96.80% |
| 94.30% | 78.59% | 99.96% | - | 99.94% | 78.83% | 99.99% | 99.74% | 99.90% | 99.97% |
| 0.5 |
| 0.75 |
| 0.9 |
| 0.5 |
| 0.75 |
| 0.9 |
| 98.11% |
|---|
| 97.21% |
| 83.89% |
| 95.33% | 91.60% | 98.96% | - | 99.27% | 99.76% | 99.02% | 99.77% | 99.69% | 99.57% |
| 91.02% | 31.69% | 97.08% | - | 81.57% | 99.36% | 96.06% | 85.33% | 82.00% | 90.95% |
| 95.04% | 86.46% | 98.64% | - | 99.08% | 99.73% | 97.30% | 99.59% | 99.63% | 99.39% |
PlotNet v2
Analysis of different object detection models (PlotQA)
PlotNet v3
| 95.06% | 88.81% | 99.14% | - | 99.14% | 99.79% | 98.08% | 99.75% | 99.65% | 99.65% |
| 91.35% | 52.85% | 98.06% | - | 88.65% | 99.24% | 97.00% | 90.32% | 93.36% | 94.55% |
| 95.35% | 90.97% | 99.42% | - | 99.46% | 99.91% | 99.61% | 99.81% | 99.72% | 99.77% |
| 98.22% |
|---|
| 97.67% |
| 89.49% |
| 0.5 |
| 0.75 |
| 0.9 |
| 0.5 |
| 0.75 |
| 0.9 |
| 98.19% |
|---|
| 97.63% |
| 90.93% |
| 95.39% | 91.39% | 99.19% | - | 99.53% | 99.65% | 99.14% | 99.82% | 99.81% | 99.77% |
| 91.61% | 55.72% | 98.21% | - | 91.46% | 97.33% | 96.75% | 94.36% | 97.24% | 95.67% |
| 95.10% | 89.25% | 99.01% | - | 99.41% | 99.14% | 97.52% | 99.77% | 99.81% | 99.70% |
PlotNet v4
PlotNet v0
| 95.52% | 91.24% | 99.66% | - | 99.52% | 99.87% | 98.27% | 99.83% | 99.62% | 99.77% |
| 95.52% | 91.24% | 99.45% | - | 99.52% | 99.56% | 97.44% | 99.83% | 99.62% | 99.77% |
| 95.52% | 91.24% | 99.79% | - | 99.52% | 99.97% | 99.68% | 99.83% | 99.62% | 99.78% |
| 98.33% |
|---|
| 98.14% |
| 97.99% |
| 0.5 |
| 0.75 |
| 0.9 |
#FLOPs: 283.85G
#Param: 43.81M
#FLOPs: 100.927G
#Param: 131.944M
#FLOPs: 100.927G
#Param: 131.944M
#FLOPs: 100.927G
#Param: 131.944M
PlotNet v12
| 95.24% | 88.94% | 99.01% | - | 99.42% | 99.83% | 98.06% | 99.79% | 99.75% | 99.64% |
| 92.16% | 61.18% | 98.38% | - | 93.46% | 99.44% | 97.21% | 94.21% | 95.45% | 96.02% |
| 95.40% | 91.06% | 99.29% | - | 99.51% | 99.96% | 99.56% | 99.83% | 99.75% | 99.77% |
| 98.24% |
|---|
| 97.74% |
| 91.94% |
| 0.5 |
| 0.75 |
| 0.9 |
PlotNet v14
| 95.15% | 88.71% | 98.37% | - | 99.09% | 99.79% | 97.75% | 99.73% | 99.75% | 99.43% |
| 90.05% | 40.38% | 96.55% | - | 88.16% | 99.19% | 96.42% | 89.49% | 86.98% | 89.03% |
| 95.36% | 91.12% | 98.77% | - | 99.14% | 99.93% | 99.40% | 99.80% | 99.77% | 99.68% |
| 98.11% |
|---|
| 97.53% |
| 86.25% |
| 0.5 |
| 0.75 |
| 0.9 |
| 0.5 |
| 0.75 |
| 0.9 |
| 97.90% |
|---|
| 97.12% |
| 85.68% |
| 95.41% | 89.75% | 98.99% | - | 99.12% | 99.86% | 98.64% | 99.78% | 99.86% | 99.73% |
| 91.47% | 35.11% | 97.37% | - | 85.78% | 99.22% | 96.01% | 88.77% | 87.35% | 90.02% |
| 95.21% | 85.61% | 98.69% | - | 98.84% | 99.74% | 96.98% | 99.71% | 99.79% | 99.53% |
PlotNet v15
| mAP |
|---|
| 97.76% |
|---|
| 94.58% |
| 77.22% |
| IOU |
|---|
| bar | dotline | legend-label | line | preview | title | xlabel | xticklabel | ylabel | yticklabel |
|---|
FrRCNN_FPN_RA
| 95.84% | 84.28% | 99.99% | - | 99.95% | 100.00% | 99.99% | 99.92% | 99.90% | 99.99% |
| 85.54% | 27.86% | 93.68% | - | 96.30% | 0.22% | 99.09% | 96.04% | 99.46% | 96.80% |
| 94.30% | 78.59% | 99.96% | - | 99.94% | 78.83% | 99.99% | 99.74% | 99.90% | 99.97% |
| 0.5 |
| 0.75 |
| 0.9 |
| 0.5 |
| 0.75 |
| 0.9 |
| 98.16% |
|---|
| 97.49% |
| 90.17% |
| 95.42% | 91.12% | 98.98% | - | 99.34% | 99.93% | 99.13% | 99.82% | 99.91% | 99.76% |
| 90.87% | 52.84% | 97.68% | - | 90.27% | 99.37% | 96.55% | 92.97% | 96.34% | 94.67% |
| 95.11% | 87.89% | 98.59% | - | 99.17% | 99.80% | 97.55% | 99.77% | 99.91% | 99.63% |
PlotNet v8
Analysis of different object detection models (PlotQA)
PlotNet v7
| 95.17% | 87.85% | 99.05% | - | 99.29% | 99.81% | 97.87% | 99.75% | 99.96% | 99.64% |
| 91.62% | 48.07% | 98.08% | - | 89.12% | 99.29% | 96.97% | 93.00% | 96.63% | 94.72% |
| 95.40% | 90.91% | 99.31% | - | 99.48% | 99.93% | 99.53% | 99.81% | 99.96% | 99.77% |
| 98.23% |
|---|
| 97.60% |
| 89.72% |
| 0.5 |
| 0.75 |
| 0.9 |
PlotNet v1
| 94.97% | 87.13% | 97.42% | - | 97.87% | 99.11% | 96.38% | 99.68% | 99.02% | 99.04% |
| 89.46% | 37.63% | 93.64% | - | 78.12% | 95.22% | 94.06% | 88.10% | 66.95% | 83.86% |
| 95.32% | 90.65% | 97.83% | - | 98.31% | 99.66% | 98.19% | 99.78% | 99.02% | 99.40% |
| 97.57% |
|---|
| 96.74% |
| 80.78% |
| 0.5 |
| 0.75 |
| 0.9 |
| 0.5 |
| 0.75 |
| 0.9 |
| 97.62% |
|---|
| 94.03% |
| 78.71% |
| 95.32% | 86.32% | 99.37% | - | 99.46% | 99.95% | 98.93% | 99.80% | 99.70% | 99.76% |
| 87.96% | 6.30% | 95.11% | - | 78.23% | 99.28% | 94.62% | 80.52% | 84.85% | 81.51% |
| 94.79% | 58.12% | 99.06% | - | 98.57% | 99.83% | 97.16% | 99.64% | 99.64% | 99.43% |
PlotNet v5
- Table F1
-
Template wise answer distribution Table
-
Human Accuracy
-
Comparison Table (FQA, DVQA, PlotQA) like Table 1 in Kushal's paper
-
Number of questions with a particular question length (X=Q-length, Y=Number of Qs)->histogram
-
Average Q-length, Min Q-length and Max Q-length
-
Number of unique Qs compare with other datasets
-
Number of Qs answered by varying vocab. size
| IOU@0.75 | IOU@0.9 | IOU@0.5 | |
|---|---|---|---|
| mAP | |||
| Table F1-score |
| Structural | Data Retrieval | Reasoning | |
|---|---|---|---|
| Yes/No | |||
| Fixed vocab. | |||
| Open Vocab. |

PlotQA Answer Distribution
| Model | Binary | Fixed Vocab. | OOV |
|---|---|---|---|
| SAN (6.08%) | 80.20% | 19.80% | 0.00% |
| VOES (18.46%) | 0.00% | 13.43% | 20.60% |
PlotQA data distribution
| Dataset Split | Images | QA-pairs (old) | QA-pairs (new) |
|---|---|---|---|
| Train | 157070 | 5,733,893 | 20,249,479 |
| Validation | 33650 | 1,228,468 | 4,360,648 |
| Test | 33657 | 1,228,313 | 4,342,514 |
| Total | 224,377 | 8,190,674 | 28,952,641 |
ANSWERS
Old Distribution
New Distribution
PlotQA data distribution on TEST split
| Yes/No | Fixed Vocab | OOV |
|---|---|---|
| 23.46% | 76.53% | 0.00% |
| Yes/No | Fixed Vocab | OOV |
|---|---|---|
| 27.46% | 46.1% | 26.4% |
| Datasets | DVQA |
|---|
| Methods\Templates |
| Distribution |
| PlotQA |
|---|
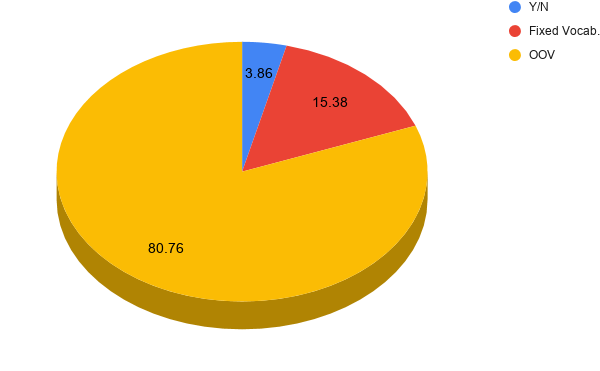
| Yes/No | Fixed Vocab | OOV |
|---|---|---|
| 3.86 | 15.38 | 80.76 |
| Datasets | PlotQA (Top-1k) |
|---|
| Methods\Templates |
| Distribution |
| PlotQA (Top-5k) | PlotQA (Top-10k) |
|---|
| Yes/No | Fixed Vocab | OOV |
|---|---|---|
| 3.86 | 26.90 | 69.24 |
| Yes/No | Fixed Vocab | OOV |
|---|---|---|
| 3.86 | 33.65 | 62.49 |
TEMPLATES
| Structure | Data | Reasoning |
|---|---|---|
| 13.48% | 31.93% | 54.59% |
| Structure | Data | Reasoning |
|---|---|---|
| 30.37% | 23.97% | 45.66% |
| Datasets | DVQA |
|---|
| Methods\Templates |
| Distribution |
| PlotQA |
|---|
Old Distribution
New Distribution
| Structure | Data | Reasoning |
|---|---|---|
| 13.48% | 31.93% | 54.59% |
| Structure | Data | Reasoning |
|---|---|---|
| 4.30% | 13.73% | 81.97% |
| Datasets | DVQA |
|---|
| Methods\Templates |
| Distribution |
| PlotQA |
|---|
PlotQA data distribution on TEST split
| Structure | Data | Reasoning |
|---|---|---|
| 82.13% | 15.02% | 14% |
| 17.8% | 84.98% | 85.91% |
| 0.00% | 0.00% | 0.00% |
| Yes/No |
|---|
| Fixed Vocab |
| OOV |
| Structure | Data | Reasoning |
|---|---|---|
| 37.59% | 20.85% | 24.18% |
| 62.4% | 56.3% | 29.89% |
| 0.00% | 22.84% | 45.92% |
| Datasets | DVQA | DIP |
|---|
| Answer \ Template |
| Structure | Data | Reasoning |
|---|---|---|
| 82.13% | 15.02% | 14% |
| 17.8% | 84.98% | 85.91% |
| 0.00% | 0.00% | 0.00% |
| Yes/No |
|---|
| Fixed Vocab |
| OOV |
| Structure | Data | Reasoning |
|---|---|---|
| 37.64% | 5.14% | 1.88% |
| 62.36% | 16.01% | 12.80% |
| 0.00% | 78.85% | 85.32% |
| Datasets | DVQA | DIP |
|---|
| Answer \ Template |
Old Distribution
New Distribution
PlotQA data distribution on TEST split
TEMPLATES & ANSWERS
*keeping top-1K answers in fixed vocab
Accuracy of different models (in %)
| Structure | Data | Reasoning |
|---|---|---|
| 94.01 | 95.35 | 66.02 |
| 77.30 | 32.06 | 29.27 |
| NA | 0.90 | 3.40 |
| 0.00 | 0.00 | 0.00 |
| 42.29 | 27.61 | 25.48 |
| NA | 32.00 | 15.44 |
| 94.01 | 95.35 | 66.02 |
| 81.66 | 40.60 | 35.74 |
| NA | 32.06 | 17.10 |
| Yes/No |
|---|
| Fixed Vocab |
| OOV |
| Yes/No |
| Fixed Vocab |
| OOV |
| Yes/No |
| Fixed Vocab |
| OOV |
| SAN |
|---|
| VOES |
|---|
| MaskRCNN | FrRCNN-FPN-RA |
|---|
| Answer \ Template |
| SAN- VOES |
|---|
Zooming in the accuracy of different models
* All accuracies are calculated with 5% threshold
| Structure | Data | Reasoning |
|---|---|---|
| 94.01 | 95.35 | 66.02 |
| 77.30 | 32.06 | 29.27 |
| NA | 0.90 | 3.40 |
| 0.00 | 0.00 | 0.00 |
| 42.72 | 29.71 | 31.19 |
| NA | 40.66 | 26.05 |
| 94.01 | 95.35 | 66.02 |
| 77.09 | 39.84 | 38.75 |
| NA | 40.66 | 26.05 |
| Model | MaskRCNN | FrRCNN-FPN-RA |
|---|---|---|
| SAN | 46.54 | 46.54 |
| VOES | 20.22 | 24.08 |
| SAN-VOES | 53.96 | 55.75 |
Overall Model Accuracy
Accuracy of different models (in %)
| Structure | Data | Reasoning |
|---|---|---|
| 91.12 | 97.32 | 62.75 |
| 66.85 | 30.76 | 16.03 |
| NA | 0.00 | 0.00 |
| 0.00 | 0.00 | 0.00 |
| 42.12 | 16.07 | 7.24 |
| NA | 57.39 | 14.95 |
| 91.12 | 97.32 | 62.75 |
| 66.86 | 22.64 | 7.95 |
| NA | 57.39 | 14.95 |
| Yes/No |
|---|
| Fixed Vocab |
| OOV |
| Yes/No |
| Fixed Vocab |
| OOV |
| Yes/No |
| Fixed Vocab |
| OOV |
| SAN |
|---|
| VOES |
|---|
| ~FrRCNN-FPN-RA (new dataset) | FrRCNN-FPN-RA (old dataset) |
|---|
| Answer \ Template |
| SAN- VOES |
|---|
Zooming in the accuracy of different models
* All accuracies are calculated with 5% threshold
| Structure | Data | Reasoning |
|---|---|---|
| 94.01 | 95.35 | 66.02 |
| 77.30 | 32.06 | 29.27 |
| NA | 0.90 | 3.40 |
| 0.00 | 0.00 | 0.00 |
| 42.72 | 29.71 | 31.19 |
| NA | 40.66 | 26.05 |
| 94.01 | 95.35 | 66.02 |
| 77.09 | 39.84 | 38.75 |
| NA | 40.66 | 26.05 |
| Model | FrRCNN-FPN-RA (new dataset) |
FrRCNN-FPN-RA (old dataset) |
|---|---|---|
| SAN | 7.76 | 46.54 |
| VOES* | 18.46 (approx) | 24.08 |
| SAN-VOES | 22.52 | 55.75 |
Overall Model Accuracy (in %)
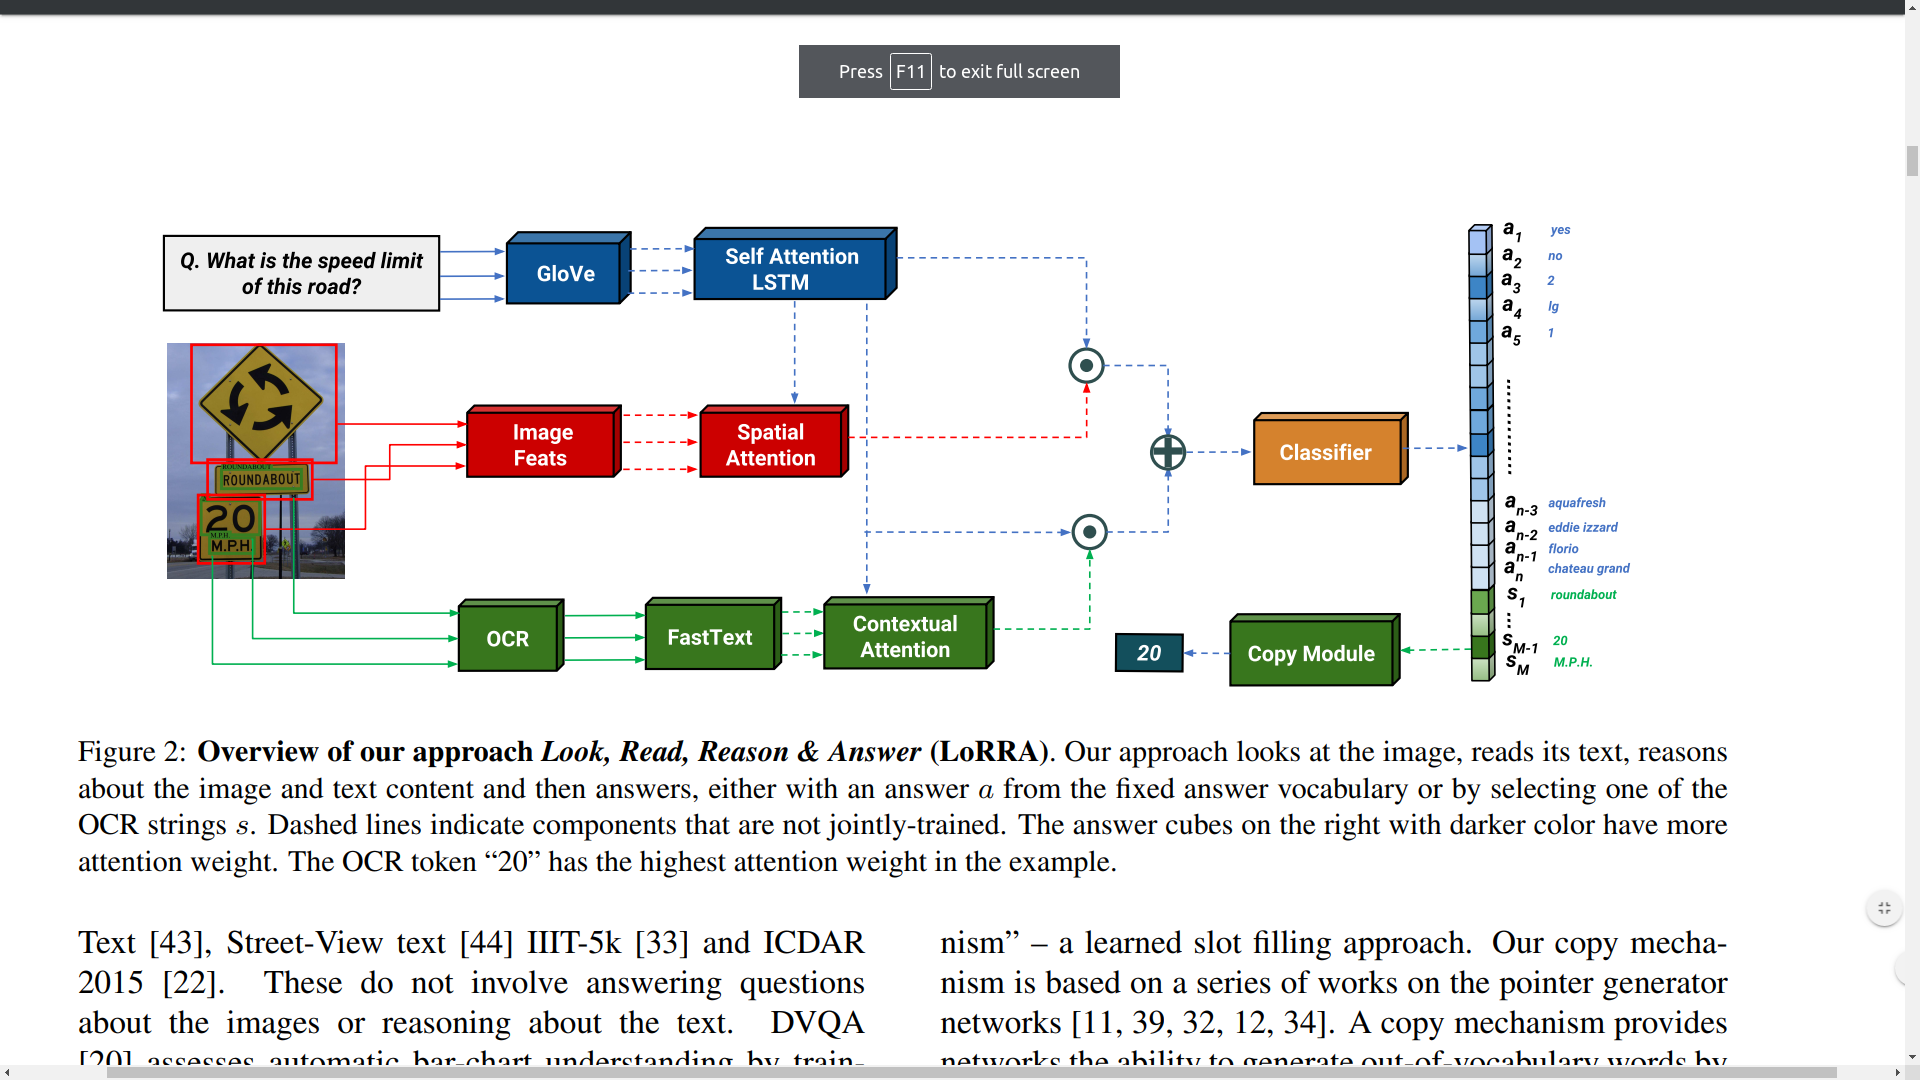
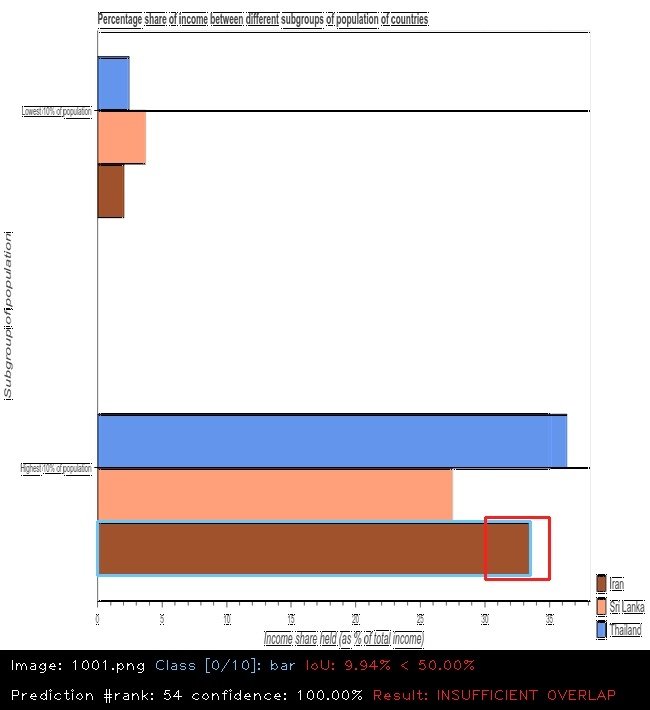
Look, Read, Reason and Answer
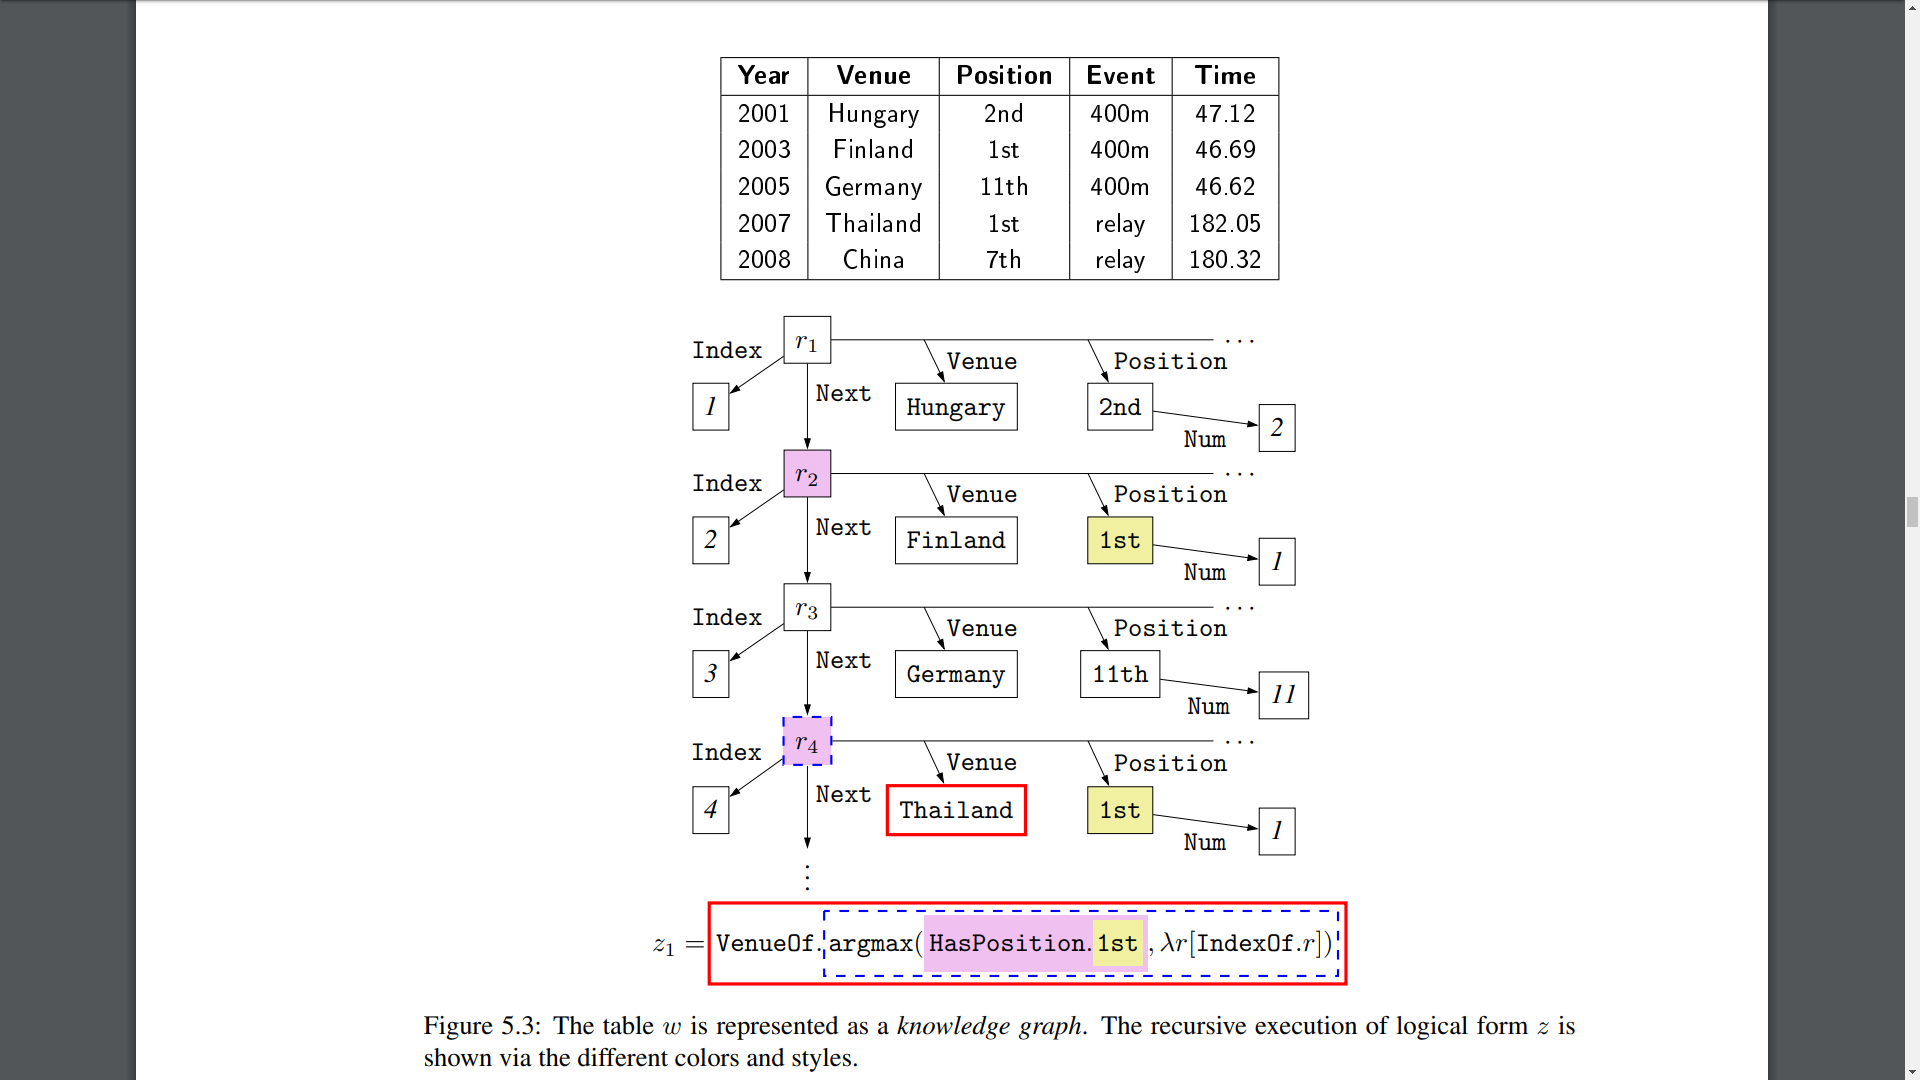
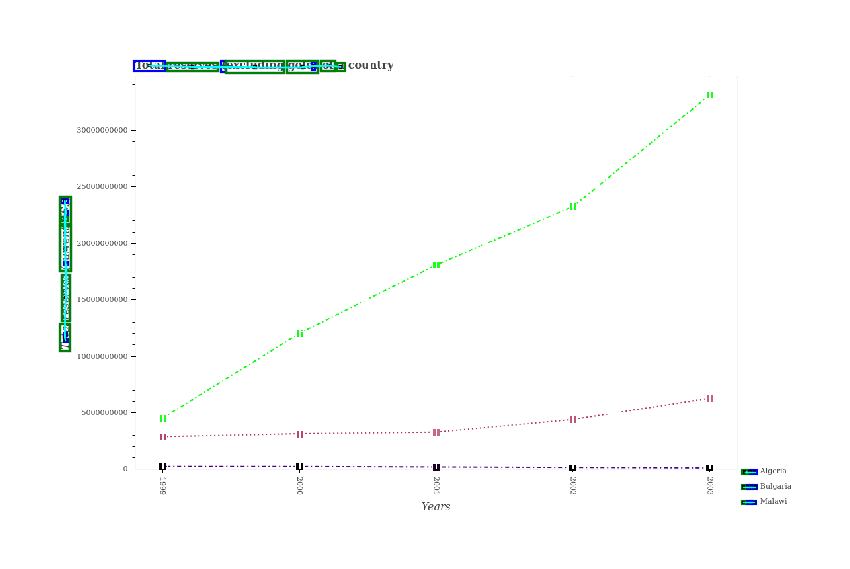
Q: Where did the last 1st place finish occur?
A: Thailand
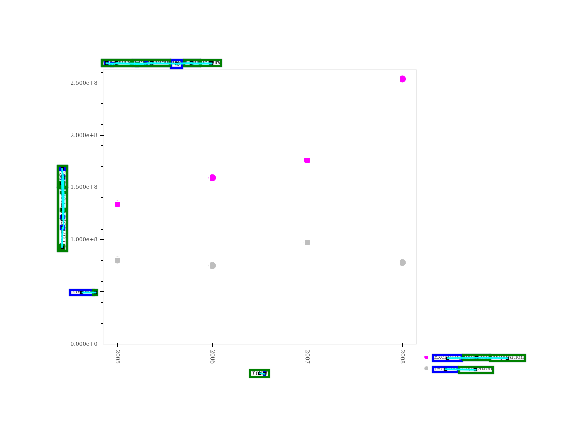
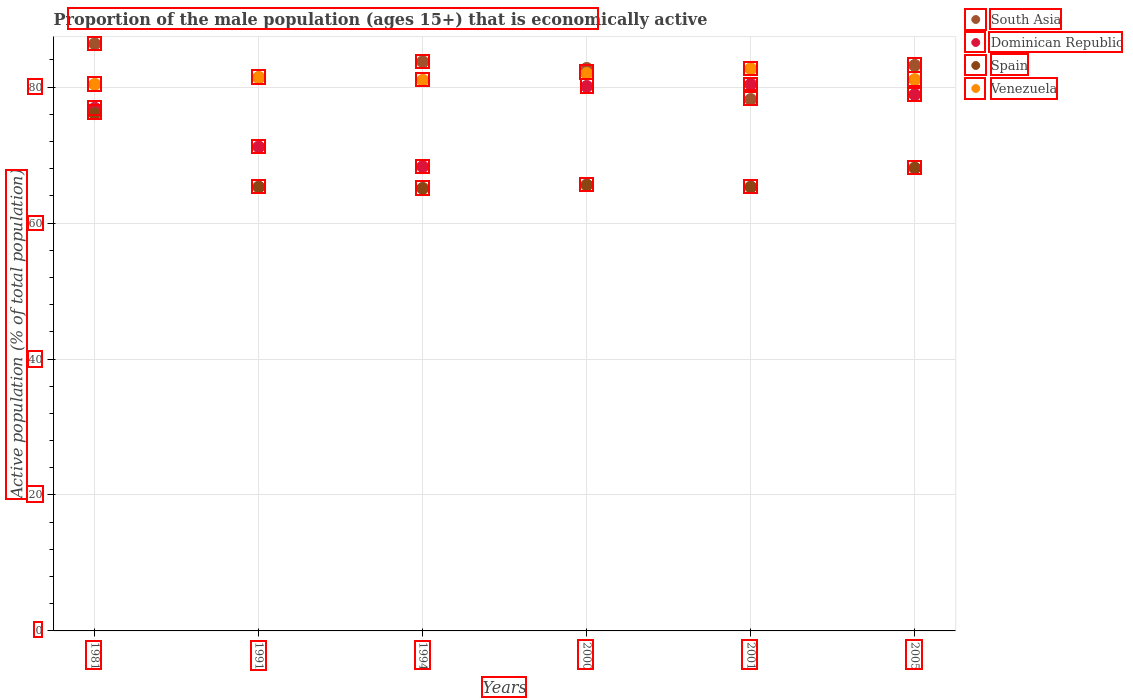
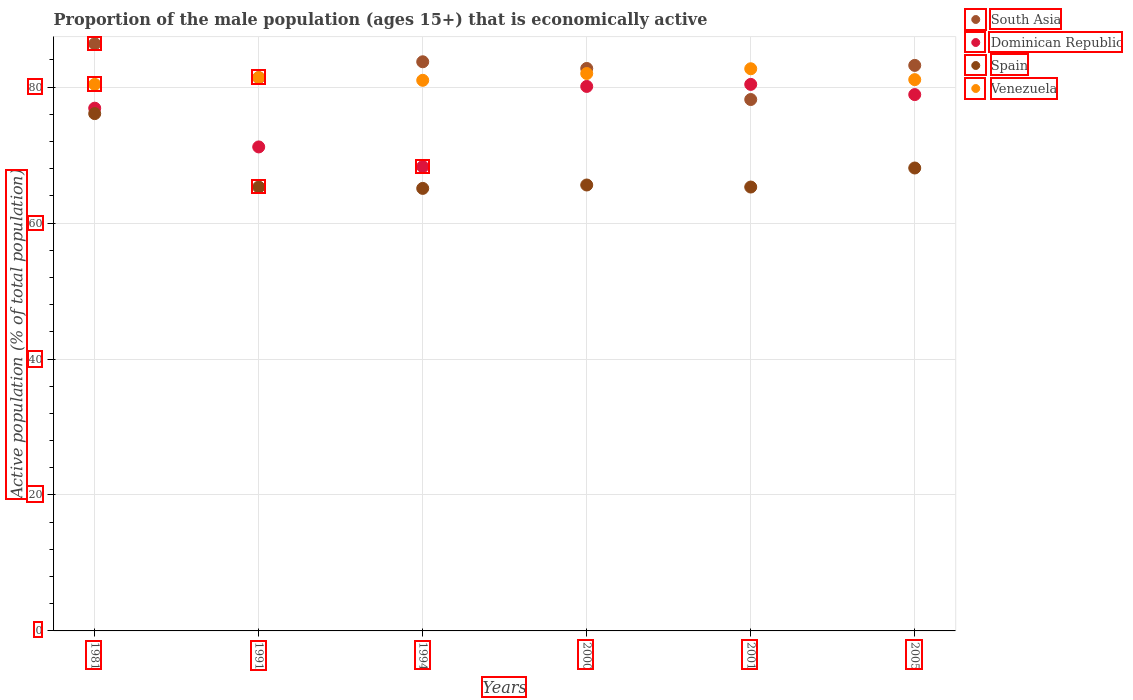
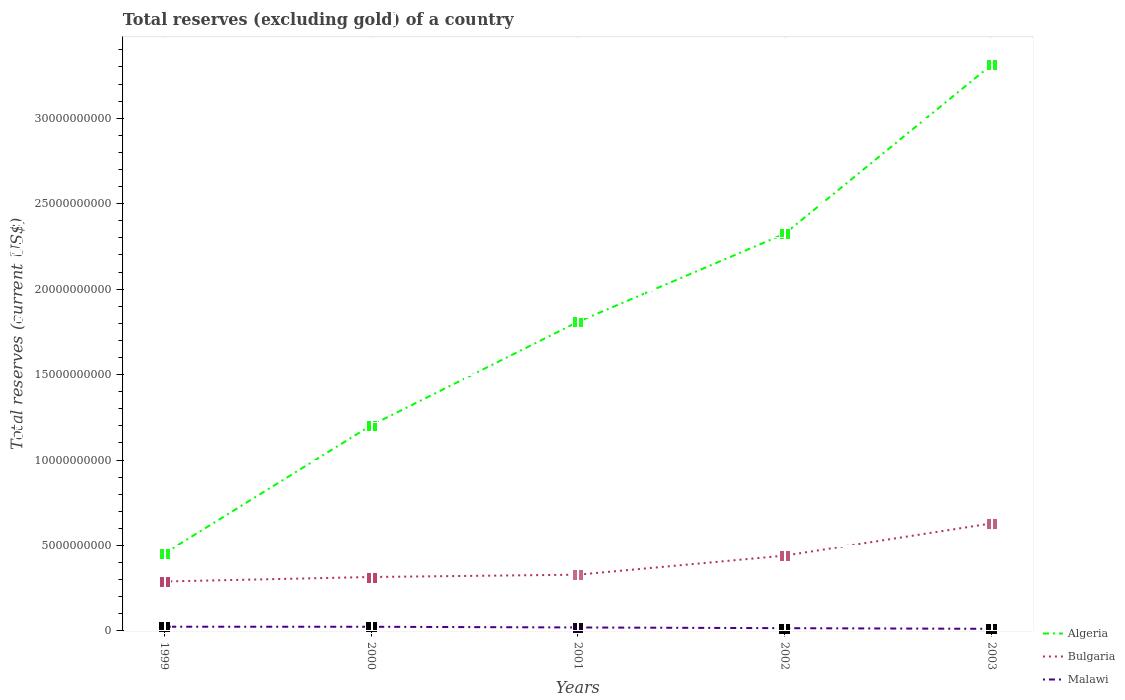
IOU v/s mAP for different object detection models
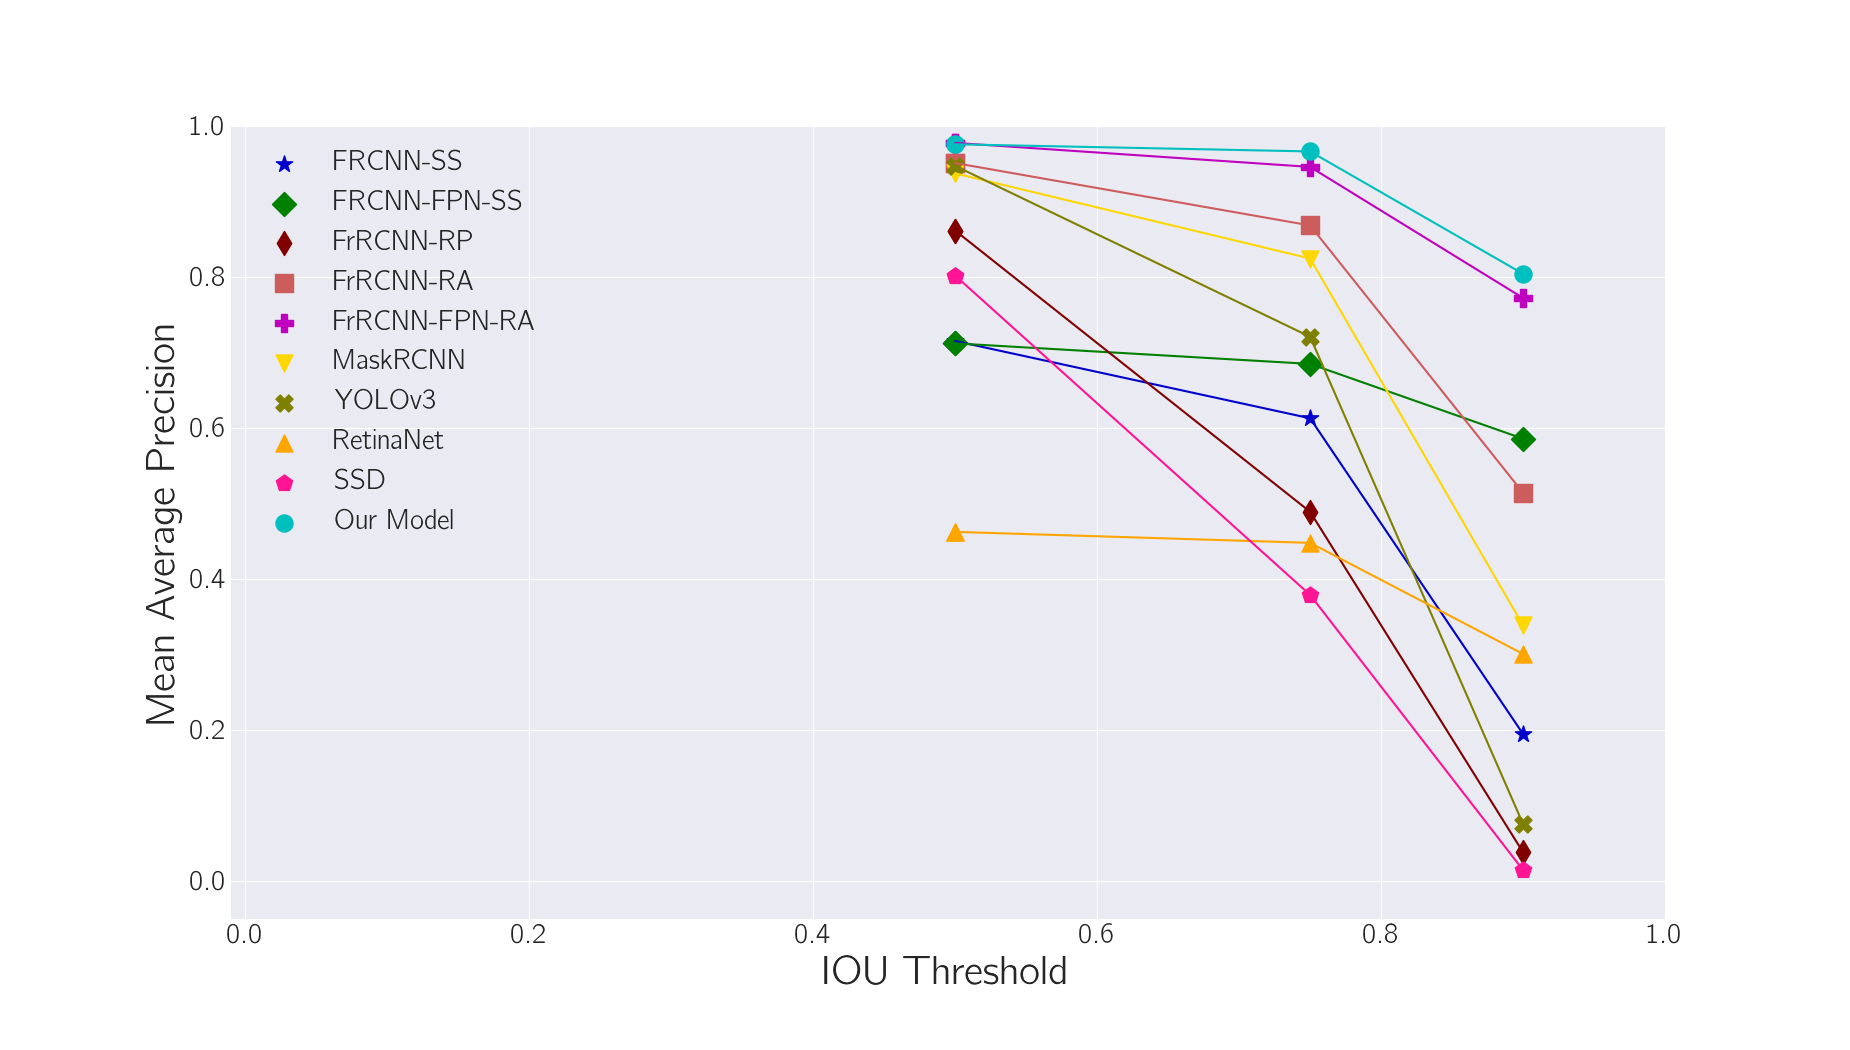
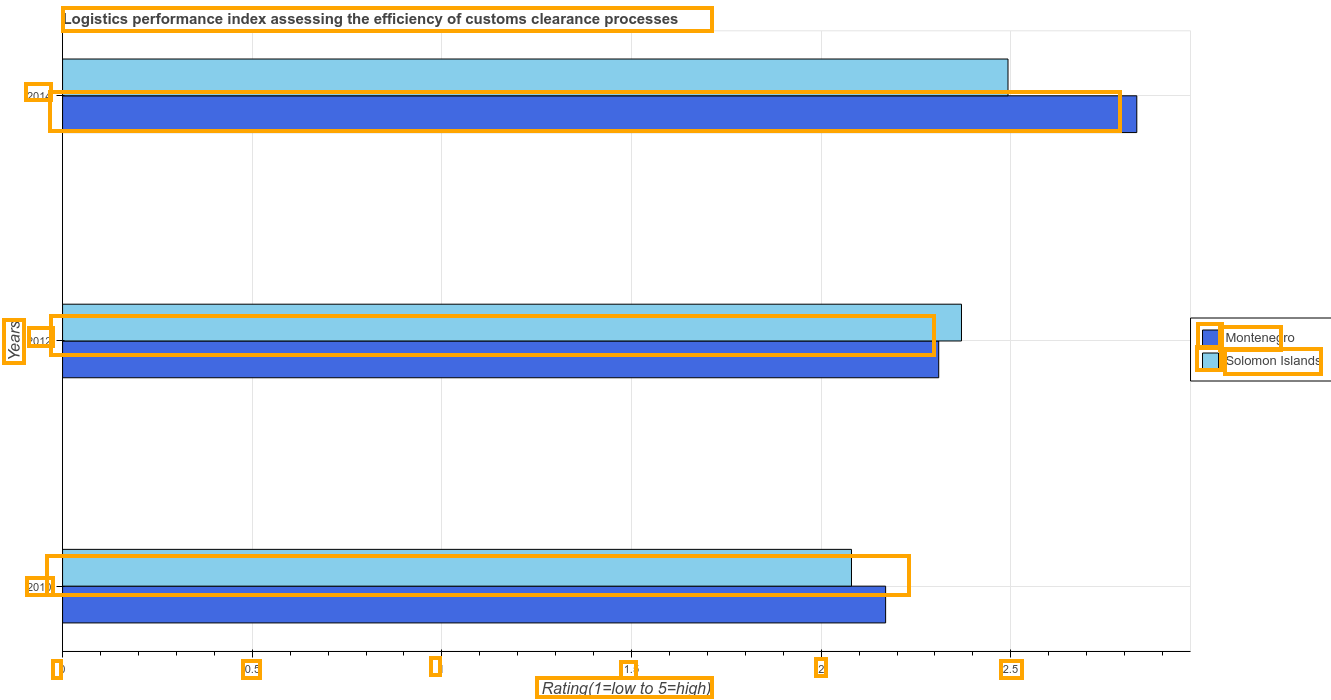
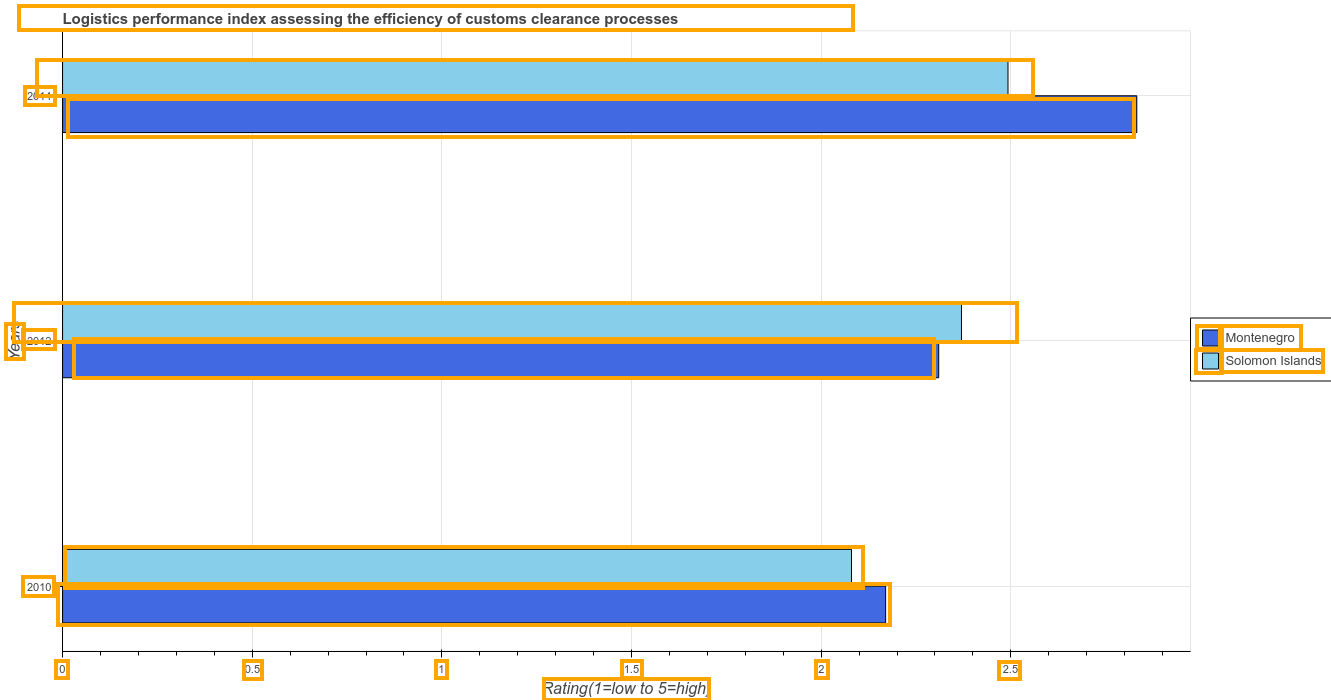
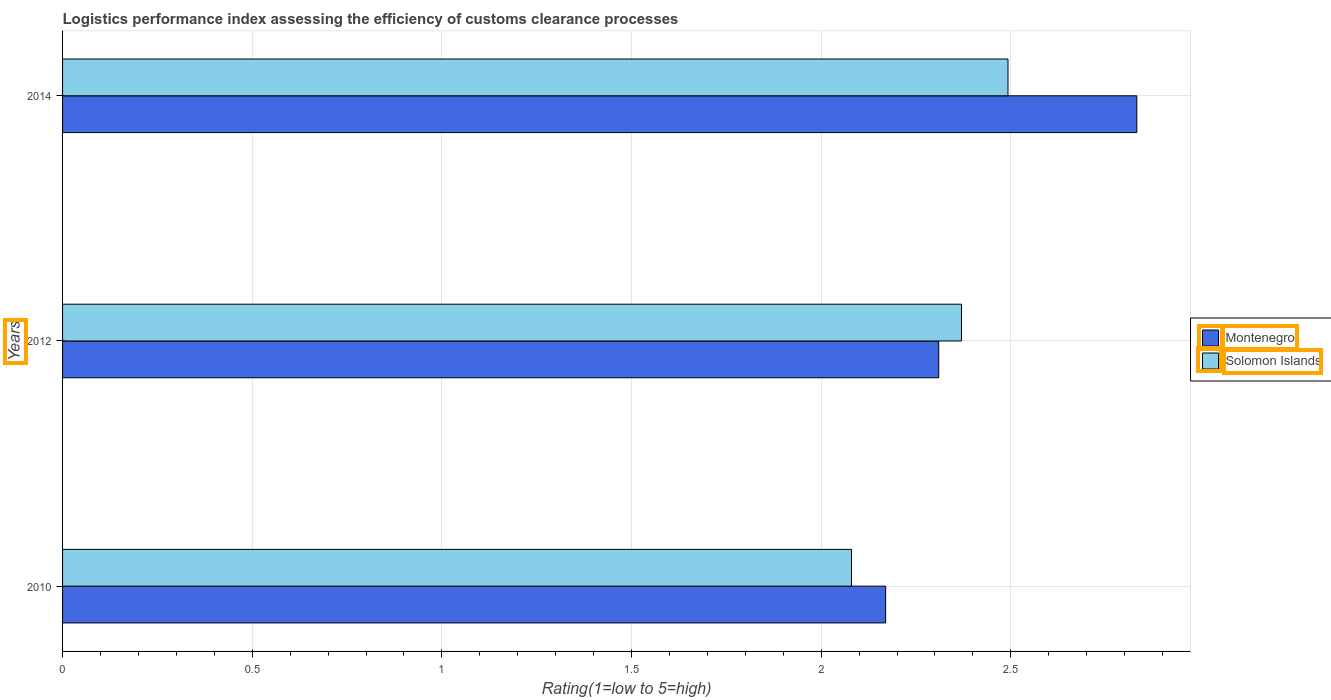
FRCNN_SS
FrRCNN_RP
SSD
RetinaNet
FRCNN_FPN_SS
FrRCNN_RA
FrRCNN_FPN_RA
YoloV3
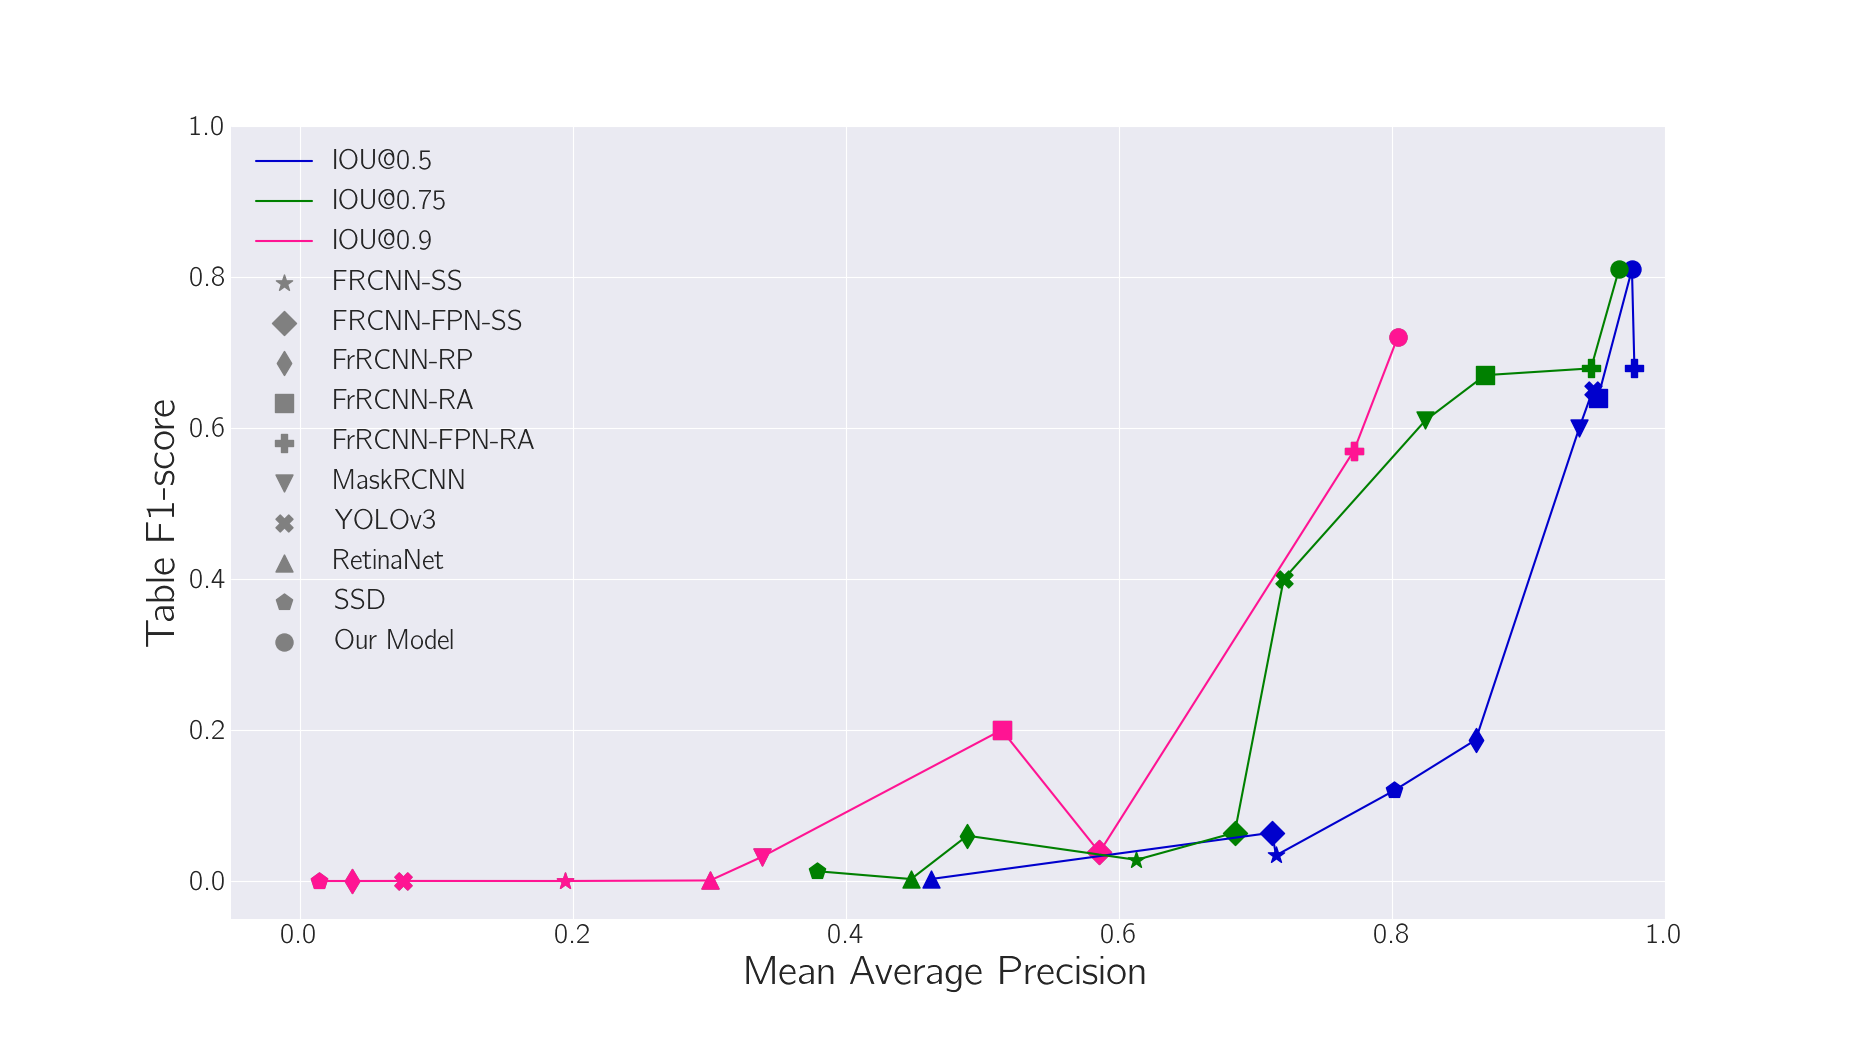
mAP v/s Table F1 score for different object detection models
| SS | RPN | Grid | ROI-Pool | ROI-Align | CNN | FPN | OHEM | FL | mAP |
|---|---|---|---|---|---|---|---|---|---|
| R-50 | 19.47% | ||||||||
| R-50 | 58.58% | ||||||||
| R-50 | 3.81% | ||||||||
| R-50 | 51.42% | ||||||||
| R-50 | 77.22% | ||||||||
| R-50 | 33.86% | ||||||||
| N.A | N.A | Darknet | 7.56% | ||||||
| N.A | N.A | R-50 | 30.07% | ||||||
| N.A | N.A | I-Net | 1.45% |
| FRCNN |
| FRCNN_FPN |
| FrRCNN_RP |
| FrRCNN_RA |
| FrRCNN_FPN_RA |
| Mask-RCNN |
| YOLO-V3 |
| RetinaNet |
| SSD |
| Proposal Method | Pooling Method | Feature Extraction | Class Imbalance |
|---|
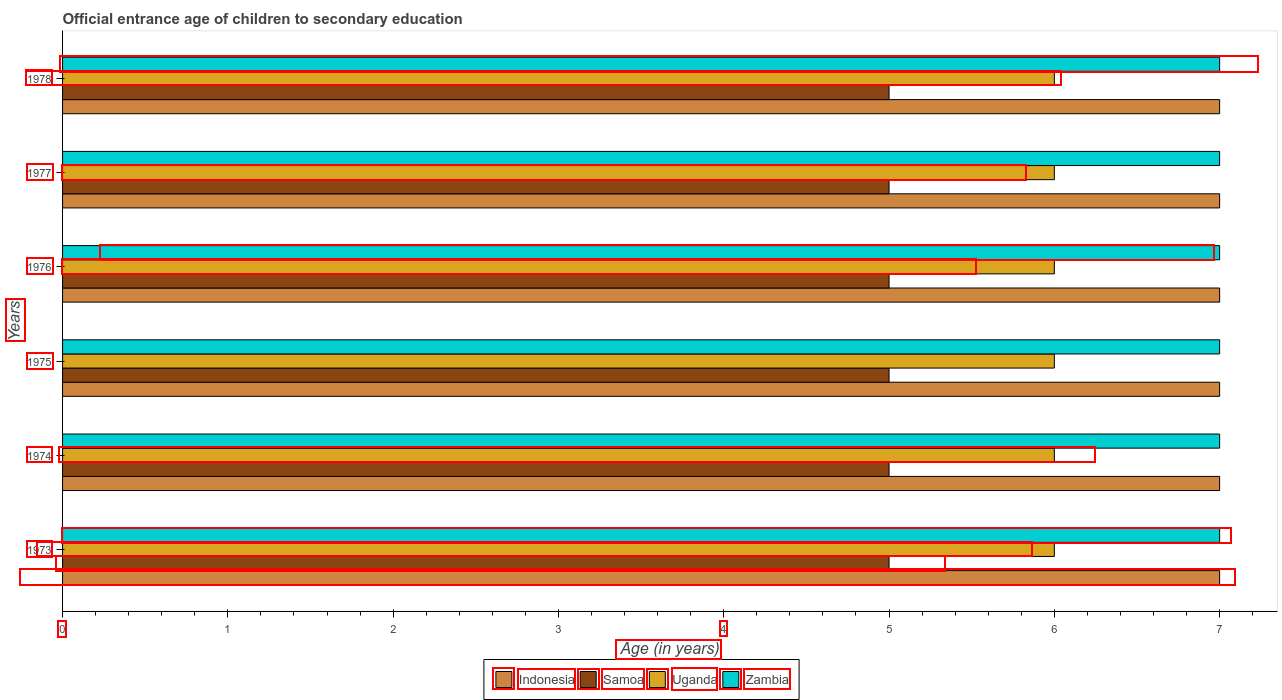
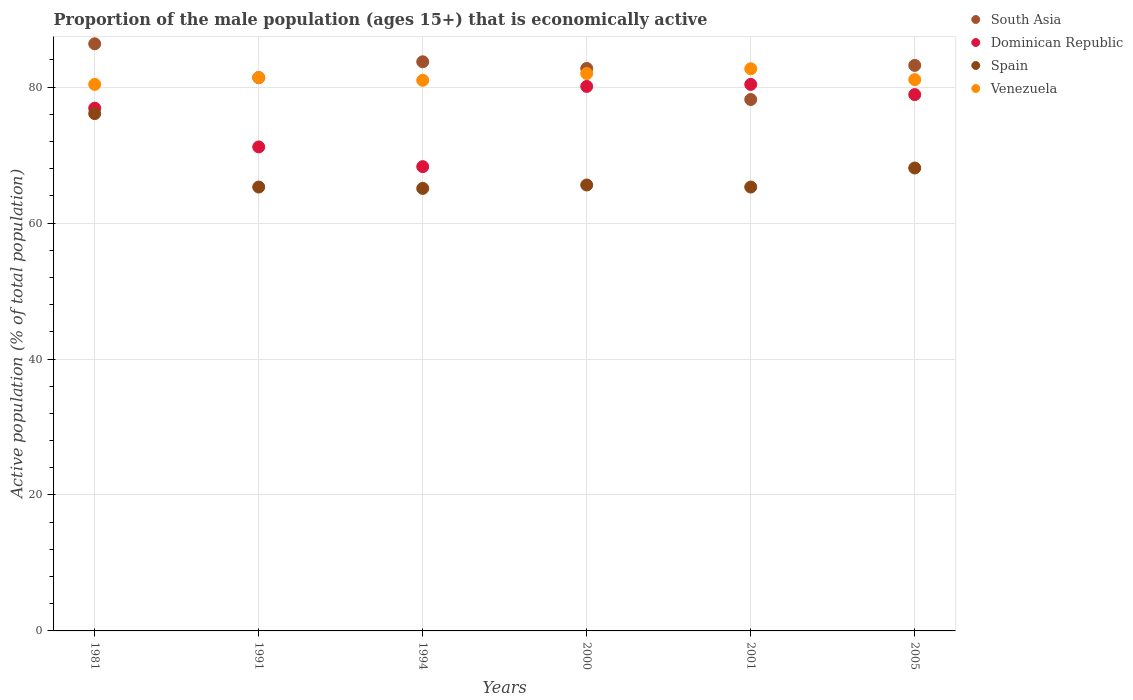
| CV | ROI-Align | CNN | FPN | Linking | AvgPool | mAP |
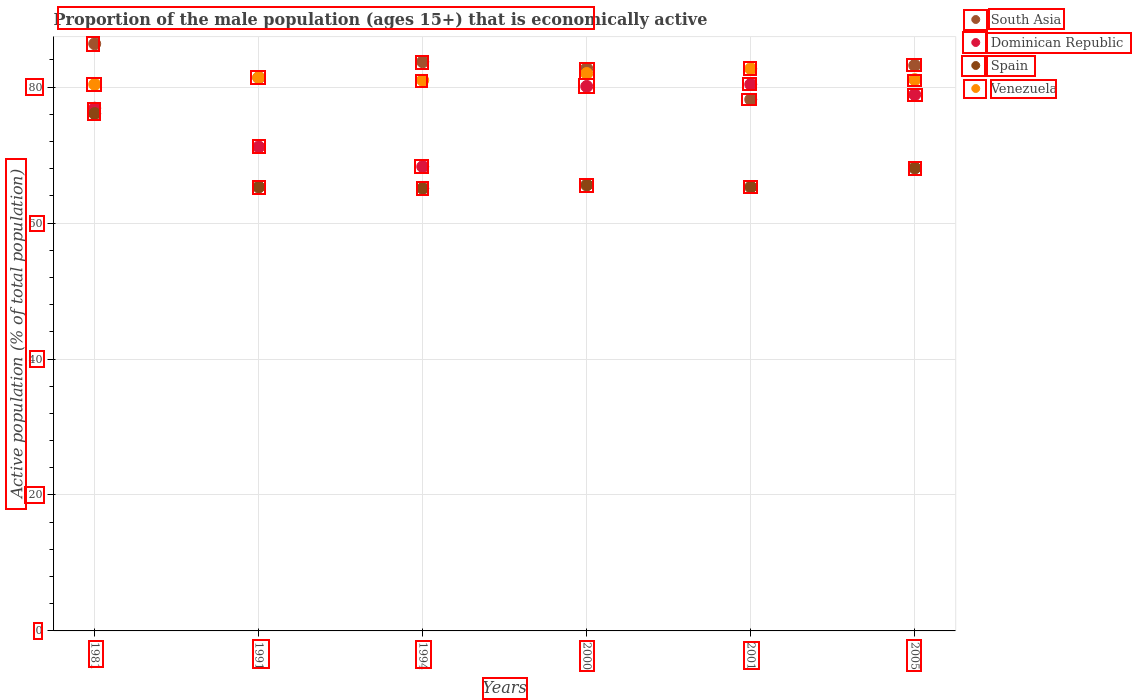
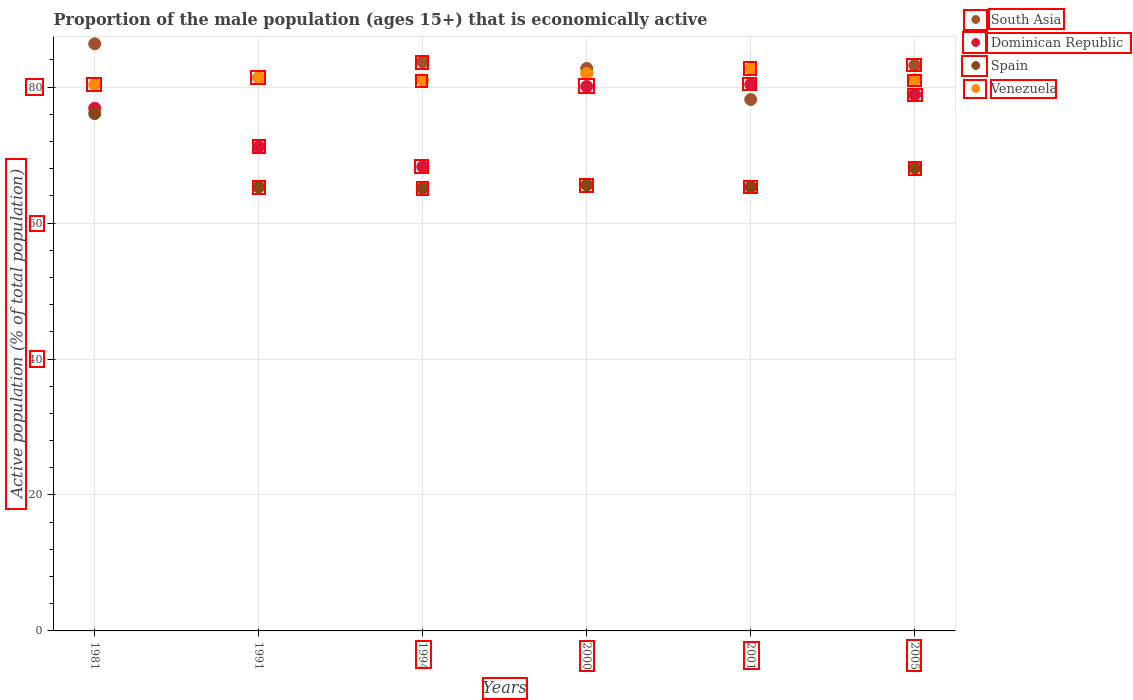
|---|---|---|---|---|---|---|
| R-10 | 80.68% | |||||
| R-10 | A0 | 68.18% | ||||
| R-10 | A1 | 72.87% | ||||
| R-10 | A2 | 79.80% | ||||
| R-10 | A3 | 80.42% | ||||
| R-22 | 83.89% | |||||
| R-22 | A0 | 71.14% | ||||
| R-22 | A1 | 73.23% | ||||
| R-22 | A2 | 74.51% | ||||
| R-22 | A3 | 81.61% | ||||
| R-50 | 59.28% | |||||
| R-50 | 74.08% |
| PlotQA_R10 |
| PlotQA_R10 |
| PlotQA_R10 |
| PlotQA_R10 |
| PlotQA_R10 |
| PlotQA_R22_FPN |
| PlotQA_R22_FPN |
| PlotQA_R22_FPN |
| PlotQA_R22_FPN |
| PlotQA_R22_FPN |
| PlotQA_R50 |
| PlotQA_R50_FPN |
*We are not doing anything for class-Imbalance
| IoU@0.5 | IoU@0.75 | IoU@0.9 | |
|---|---|---|---|
| FRCNN | |||
| FRCNN_FPN | |||
| FrRCNN_RP | |||
| FrRCNN_RA | |||
| FrRCNN_FPN_RA | |||
| Mask-RCNN | |||
| YOLO-V3 | |||
| RetinaNet | |||
| SSD |
Table Accuracy
Experiments
R50
R-
clipped
with FPN
without FPN
AvgPool
~AvgPool
~AvgPool
mAP
#FLOPs
#Params
Time
Table-F1
mAP
#FLOPs
#Params
Time
Table-F1
74.08%
119.38G
56.72M
59.28%
113.02G
233.2M
83.89%
96.14G
131.82M
80.68%
35.09G
130.44M
0.026s
0.032s
-
-
-
-
-
-
-
-
-
-
0.055s
-
-
0.040s
AvgPool
17.65G
42.36M
0.040s
61.28G
43.74M
0.055s
80.42%
51.42%
1.29T
35.9M
77.22%
283.85G
43.81M
0.374s
Fr-
RCNN
AvgPool
(i) mAP is reported at 0.9 IOU
(ii) Table F1-score is calculated using 5% relaxation for numeric values
| Selective Search | RPN+FPN | CV | CV+FPN | |
|---|---|---|---|---|
| #Proposals | ~2000 | ~225120 | ~90 | ~90*#Levels |
82.92%
0.57
0.70
0.72
Table Accuracy at 5% relaxation for numeric values
R-50_FPN
R-22_FPN
R-10
FrRCNN_FPN_RA
R-50
| IOU | Precision | Recall | F1-score |
|---|---|---|---|
| 0.5 | |||
| 0.75 | |||
| 0.9 |
| IOU | Precision | Recall | F1-score |
|---|---|---|---|
| 0.5 | |||
| 0.75 | |||
| 0.9 |
PlotQA
Experiments
R50
R-
clipped
with FPN
without FPN
AvgPool
AvgPool-A0
~AvgPool
~AvgPool
mAP
#FLOPs
#Params
Time
Table-F1
mAP
#FLOPs
#Params
Time
Table-F1
74.08%
119.38G
56.72M
59.28%
113.02G
233.2M
83.89%
96.14G
131.82M
80.68%
35.09G
130.44M
0.026s
0.032s
54.62G
26.943M
0.024s
-
-
-
-
-
-
-
-
-
-
0.025s
71.14%
-
-
0.016s
14.33G
25.57M
0.016s
68.18%
AvgPool-A1
AvgPool-A2
AvgPool-A3
16.19G
35.02M
0.016s
17.65G
42.36M
0.016s
14.85G
28.21M
0.016s
55.66G
29.583M
0.025s
58.37G
36.40M
0.025s
61.28G
43.74M
0.025s
73.23%
74.51%
72.87%
79.80%
80.42%
51.42%
1.29T
35.9M
77.22%
283.85G
43.81M
0.374s
Fr-
RCNN
AvgPool
(i) mAP is reported at 0.9 IOU
(ii) Table F1-score is calculated using 5% relaxation for numeric values
| Selective Search | RPN+FPN | CV | CV+FPN | |
|---|---|---|---|---|
| #Proposals | ~2000 | ~225120 | ~90 | ~90*#Levels |
82.92%
0.57
0.70
0.72
Analysis of different object detection models (PlotQA)
R-50_FPN
R-22_FPN
| 95.04% | 86.46% | 98.64% | - | 99.08% | 99.73% | 97.30% | 99.59% | 99.63% | 99.39% |
| 91.02% | 31.69% | 97.08% | - | 81.57% | 99.36% | 96.06% | 85.33% | 82.00% | 90.95% |
| 95.33% | 91.60% | 98.96% | - | 99.27% | 99.76% | 99.02% | 99.77% | 99.69% | 99.57% |
| 98.11% |
|---|
| 97.21% |
| 83.89% |
| 0.5 |
| 0.75 |
| 0.9 |
R-10
| 94.97% | 87.13% | 97.42% | - | 97.87% | 99.11% | 96.38% | 99.68% | 99.02% | 99.04% |
| 89.46% | 37.63% | 93.64% | - | 78.12% | 95.22% | 94.06% | 88.10% | 66.95% | 83.86% |
| 95.32% | 90.65% | 97.83% | - | 98.31% | 99.66% | 98.19% | 99.78% | 99.02% | 99.40% |
| 97.57% |
|---|
| 96.74% |
| 80.78% |
| 0.5 |
| 0.75 |
| 0.9 |
| 94.98% | 63.22% | 97.5% | - | 98.17% | 99.61% | 95.92% | 99.46% | 99.76% | 98.22% |
| 90.77% | 5.12% | 95.58% | - | 80.72% | 99.16% | 94.79% | 76.83% | 65.56% | 58.17% |
| 95.28% | 90.55% | 98.11% | - | 98.64% | 99.69% | 97.49% | 99.70% | 99.82% | 99.77% |
| 97.67% |
|---|
| 94.09% |
| 74.08% |
| 0.5 |
| 0.75 |
| 0.9 |
| 0.5 |
| 0.75 |
| 0.9 |
| 94.30% | 78.59% | 99.96% | - | 99.94% | 78.83% | 99.99% | 99.74% | 99.90% | 99.97% |
| 85.54% | 27.86% | 93.68% | - | 96.30% | 0.22% | 99.09% | 96.04% | 99.46% | 96.80% |
| 95.84% | 84.28% | 99.99% | - | 99.95% | 100.00% | 99.99% | 99.92% | 99.90% | 99.99% |
FrRCNN_FPN_RA
| bar | dotline | legend-label | line | preview | title | xlabel | xticklabel | ylabel | yticklabel |
|---|
| IOU |
|---|
| 97.76% |
|---|
| 94.58% |
| 77.22% |
| mAP |
|---|
R-50
| 93.66% | 71.68% | 97.85% | - | 94.72% | 99.80% | 97.46% | 98.58% | 97.46% | 93.97% |
| 87.64% | 15.72% | 74.57% | - | 41.87% | 98.92% | 81.60% | 54.21% | 43.35% | 35.67% |
| 93.97% | 89.42% | 98.80% | - | 98.84% | 99.85% | 99.38% | 99.47% | 99.54% | 99.76% |
| 97.67% |
|---|
| 93.91% |
| 59.28% |
| 0.5 |
| 0.75 |
| 0.9 |
R-22_FPN
(avgpool)
| 0.5 |
| 0.75 |
| 0.9 |
R-10
(avgpool)
| 0.5 |
| 0.75 |
| 0.9 |
| 95.14% | 85.08% | 98.81% | - | 97.46% | 99.71% | 97.22% | 99.66% | 99.33% | 99.43% |
| 91.13% | 32.03% | 97.26% | - | 85.15% | 99.32% | 95.43% | 87.42% | 83.50% | 75.02% |
| 95.37% | 91.18% | 99.09% | - | 97.67% | 99.80% | 98.96% | 99.73% | 99.41% | 99.70% |
| 97.88% |
|---|
| 96.87% |
| 82.92% |
| 94.89% | 87.25% | 97.56% | - | 98.79% | 99.58% | 92.86% | 99.65% | 99.75% | 99.29% |
| 89.61% | 36.31% | 92.40% | - | 82.23% | 98.18% | 88.27% | 85.66% | 71.14% | 79.96% |
| 95.23% | 91.22% | 98.04% | - | 99.34% | 99.73% | 95.39% | 99.76% | 99.78% | 99.70% |
| 97.58% |
|---|
| 96.63% |
| 80.42% |
| 91.59% | 77.72% | 89.15% | 35.24% | 67.96% | 7.89% | 77.59% | 92.93% | 55.06% | 89.74% |
| 87.59% | 42.77% | 79.05% | 20.46% | 66.39% | 0.22% | 69.78% | 88.29% | 46.63% | 84.60% |
| 92.05% | 79.30% | 89.55% | 45.42% | 68.00% | 18.51% | 80.07% | 93.07% | 56.32% | 89.76% |
| 71.21% |
|---|
| 68.49% |
| 58.58% |
FRCNN_
FPN_SS
| 91.23% | 78.60% | 97.87% | 0.00% | 97.46% | 29.13% | 87.96% | 98.37% | 84.87% | 99.13% |
| 55.73% | 0.73% | 34.91% | 0.00% | 62.27% | 0.87% | 49.02% | 63.99% | 23.60% | 71.44% |
| 92.45% | 93.56% | 99.92% | 0.00% | 98.05% | 88.88% | 98.76% | 99.67% | 99.15% | 99.71% |
| 87.02% |
| 76.46% |
| 36.26% |
| 0.5 |
| 0.75 |
| 0.9 |
FRCNN_
CV
| 81.99% | 79.55% | 99.34% | 30.93% | 95.70% | 49.36% | 97.75% | 95.59% | 99.42% | 94.85% |
| 47.54% | 4.96% | 50.83% | 5.83% | 32.43% | 0.33% | 46.2% | 33.72% | 80.53% | 36.31% |
| 91.24% | 95.05% | 99.77% | 51.83% | 99.87% | 99.91% | 99.94% | 99.75% | 99.97% | 99.84% |
| 93.72% |
|---|
| 82.45% |
| 33.86% |
| 0.5 |
| 0.75 |
| 0.9 |
Mask-RCNN
| IoU |
|---|
| 0.5 |
| 0.75 |
| 0.9 |
| bar | dotline | legend-label | line | preview | title | xlabel | xticklabel | ylabel | yticklabel |
|---|
| 76.92% | 71.67% | 92.13% | 50.17% | 94.44% | 17.10% | 90.59% | 84.17% | 80.90% | 62.68% |
| 72.08% |
|---|
| 15.51% | 10.90% | 7.15% | 6.54% | 11.70% | 0.02% | 4.39% | 8.08% | 9.59% | 1.70% |
| 7.56% |
|---|
| 87.95% | 94.13% | 99.95% | 66.25% | 99.94% | 99.58% | 99.99% | 99.89% | 99.77% | 99.64% |
| 94.71% |
|---|
YOLO-V3
| 0.5 |
| 0.75 |
| 0.9 |
| 24.92% | 18.21% | 44.27% | 22.71% | 30.29% | 45.05% | 75.62% | 34.81% | 66.07% | 16.93% |
| 37.89% |
|---|
| 1.39% | 0.04% | 2.18% | 1.25% | 0.39% | 0.04% | 3.39% | 0.44% | 5.14% | 0.20% |
| 1.45% |
|---|
| 61.09% | 74.27% | 71.15% | 47.41% | 78.61% | 99.80% | 99.95% | 93.46% | 97.35% | 78.72% |
| 80.18% |
|---|
SSD
| 0.5 |
| 0.75 |
| 0.9 |
| 24.37% | 0.00% | 88.62% | 22.49% | 99.03% | 0.00% | 66.20% | 66.77% | 37.60% | 42.83% |
| 14.67% | 0.00% | 65.33% | 7.43% | 64.38% | 0.00% | 57.42% | 99.73% | 31.77% | 29.97% |
| 27.76% | 0.00% | 91.43% | 28.62% | 99.42% | 0.00% | 66.77% | 67.41% | 38.00% | 43.05% |
| 46.24% |
|---|
| 44.79% |
| 30.07% |
| 0.5 |
| 0.75 |
| 0.9 |
Retina-Net
| mAP |
|---|
Analysis of different object detection models
Our Model
| 0.5 |
| 0.75 |
| 0.9 |
FrRCNN_FPN_RA
| 0.5 |
| 0.75 |
| 0.9 |
| 94.30% | 78.59% | 99.96% | - | 99.94% | 78.83% | 99.99% | 99.74% | 99.90% | 99.97% |
| 85.54% | 27.86% | 93.68% | - | 96.30% | 0.22% | 99.09% | 96.04% | 99.46% | 96.80% |
| 95.84% | 84.28% | 99.99% | - | 99.95% | 100.00% | 99.99% | 99.92% | 99.90% | 99.99% |
| 97.76% |
|---|
| 94.58% |
| 77.22% |
Analysis of different object detection models (DVQA)
| 0.5 |
| 0.75 |
| 0.9 |
| 95.80% | - | 99.92% | - | 99.89% | 99.99% | 100% | 99.66% | 100% | 99.72% |
| 82.10% | - | 96.52% | - | 98.17% | 99.24% | 98.79% | 96.00% | 98.51% | 98.33% |
| 98.28% | - | 99.99% | - | 99.95% | 99.99% | 100% | 99.83% | 100% | 99.82% |
FrRCNN_FPN_RA
| bar | dotline | legend-label | line | heading | title | xlabel | xticklabel | ylabel | yticklabel |
|---|
| IOU |
|---|
| 99.73% |
|---|
| 99.37% |
| 95.96% |
| mAP |
|---|
Analysis of different object detection models
| Model ID | Backbone CNN | Proposal Method | Additional information | Object Detection Model |
|---|---|---|---|---|
| FRCNN_CV | ResNet50 | CV method | 2-stage detector, RoiAlign | Fast RCNN |
| FRCNN_SS | ResNet50 | Selective Search | 2-stage detector, RoiAlign | Fast RCNN |
| FRCNN_FPN_SS | ResNet50-FPN | Selective Search | 2-stage detector | Fast RCNN |
| FrRCNN_RA | ResNet50 | RPN | 2-stage detector, RoiAlign | Faster RCNN |
| FrRCNN_FPN_RA | ResNet50-FPN | RPN | 2-stage detector, RoiAlign | Faster RCNN |
| FrRCNN_RP | ResNet50 | RPN | 2-stage detector, RoiPool | Faster RCNN |
| RetinaNet | ResNet50-FPN | fixed anchor | 1-stage detector | RetinaNet |
| MaskRCNN | ResNet50 | RPN+segmentation | 2-stage detector | Mask RCNN |
| SSD | InceptionNet | fixed anchor | 1-stage detector | SSD |
| YoloV3 | DarkNet-106 layers | k-means+anchor | 1-stage detector | YoloV3 |
| Backbone | Segmentation Procedure | Model | Accuracy |
|---|---|---|---|
| SegNet | |||
| PixelLink |
Model descriptions and Model_IDs
| FRCNN_CV | FRCNN_SS | FRCNN_FPN_SS | FrRCNN_RP | FrRCNN_RA | FrRCNN_FPN_RA | Mask-RCNN | SSD | YoloV3 | RetinaNet ( FL ) |
|---|---|---|---|---|---|---|---|---|---|
| 92.45% | 90.71% | 92.05% | 86.72% | 93.05% | 95.84% | 91.24% | 61.09% | 87.95% | 27.76% |
| 93.57% | 82.4% | 79.30% | 73.28% | 95.46% | 96.30% | 95.05% | 74.27% | 94.13% | 0.00% |
| 99.92% | 90.23% | 89.55% | 97.68% | 99.99% | 99.99% | 99.77% | 71.15% | 99.95% | 91.43% |
| 0.00% | 37.00% | 45.42% | 56.64% | 62.83% | 72.25% | 51.83% | 47.41% | 66.25% | 28.62% |
| 98.05% | 74.78% | 68.00% | 92.69% | 99.99% | 99.95% | 99.87% | 78.61% | 99.94% | 99.42% |
| 88.88% | 17.59% | 18.51% | 83.15% | 99.99% | 100% | 99.91% | 99.80% | 99.58% | 0.00% |
| 98.76% | 78.59% | 80.07% | 95.99% | 99.99% | 99.99% | 99.94% | 99.95% | 99.99% | 66.77% |
| 99.67% | 93.22% | 93.07% | 93.28% | 99.88% | 99.92% | 99.75% | 93.46% | 99.89% | 67.41% |
| 99.15% | 59.12% | 56.32% | 97.86% | 99.90% | 99.90% | 99.97% | 97.35% | 99.77% | 38.00% |
| 99.71% | 91.54% | 89.76% | 84.08% | 99.87% | 99.99% | 99.84% | 78.72% | 99.64% | 43.05% |
| 87.02% | 71.52% | 71.21% | 86.14% | 95.09% | 96.43% | 93.72% | 80.18% | 94.71% | 46.24% |
|
|
|---|
| bar |
| dotline |
| legend-label |
| line |
| preview |
| title |
| xlabel |
| xticklabel |
| ylabel |
| yticklabel |
| mAP |
Trained at
IOU@0.1
Analysis of different object detection models
Results are shown on Test split by keeping IoU 0.5
| RetinaNet ( CE ) |
|---|
| 00.00% |
| 00.00% |
| 00.00% |
| 00.00% |
| 00.00% |
| 00.00% |
| 00.00% |
| 00.00% |
| 00.00% |
| 00.00% |
| 00.00% |
| bar | dotline | legend-label | line | preview | title | xlabel | xticklabel | ylabel | yticklabel |
|---|---|---|---|---|---|---|---|---|---|
| 91.23% | 78.60% | 97.87% | 0.00% | 97.46% | 29.13% | 87.96% | 98.37% | 84.87% | 99.13% |
| mAP @ 0.75 |
|---|
| 76.46% |
| bar | dotline | legend-label | line | preview | title | xlabel | xticklabel | ylabel | yticklabel |
|---|---|---|---|---|---|---|---|---|---|
| 55.73% | 0.73% | 34.91% | 0.00% | 62.27% | 0.87% | 49.02% | 63.99% | 23.60% | 71.44% |
| mAP @ 0.9 |
|---|
| 36.26% |
| bar | dotline | legend-label | line | preview | title | xlabel | xticklabel | ylabel | yticklabel |
|---|---|---|---|---|---|---|---|---|---|
| 92.45% | 93.56% | 99.92% | 0.00% | 98.05% | 88.88% | 98.76% | 99.67% | 99.15% | 99.71% |
| mAP @ 0.5 |
|---|
| 87.02% |
| bar | dotline | legend-label | line | preview | title | xlabel | xticklabel | ylabel | yticklabel |
|---|---|---|---|---|---|---|---|---|---|
| 92.72% | 94.69% | 99.95% | 0.03% | 98.16% | 91.00% | 98.86% | 99.71% | 99.29% | 99.78% |
| mAP @ 0.1 |
|---|
| 87.42% |
| bar | dotline | legend-label | line | preview | title | xlabel | xticklabel | ylabel | yticklabel |
|---|---|---|---|---|---|---|---|---|---|
| 0.00% | 0.00% | 0.00% | 0.00% | 0.00% | 0.00% | 0.00% | 0.00% | 0.00% | 0.00% |
| mAP @ 1.0 |
|---|
| 0.00% |
FRCNN_CV
| bar | dotline | legend-label | line | preview | title | xlabel | xticklabel | ylabel | yticklabel |
|---|---|---|---|---|---|---|---|---|---|
| 85.20% | 58.28% | 82.33% | 21.39% | 65.27% | 2.21% | 71.95% | 90.04% | 47.9% | 88.38% |
| mAP @ 0.75 |
|---|
| 61.29% |
| bar | dotline | legend-label | line | preview | title | xlabel | xticklabel | ylabel | yticklabel |
|---|---|---|---|---|---|---|---|---|---|
| 53.38% | 0.22% | 12.59% | 3.13% | 14.06% | 0.03% | 42.13% | 25.49% | 11.68% | 31.98% |
| mAP @ 0.9 |
|---|
| 19.47% |
| bar | dotline | legend-label | line | preview | title | xlabel | xticklabel | ylabel | yticklabel |
|---|---|---|---|---|---|---|---|---|---|
| 90.71% | 82.40% | 90.23% | 37.00% | 74.78% | 17.59% | 78.59% | 93.22% | 59.12% | 91.54% |
| mAP @ 0.5 |
|---|
| 71.52% |
| bar | dotline | legend-label | line | preview | title | xlabel | xticklabel | ylabel | yticklabel |
|---|---|---|---|---|---|---|---|---|---|
| 91.61% | 83.75% | 90.83% | 55.78% | 82.81% | 22.55% | 82.54% | 93.25% | 69.75% | 91.61% |
| mAP @ 0.1 |
|---|
| 76.45% |
FRCNN_SS
| bar | dotline | legend-label | line | preview | title | xlabel | xticklabel | ylabel | yticklabel |
|---|---|---|---|---|---|---|---|---|---|
| 0.00% | 0.00% | 0.00% | 0.00% | 0.00% | 0.00% | 0.00% | 0.00% | 0.00% | 0.00% |
| mAP @ 1.0 |
|---|
| 0.00% |
| bar | dotline | legend-label | line | preview | title | xlabel | xticklabel | ylabel | yticklabel |
|---|---|---|---|---|---|---|---|---|---|
| 91.59% | 77.72% | 89.15% | 35.24% | 67.96% | 7.89% | 77.59% | 92.93% | 55.06% | 89.74% |
| mAP @ 0.75 |
|---|
| 68.49% |
| bar | dotline | legend-label | line | preview | title | xlabel | xticklabel | ylabel | yticklabel |
|---|---|---|---|---|---|---|---|---|---|
| 87.59% | 42.77% | 79.05% | 20.46% | 66.39% | 0.22% | 69.78% | 88.29% | 46.63% | 84.60% |
| mAP @ 0.9 |
|---|
| 58.58% |
| bar | dotline | legend-label | line | preview | title | xlabel | xticklabel | ylabel | yticklabel |
|---|---|---|---|---|---|---|---|---|---|
| 92.05% | 79.30% | 89.55% | 45.42% | 68.00% | 18.51% | 80.07% | 93.07% | 56.32% | 89.76% |
| mAP @ 0.5 |
|---|
| 71.21% |
| bar | dotline | legend-label | line | preview | title | xlabel | xticklabel | ylabel | yticklabel |
|---|---|---|---|---|---|---|---|---|---|
| 92.47% | 79.33% | 89.59% | 59.53% | 68.07% | 19.25% | 80.70% | 93.08% | 56.53% | 89.78% |
| mAP @ 0.1 |
|---|
| 72.83% |
FRCNN_FPN_SS
| bar | dotline | legend-label | line | preview | title | xlabel | xticklabel | ylabel | yticklabel |
|---|---|---|---|---|---|---|---|---|---|
| 0.00% | 0.00% | 0.00% | 0.00% | 0.00% | 0.00% | 0.00% | 0.00% | 0.00% | 0.00% |
| mAP @ 1.0 |
|---|
| 0.00% |
| bar | dotline | legend-label | line | preview | title | xlabel | xticklabel | ylabel | yticklabel |
|---|---|---|---|---|---|---|---|---|---|
| 59.06% | 36.74% | 73.85% | 32.13% | 38.80% | 4.51% | 60.18% | 59.10% | 74.26% | 50.41% |
| mAP @ 0.75 |
|---|
| 48.90% |
| bar | dotline | legend-label | line | preview | title | xlabel | xticklabel | ylabel | yticklabel |
|---|---|---|---|---|---|---|---|---|---|
| 6.92% | 1.68% | 7.78% | 1.10% | 1.45% | 0.00% | 4.35% | 6.10% | 3.57% | 5.18% |
| mAP @ 0.9 |
|---|
| 3.81% |
| bar | dotline | legend-label | line | preview | title | xlabel | xticklabel | ylabel | yticklabel |
|---|---|---|---|---|---|---|---|---|---|
| 86.72% | 73.28% | 97.68% | 56.64% | 92.69% | 83.15% | 95.99% | 93.28% | 97.86% | 84.08% |
| mAP @ 0.5 |
|---|
| 86.14% |
| bar | dotline | legend-label | line | preview | title | xlabel | xticklabel | ylabel | yticklabel |
|---|---|---|---|---|---|---|---|---|---|
| 88.96% | 76.48% | 97.77% | 67.77% | 92.98% | 88.16% | 96.23% | 93.81% | 98.1% | 84.58% |
| mAP @ 0.1 |
|---|
| 88.48% |
FrRCNN_RP
| bar | dotline | legend-label | line | preview | title | xlabel | xticklabel | ylabel | yticklabel |
|---|---|---|---|---|---|---|---|---|---|
| 0.00% | 0.00% | 0.00% | 0.00% | 0.00% | 0.00% | 0.00% | 0.00% | 0.00% | 0.00% |
| mAP @ 1.0 |
|---|
| 0.00% |
| bar | dotline | legend-label | line | preview | title | xlabel | xticklabel | ylabel | yticklabel |
|---|---|---|---|---|---|---|---|---|---|
| 86.92% | 87.32% | 99.77% | 44.55% | 99.59% | 55.02% | 99.90% | 98.08% | 99.84% | 97.27% |
| mAP @ 0.75 |
|---|
| 86.83% |
| bar | dotline | legend-label | line | preview | title | xlabel | xticklabel | ylabel | yticklabel |
|---|---|---|---|---|---|---|---|---|---|
| 63.89% | 12.82% | 70.95% | 16.76% | 60.61% | 0.18% | 83.88% | 60.76% | 93.47% | 50.87% |
| mAP @ 0.9 |
|---|
| 51.42% |
| bar | dotline | legend-label | line | preview | title | xlabel | xticklabel | ylabel | yticklabel |
|---|---|---|---|---|---|---|---|---|---|
| 93.05% | 95.46% | 99.99% | 62.83% | 99.99% | 99.99% | 99.99% | 99.88% | 99.90% | 99.87% |
| mAP @ 0.5 |
|---|
| 95.09% |
| bar | dotline | legend-label | line | preview | title | xlabel | xticklabel | ylabel | yticklabel |
|---|---|---|---|---|---|---|---|---|---|
| 95.13% | 96.22% | 99.99% | 75.76% | 99.99% | 99.99% | 99.99% | 99.92% | 99.90% | 99.92% |
| mAP @ 0.1 |
|---|
| 96.68% |
FrRCNN_RA
| bar | dotline | legend-label | line | preview | title | xlabel | xticklabel | ylabel | yticklabel |
|---|---|---|---|---|---|---|---|---|---|
| 0.00% | 0.00% | 0.00% | 0.00% | 0.00% | 0.00% | 0.00% | 0.00% | 0.00% | 0.00% |
| mAP @ 1.0 |
|---|
| 0.00% |
| bar | dotline | legend-label | line | preview | title | xlabel | xticklabel | ylabel | yticklabel |
|---|---|---|---|---|---|---|---|---|---|
| 94.30% | 95.14% | 99.96% | 62.04% | 99.94% | 78.83% | 99.99% | 99.74% | 99.90% | 99.97% |
| mAP @ 0.75 |
|---|
| 92.98% |
| bar | dotline | legend-label | line | preview | title | xlabel | xticklabel | ylabel | yticklabel |
|---|---|---|---|---|---|---|---|---|---|
| 85.54% | 18.07% | 93.68% | 37.65% | 96.30% | 0.22% | 99.09% | 96.04% | 99.46% | 96.80% |
| mAP @ 0.9 |
|---|
| 72.29% |
| bar | dotline | legend-label | line | preview | title | xlabel | xticklabel | ylabel | yticklabel |
|---|---|---|---|---|---|---|---|---|---|
| 95.84% | 96.30% | 99.99% | 72.25% | 99.95% | 100.00% | 99.99% | 99.92% | 99.90% | 99.99% |
| mAP @ 0.5 |
|---|
| 96.43% |
| bar | dotline | legend-label | line | preview | title | xlabel | xticklabel | ylabel | yticklabel |
|---|---|---|---|---|---|---|---|---|---|
| 96.35% | 96.51% | 99.99% | 82.72% | 99.95% | 100.00% | 100.00% | 99.94% | 99.90% | 99.99% |
| mAP @ 0.1 |
|---|
| 97.53% |
FrRCNN_FPN_RA
| bar | dotline | legend-label | line | preview | title | xlabel | xticklabel | ylabel | yticklabel |
|---|---|---|---|---|---|---|---|---|---|
| 0.00% | 0.00% | 0.00% | 0.00% | 0.00% | 0.00% | 0.00% | 0.00% | 0.00% | 0.00% |
| mAP @ 1.0 |
|---|
| 0.00% |
| bar | dotline | legend-label | line | preview | title | xlabel | xticklabel | ylabel | yticklabel |
|---|---|---|---|---|---|---|---|---|---|
| 24.37% | 0.00% | 88.62% | 22.49% | 99.03% | 0.00% | 66.20% | 66.77% | 37.60% | 42.83% |
| mAP @ 0.75 |
|---|
| 44.79% |
| bar | dotline | legend-label | line | preview | title | xlabel | xticklabel | ylabel | yticklabel |
|---|---|---|---|---|---|---|---|---|---|
| 14.67% | 0.00% | 65.33% | 7.43% | 64.38% | 0.00% | 57.42% | 29.73% | 31.77% | 29.97% |
| mAP @ 0.9 |
|---|
| 30.07% |
| bar | dotline | legend-label | line | preview | title | xlabel | xticklabel | ylabel | yticklabel |
|---|---|---|---|---|---|---|---|---|---|
| 27.76% | 0.00% | 91.43% | 28.62% | 99.42% | 0.00% | 66.77% | 67.41% | 38.00% | 43.05% |
| mAP @ 0.5 |
|---|
| 46.24% |
| bar | dotline | legend-label | line | preview | title | xlabel | xticklabel | ylabel | yticklabel |
|---|---|---|---|---|---|---|---|---|---|
| 32.69% | 0.00% | 93.24% | 31.13% | 99.42% | 0.00% | 69.45% | 67.46% | 38.05% | 43.12% |
| mAP @ 0.1 |
|---|
| 47.46% |
RetinaNet
| bar | dotline | legend-label | line | preview | title | xlabel | xticklabel | ylabel | yticklabel |
|---|---|---|---|---|---|---|---|---|---|
| 0.00% | 0.00% | 0.00% | 0.00% | 0.00% | 0.00% | 0.00% | 0.00% | 0.00% | 0.00% |
| mAP @ 1.0 |
|---|
| 0.00% |
| bar | dotline | legend-label | line | preview | title | xlabel | xticklabel | ylabel | yticklabel |
|---|---|---|---|---|---|---|---|---|---|
| 24.92% | 18.21% | 44.27% | 22.71% | 30.29% | 45.05% | 75.62% | 34.81% | 66.07% | 16.93% |
| mAP @ 0.75 |
|---|
| 37.89% |
| bar | dotline | legend-label | line | preview | title | xlabel | xticklabel | ylabel | yticklabel |
|---|---|---|---|---|---|---|---|---|---|
| 1.39% | 0.04% | 2.18% | 1.25% | 0.39% | 0.04% | 3.39% | 0.44% | 5.14% | 0.20% |
| mAP @ 0.9 |
|---|
| 1.45% |
| bar | dotline | legend-label | line | preview | title | xlabel | xticklabel | ylabel | yticklabel |
|---|---|---|---|---|---|---|---|---|---|
| 61.09% | 74.27% | 71.15% | 47.41% | 78.61% | 99.80% | 99.95% | 93.46% | 97.35% | 78.72% |
| mAP @ 0.5 |
|---|
| 80.18% |
| bar | dotline | legend-label | line | preview | title | xlabel | xticklabel | ylabel | yticklabel |
|---|---|---|---|---|---|---|---|---|---|
| 84.75% | 90.12% | 78.79% | 64.84% | 86.09% | 99.94% | 99.99% | 99.76% | 99.75% | 97.29% |
| mAP @ 0.1 |
|---|
| 90.13% |
SSD
| bar | dotline | legend-label | line | preview | title | xlabel | xticklabel | ylabel | yticklabel |
|---|---|---|---|---|---|---|---|---|---|
| 0.00% | 0.00% | 0.00% | 0.00% | 0.00% | 0.00% | 0.00% | 0.00% | 0.00% | 0.00% |
| mAP @ 1.0 |
|---|
| 0.00% |
| bar | dotline | legend-label | line | preview | title | xlabel | xticklabel | ylabel | yticklabel |
|---|---|---|---|---|---|---|---|---|---|
| 81.99% | 79.55% | 99.34% | 30.93% | 95.70% | 49.36% | 97.75% | 95.59% | 99.42% | 94.85% |
| mAP @ 0.75 |
|---|
| 82.45% |
| bar | dotline | legend-label | line | preview | title | xlabel | xticklabel | ylabel | yticklabel |
|---|---|---|---|---|---|---|---|---|---|
| 47.54% | 4.96% | 50.83% | 5.83% | 32.43% | 0.33% | 46.2% | 33.72% | 80.53% | 36.31% |
| mAP @ 0.9 |
|---|
| 33.86% |
| bar | dotline | legend-label | line | preview | title | xlabel | xticklabel | ylabel | yticklabel |
|---|---|---|---|---|---|---|---|---|---|
| 91.24% | 95.05% | 99.77% | 51.83% | 99.87% | 99.91% | 99.94% | 99.75% | 99.97% | 99.84% |
| mAP @ 0.5 |
|---|
| 93.72% |
| bar | dotline | legend-label | line | preview | title | xlabel | xticklabel | ylabel | yticklabel |
|---|---|---|---|---|---|---|---|---|---|
| 93.76% | 96.32% | 99.77% | 65.57% | 99.91% | 99.94% | 99.95% | 99.84% | 99.97% | 99.91% |
| mAP @ 0.1 |
|---|
| 95.50% |
MaskRCNN
| bar | dotline | legend-label | line | preview | title | xlabel | xticklabel | ylabel | yticklabel |
|---|---|---|---|---|---|---|---|---|---|
| 0.00% | 0.00% | 0.00% | 0.00% | 0.00% | 0.00% | 0.00% | 0.00% | 0.00% | 0.00% |
| mAP @ 1.0 |
|---|
| 0.00% |
| bar | dotline | legend-label | line | preview | title | xlabel | xticklabel | ylabel | yticklabel |
|---|---|---|---|---|---|---|---|---|---|
| 76.92% | 71.67% | 92.13% | 50.17% | 94.44% | 17.10% | 90.59% | 84.17% | 80.90% | 62.68% |
| mAP @ 0.75 |
|---|
| 72.08% |
| bar | dotline | legend-label | line | preview | title | xlabel | xticklabel | ylabel | yticklabel |
|---|---|---|---|---|---|---|---|---|---|
| 15.51% | 10.90% | 7.15% | 6.54% | 11.70% | 0.02% | 4.39% | 8.08% | 9.59% | 1.70% |
| mAP @ 0.9 |
|---|
| 7.56% |
| bar | dotline | legend-label | line | preview | title | xlabel | xticklabel | ylabel | yticklabel |
|---|---|---|---|---|---|---|---|---|---|
| 87.95% | 94.13% | 99.95% | 66.25% | 99.94% | 99.58% | 99.99% | 99.89% | 99.77% | 99.64% |
| mAP @ 0.5 |
|---|
| 94.71% |
| bar | dotline | legend-label | line | preview | title | xlabel | xticklabel | ylabel | yticklabel |
|---|---|---|---|---|---|---|---|---|---|
| 93.04% | 94.39% | 99.96% | 69.57% | 99.97% | 96.61% | 99.99% | 99.94% | 99.80% | 99.99% |
| mAP @ 0.1 |
|---|
| 95.63% |
YoloV3
| bar | dotline | legend-label | line | preview | title | xlabel | xticklabel | ylabel | yticklabel |
|---|---|---|---|---|---|---|---|---|---|
| 0.00% | 0.92% | 0.00% | 0.00% | 0.40% | 0.00% | 0.00% | 0.00% | 0.00% | 0.00% |
| mAP @ 1.0 |
|---|
| 0.10% |
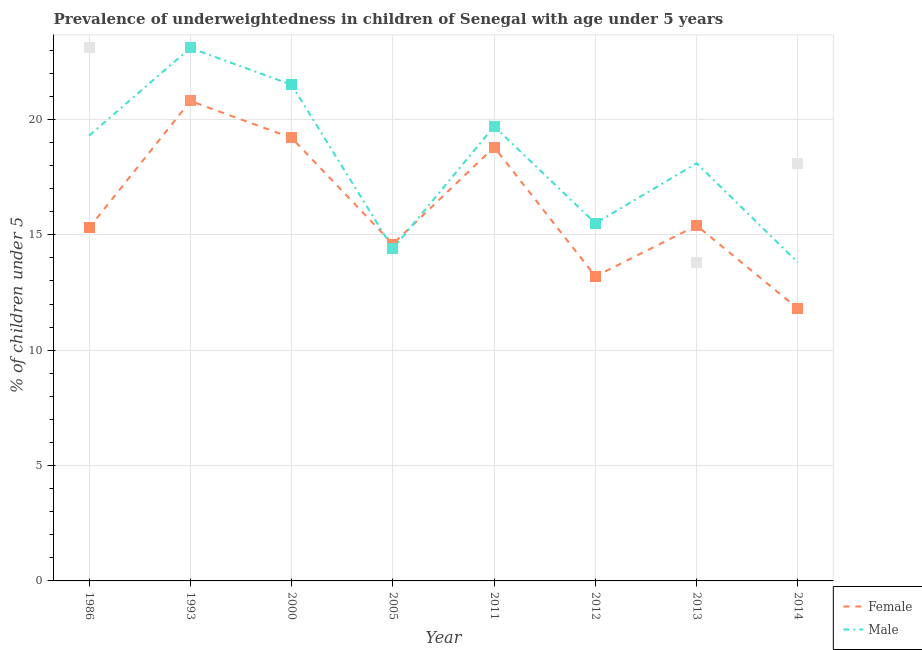
Demystifying mAP
if IOU(pred, gt) >= threshold:
if pred-label == gt-label:
TP += 1
elif pred-label != gt-label:
FN += 1
else:
FP += 1
TP, FP, FN
- True Positive (TP): A correct detection. Detection with IOU ≥ threshold
- False Positive (FP): A wrong detection. Detection with IOU < threshold
- False Negative (FN): A ground truth not detected
- True Negative (TN): Does not apply. It would represent a corrected misdetection. In the object detection task there are many possible bounding boxes that should not be detected within an image. Thus, TN would be all possible bounding boxes that were corrrectly not detected (so many possible boxes within an image). That's why it is not used by the metrics.
Source: https://blog.objectivity.co.uk/comparing-object-detection-models/
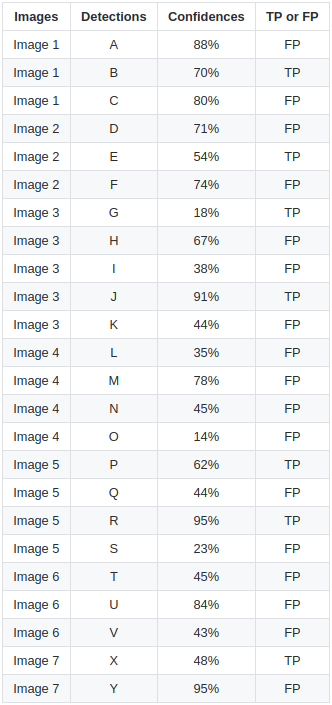
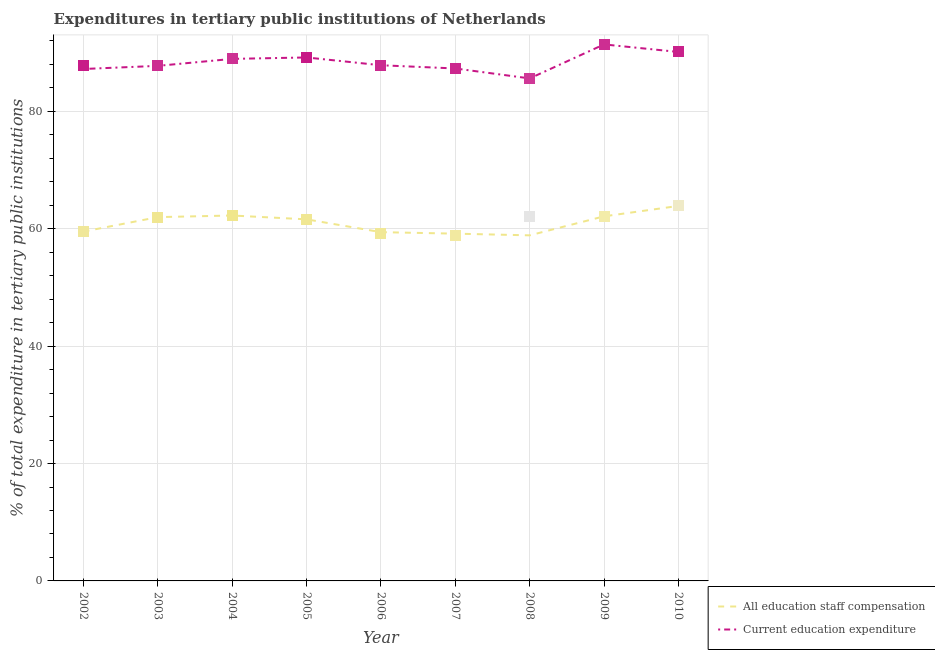
Demystifying mAP
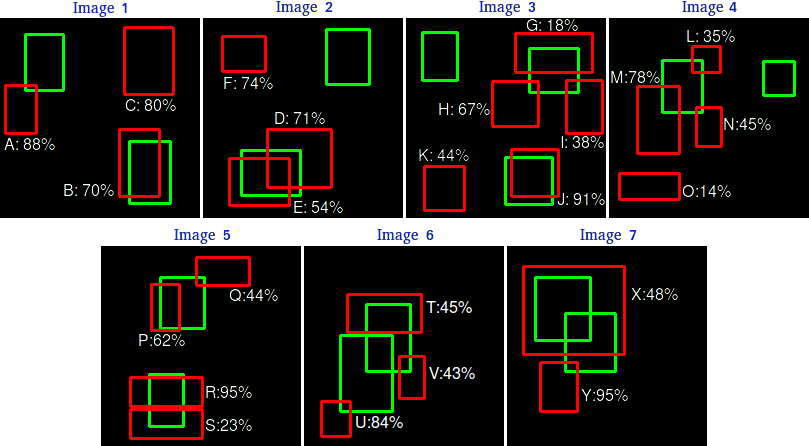
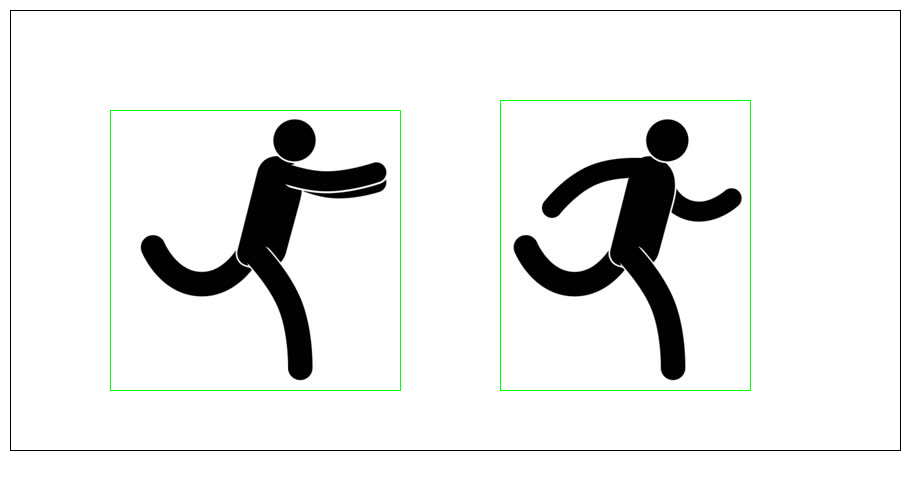
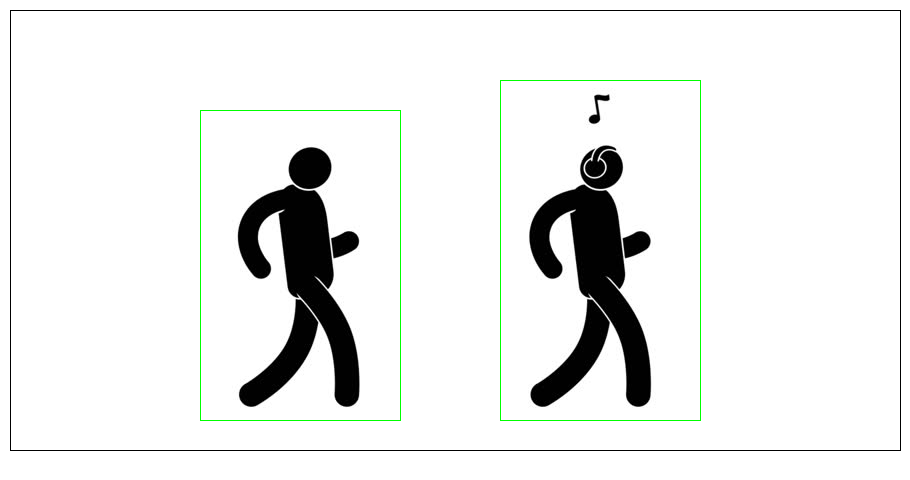
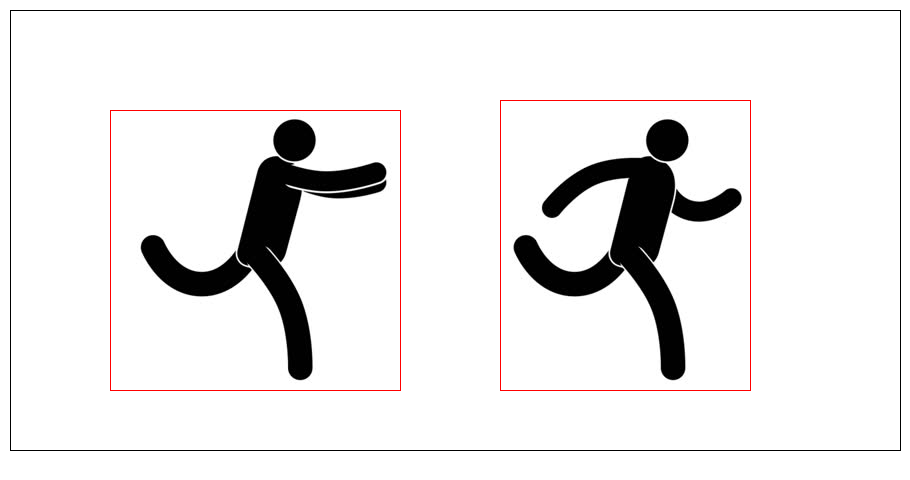
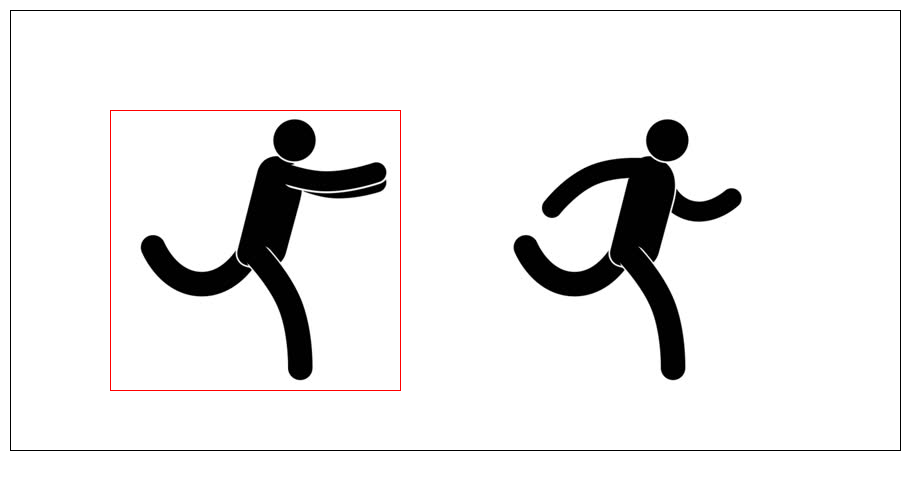
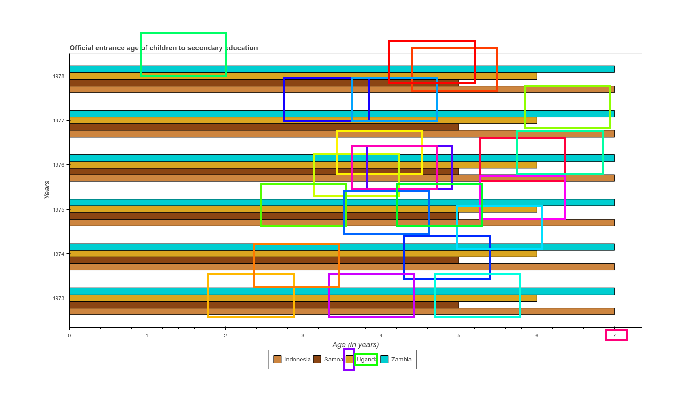
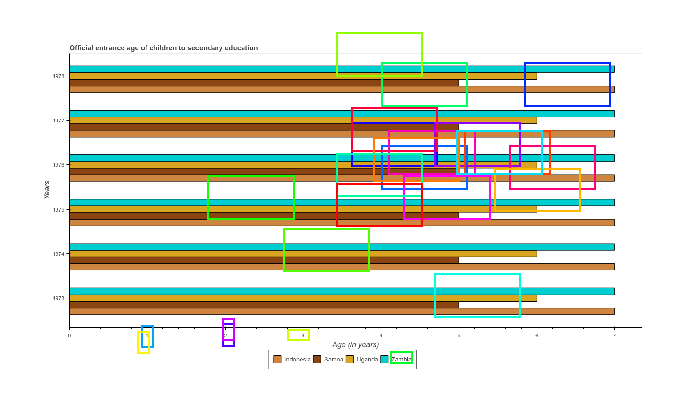
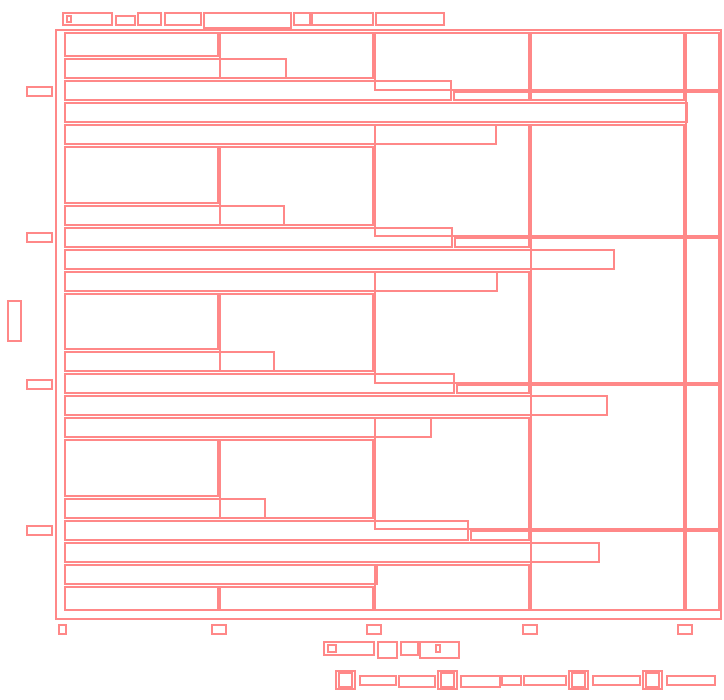
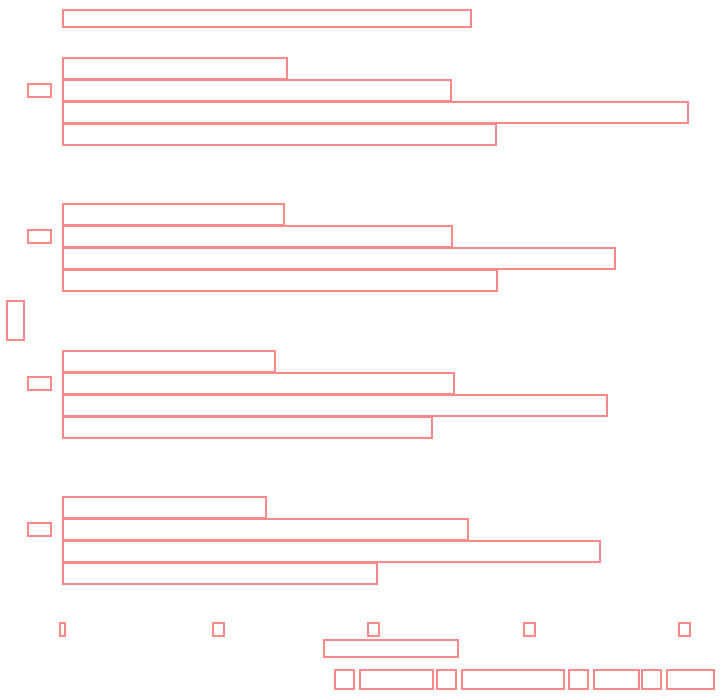
There are 7 images with 15 ground-truth objects represented by the green bounding boxes and 24 detected objects represented by the red bounding boxes. Each detected object has a confidence level and is identified by a letter (A, B,..., Y).
There are 7 images with 15 ground-truth objects represented by the green bounding boxes and 24 detected objects represented by the red bounding boxes. Each detected object has a confidence level and is identified by a letter (A, B,..., Y).
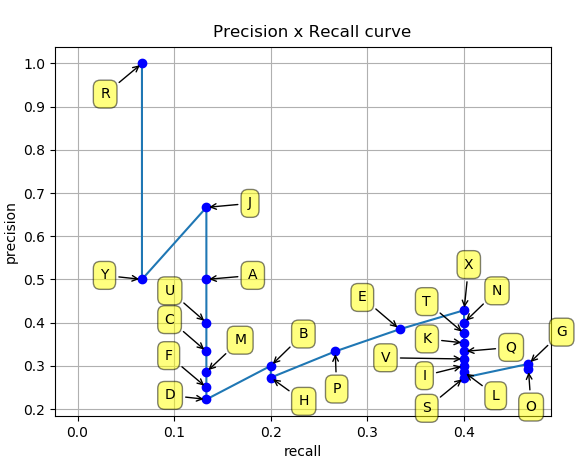
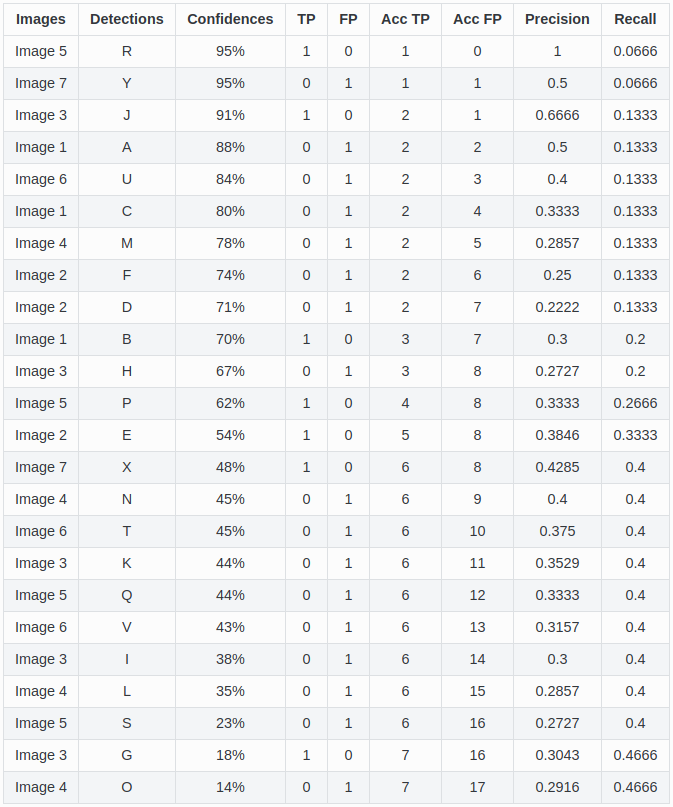
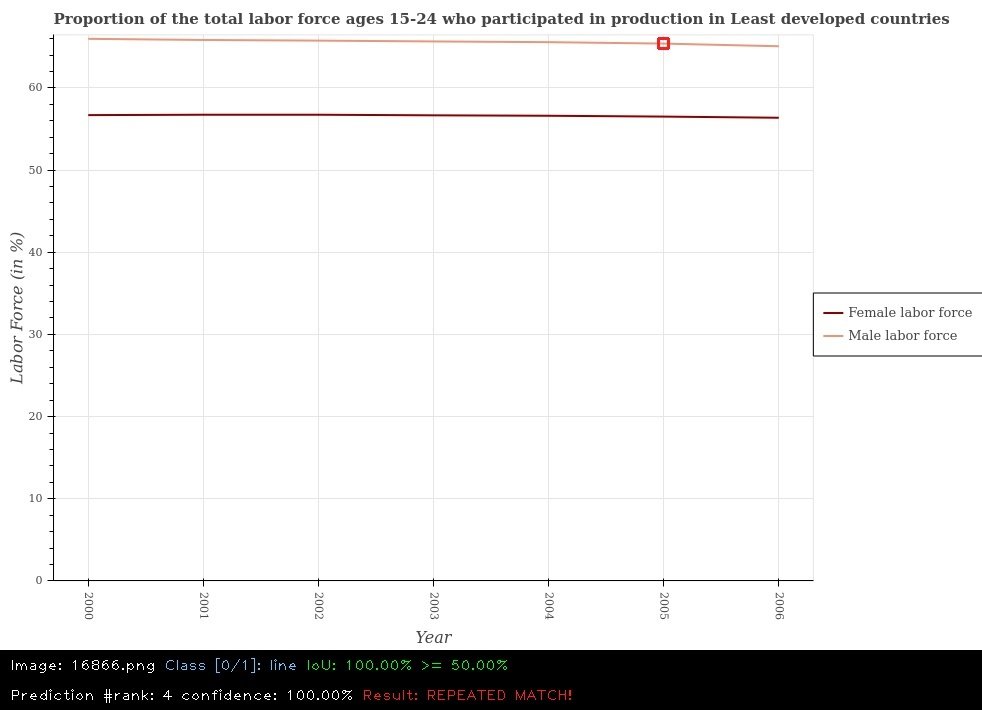
Precision-Recall Curve
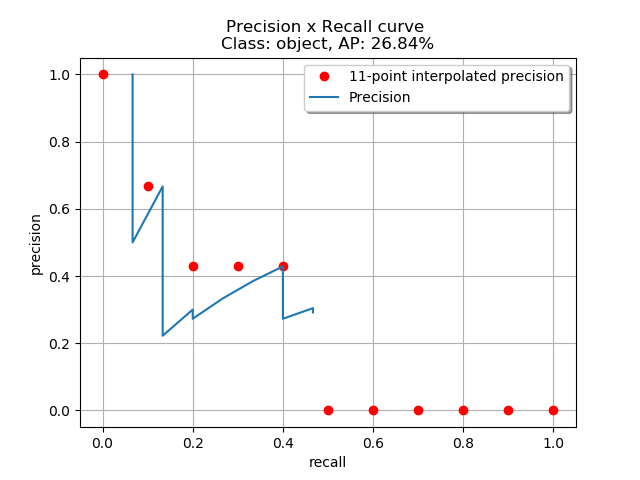
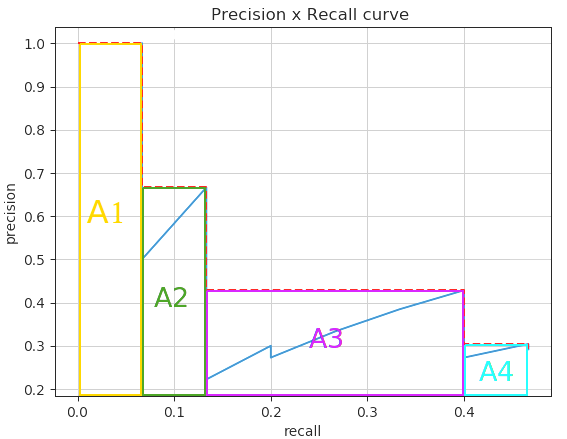
11-point interpolation
11-point interpolation
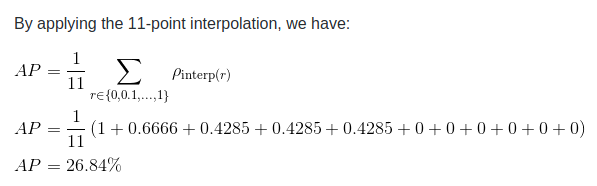
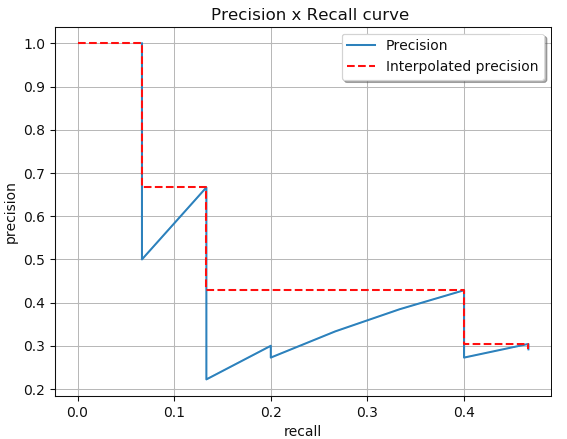
Interpolated Precision
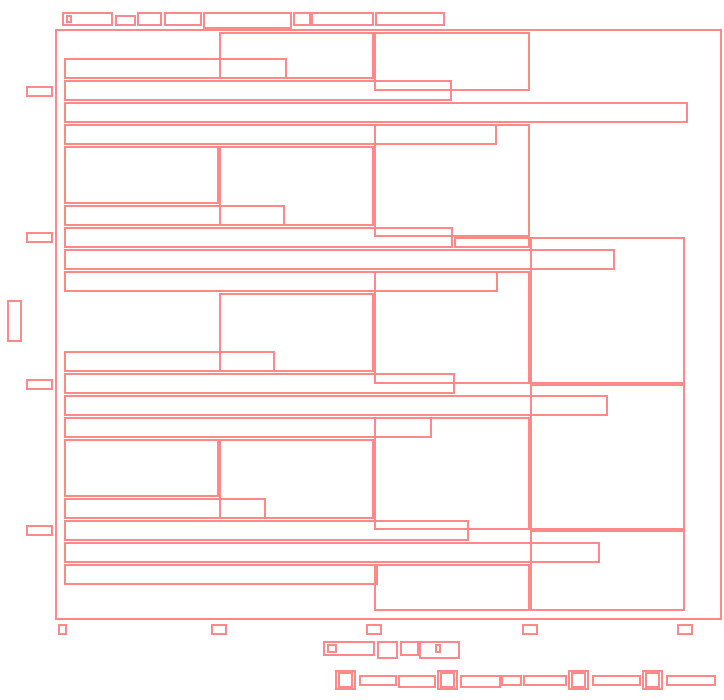
| Class | Precision | Recall |
|---|---|---|
| bar | 0.8 | 0.89 |
| title | 0.04 | 0.05 |
| xlabel | 0.98 | 0.99 |
| ylabel | 0.99 | 1.0 |
| xticklabel | 0.97 | 0.97 |
| yticklabel | 0.98 | 0.98 |
| legend-label | 0.95 | 0.97 |
| preview | 0.97 | 0.97 |
| dot-line | 0.42 | 0.41 |
| line | 0.26 | 0.49 |
FrRCNN_FPN_RA
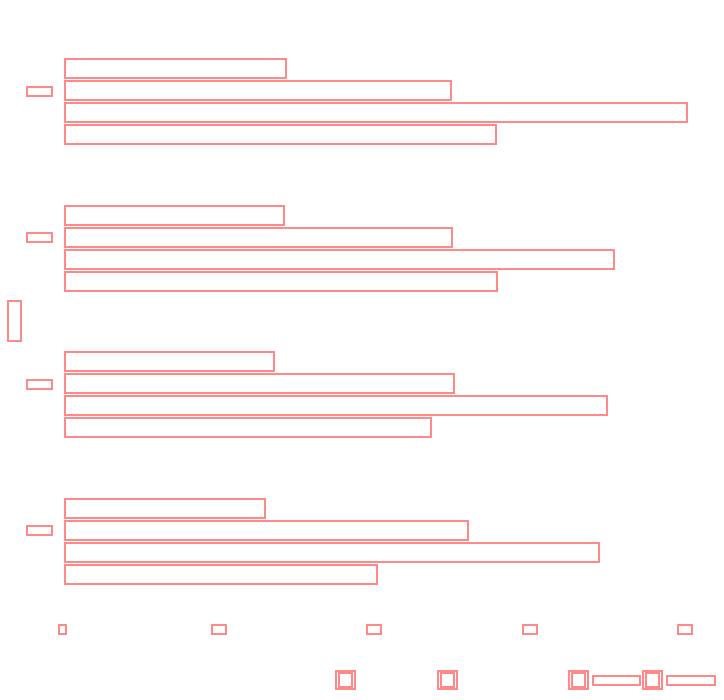
| Class | Precision | Recall |
|---|---|---|
| bar | 0.94 | 0.91 |
| title | 0.56 | 0.63 |
| xlabel | 0.82 | 0.88 |
| ylabel | 0.65 | 0.68 |
| xticklabel | 0.42 | 0.42 |
| yticklabel | 0.36 | 0.23 |
| legend-label | 0.87 | 0.84 |
| preview | 0.82 | 0.79 |
| dot-line | 0.38 | 0.24 |
| line | 0.35 | 0.26 |
PlotQA_R22_FPN
IOU@0.9
gt = [26.0, 551.0, 52.44, 564]
pred = [27.03, 550.9, 51.4, 564.8]
IOU = 87.26%
gt = [62, 542.16, 1043, 574]
pred = [54.44, 542.16, 1064.44, 574.13]
IOU = 96.74%

yticklabel:
bar:
IOU@0.9
Sensitivity of IOU
Our Proposed Model Output


Original Image
CV Proposals
Regression Targets
Model Output
After Postprocessing
Errors made by our model

Pre-processing
Ground-truth class and target offsets for RoIs
.
Finding neighbours and assigning links between them
Pre-processing
Observations
- 2-stage detectors work better than 1-stage detectors.
- The existing proposal methods cause many unnecessary computations.
- The anchors are independent of the image.
- The way in which the target classes are assigned to the anchors can confuse the network.
- The regression targets (offsets) of the anchors are huge.
- In NMS, discard the proposals based on both localization and classification score rather than the classification score alone.
- IOU is not a good metric.
- mAP seems to be a misleading metric.
Observations 8
Observations

Model 1
Model 2
| # Proposals | # Foreground | # Background | # Neutral | |
|---|---|---|---|---|
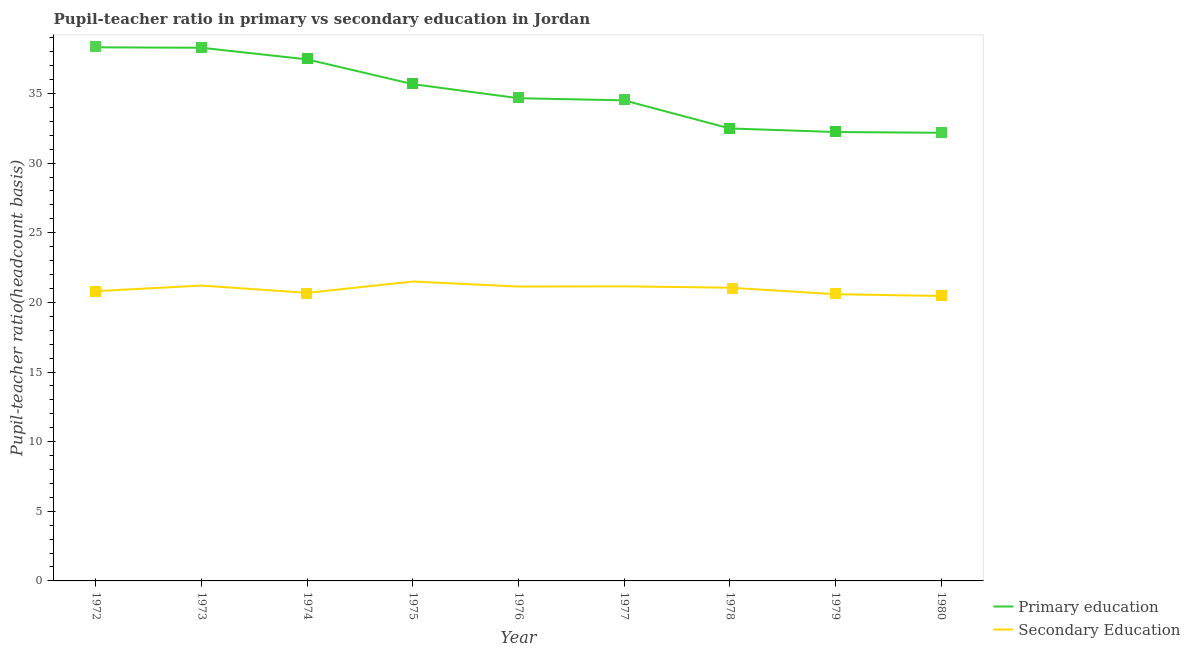
| FrRCNN_FPN_RA | 225120 | 1838 | 222315 | 967 |
| RetinaNet (FL) | 225120 | 1914 | 224867 | 1661 |
For RetinaNet, class ids are directly assigned to the proposals
Observations 1 to 4
Observations
Foreground Proposals for FrRCNN_FPN_RA
Foreground Proposals for RetinaNet_FL
Background Proposals for RetinaNet_FL
Background Proposals for FrRCNN_FPN_RA
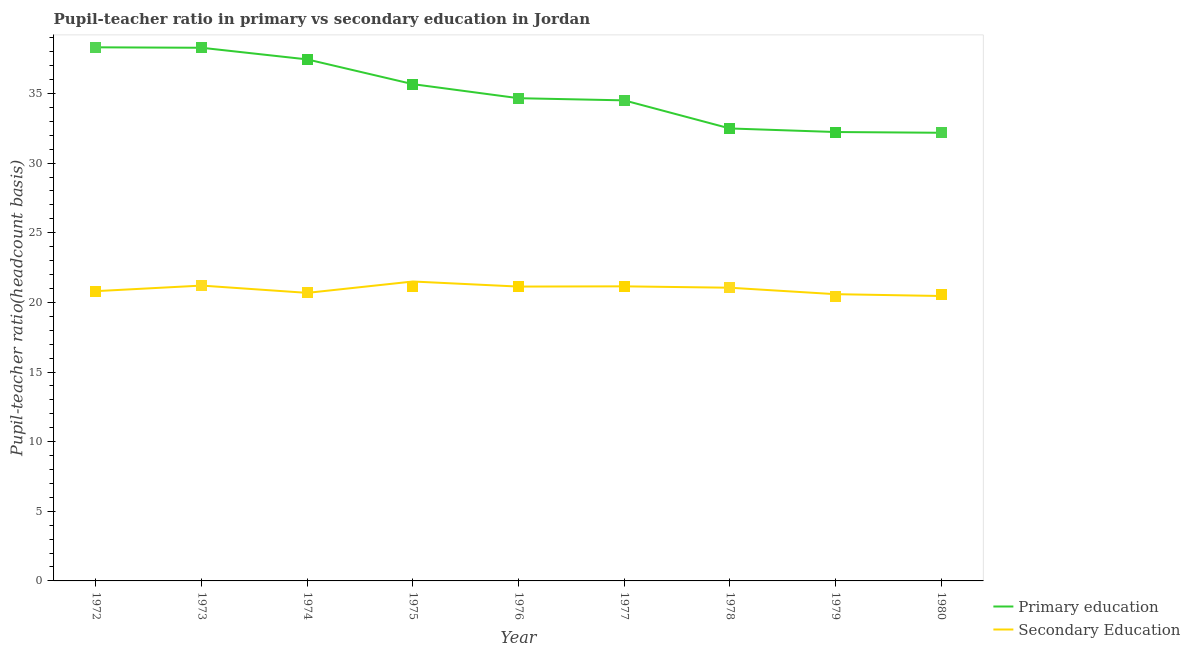
Observation 5: The regression targets (offsets) of the anchors is significantly large
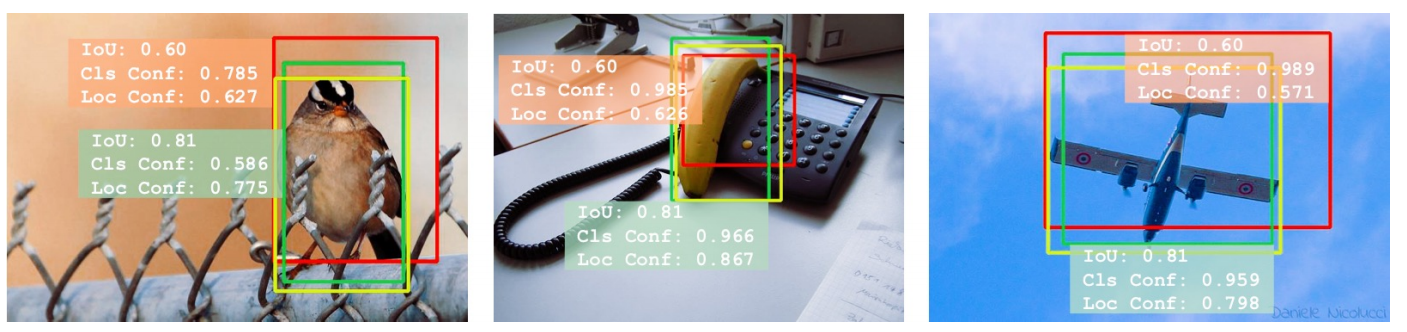
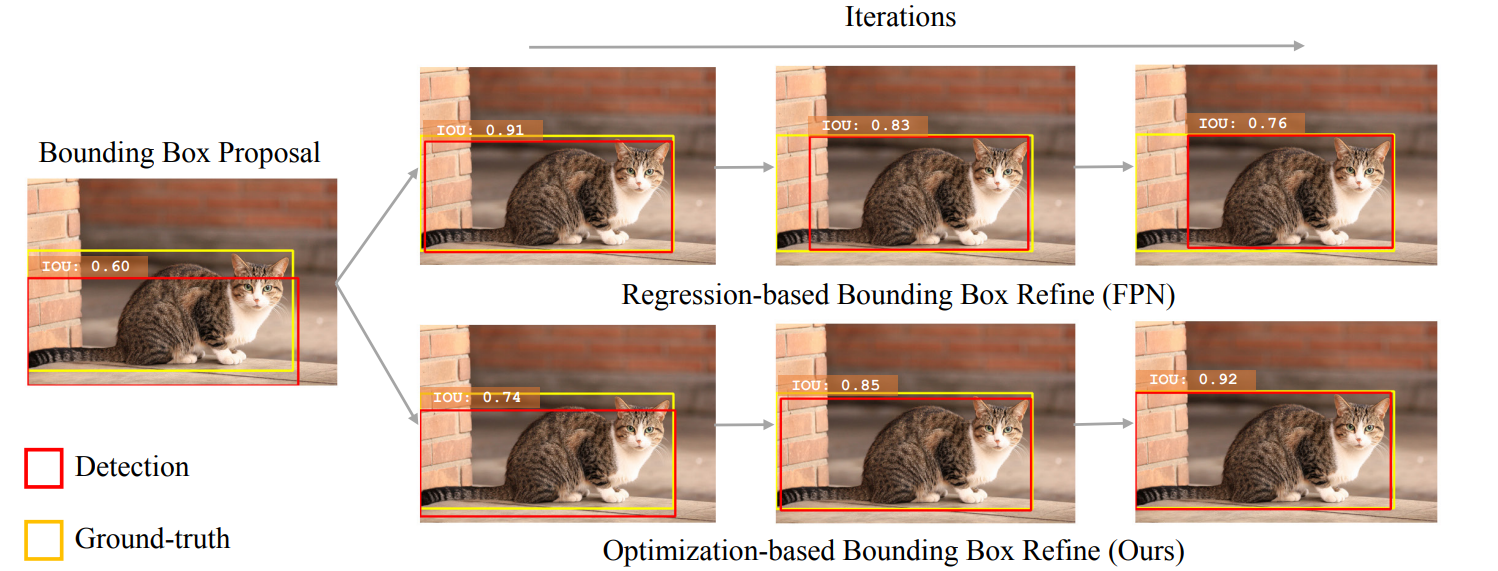
Misalignment between classification confidence and localization accuracy
Non-monotonic localization in iterative bounding box regression
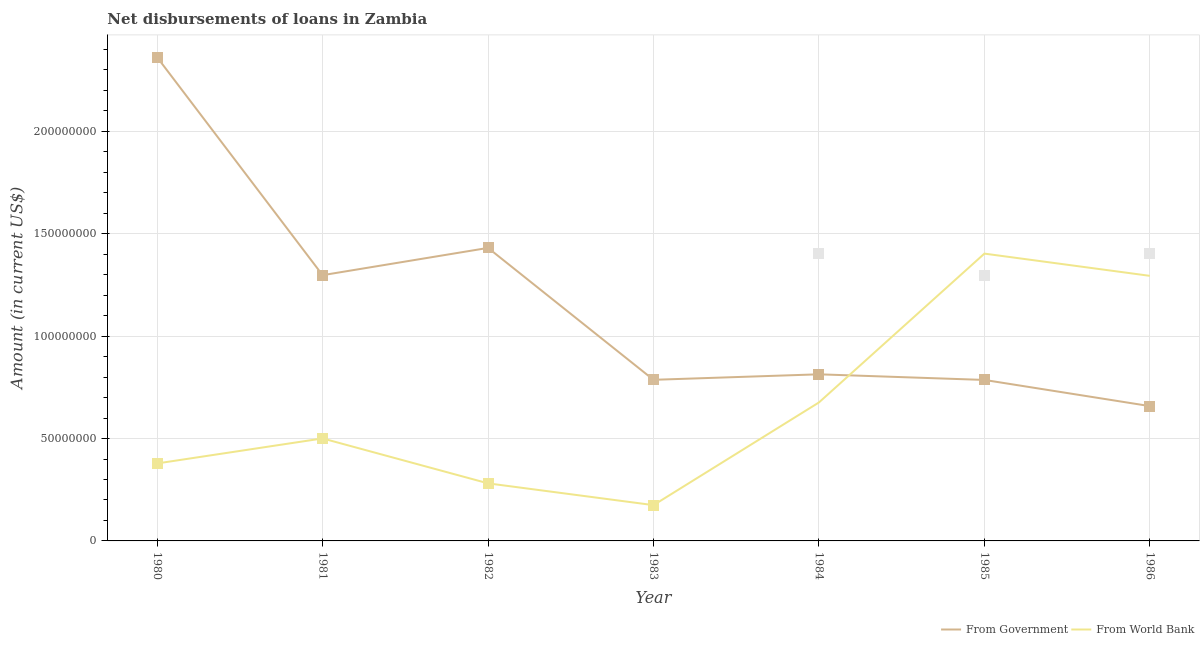
Observations 6: In NMS, discard the proposals based on both localization and classification score rather than classification score only
Non-monotonic localization in iterative bounding box regression
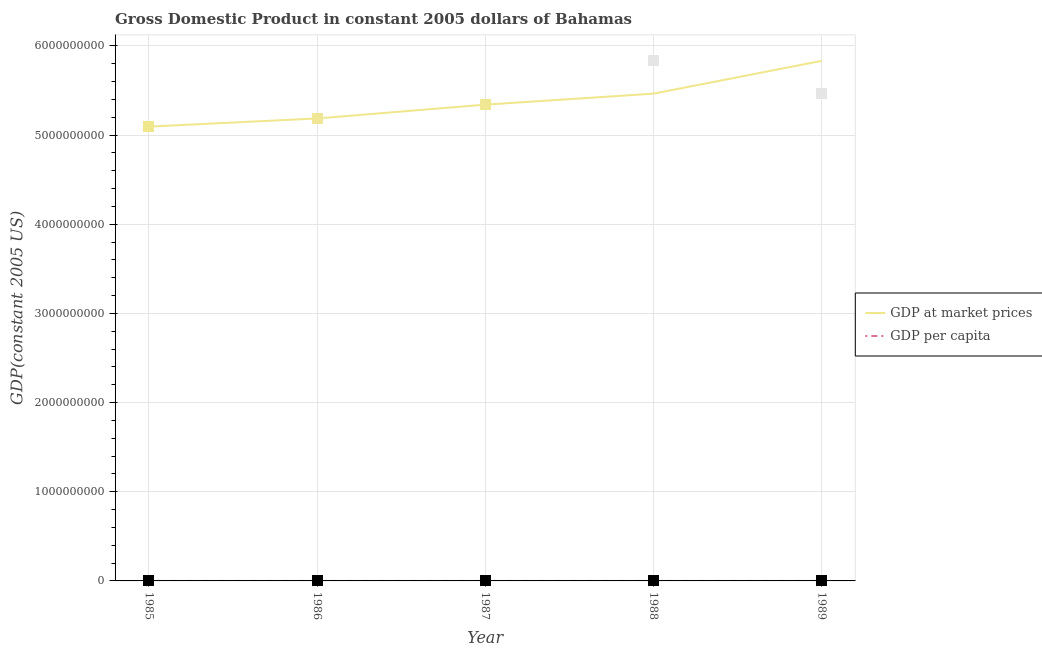
IOU=0.1
IOU=0.5
IOU=0.75
IOU=0.9
| bar | dotline | legend-label | line | preview | title | xlabel | xticklabel | ylabel | yticklabel |
|---|---|---|---|---|---|---|---|---|---|
| 96.35% | 96.51% | 99.99% | 82.72% | 99.95% | 100.00% | 100.00% | 99.94% | 99.90% | 99.99% |
| mAP @ 0.1 |
|---|
| 97.53% |
FrRCNN_FPN_RA
| bar | dotline | legend-label | line | preview | title | xlabel | xticklabel | ylabel | yticklabel |
|---|---|---|---|---|---|---|---|---|---|
| 95.84% | 96.30% | 99.99% | 72.25% | 99.95% | 100.00% | 99.99% | 99.92% | 99.90% | 99.99% |
| mAP @ 0.5 |
|---|
| 96.43% |
| bar | dotline | legend-label | line | preview | title | xlabel | xticklabel | ylabel | yticklabel |
|---|---|---|---|---|---|---|---|---|---|
| 94.30% | 95.14% | 99.96% | 62.04% | 99.94% | 78.83% | 99.99% | 99.74% | 99.90% | 99.97% |
| mAP @ 0.75 |
|---|
| 92.98% |
| bar | dotline | legend-label | line | preview | title | xlabel | xticklabel | ylabel | yticklabel |
|---|---|---|---|---|---|---|---|---|---|
| 85.54% | 18.07% | 93.68% | 37.65% | 96.30% | 0.22% | 99.09% | 96.04% | 99.46% | 96.80% |
| mAP @ 0.9 |
|---|
| 72.29% |

IOU=0.1
IOU=0.5
IOU=0.75
IOU=0.9
YoloV3
| bar | dotline | legend-label | line | preview | title | xlabel | xticklabel | ylabel | yticklabel |
|---|---|---|---|---|---|---|---|---|---|
| 76.92% | 71.67% | 92.13% | 50.17% | 94.44% | 17.10% | 90.59% | 84.17% | 80.90% | 62.68% |
| mAP @ 0.75 |
|---|
| 72.08% |
| bar | dotline | legend-label | line | preview | title | xlabel | xticklabel | ylabel | yticklabel |
|---|---|---|---|---|---|---|---|---|---|
| 15.51% | 10.90% | 7.15% | 6.54% | 11.70% | 0.02% | 4.39% | 8.08% | 9.59% | 1.70% |
| mAP @ 0.9 |
|---|
| 7.56% |
| bar | dotline | legend-label | line | preview | title | xlabel | xticklabel | ylabel | yticklabel |
|---|---|---|---|---|---|---|---|---|---|
| 87.95% | 94.13% | 99.95% | 66.25% | 99.94% | 99.58% | 99.99% | 99.89% | 99.77% | 99.64% |
| mAP @ 0.5 |
|---|
| 94.71% |
| bar | dotline | legend-label | line | preview | title | xlabel | xticklabel | ylabel | yticklabel |
|---|---|---|---|---|---|---|---|---|---|
| 93.04% | 94.39% | 99.96% | 69.57% | 99.97% | 96.61% | 99.99% | 99.94% | 99.80% | 99.99% |
| mAP @ 0.1 |
|---|
| 95.63% |

IOU=0.1
IOU=0.5
IOU=0.75
IOU=0.9
MaskRCNN
| bar | dotline | legend-label | line | preview | title | xlabel | xticklabel | ylabel | yticklabel |
|---|---|---|---|---|---|---|---|---|---|
| 81.99% | 79.55% | 99.34% | 30.93% | 95.70% | 49.36% | 97.75% | 95.59% | 99.42% | 94.85% |
| mAP @ 0.75 |
|---|
| 82.45% |
| bar | dotline | legend-label | line | preview | title | xlabel | xticklabel | ylabel | yticklabel |
|---|---|---|---|---|---|---|---|---|---|
| 47.54% | 4.96% | 50.83% | 5.83% | 32.43% | 0.33% | 46.2% | 33.72% | 80.53% | 36.31% |
| mAP @ 0.9 |
|---|
| 33.86% |
| bar | dotline | legend-label | line | preview | title | xlabel | xticklabel | ylabel | yticklabel |
|---|---|---|---|---|---|---|---|---|---|
| 91.24% | 95.05% | 99.77% | 51.83% | 99.87% | 99.91% | 99.94% | 99.75% | 99.97% | 99.84% |
| mAP @ 0.5 |
|---|
| 93.72% |
| bar | dotline | legend-label | line | preview | title | xlabel | xticklabel | ylabel | yticklabel |
|---|---|---|---|---|---|---|---|---|---|
| 93.76% | 96.32% | 99.77% | 65.57% | 99.91% | 99.94% | 99.95% | 99.84% | 99.97% | 99.91% |
| mAP @ 0.1 |
|---|
| 95.50% |
Pre-processing
Adding CV-mask as 4th channel in the input image
Pre-processing
Adding CV-mask as 4th channel in the input image
Pre-processing
Adding CV-mask as 4th channel in the input image

Converting Line to Dotline using CV methods


Input Image
Detect xtickmarks
Harris Corner Detector
Markers
Gt-image
Pre-processing
Converting Line to Dotline using CV methods

Corner Detection Errors
Input Image
Detect xtickmarks
Harris Corner Detector
Markers
Gt-image
Converting Line to Dotline using CV methods
Ground-truth errors
Converting Line to Dotline using CV methods
mAP Error Analysis

CV Proposals (raw)
CV Proposals (refined)
(non-zero IoU with parent)
Region Proposal Analysis (CV based proposals)
CV Proposals
(IoU > 5% with parent)


(B) The y-value of the visual element could be wrong due to the following reasons:
(a) pixel to value mapping is wrong i.e., the scale is wrong:
- the ticks using which scale is calculated are wrong due to incorrect OCR module
- the ticks using which scale is calculated are not the consecutive ticks (VED error)
(b) the height of the data element is wrong (VED error)
(A) The x-value of the visual element could be wrong due to the following reasons:
(C) The z-value of the visual element could be wrong due to the following reasons:
(a) the label associated with the bar is wrong because:
- the colour of the bar is not associated with the right preview
- mapping of preview and legend-label is not correct (VED error)
- OCR error in a legend-label text
(a) the tick-label associated with the bar is wrong (VED error)
(b) the OCR error in tick-label
TODO
- Word Level OCR accuracy
- Generate tables using detections at different IOUs
Optical Character Recognition (OCR)
| Character Level Accuracy | Word Level Accuracy | Sentence Level Accuracy |
|---|---|---|
| 99.49% | 98.45% | 98.29% |
| 99.59% | 98.39% | 96.91% |
| 99.80% | 99.21% | 99.15% |
| 99.82% | 99.29% | 99.23% |
| 94.31% | 82.87% | 54.90% |
| 99.94% | 99.77% | 99.70% |
| 98.82% | 96.33% | 91.36% |
| 97.95% | 94.60% | 96.58% |
Tesseract
Attention-OCR
Oracle Bounding Boxes
| Textual Elements | Character Level Accuracy | Word Level Accuracy | Sentence Level Accuracy |
|---|---|---|---|
| xlabel | 99.94% | 88.73% | 78.64% |
| ylabel | 98.43% | 87.17% | 79.58% |
| yticklabel | 93.38% | 86.92% | 86.24% |
| xticklabel | 94.8% | 91.32% | 90.95% |
| title | 99.31% | 97.92% | 82.58% |
| legend-label | 98.53% | 95.29% | 93.2% |
| Overall (avg.) | 97.39% | 91.22% | 85.20% |
| (weighted avg.) |
Optical Character Recognition (OCR)
| Character Level Accuracy | Word Level Accuracy | Sentence Level Accuracy |
|---|---|---|
| 94.61% | 82.02% | 81.44% |
| 95.85% | 83.27% | 76.60% |
| 85.20% | 62.90% | 61.0% |
| 87.79% | 62.33% | 60.08% |
| 83.55% | 48.23% | 10.0% |
| 97.88% | 92.33% | 90.42% |
| 90.81% | 71.84% | 63.25% |
| 88.85% | 65.97% | 64.02% |
Tesseract
Attention-OCR
Bounding Boxes after VED MaskRCNN)
| Textual Elements | Character Level Accuracy | Word Level Accuracy | Sentence Level Accuracy |
|---|---|---|---|
| xlabel | 95.5% | 81.29% | 67.72% |
| ylabel | 97.07% | 82.8% | 67.74% |
| yticklabel | 88.07% | 78.08% | 77.13% |
| xticklabel | 91.38% | 83.81% | 83.7% |
| title | 94.6% | 85.24% | 34.13% |
| legend-label | 91.99% | 78.26% | 79.71% |
| Overall (avg.) | 93.10% | 81.58% | 68.35% |
| (weighted avg.) |
SEMPRE
- ADDITION: 66.77%
- DIFFERENCE: 9.5%
- MAX: 73.8%
- MIN: 80.3%
- RATIO: 0.68%
- AVG: 67.33%
- MEDIAN: 6.6%
- COUNT: 41.85%
- YES/NO: 0.00%
- LOOKUP: 95.10%
Operation wise accuracy of SEMPRE
GT-GT-GT-SEMPRE
(32.55%)
VOES analysis
| VED | OCR | SIE | TQA |
|---|---|---|---|
| 100% | 100% | 100% | 32.55% |
| 100% | 100% | 52.20% | 26.24% |
| 100% | 100% | 79.38% | 29.24% |
| 100% | 97.06% | 23.78% | |
| 94.21% | 93.10% | 20.22% |
(SEMPRE)
(SIE)
(Tesseract OCR)
(VED)
SEMPRE on only OOV answer types gives 21.41%
bar: 82.81%
dot-line: 80.38%
line: 65.54%
(SIE after modifying rules)
Some interesting failure cases
SIE stage
TEST/2175.png
WACV 2020
By Nitesh Methani


