AutomOtive Heads Up Displays


Nomaan Ahgharian
Nitya Reddy
James Melter
Rehab Tambe
Shanglei Zhang
Methodology Presentation
Scenario


Research Question
-
Do users prefer icons or text for glanceable information?
- monochromic or color-coded icons


OR

PRIOR Research
Locations of icons or area of view
METHODOLOGY
PHASE 1
PHASE 2
PHASE 3
EXPERIMENTAL PROCEDURE
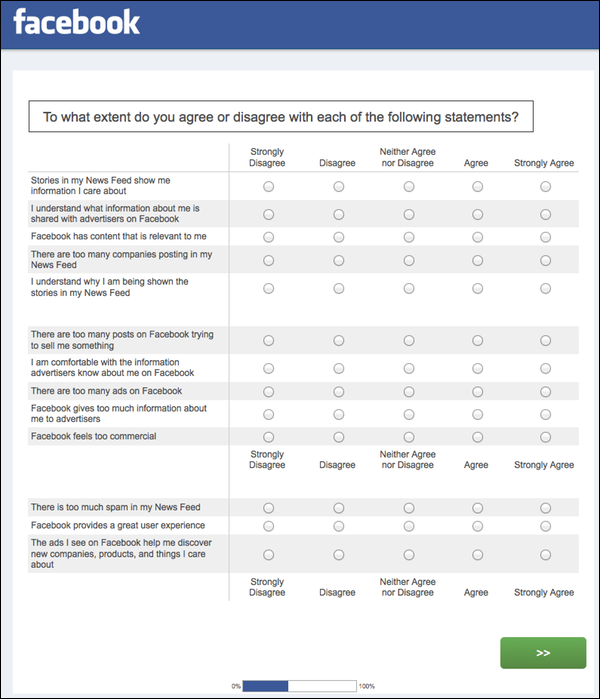
PRE-TASK QUESTIONNAIRE
USER EVALUATION
POST-TASK interview
Test HUD prototypes
Video & images
HUD in a car
Post-Task Questionnaire.
Advanced Visualization Lab (AVL)

Info on HUD
Info Expression Methods

Testing
Script
Scenario
Task

Semi-open Interviews

PARTICIPANTS
PRE-TASK QUESTIONNAIRE
USER EVALUATION
POST-TASK interview
PHASE 1
PHASE 2
PHASE 3

6~10 Participants
Recruit from


20~30 Participants


6~10 Participants
Interview will be conducted after testing. Or by email .
tasks
PHASE 1
PHASE 2
PHASE 3
PRE-TASK QUESTIONNAIRE
USER EVALUATION
POST-TASK interview
what-to-do:
USER WILL EXPERIENCE VARIOUS HUD ICONS IN
ADVANCED VISUALIZATION LAB
DATA
PRE-TASK QUESTIONNAIRE
QUALITATIVE DATA
VIDEO/AUDIO RECORDING
QUALITATIVE DATA
USER EVALUATION
POST-TASK interview
interview transcripts
QUALITATIVE DATA
DEMOGRAPHic
likert SCALES
observation notes
PHASE 1
PHASE 2
PHASE 3
ANALYSIS
demographic
likert scale
PHASE 1
PHASE 2
PHASE 3
F 58%
M 42%
Like 58%
Neutral 23%
dislike 42%
observation
audio record
Q1
Q2
INTERVIEW
Q3
Text.
B/W.
Color.
Icon preference.
HUD Overview.
Timeline
March
March
03
09
17
24
31
Icons for Navigation
Intermediate Paper Draft
Methodology Presentation
Icons for
Vital Stats
Complete
the Video
April
April
Start User Testing
07
Analyse Results
14
Final Presentation
21
Final Paper Submission
29
Questions?
HUD
By Nomaan Ahgharian


