STATION-BASED OBSERVATIONS AND FLOOD RISK MODELLING OVER ITALY
ADRIANO FANTINI
PhD student at the University of Trieste and ICTP, Trieste, Italy
afantini@ictp.it

Aims
- Flood risk mapping over Italy
- scientific, reliable approach
- future projections
Models
- ICTP RegCM and other Regional Climate Models
- CHyM hydrological model
- LISFLOOD-FP hydraulic model
Project overview
Participants
- Erika Coppola
- Rita Nogherotto
- Filippo Giorgi
- Adriano Fantini
- Francesca Raffaele
Methodology
Precipitation:
- Observations
- RCM output
Gridded netCDF:
- River network
- Discharges
hydrological model

For each RP, cell:
- Gumbel distr
- Hydrographs
Statistical RP analysis

LISFLOOD-FP model
For each RP, cell:
- Flood extent
- Flood depth
(multiple simulations)
- RCM output
- Discharges
- Past floods
Validation for

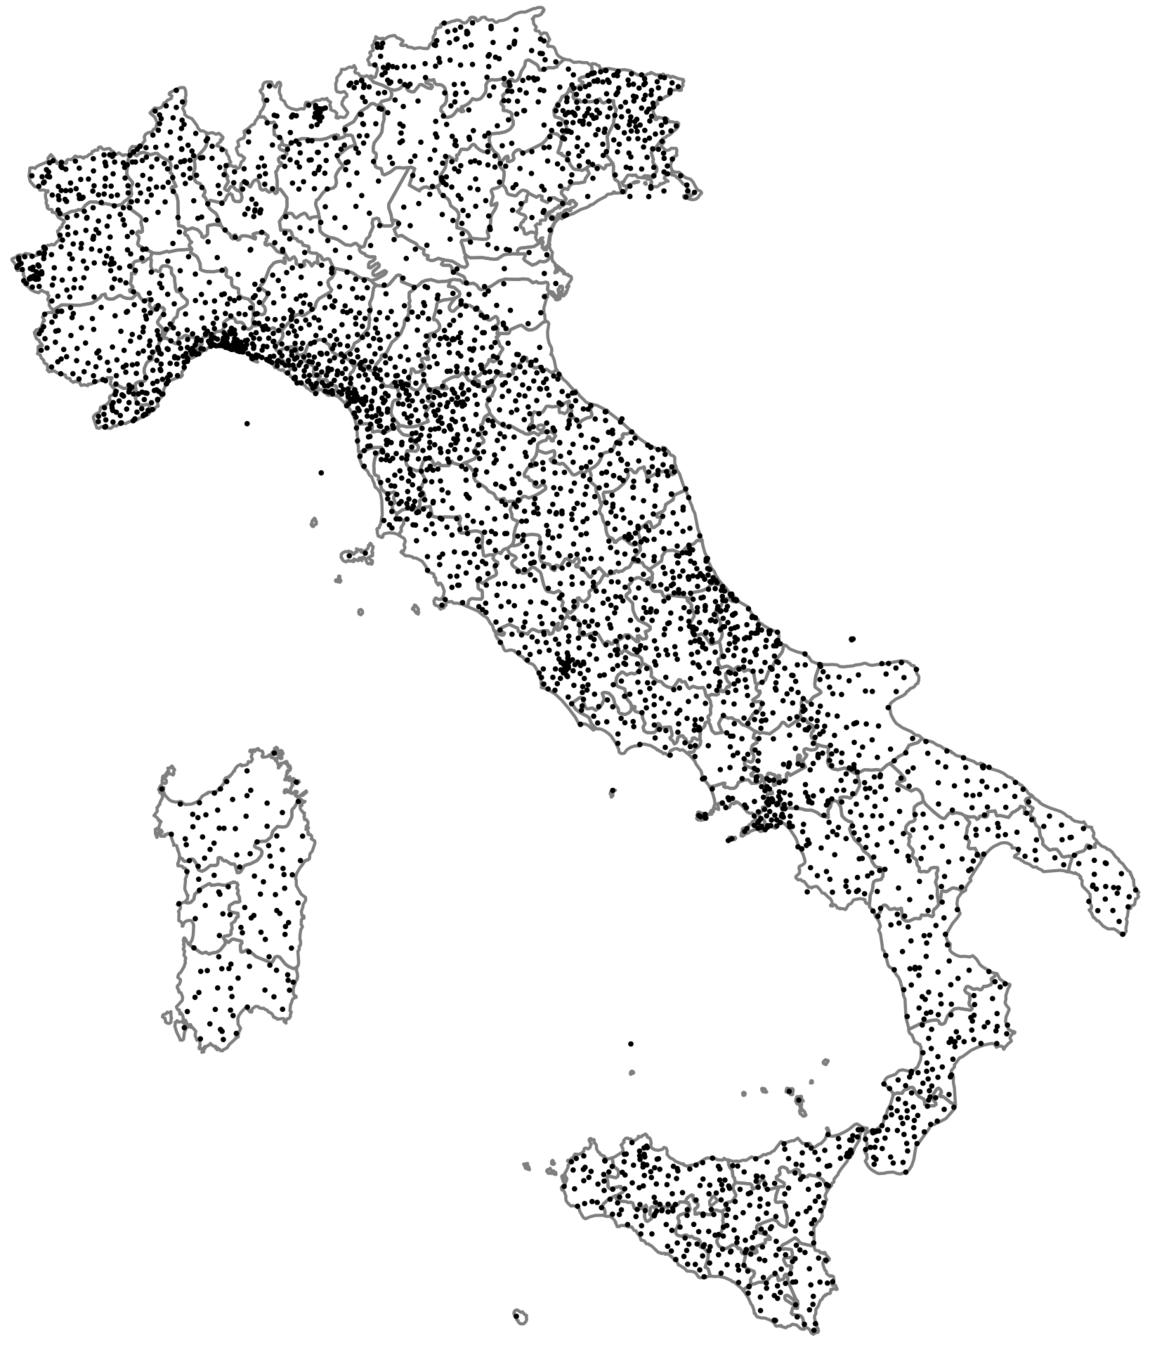
Precipitation observations (from CETEMPS dataset)
- Region: Italy
- Total of ~3700 stations
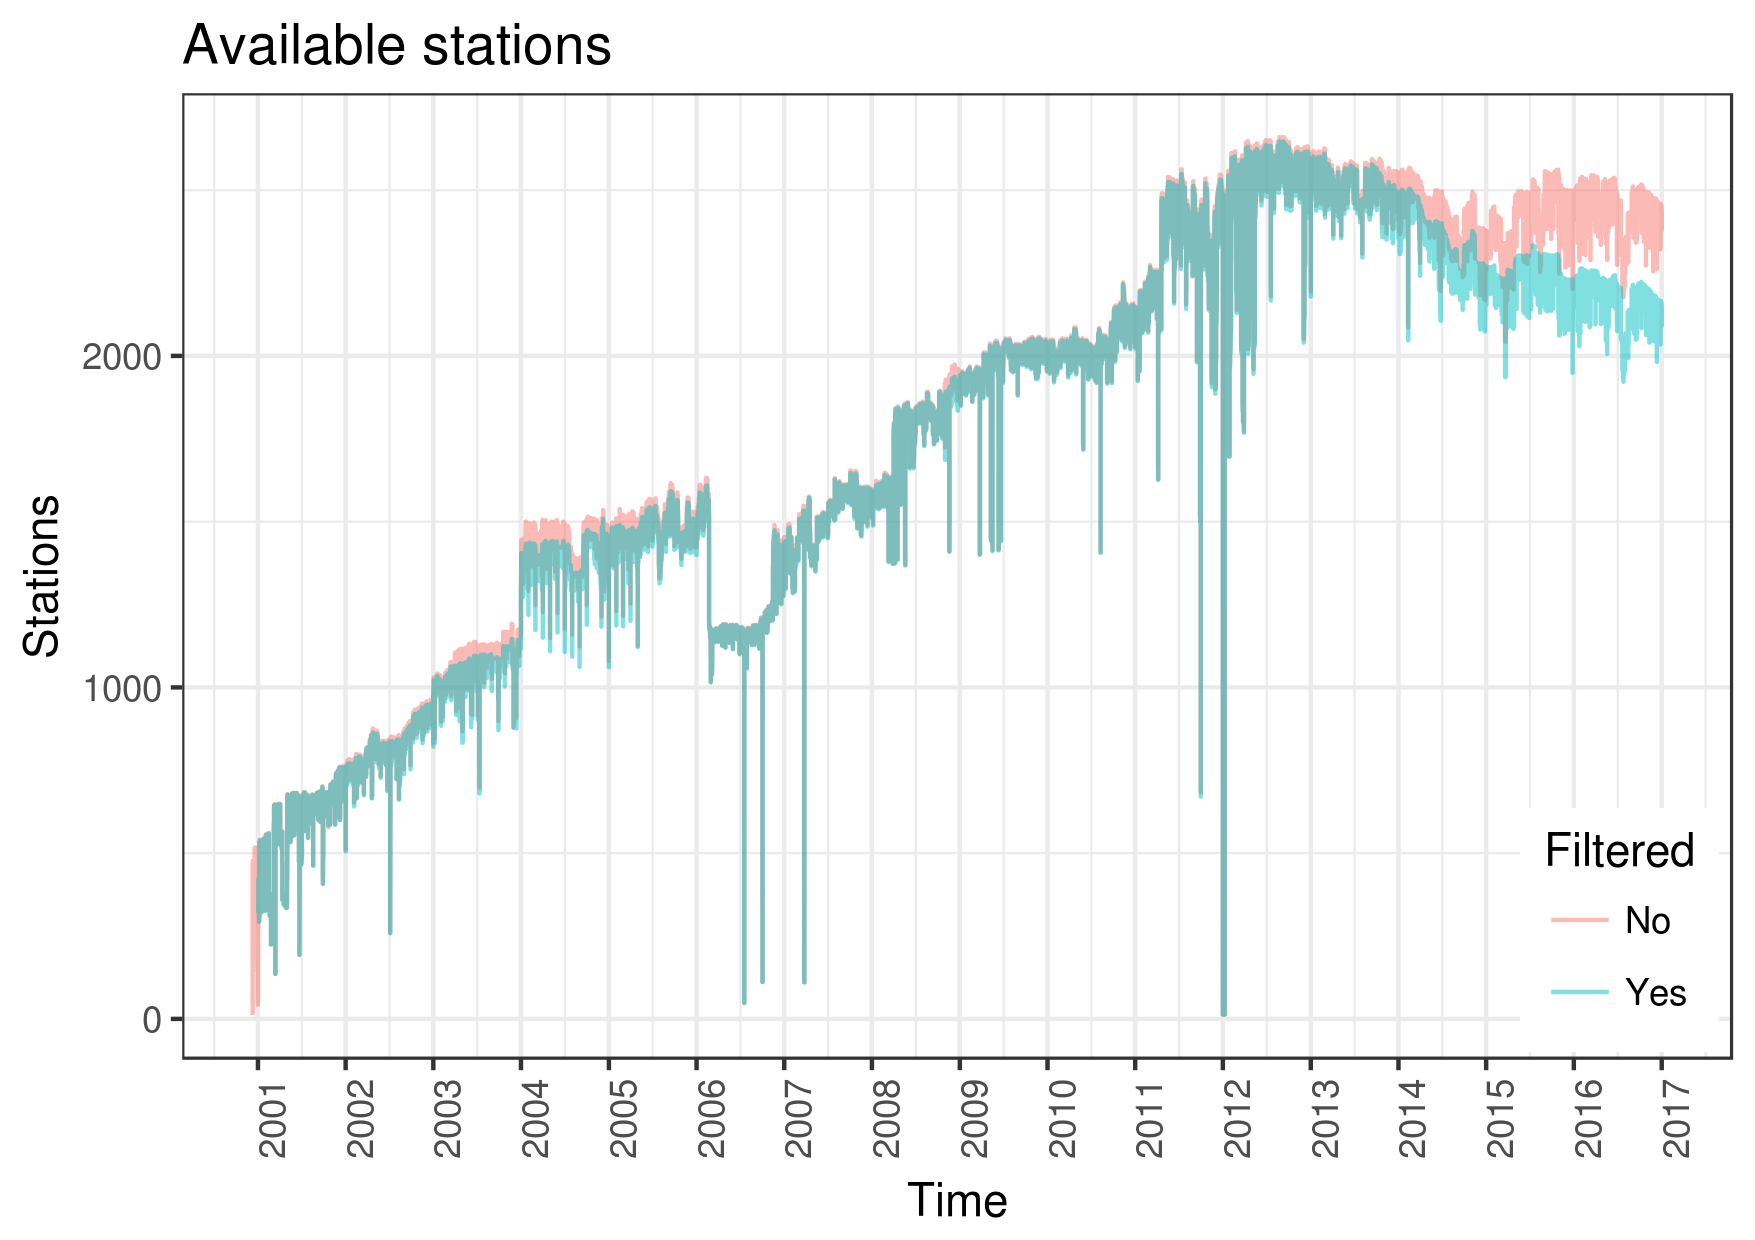
- Average of 1800 active stations: 1 station every 13x13km
- Max 2600 at one time (2012): 1 station every 11x11 km
- Min 500 at one time (2001): 1 station every 25x25 km
- Time resolution: hourly data (!!!) in mm/h
- ~2001-present, updating
- No useful metadata
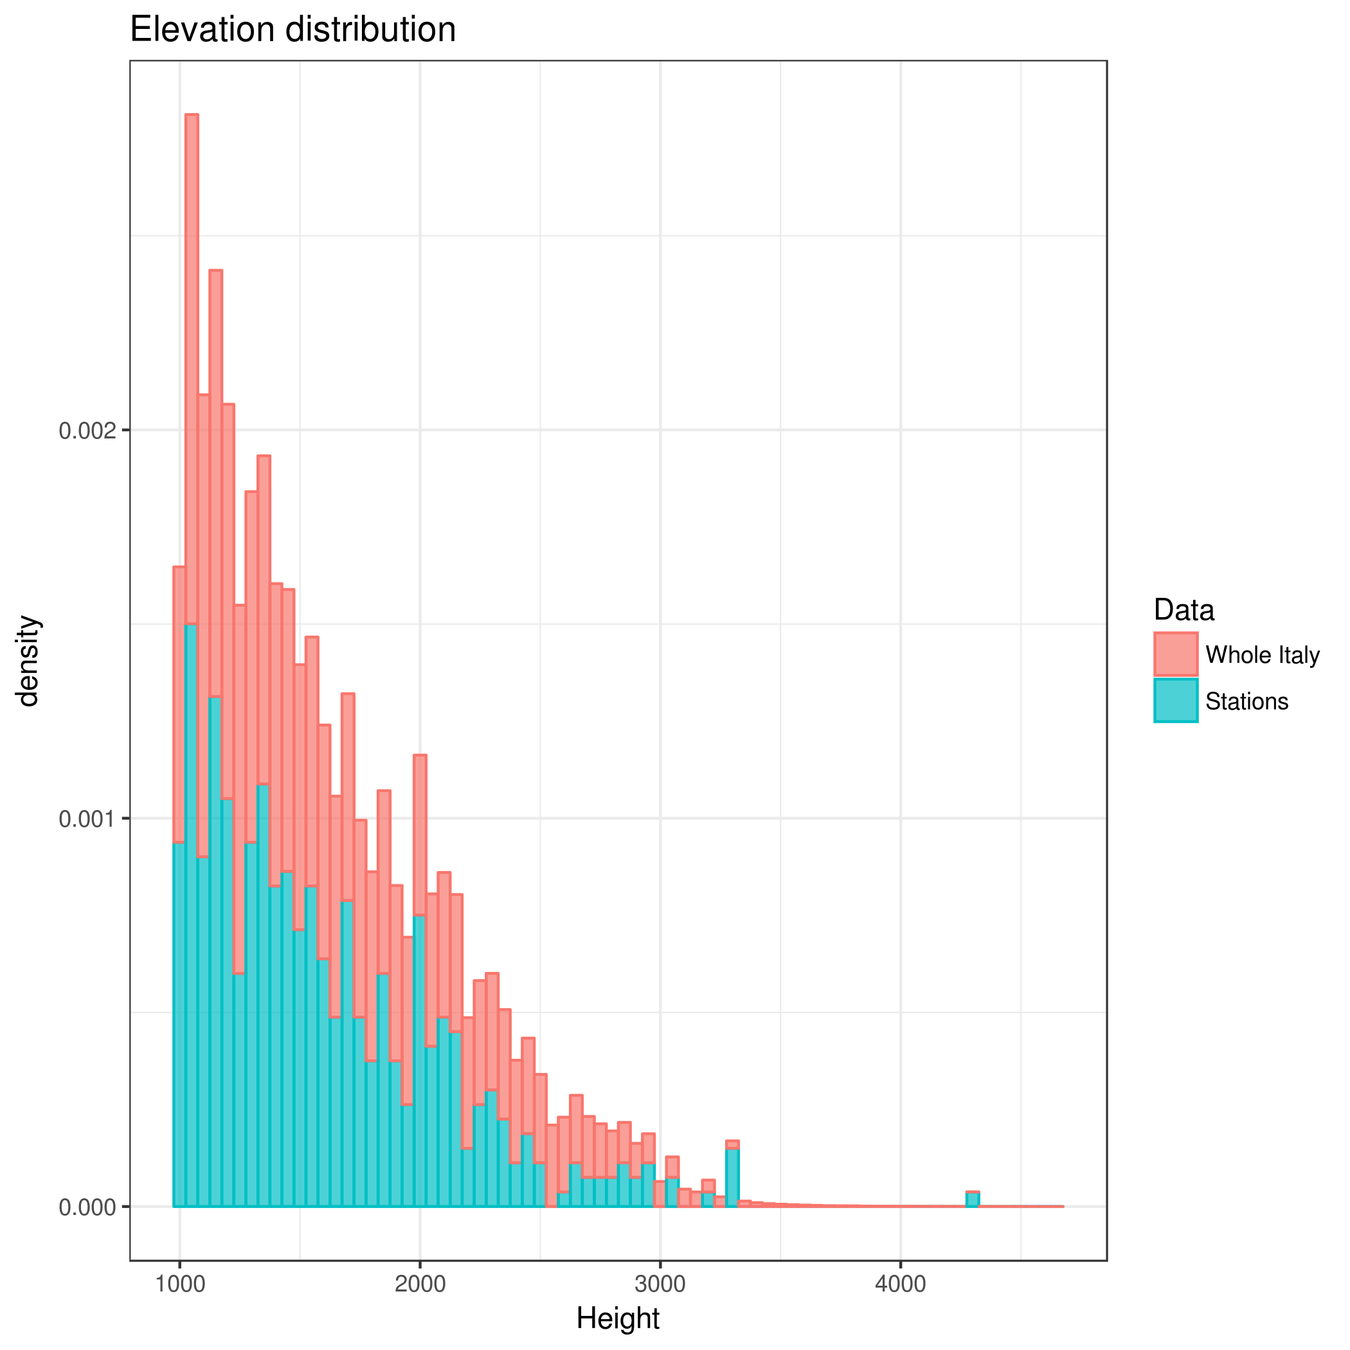
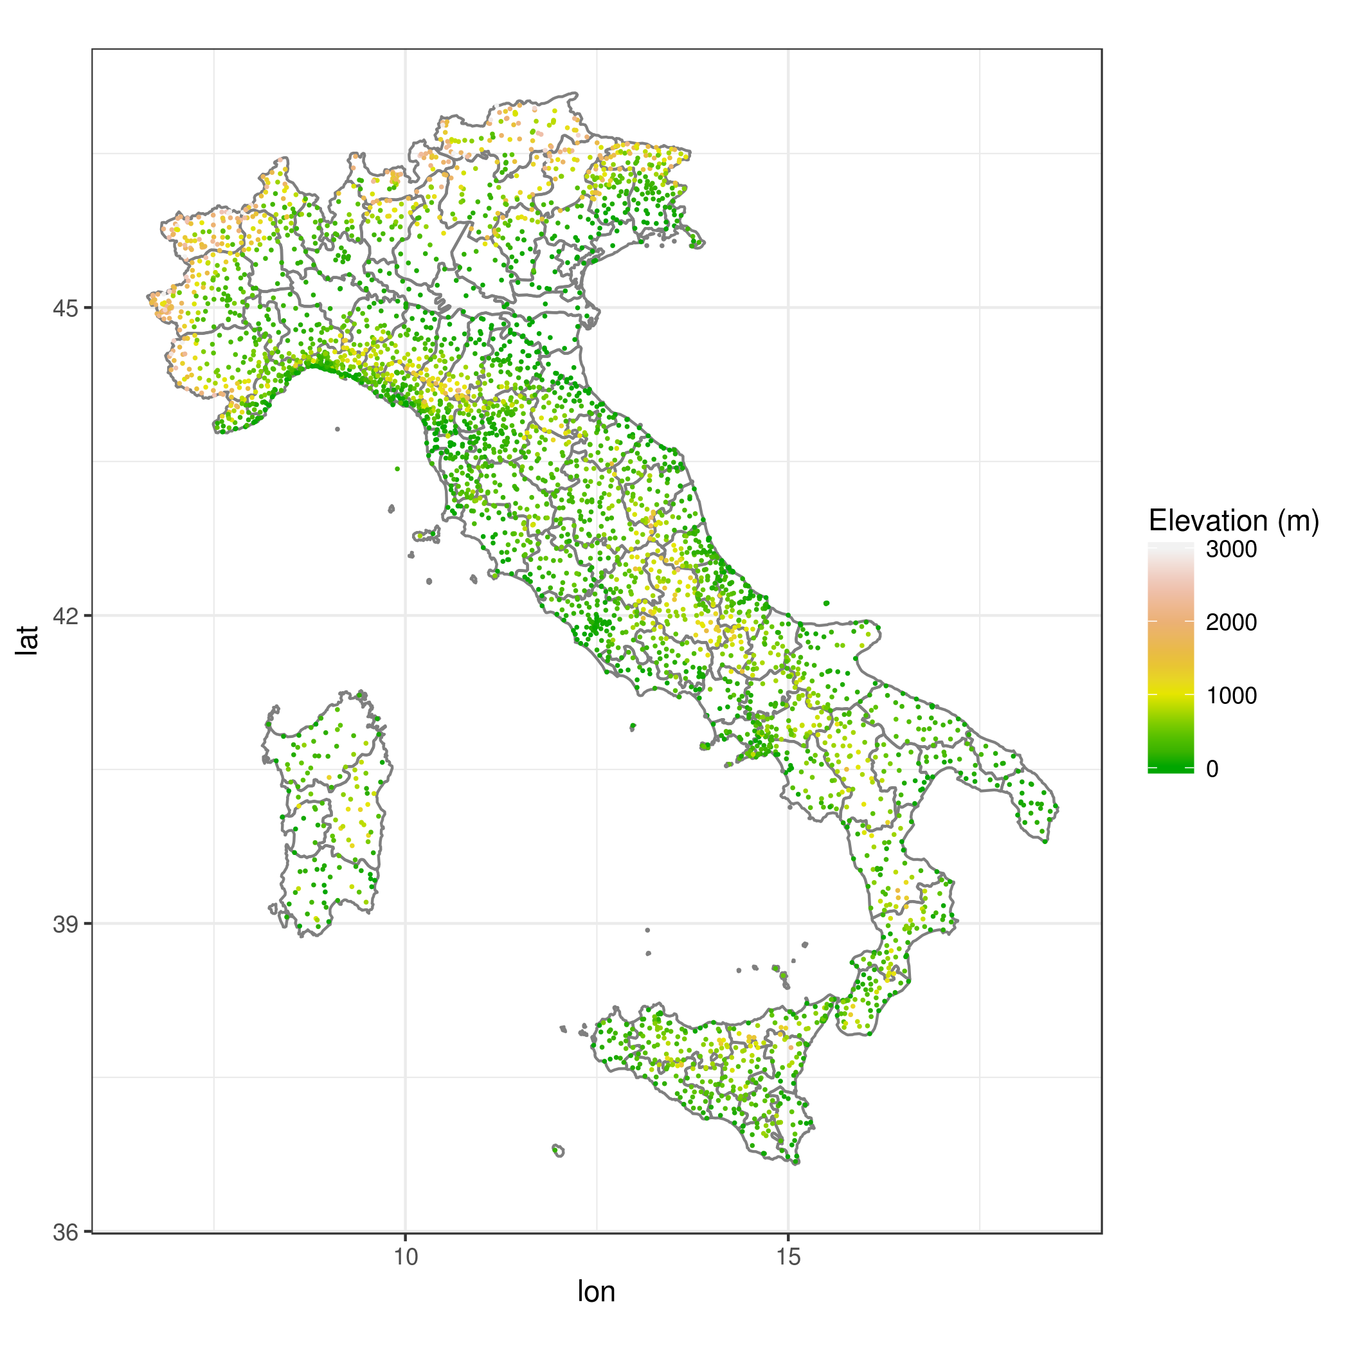
Elevation characteristics
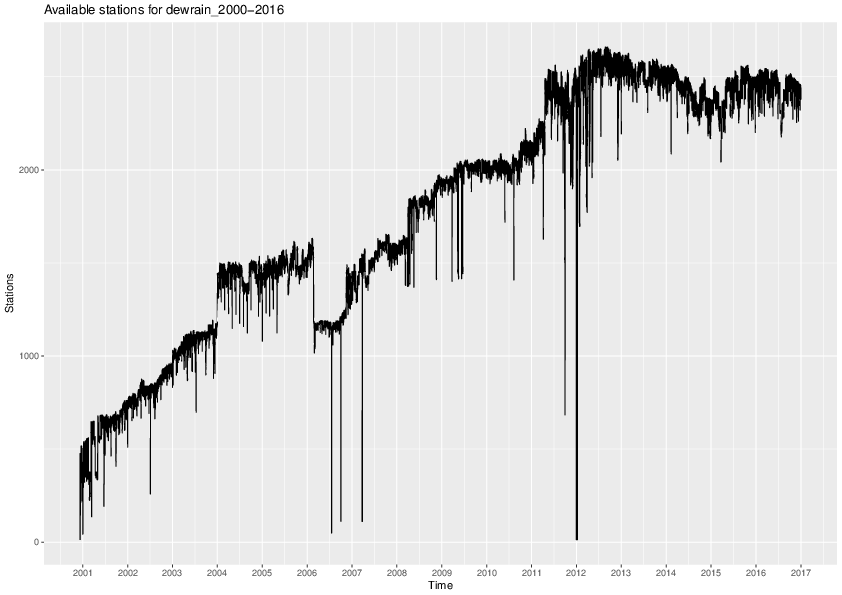
MISSING TIMESTEPS
LOW STATION DENSITY
TIME
NUMBER OF STATIONS
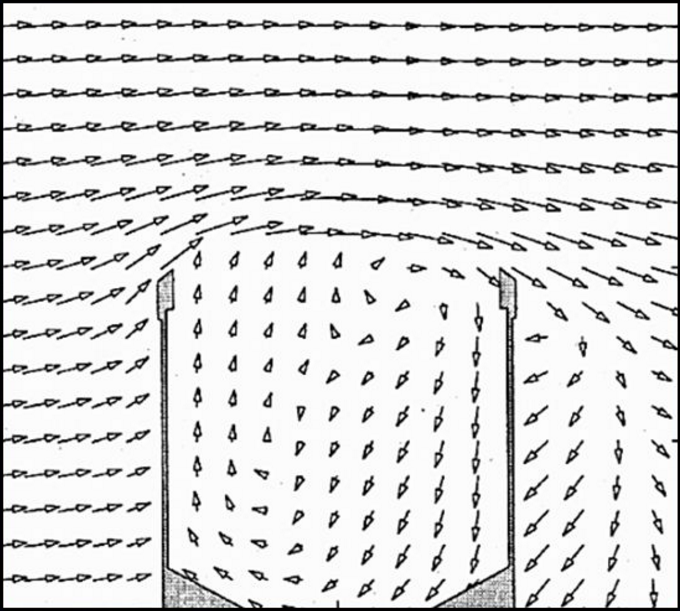
Nespor and Sevruk, 1999
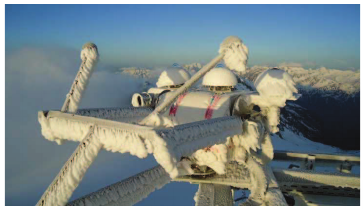
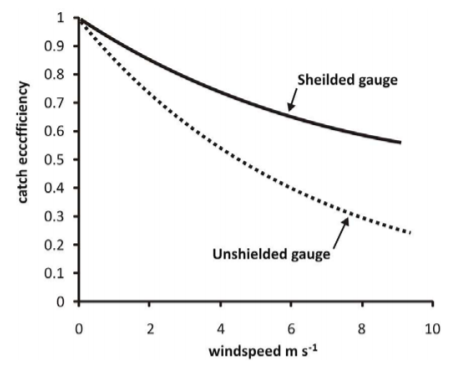
Macdonald and Pomeroy, 2008
Undercatch
>30% ?
IGNORE?
Common problems with
in-situ measurements
Temporal and spatial problems:
- Short timescale
- Missing periods
- Low station density
- Missing timesteps
Data quality problems:
- Breaks and inhomogeneities
- Manual measurement errors
- Equipment errors and failures
- Weather-related measurement errors
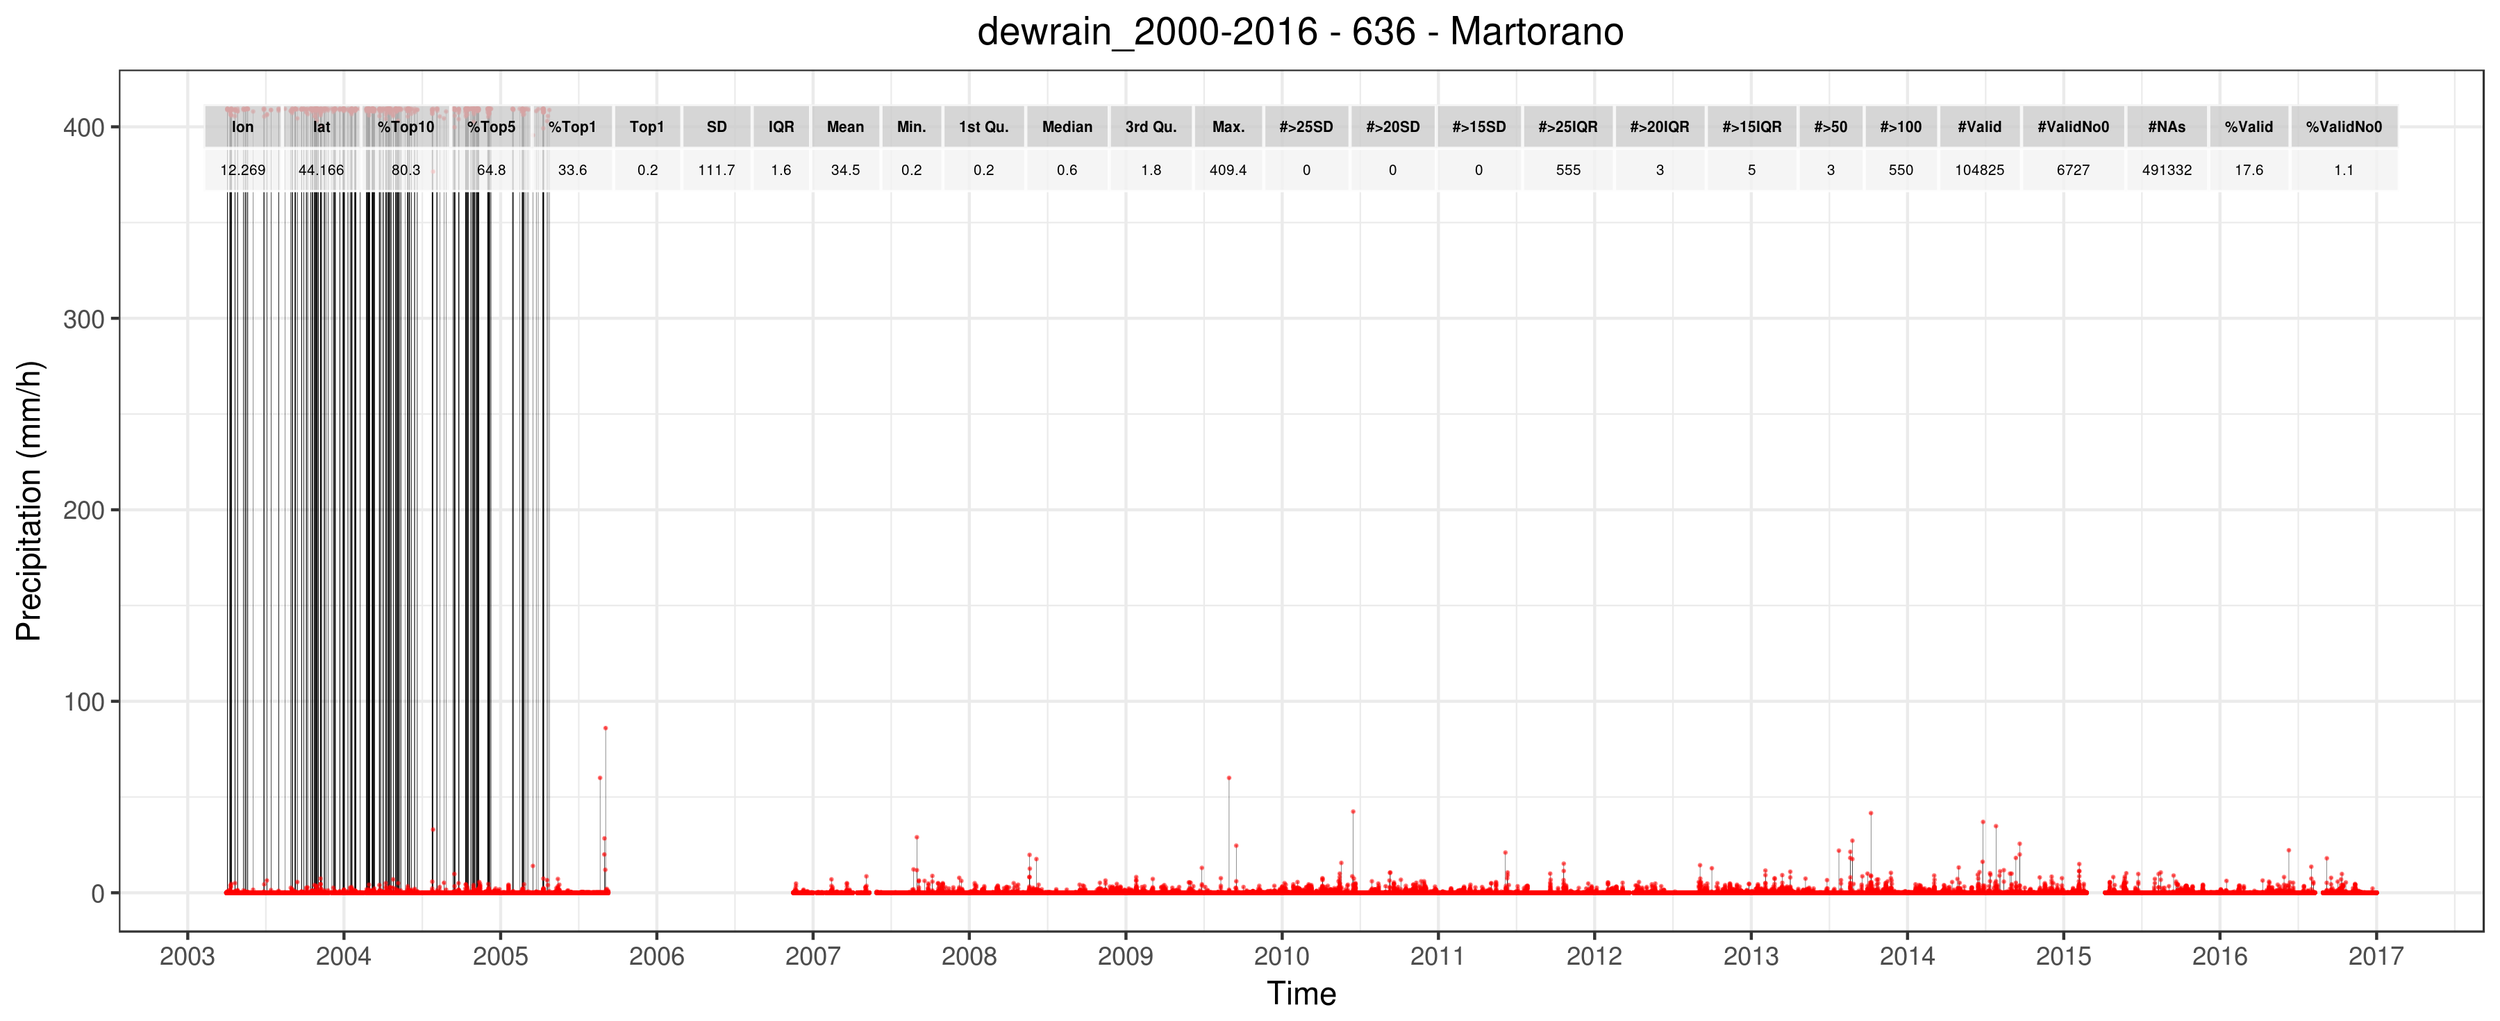
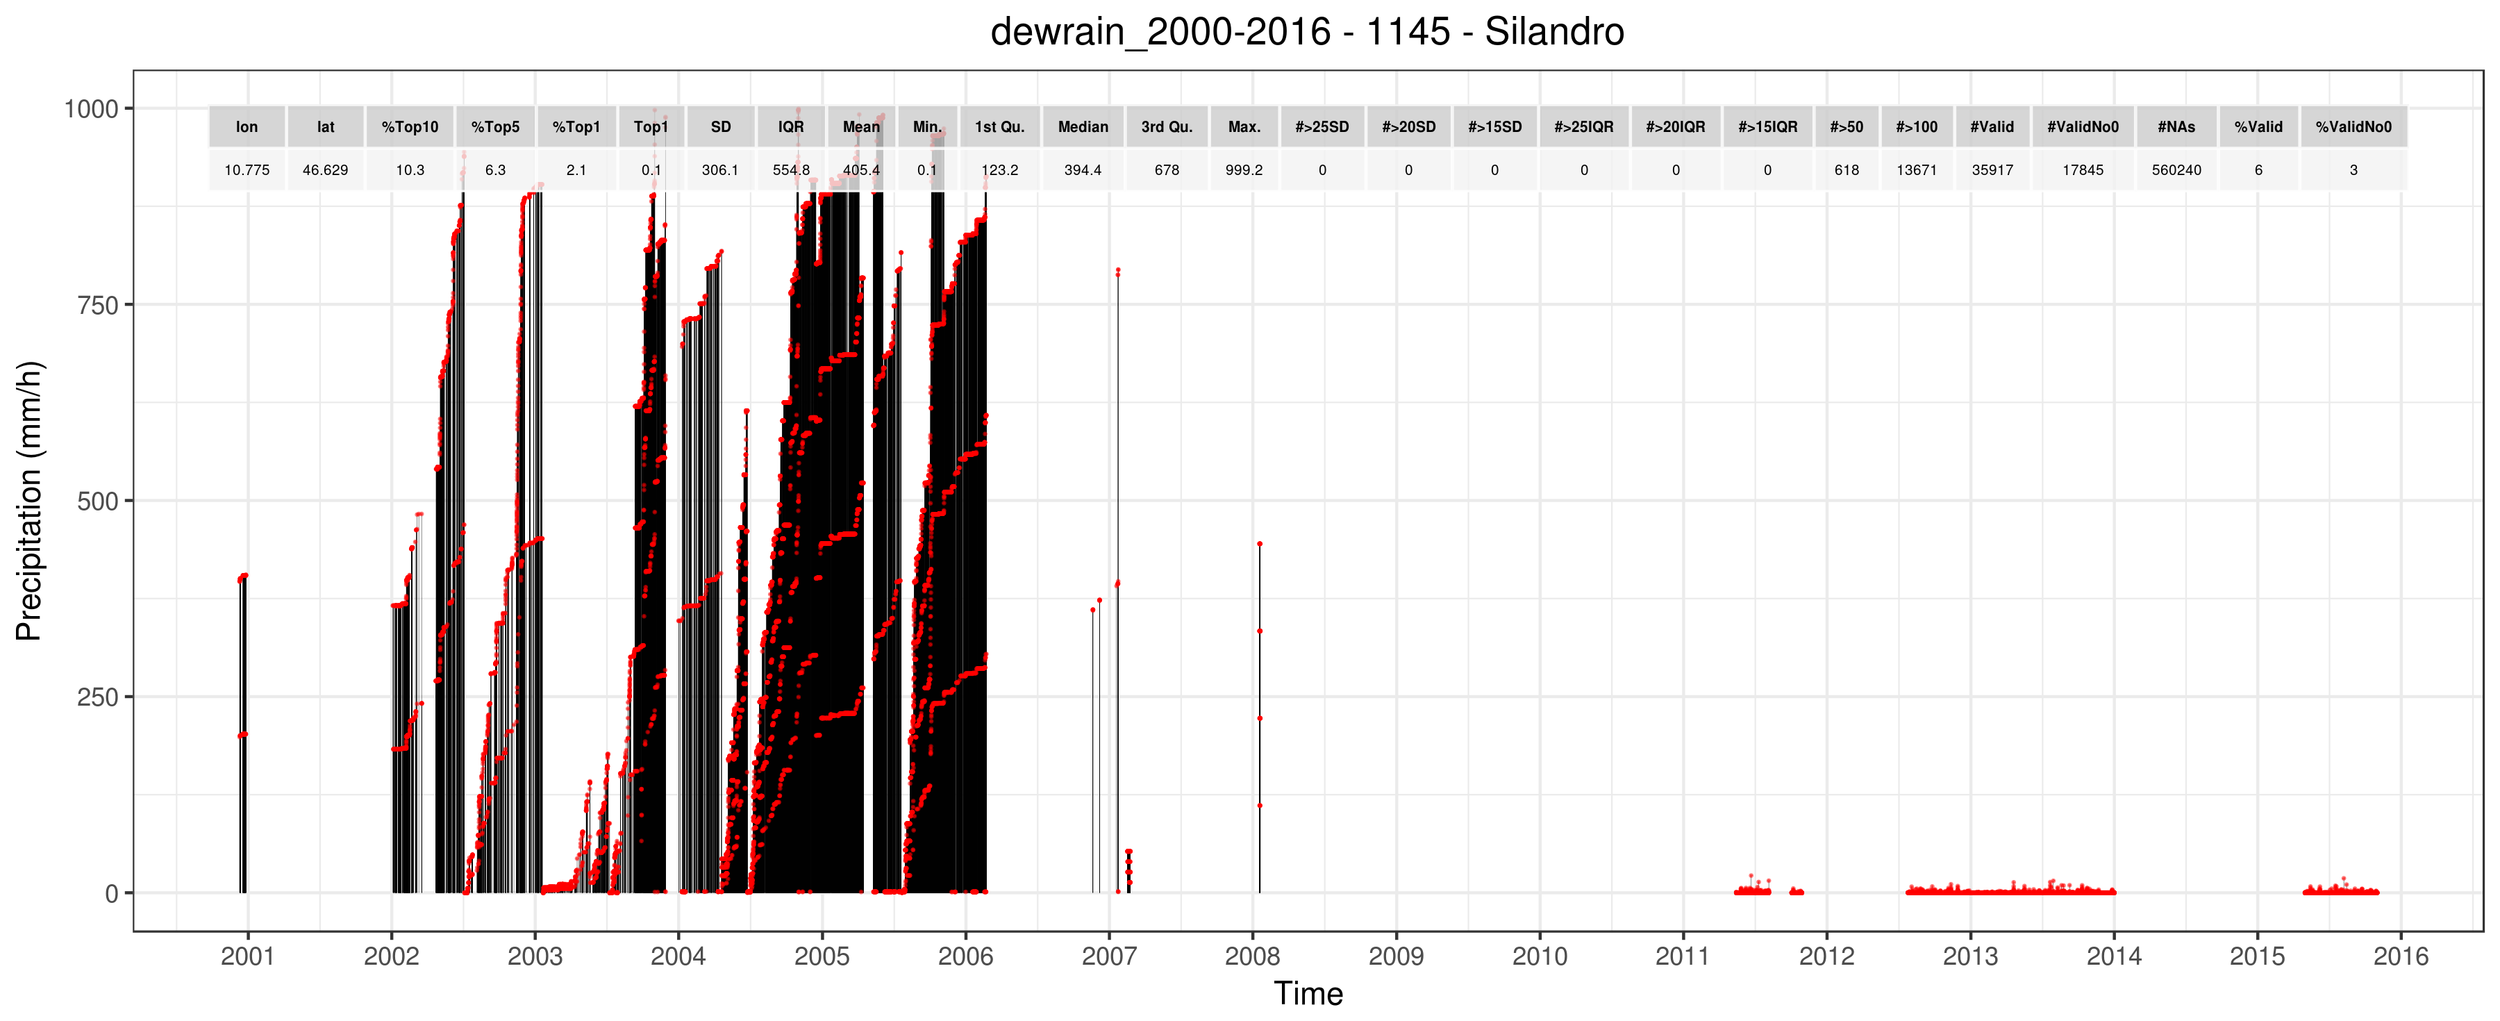
VERY FREQUENT OUTLIERS
The question is, as always:
HOW TO REMOVE OUTLIERS WITHOUT REMOVING HIGH PRECIPITATION EXTREMES?
FIRST-STAGE FILTERING
FLAGGING
FLAG CHECKING
CLEANED DATASET!
Possible first-stage filtering procedures
- Removal of extreme values > 200 mm/h
- Removal of isolated > 100 mm/h reports
- Removal of complete months with > 1800 mm (2.5 mm/h)
- Removal of continuous identical values
- ...?
Rauthe et al. 2013; A Central European precipitation climatology–Part I: Generation and validation of a high-resolution gridded daily data set (HYRAS)
Isotta et al. 2013; The climate of daily precipitation in the Alps: development and analysis of a high‐resolution grid dataset from pan‐Alpine rain‐gauge data
Perry et al., 2009; The generation of daily gridded datasets of temperature and rainfall for the UK
Hiebl et al., 2017; Daily precipitation grids for Austria since 1961—development and evaluation of a spatial dataset for hydroclimatic monitoring and modelling
Possible flagging procedures
- Mean + n*SD threshold
- Median + n*IQR threshold
- Peaks in the values distribution
- Isolated dry/wet event flagging
- Low correlation of close stations
- ...?
Rauthe et al. 2013; A Central European precipitation climatology–Part I: Generation and validation of a high-resolution gridded daily data set (HYRAS)
Isotta et al. 2013; The climate of daily precipitation in the Alps: development and analysis of a high‐resolution grid dataset from pan‐Alpine rain‐gauge data
Perry et al., 2009; The generation of daily gridded datasets of temperature and rainfall for the UK
Hiebl et al., 2017; Daily precipitation grids for Austria since 1961—development and evaluation of a spatial dataset for hydroclimatic monitoring and modelling
Possible flag-checking procedures
- Visual comparison of maps/videos
- Visual comparison of close timeseries
- Comparison with daily datasets (EURO4M-APGD, E-OBS, ...)
- Comparison with hourly datasets (PERSIANN, ...)
- ...?
Rauthe et al. 2013; A Central European precipitation climatology–Part I: Generation and validation of a high-resolution gridded daily data set (HYRAS)
Isotta et al. 2013; The climate of daily precipitation in the Alps: development and analysis of a high‐resolution grid dataset from pan‐Alpine rain‐gauge data
Perry et al., 2009; The generation of daily gridded datasets of temperature and rainfall for the UK
Hiebl et al., 2017; Daily precipitation grids for Austria since 1961—development and evaluation of a spatial dataset for hydroclimatic monitoring and modelling
Results so far...
(by applying first-stage filtering procedures only)
| Before | After | Diff | |
|---|---|---|---|
| Total valid values | 250M | 243M | -2.6% |
| Total flags | 324468 | 58008 | -82.1% |
| pr > Mean + 20SD | 3240 | 2538 | -21.7% |
| pr > Median + 20IQR | 49753 | 22519 | -54.7% |
| pr > 100 mm/h | 221822 | 711 | -99.6% |
| Other softer flags | 49646 | 32240 | -35.1% |
FILTERED
ORIGINAL
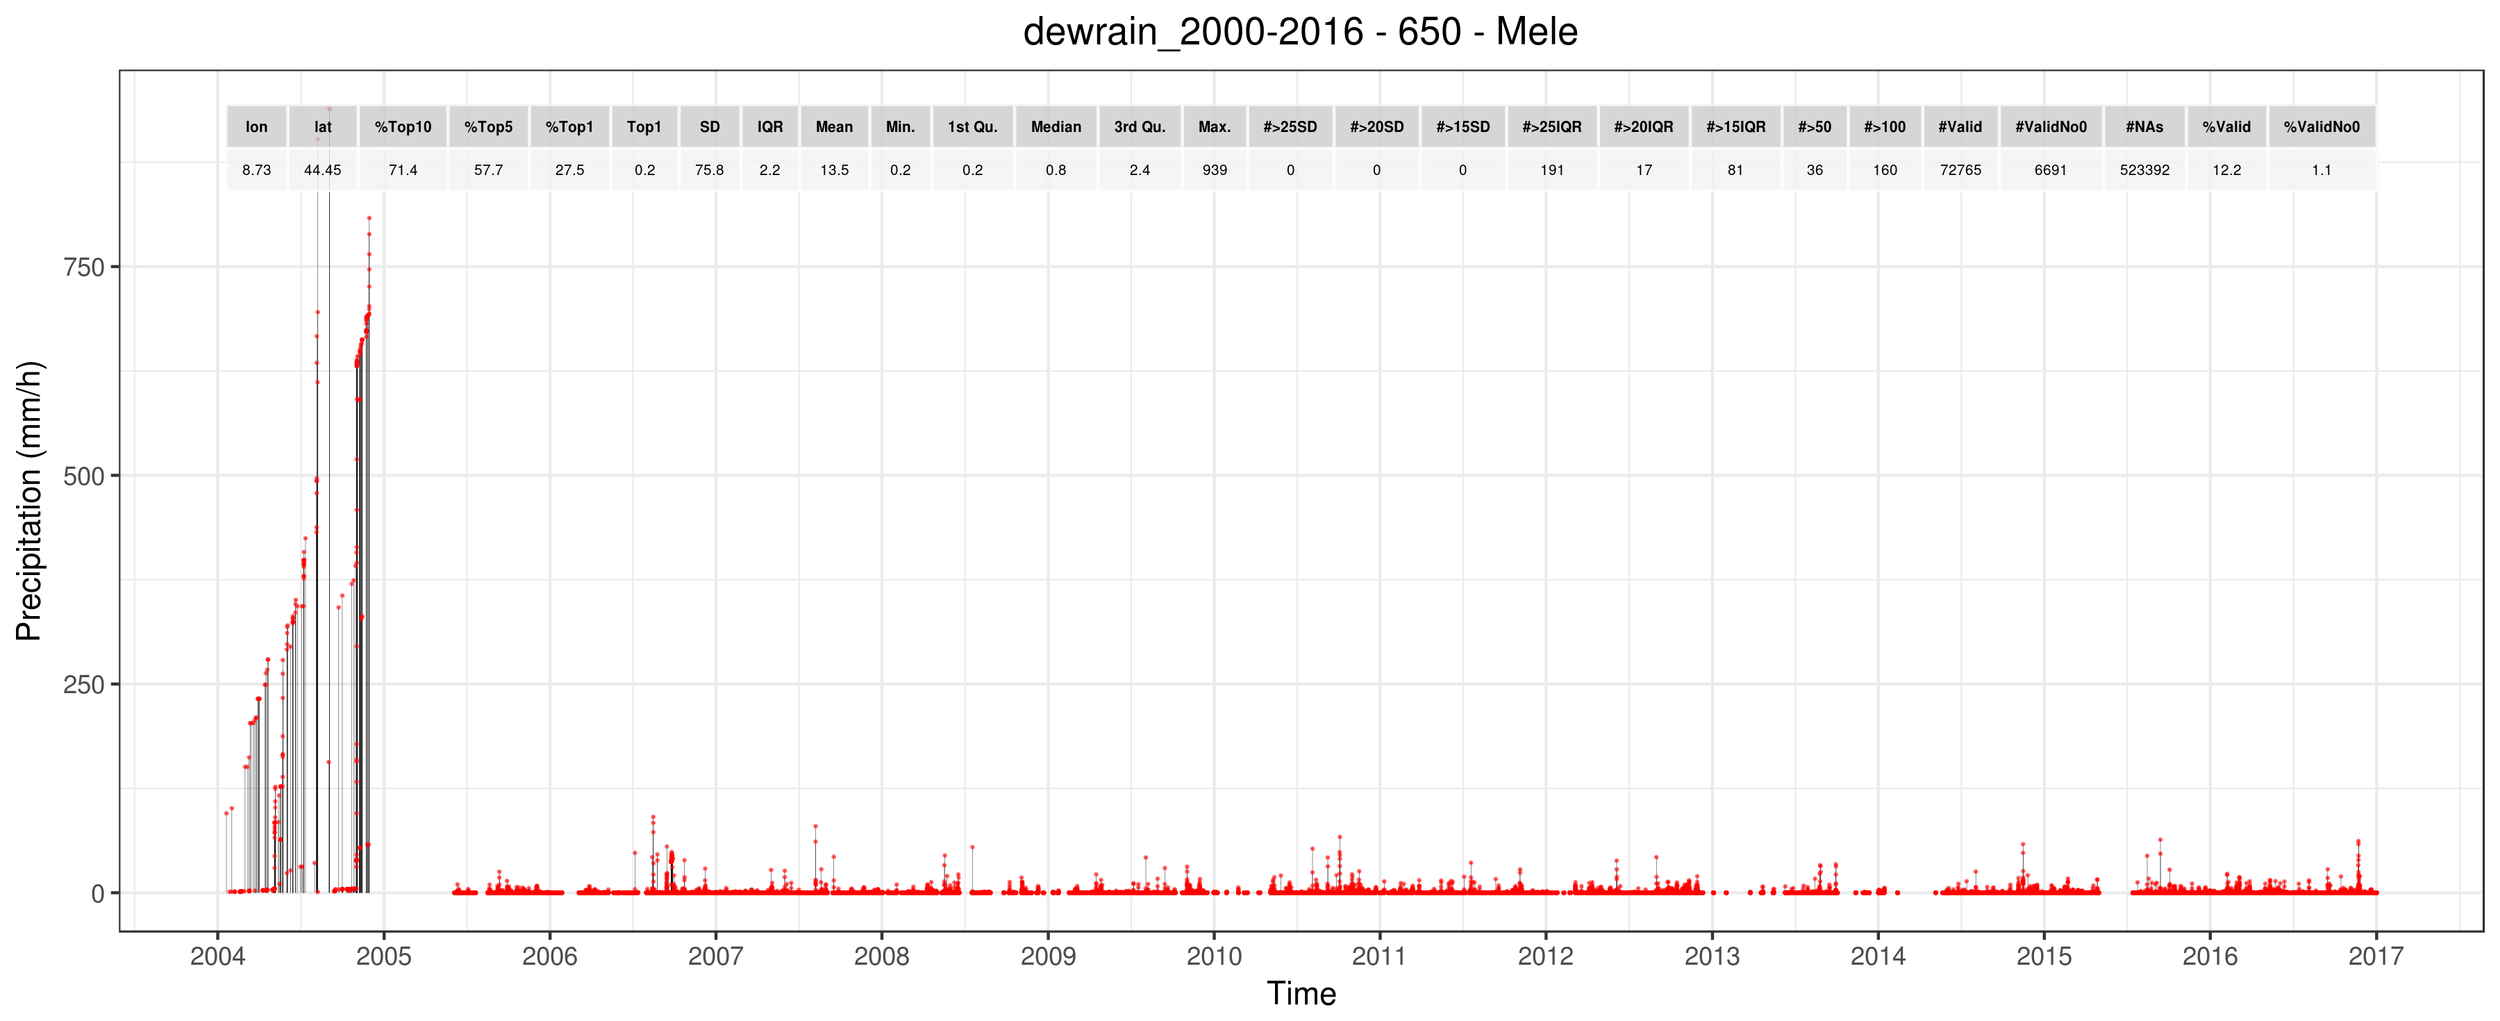
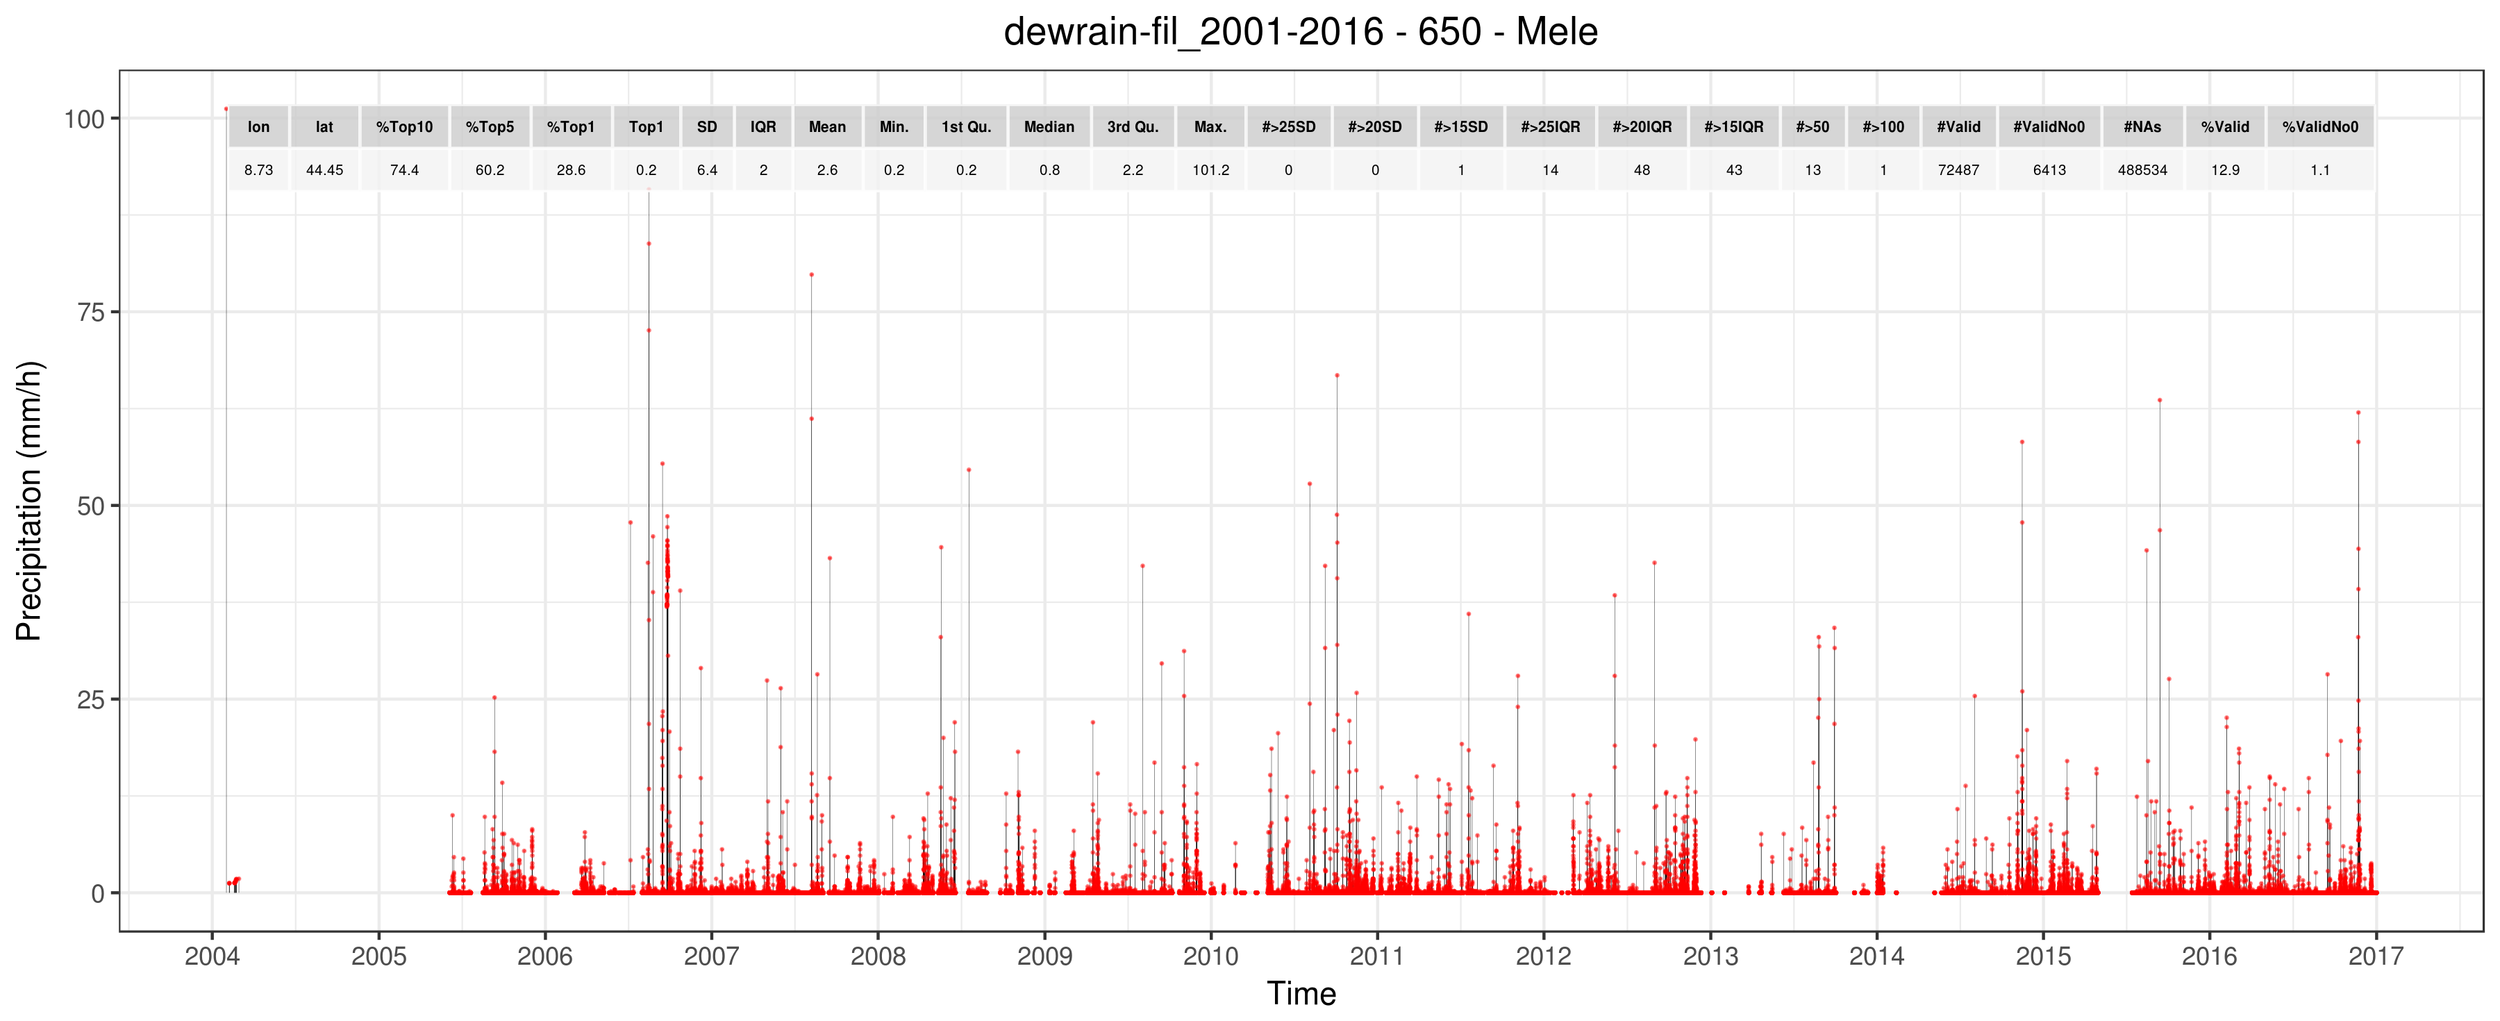
REMOVED!
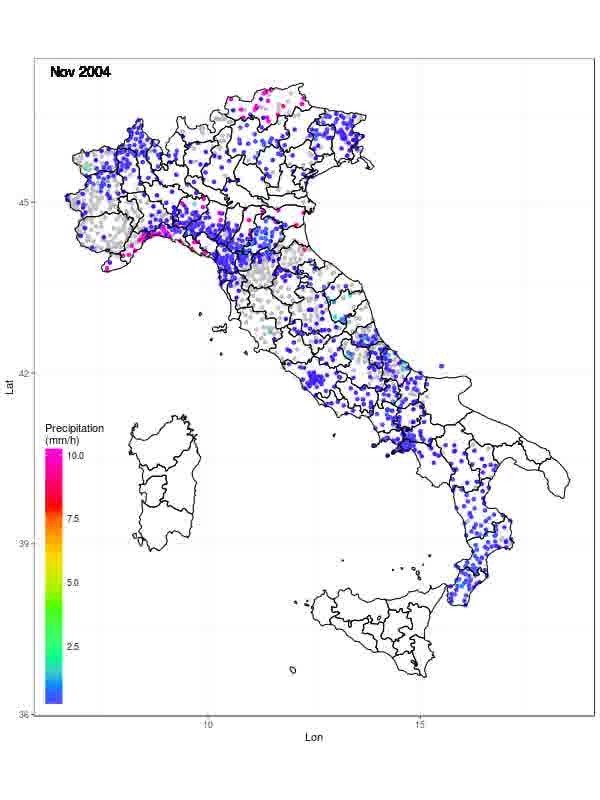
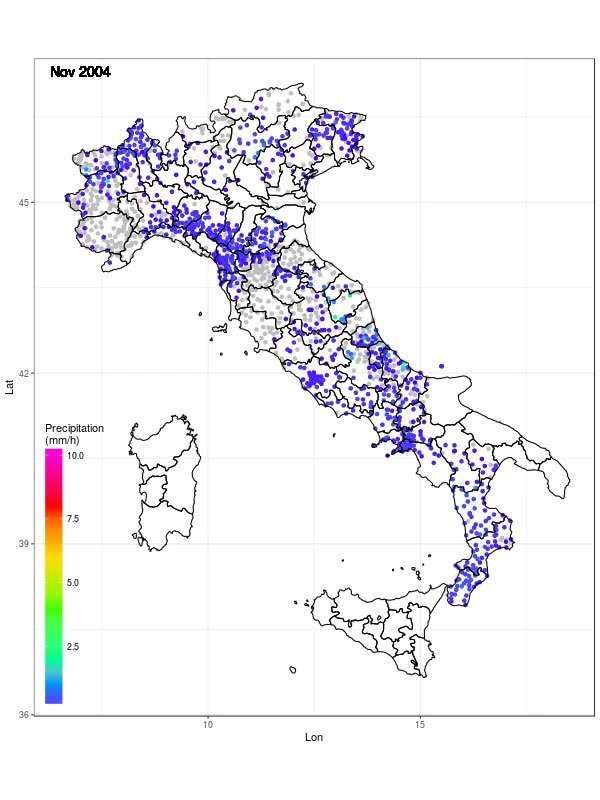
Monthly averages
However... flag checking madness: I still have ~60k flags to deal with!
At one flagged event per minute, that's 4 months of continuous, alienating work =
So I need either:
- Better first-stage filtering
- Faster flag checking
CAN YOU HELP?
pretty please
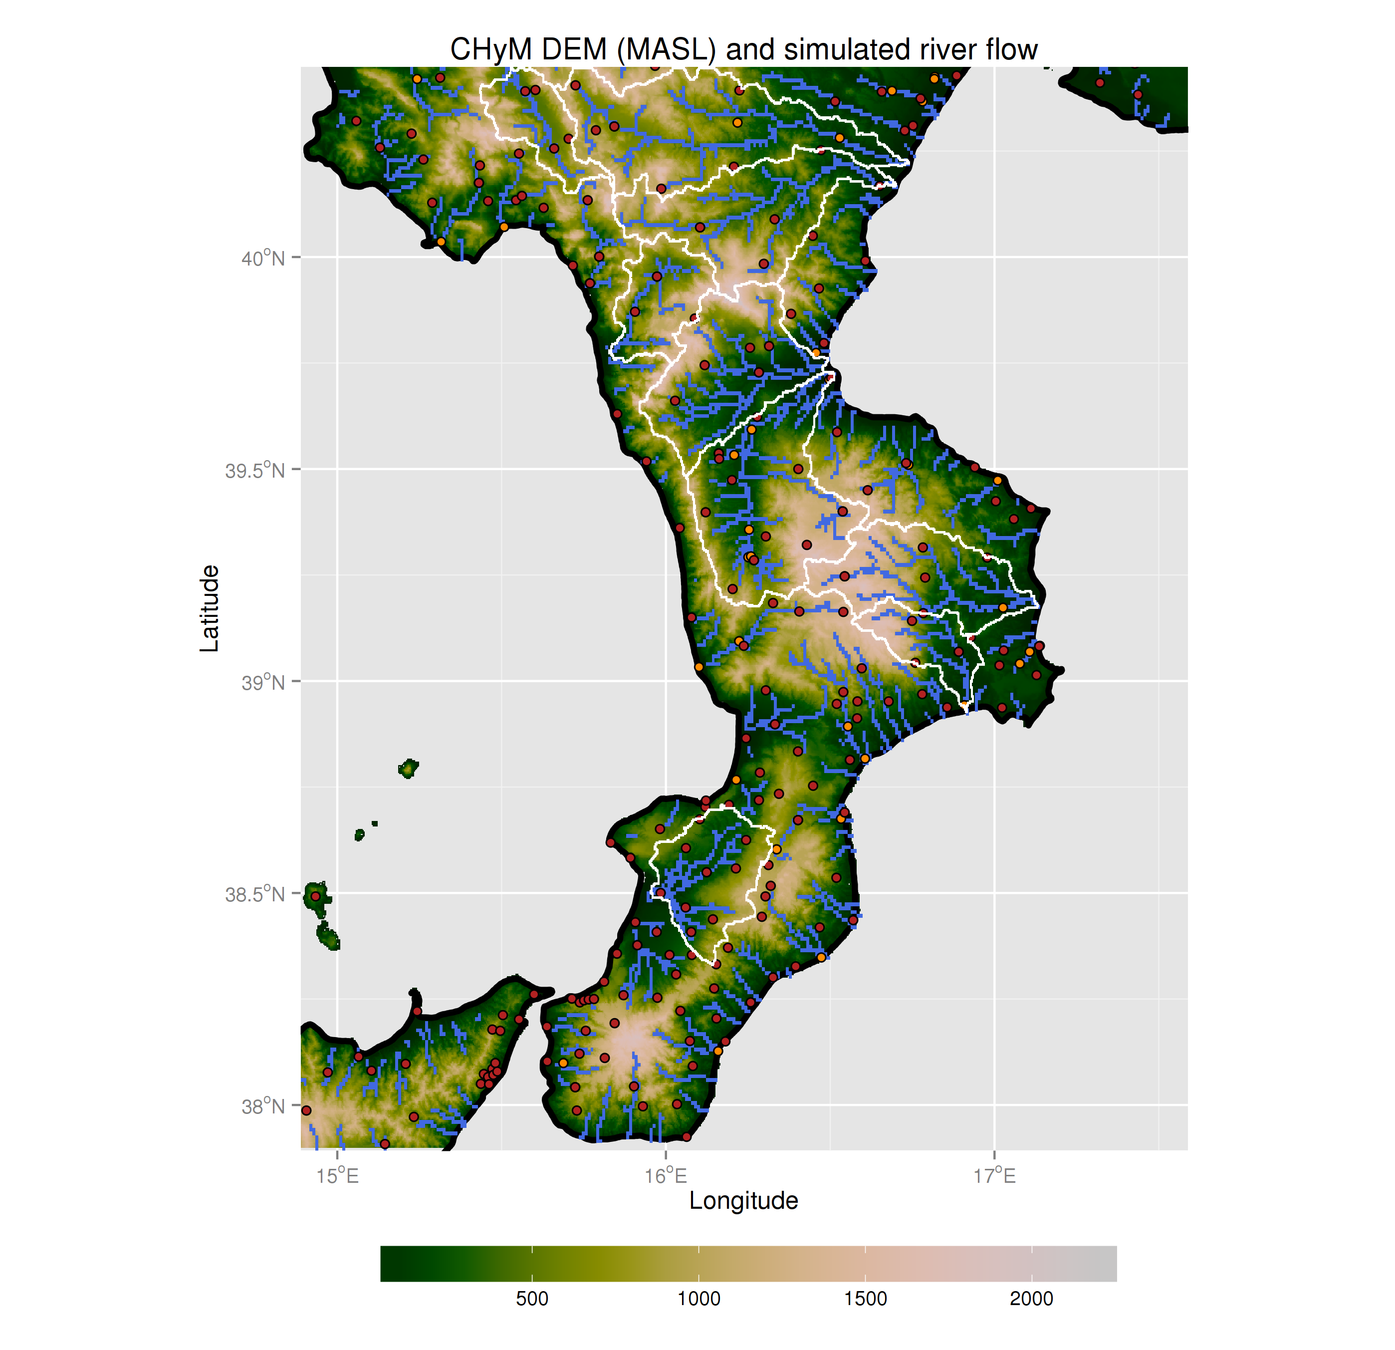
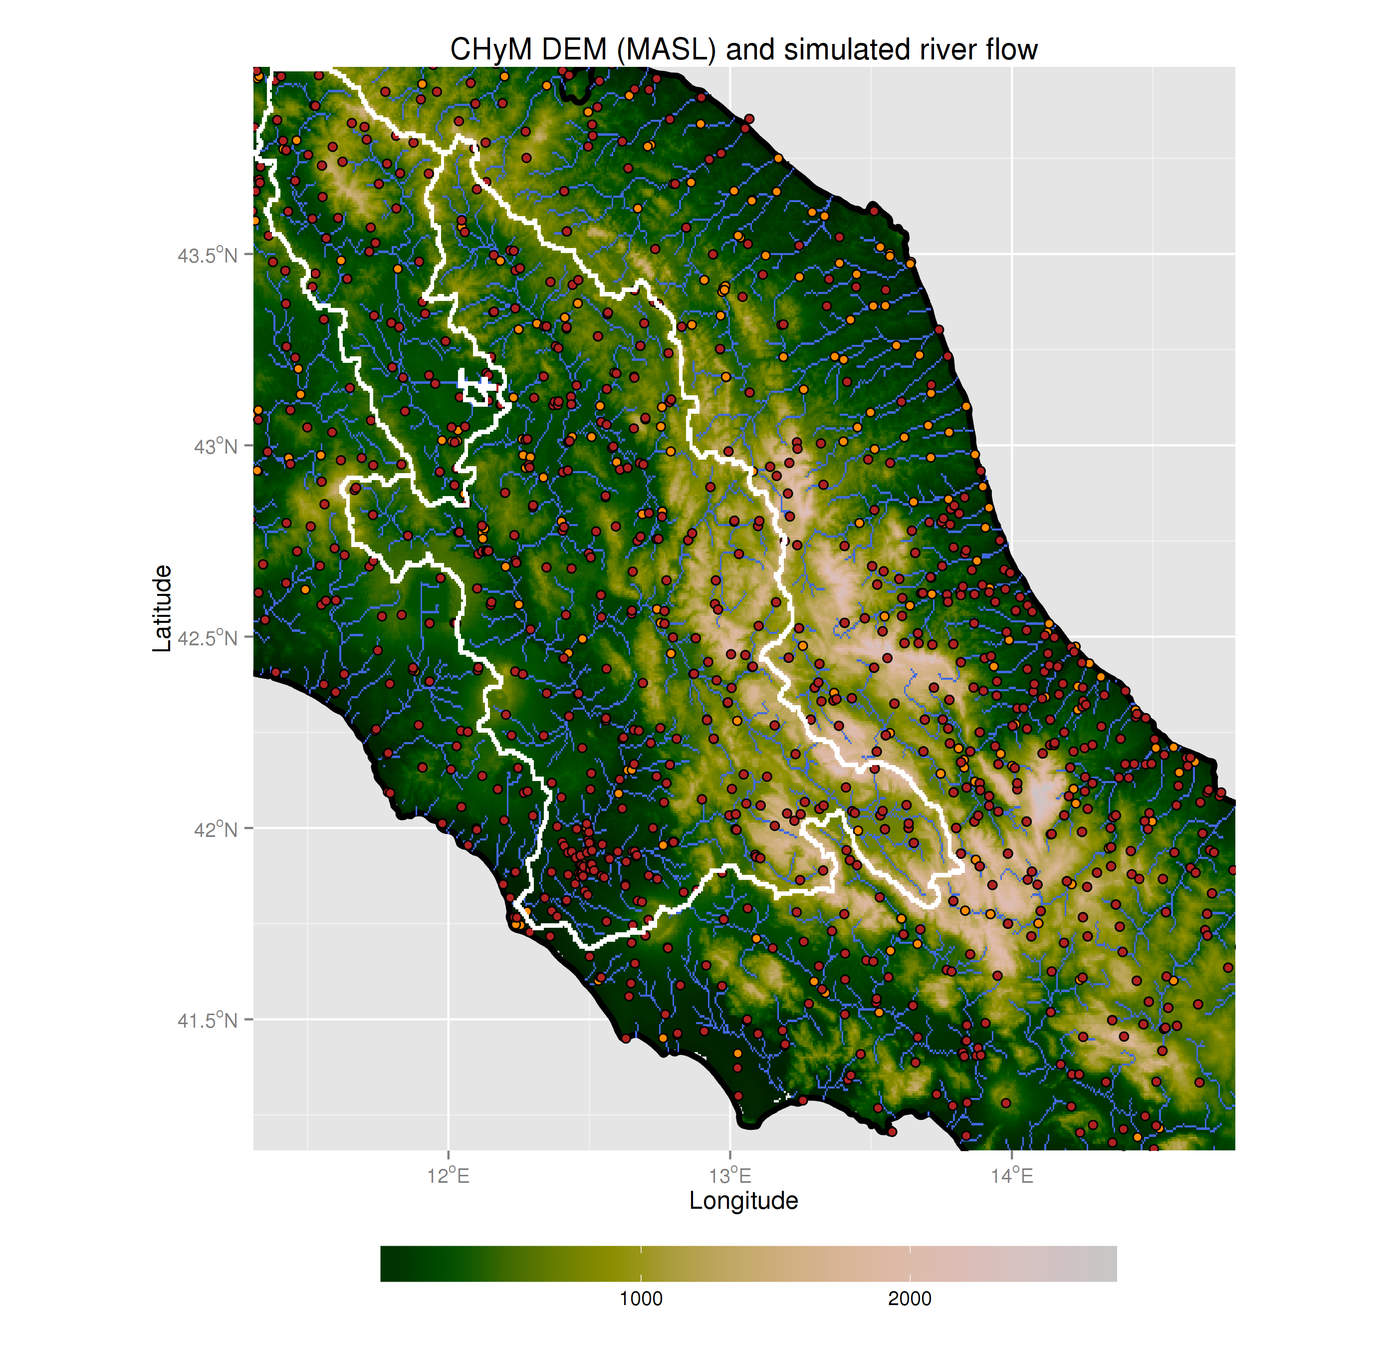
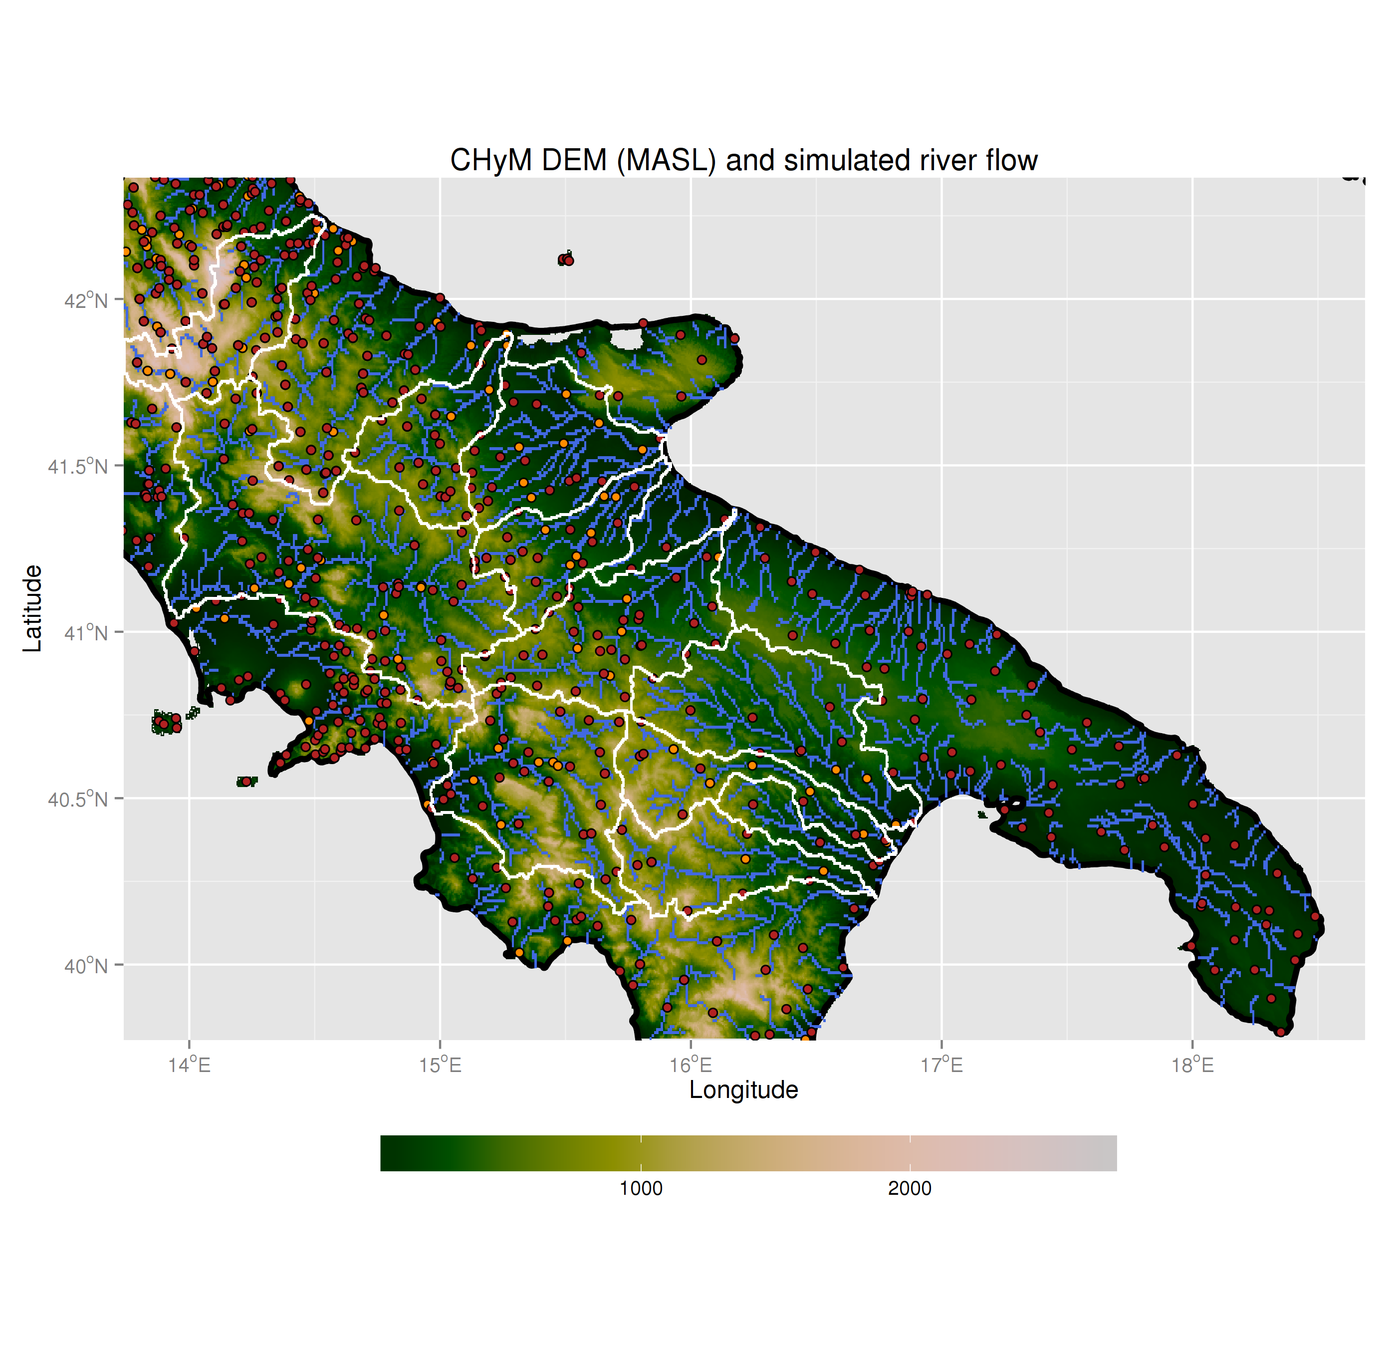
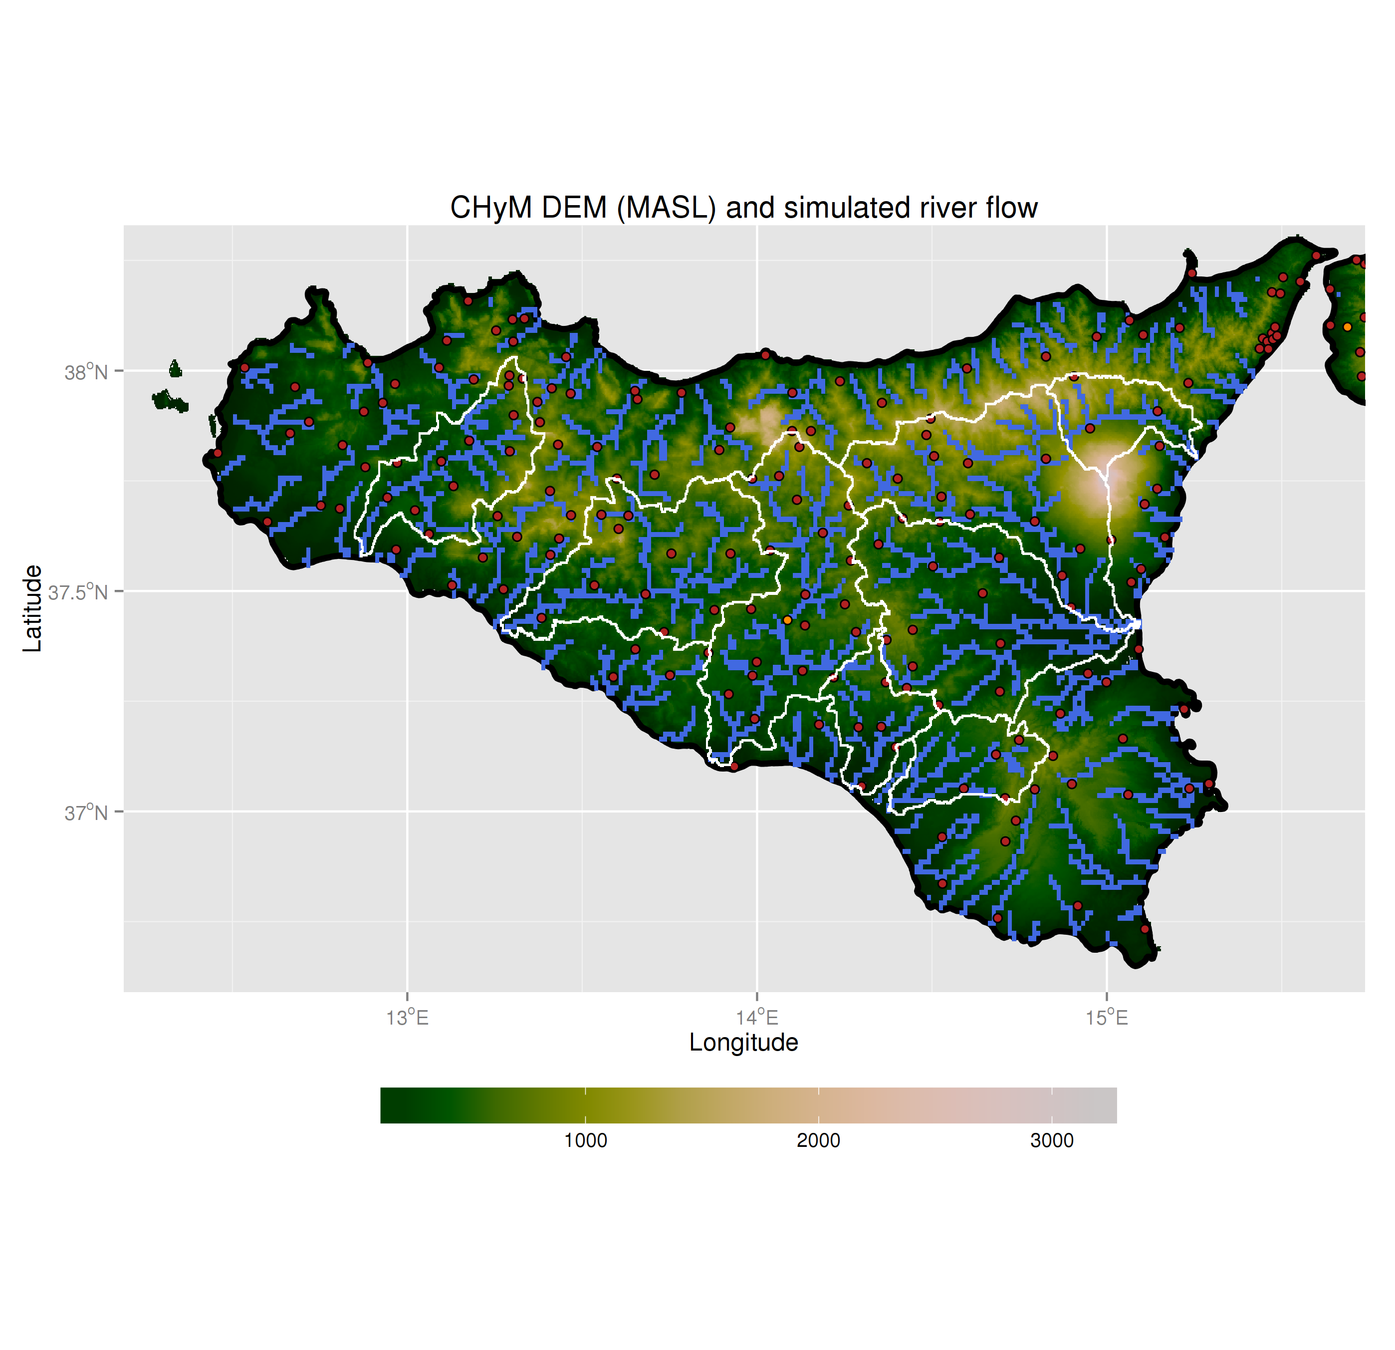
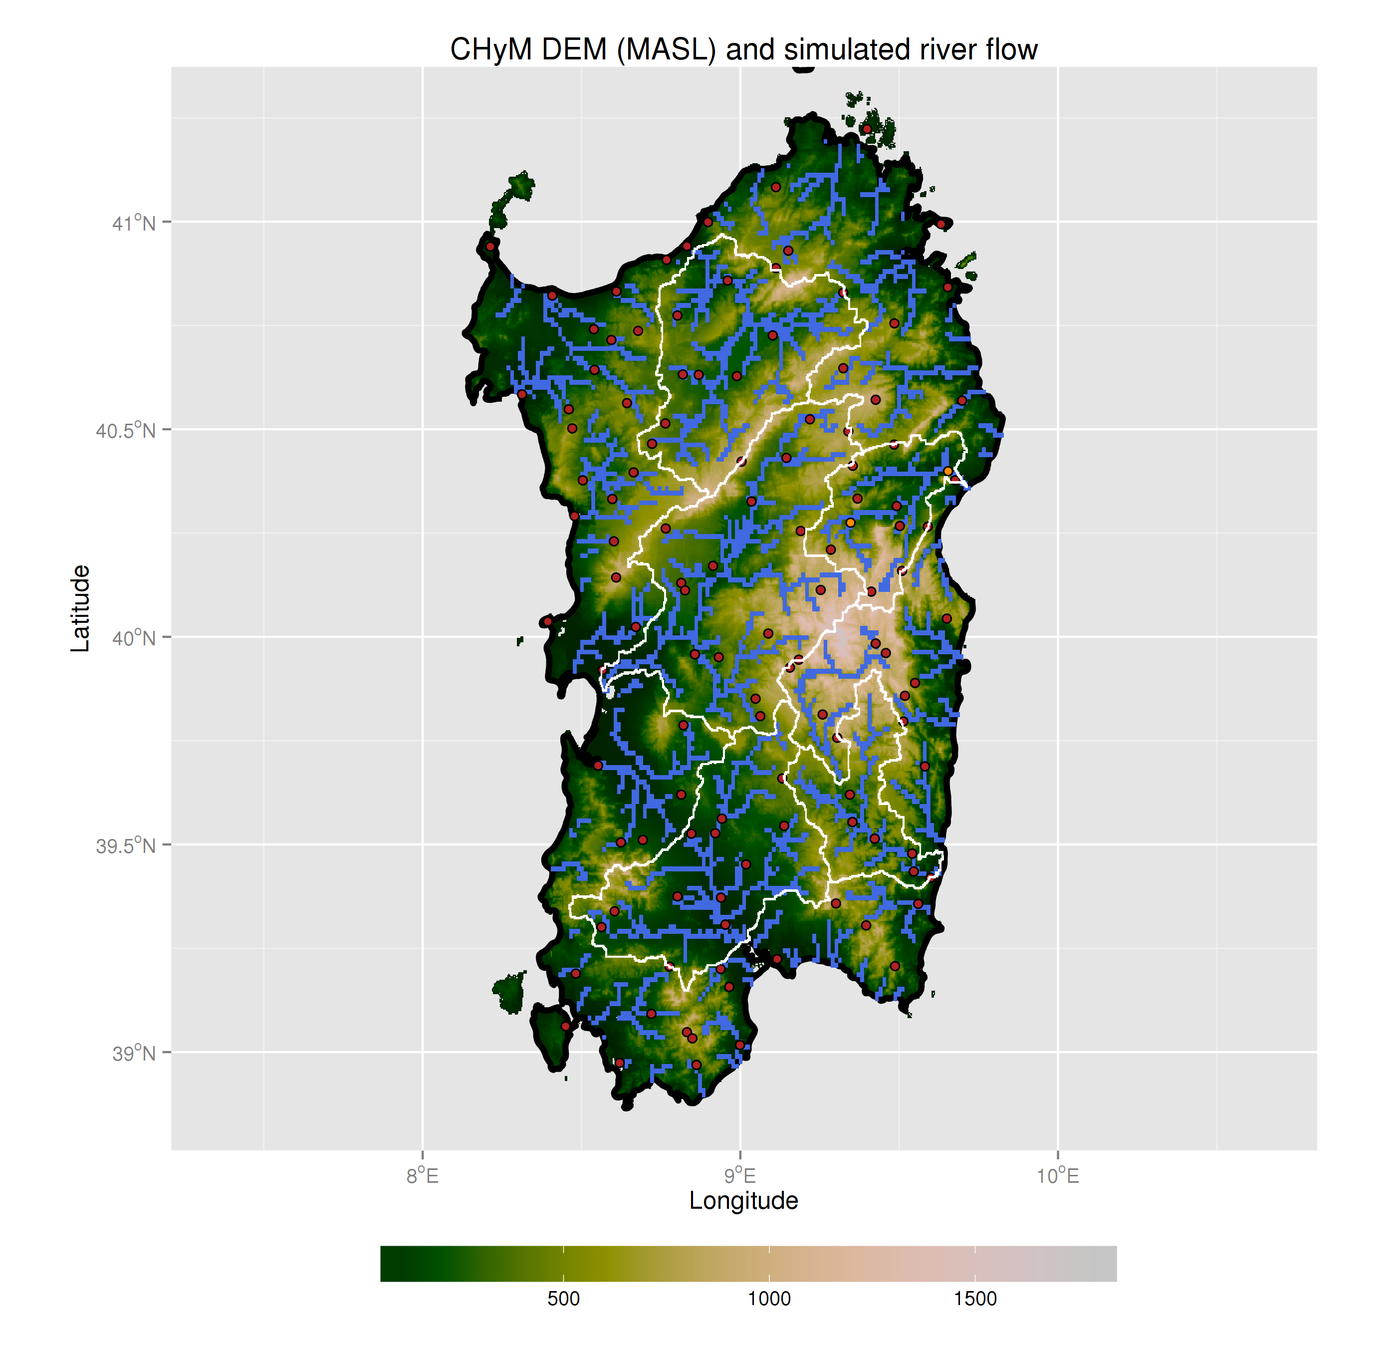
CETEMPS Hydrological Model
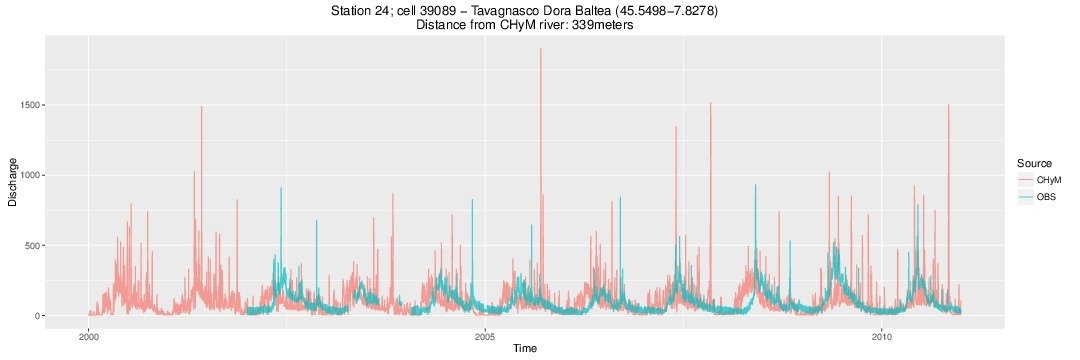
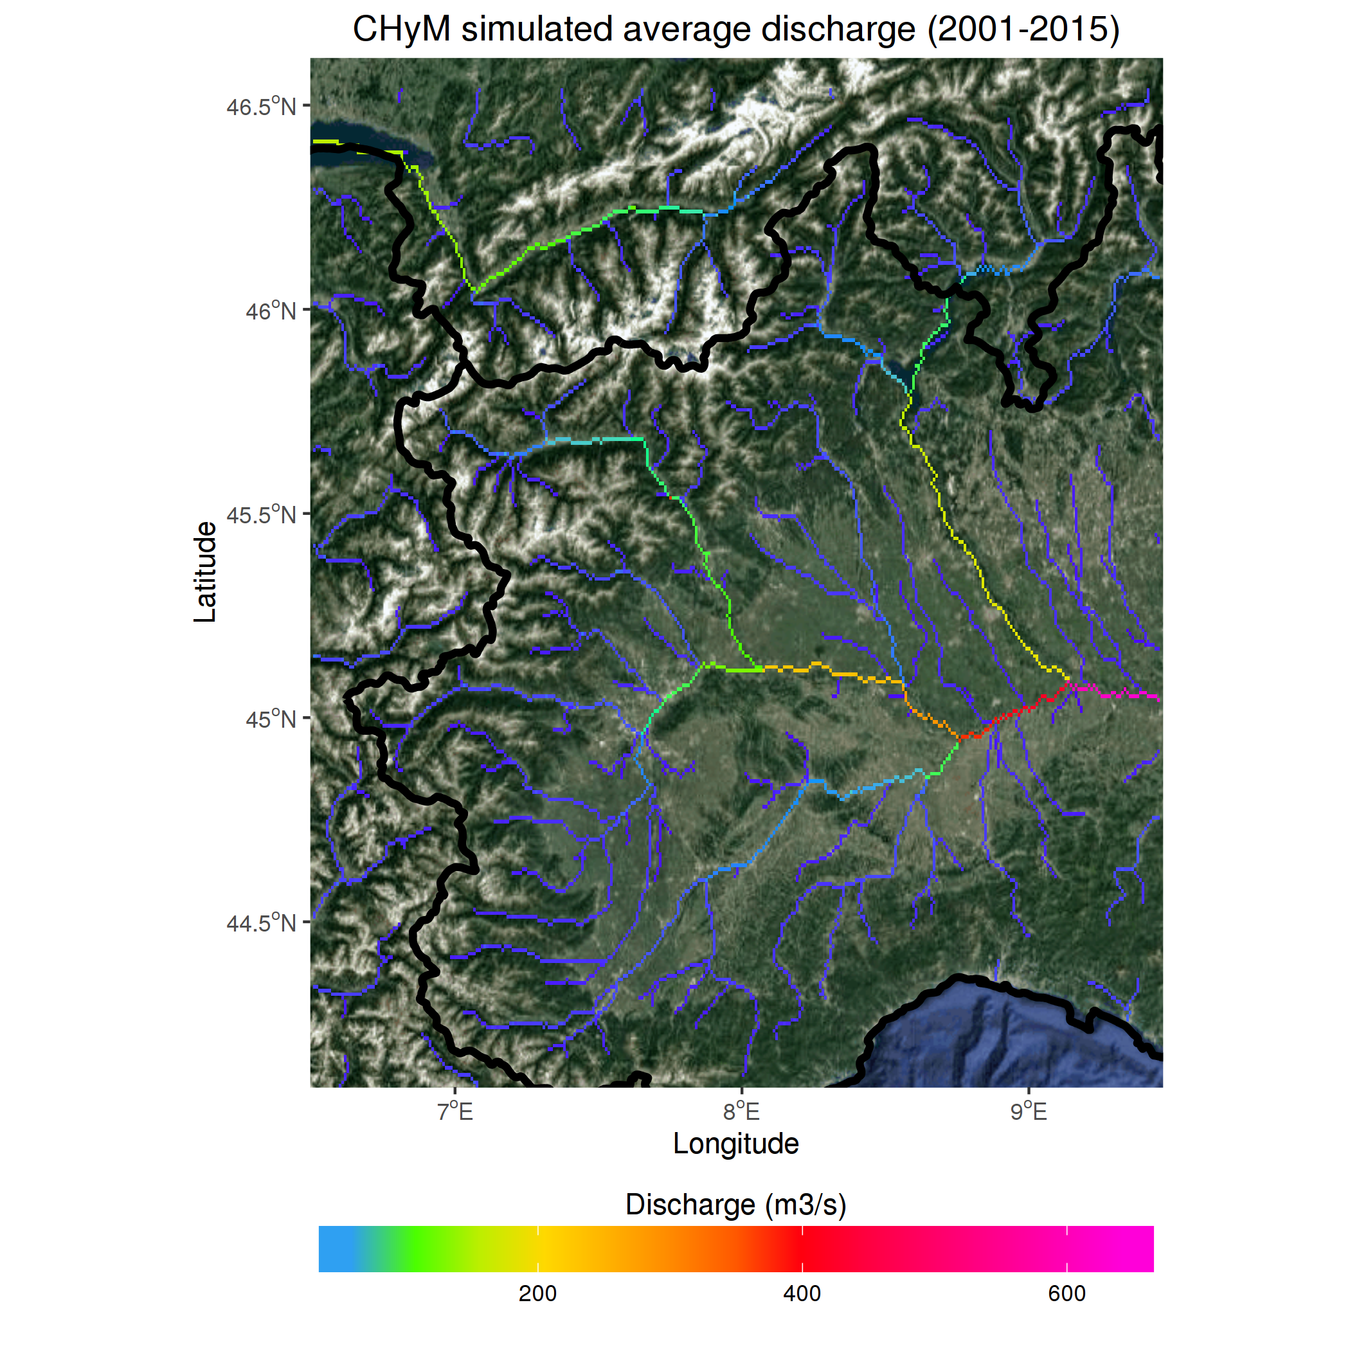
CHyM is a distributed (gridded) hydrological model from CETEMPS and University of L'Aquila.
- Model working on all test domains
- We can reproduce past results (Coppola et al. 2013) on our test domain (western Po basin)
- HR DEMs working (at low model res)
CETEMPS Hydrological Model
Model peculiarities:
- Can build DEM from various sources, smoothing by cellula automata algorithms
- Can use several kind of inputs, such as station observations, gridded model data, etc.
- Designed to work on any domain
- NetCDF output
CETEMPS Hydrological Model
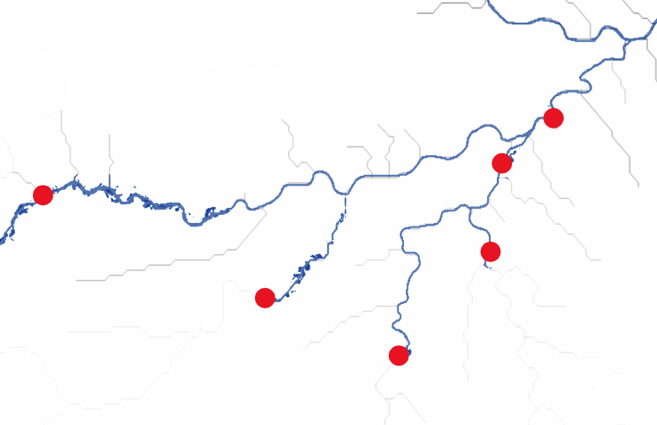
CHyM-OP reproduced domains:
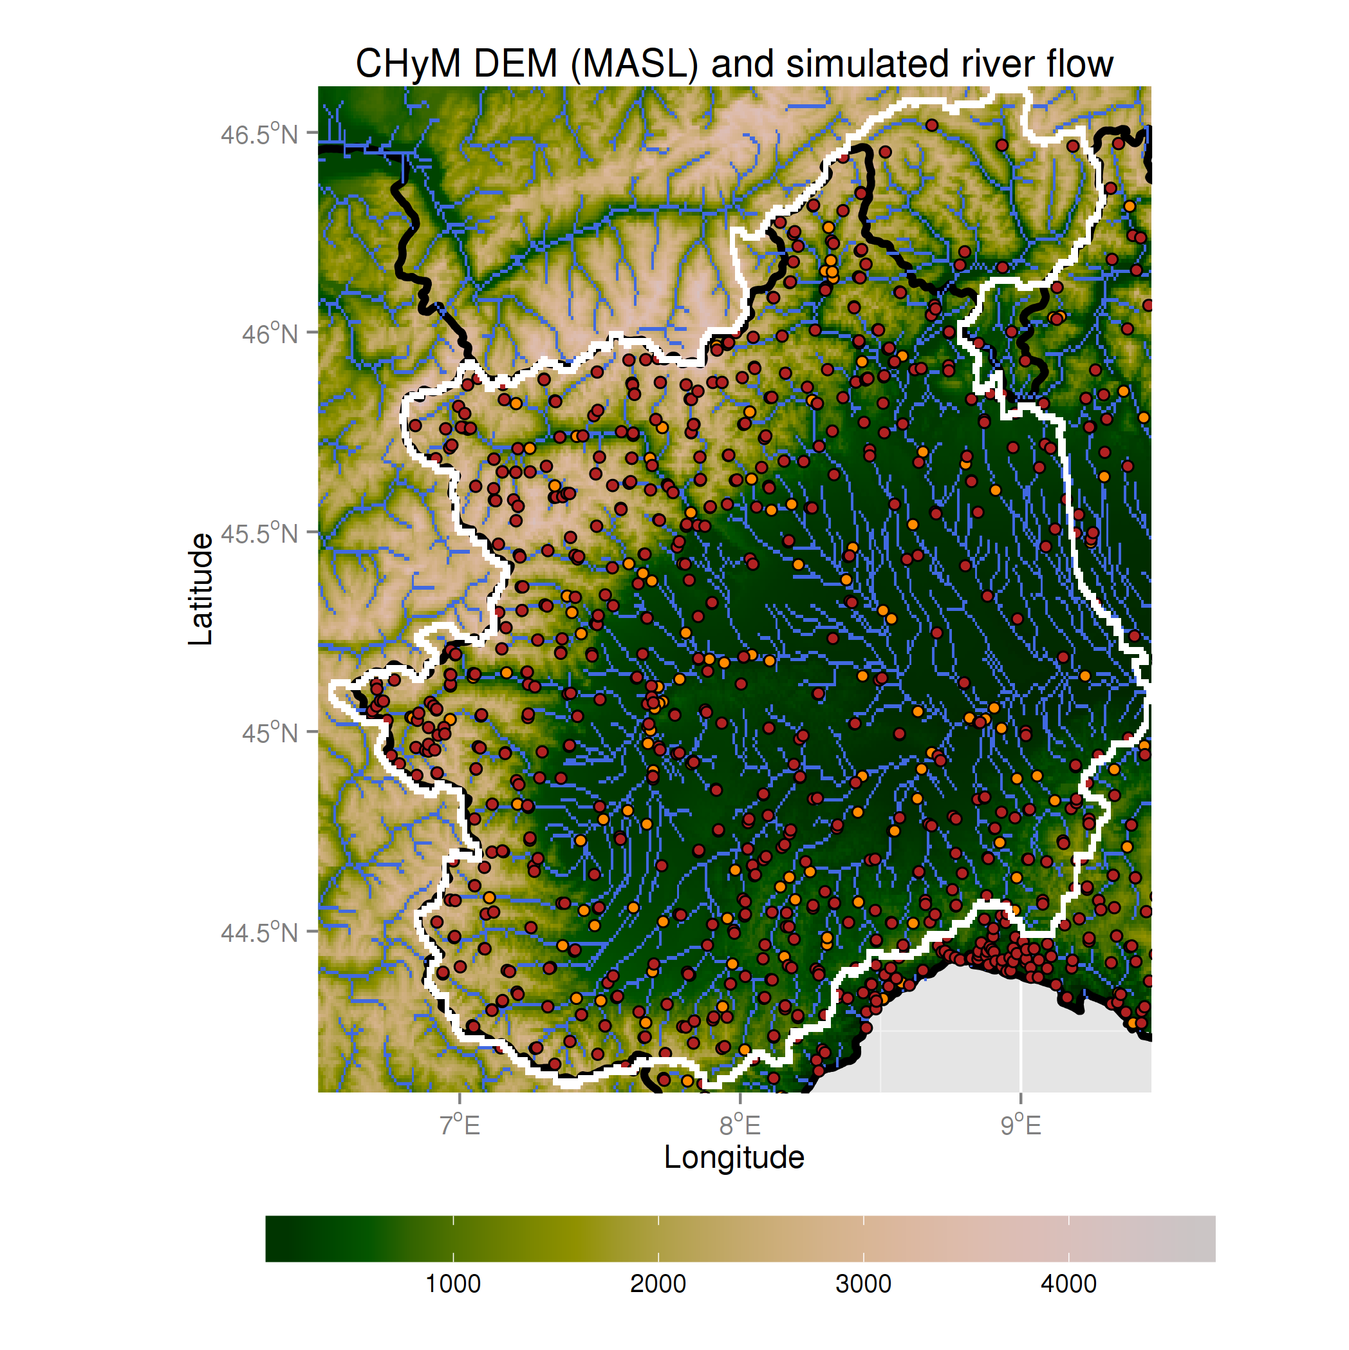
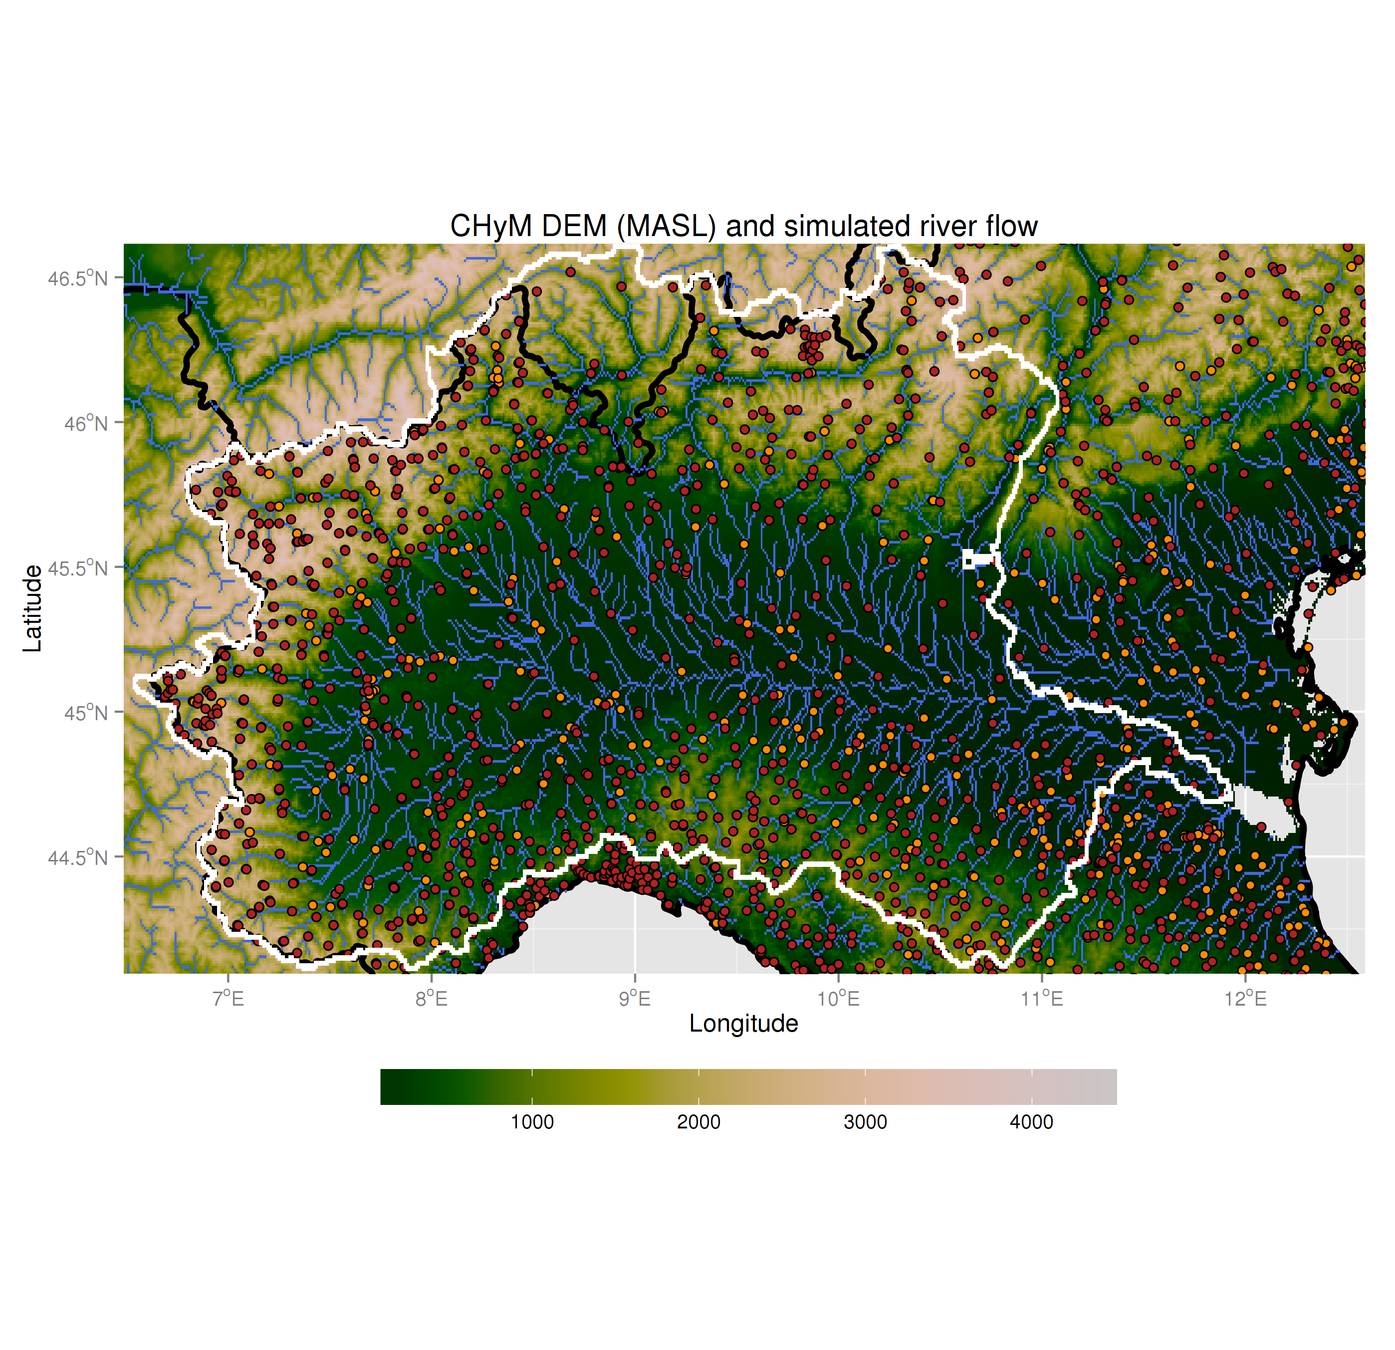
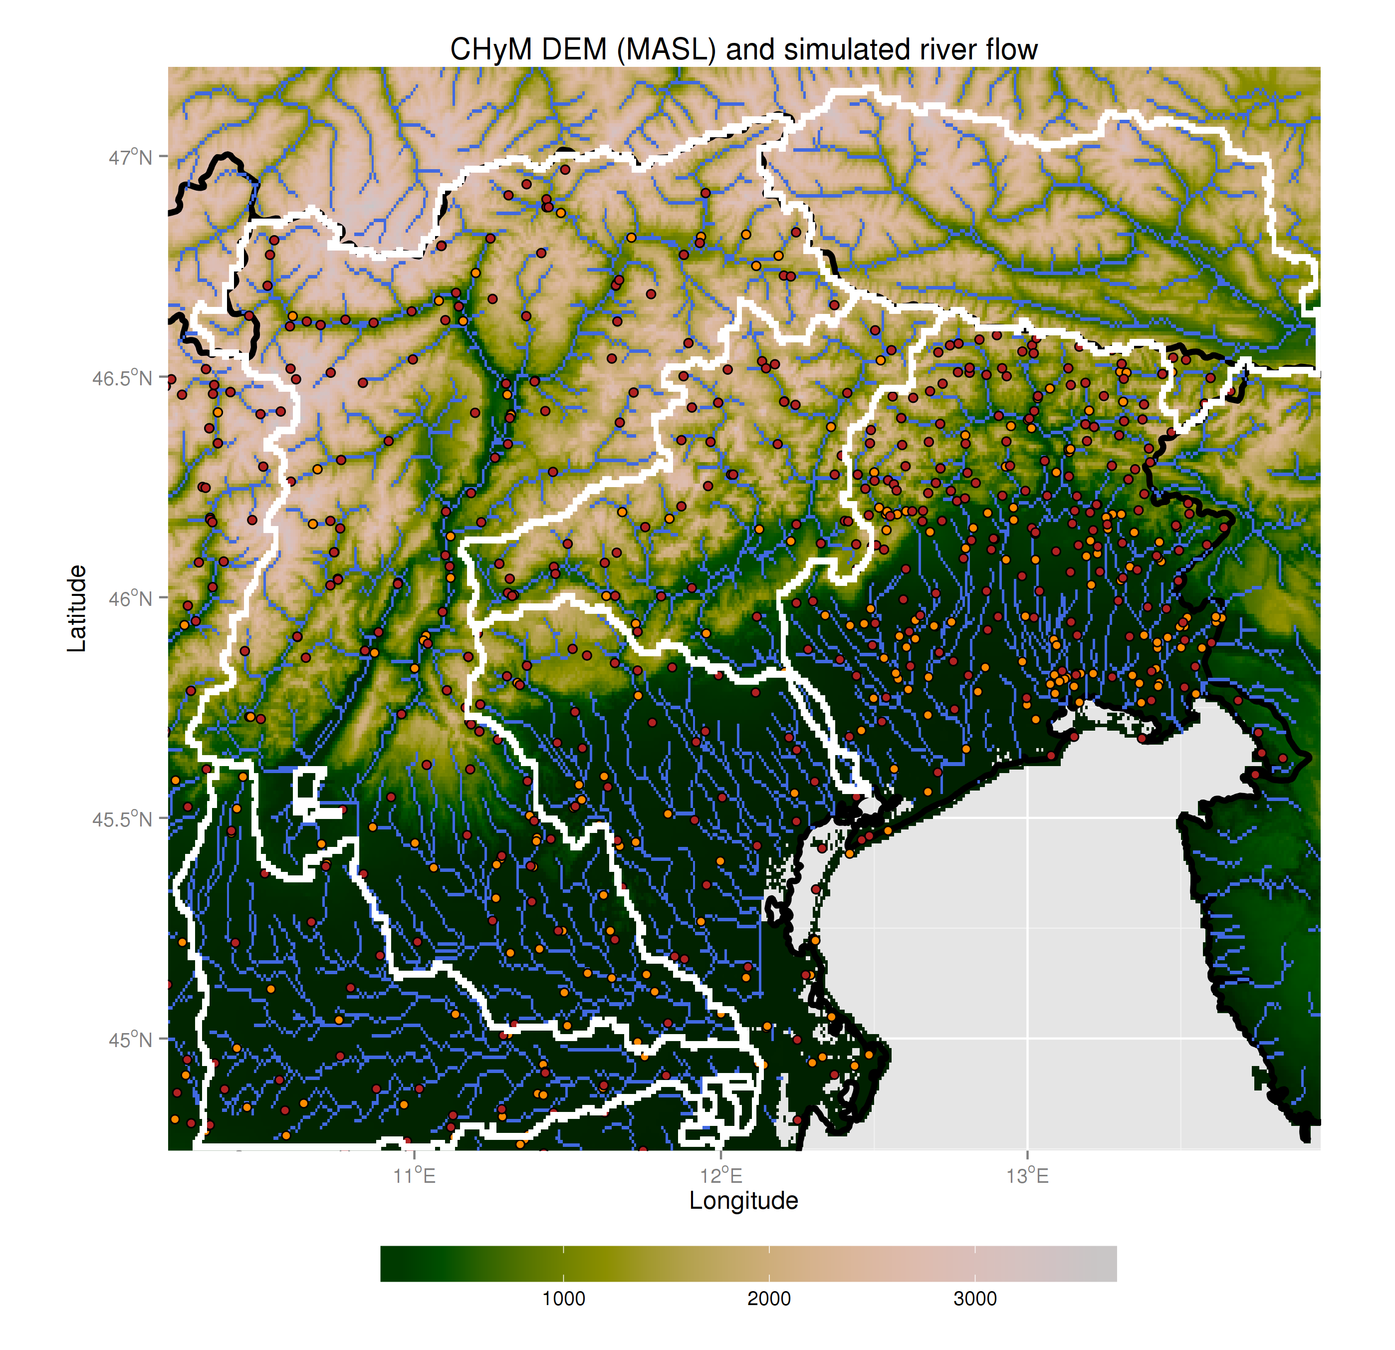
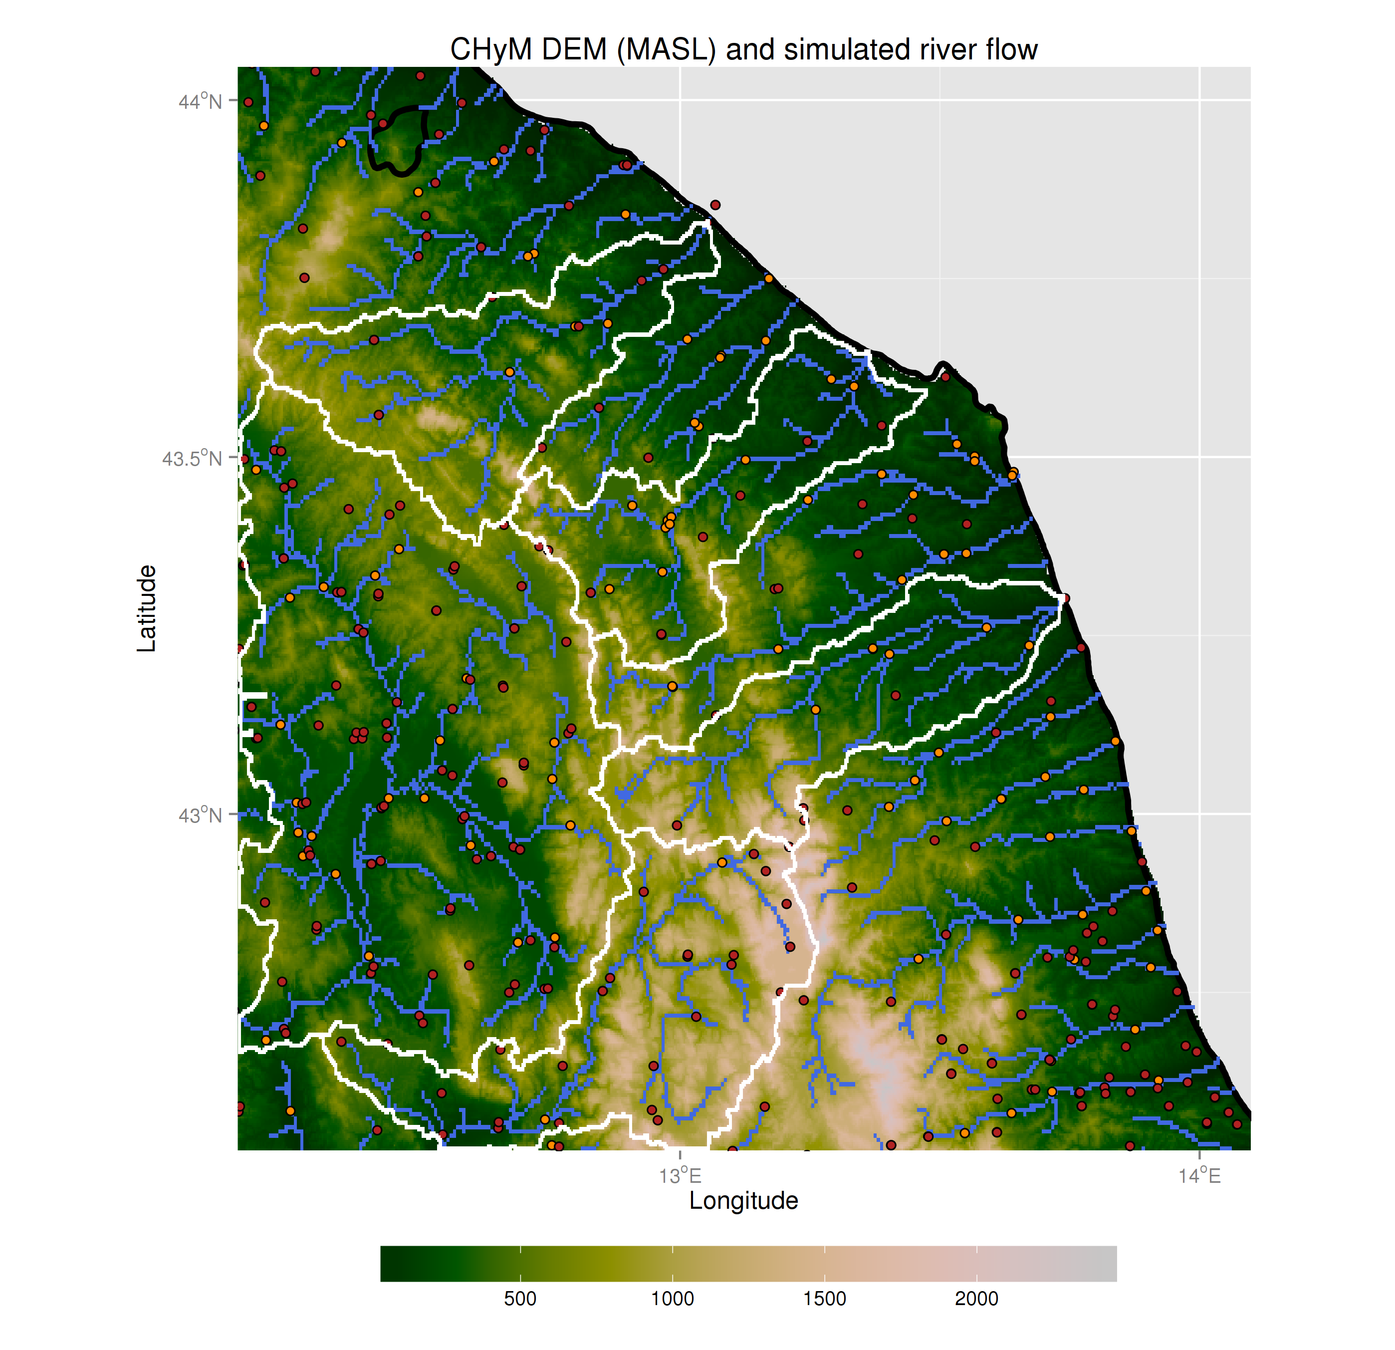
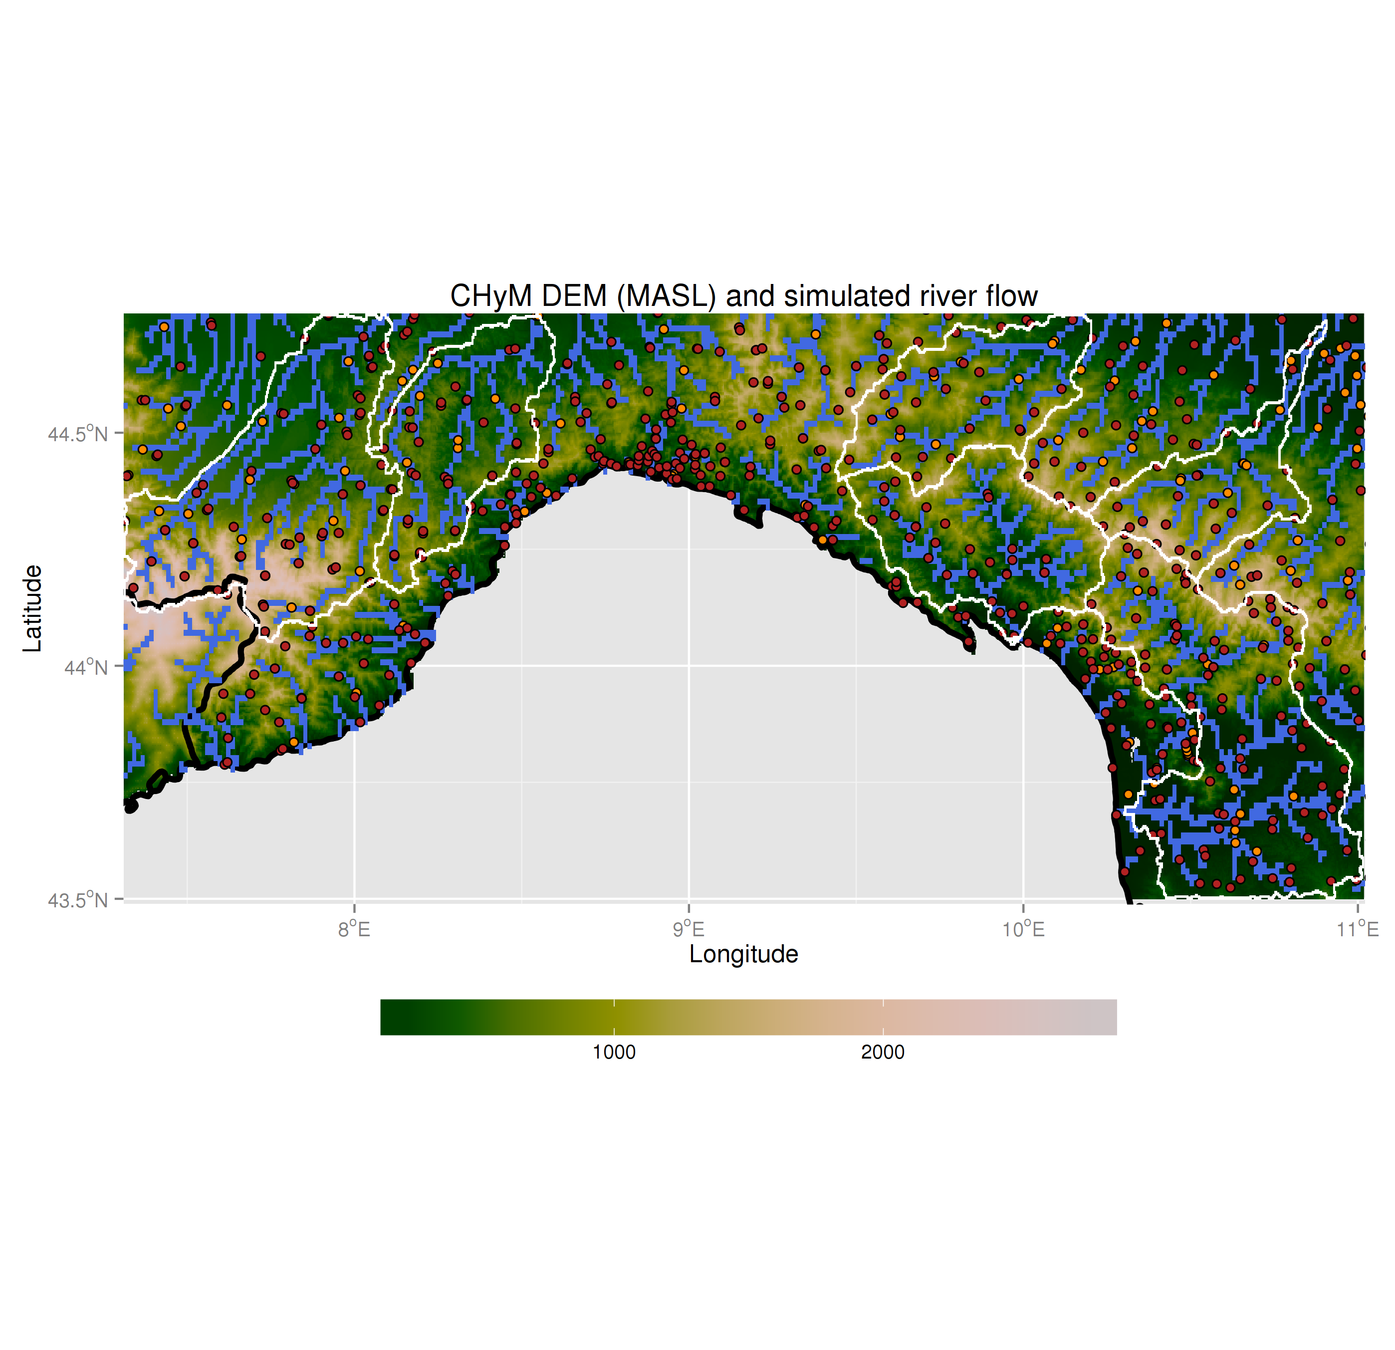
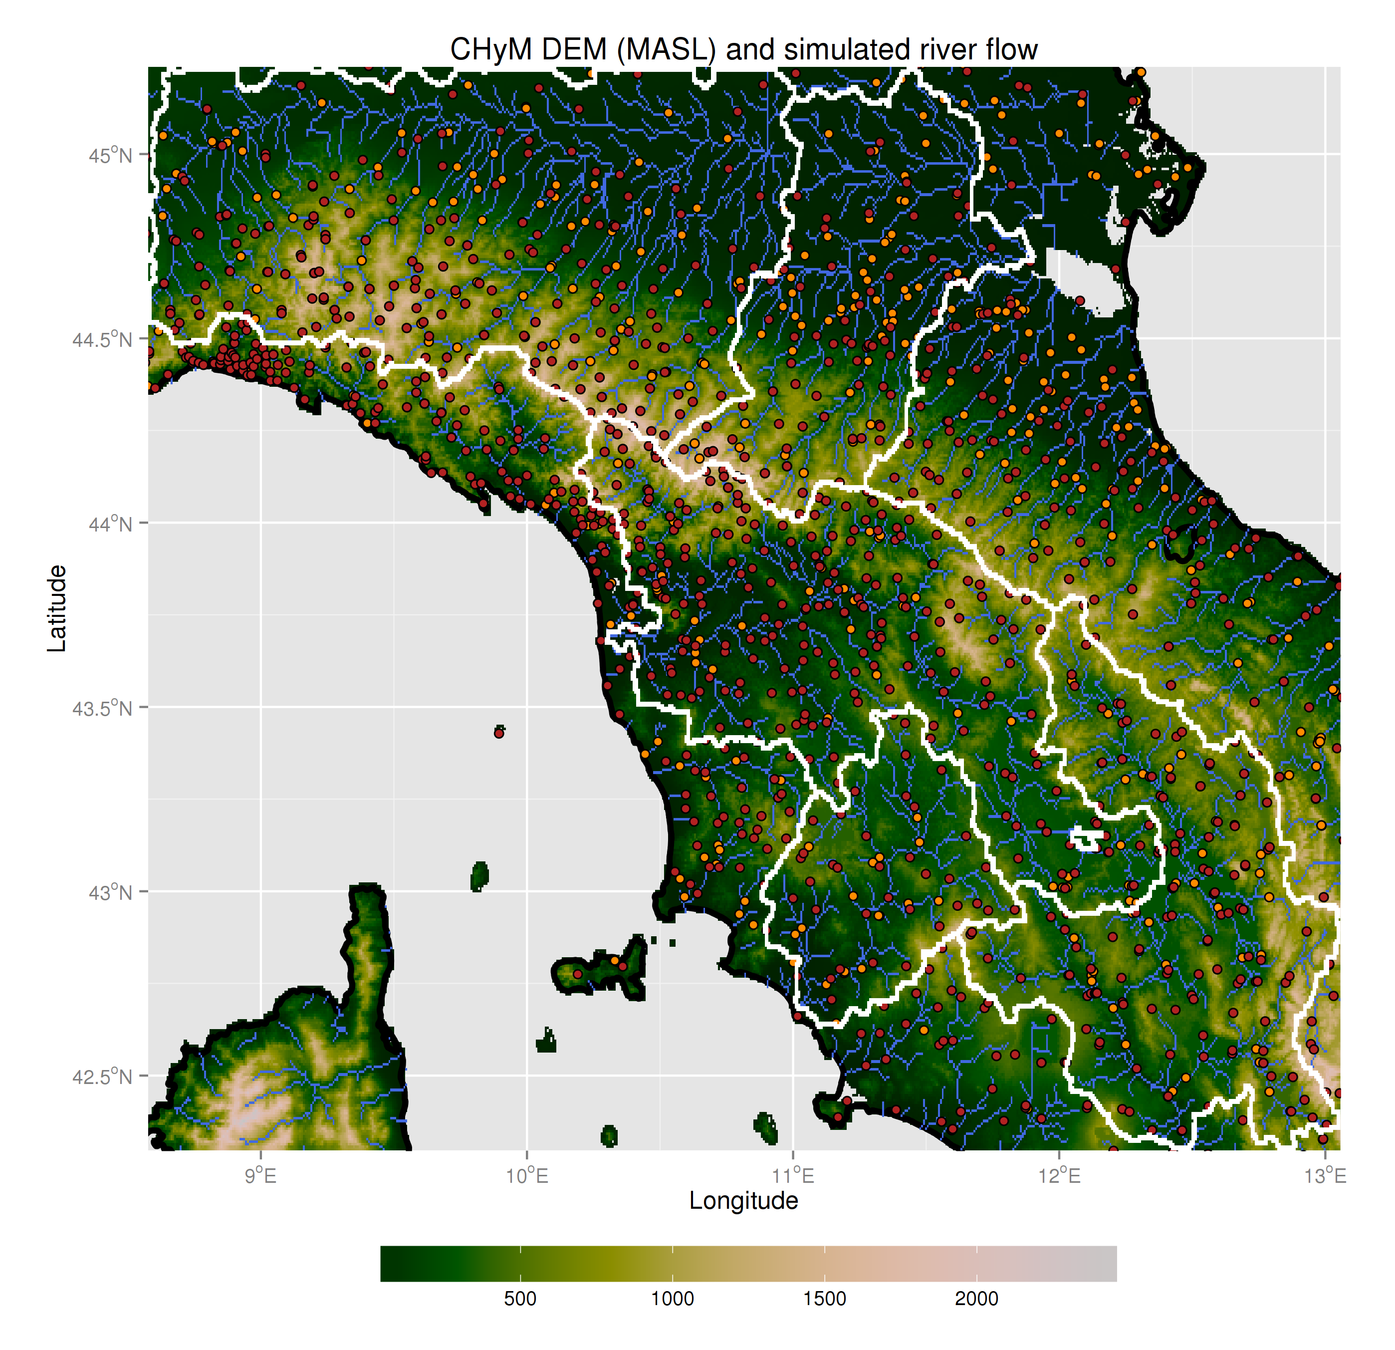
CETEMPS Hydrological Model
CHyM-OP reproduced domains:
Statistics
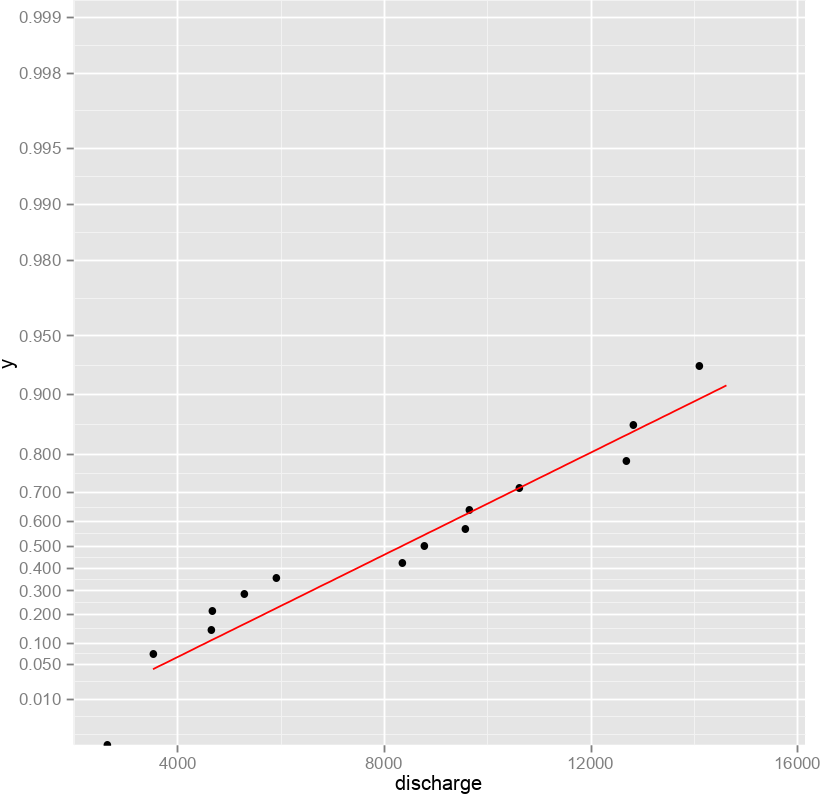
How to estimate hundred-years floods with only a few (~20) years worth of data?
The methodology is taken from Maione et al., 2003
Annual maxima
Gumbel extreme value distribution
Fit parameters
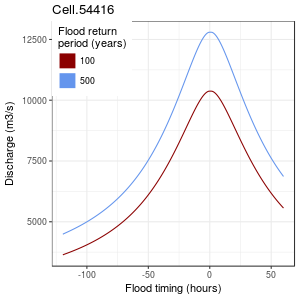
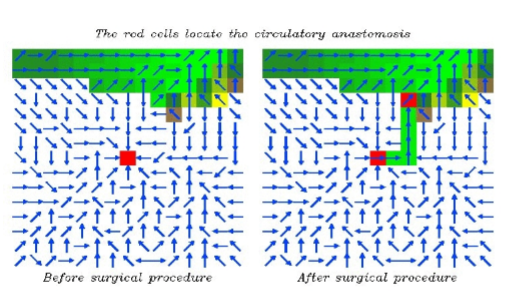
SDH: "Typical" flood timing curve for each river cell
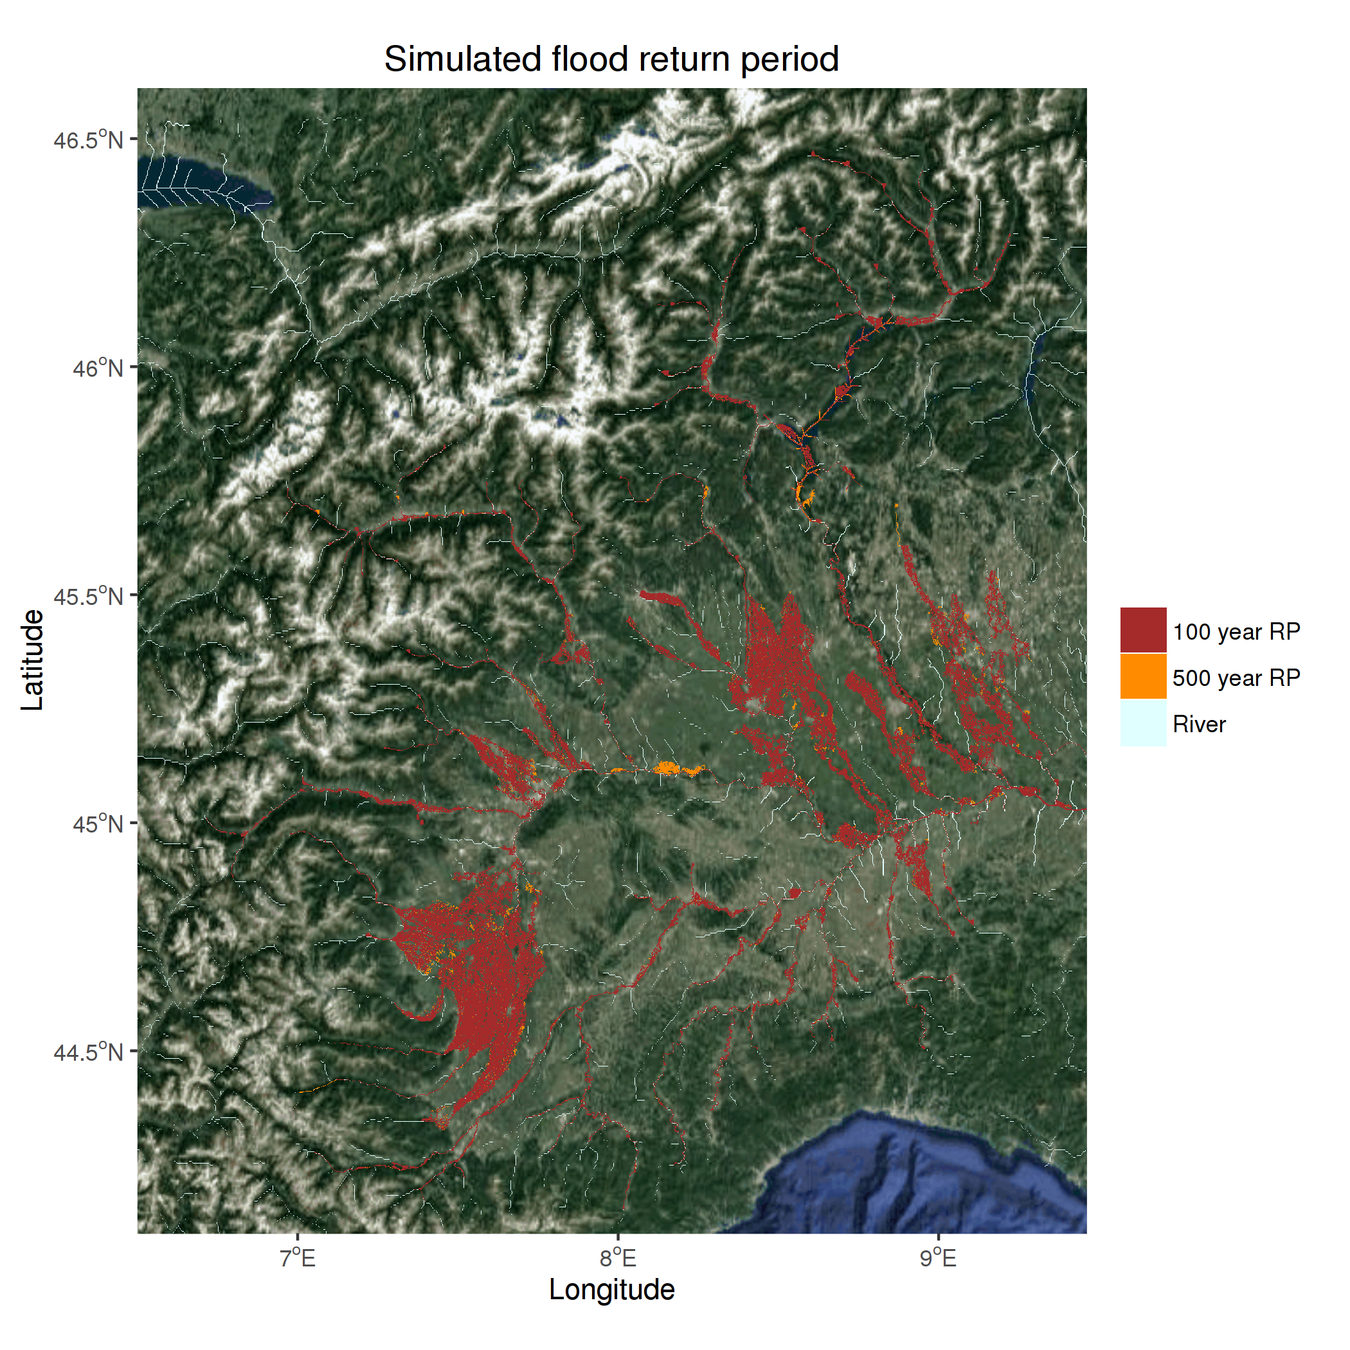
LISFLOOD-FP input data
LISFLOOD-FP hydraulic model
Widely-used flood inundation model from the University of Bristol (Bates et al., 2010)
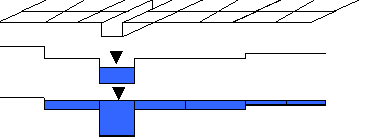
- DEM
- D4 River network
- SDH
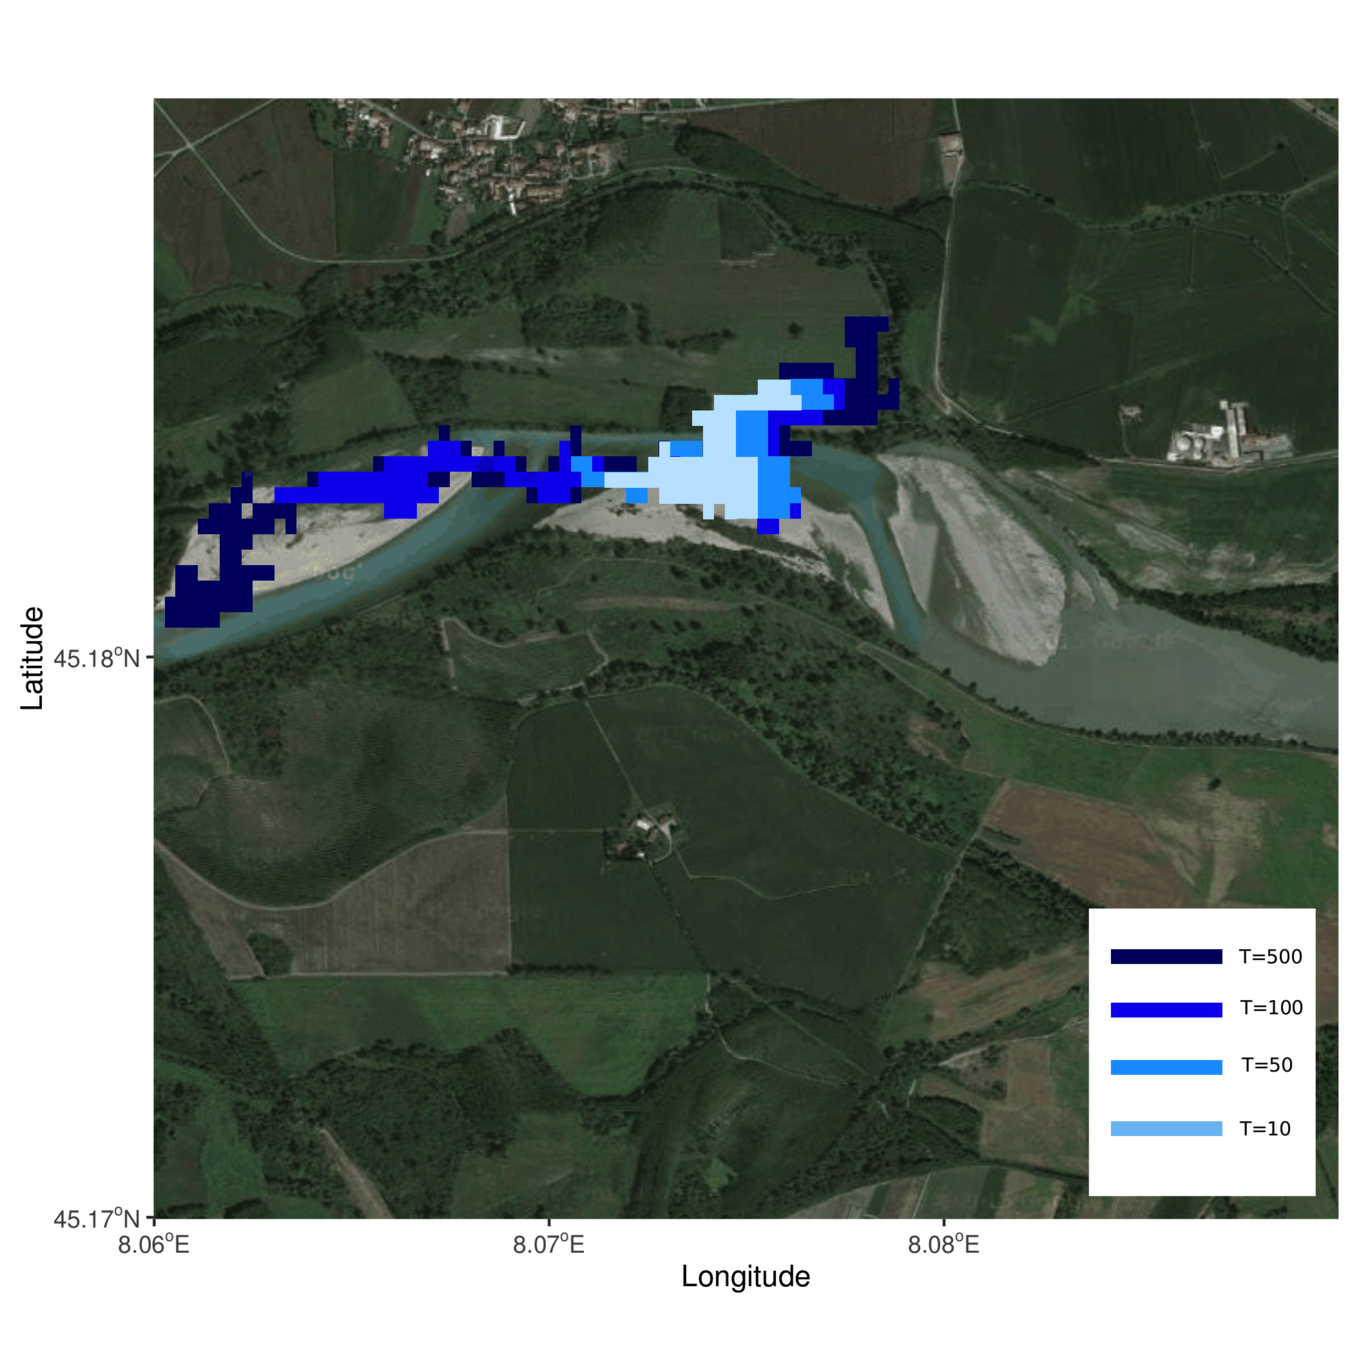
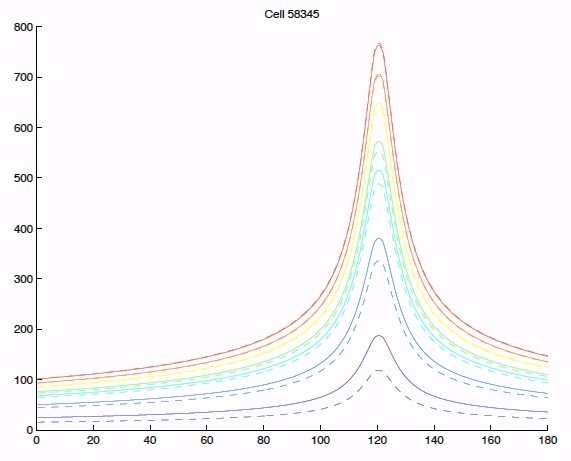
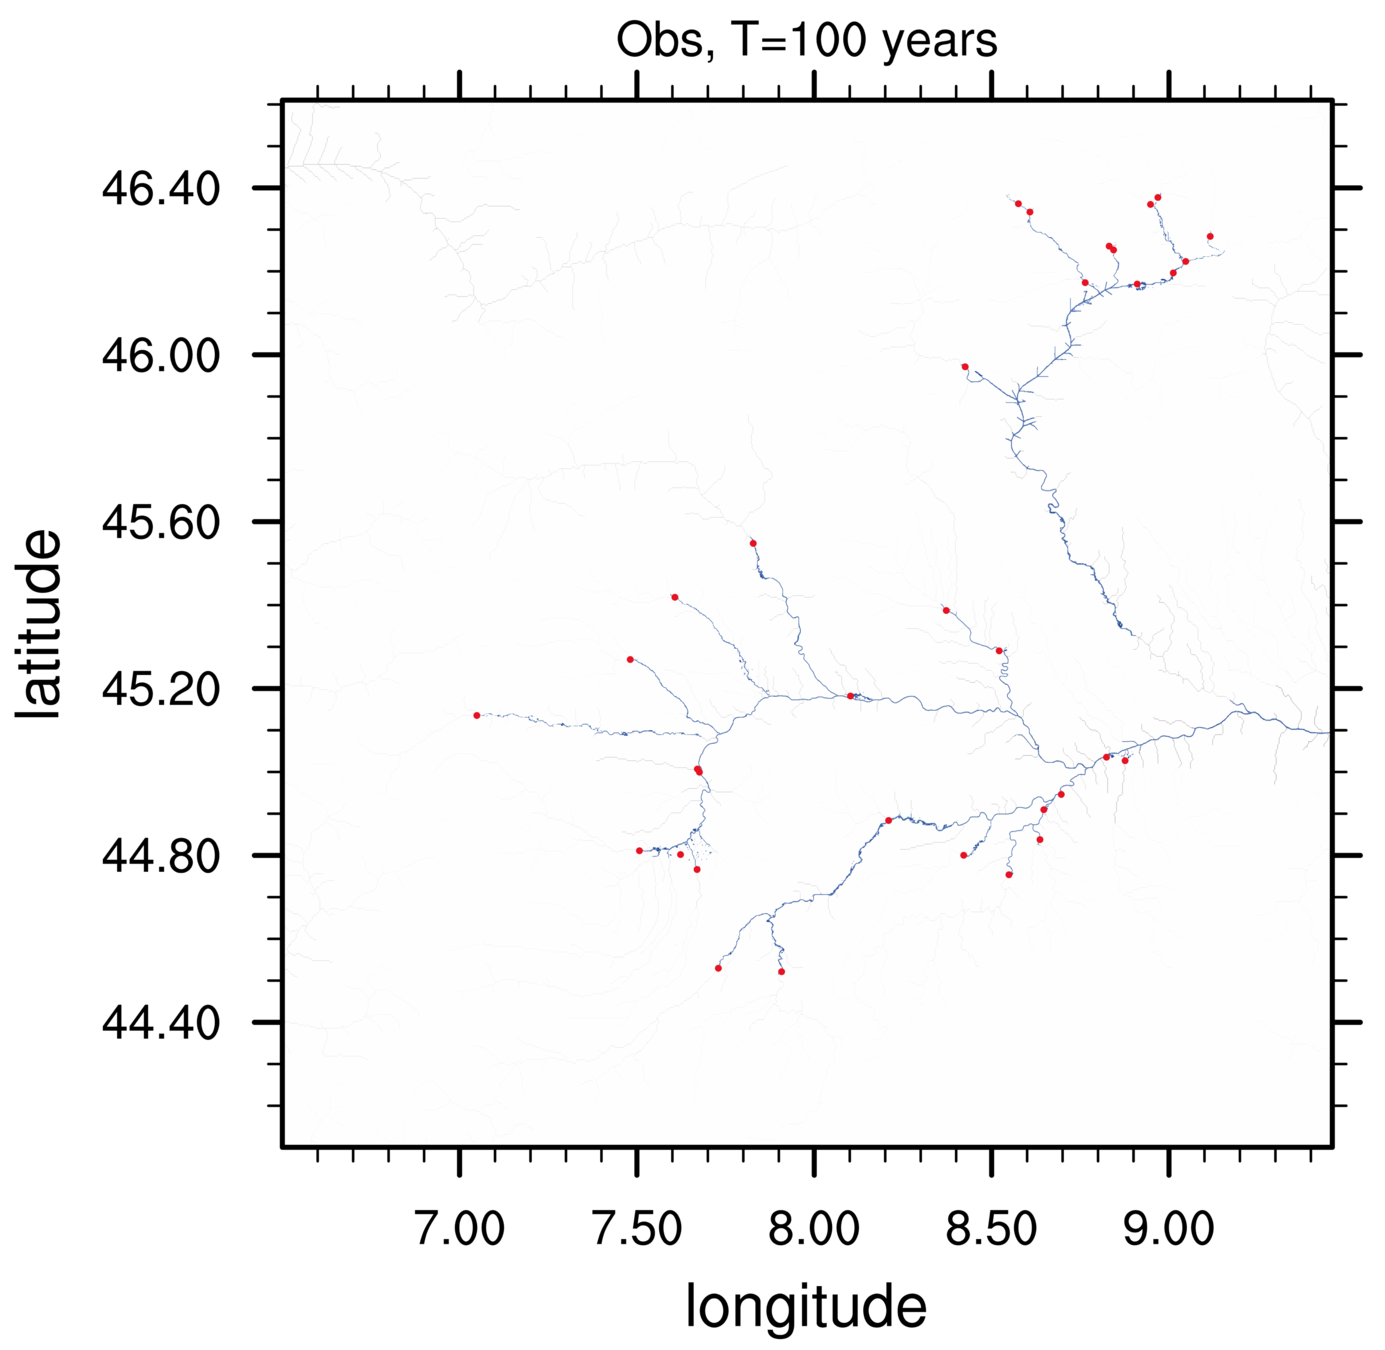
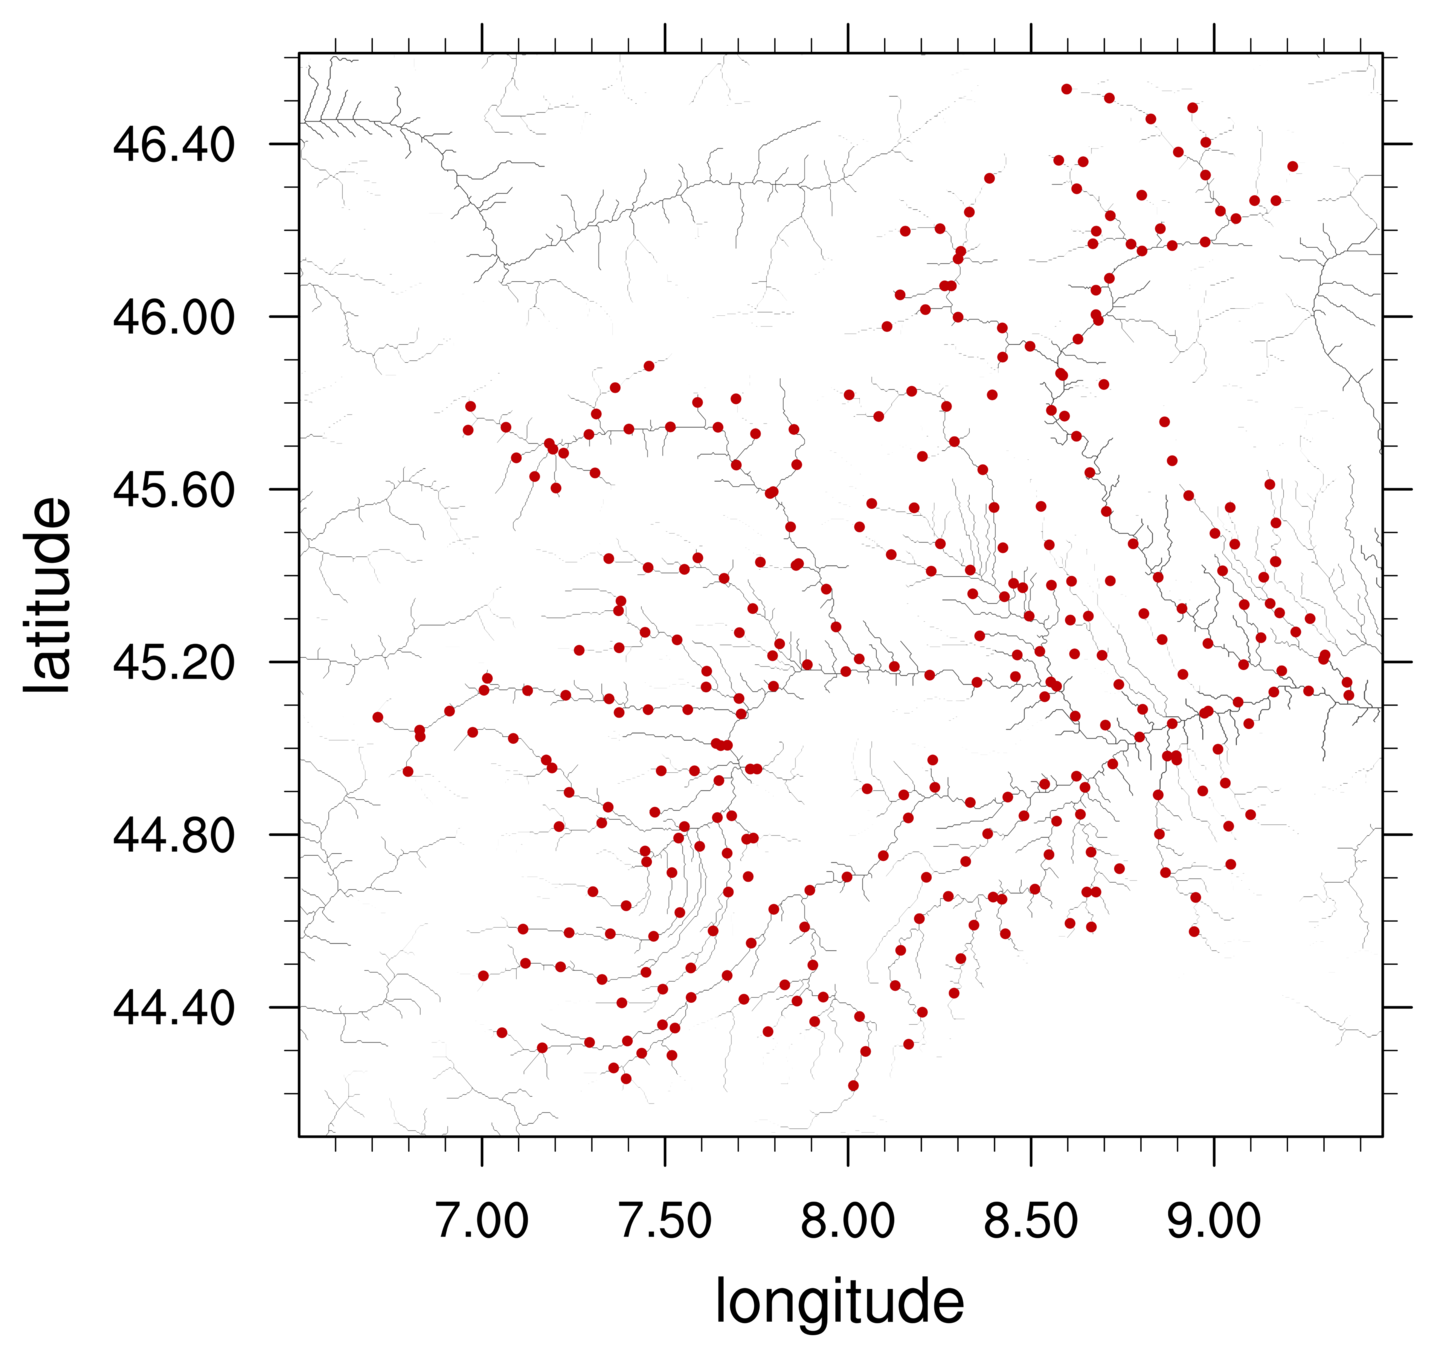
SDH:
observed
CHyM
Real stations
CHyM stations
NO FLOOD!
Thank you for listening!
Precipitation:
- Observations
- RCM output
Gridded netCDF:
- River network
- Discharges
hydrological model
For each RP, cell:
- Gumbel distr
- Hydrographs
Statistical RP analysis
LISFLOOD-FP model
For each RP, cell:
- Flood extent
- Flood depth
(multiple simulations)
- RCM output
- Discharges
- Past floods
Validation for
?
afantini@ictp.it
Hydrological station-based observations and flood risk modelling over Italy
By odineidolon
Hydrological station-based observations and flood risk modelling over Italy
Presentation HyMeX workshop 2017, BARCELONA, 12+3min


