First steps in flood risk assessment over Italy in a climate change scenario
Adriano Fantini
1st year PhD Course in Earth Science, Fluid Dynamics, and Mathematics
Supervisor: Erika Coppola
ADRIANO.FANTINI@phd.units.it
Aims
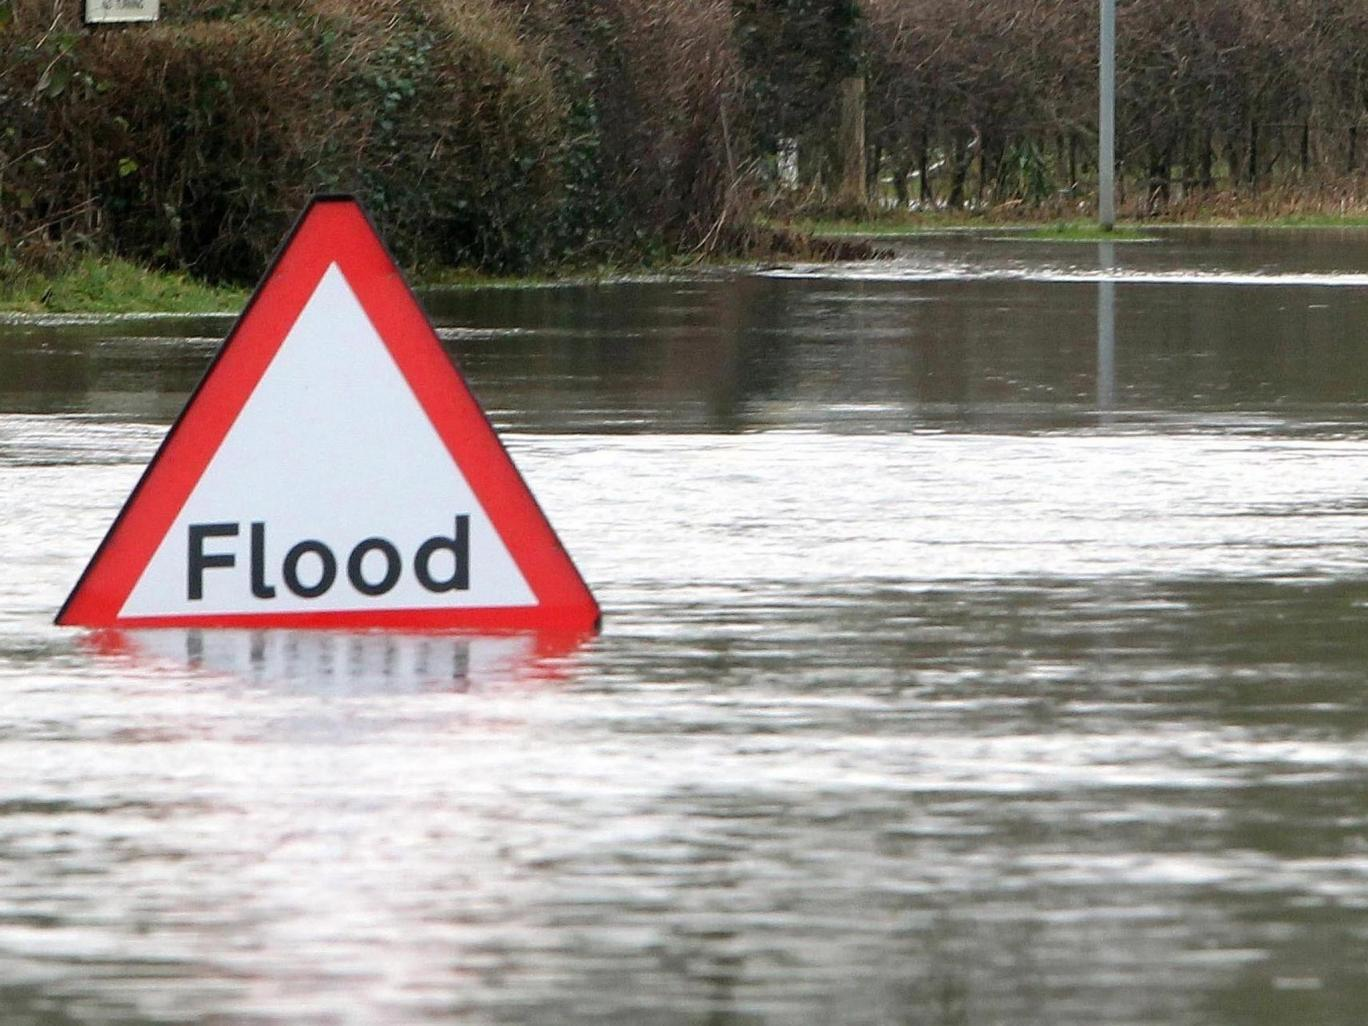
- Flood risk mapping over Italy
- scientific, reliable approach
- future projections
Models
- ICTP RegCM and other Regional Climate Models
- CHyM hydrological model
- LISFLOOD-FP hydraulic model
Project overview
Participants
- Erika Coppola
- Rita Nogherotto
- Filippo Giorgi
- Adriano Fantini
- Francesca Raffaele
Methodology
Precipitation:
- Observations
- RCM output
Gridded netCDF:
- River network
- Discharges
hydrological model

For each RP, cell:
- Gumbel distr
- Hydrographs
Statistical RP analysis

LISFLOOD-FP model
For each RP, cell:
- Flood extent
- Flood depth
(multiple simulations)
- RCM output
- Discharges
- Past floods
Validation for

1.0 - Observations
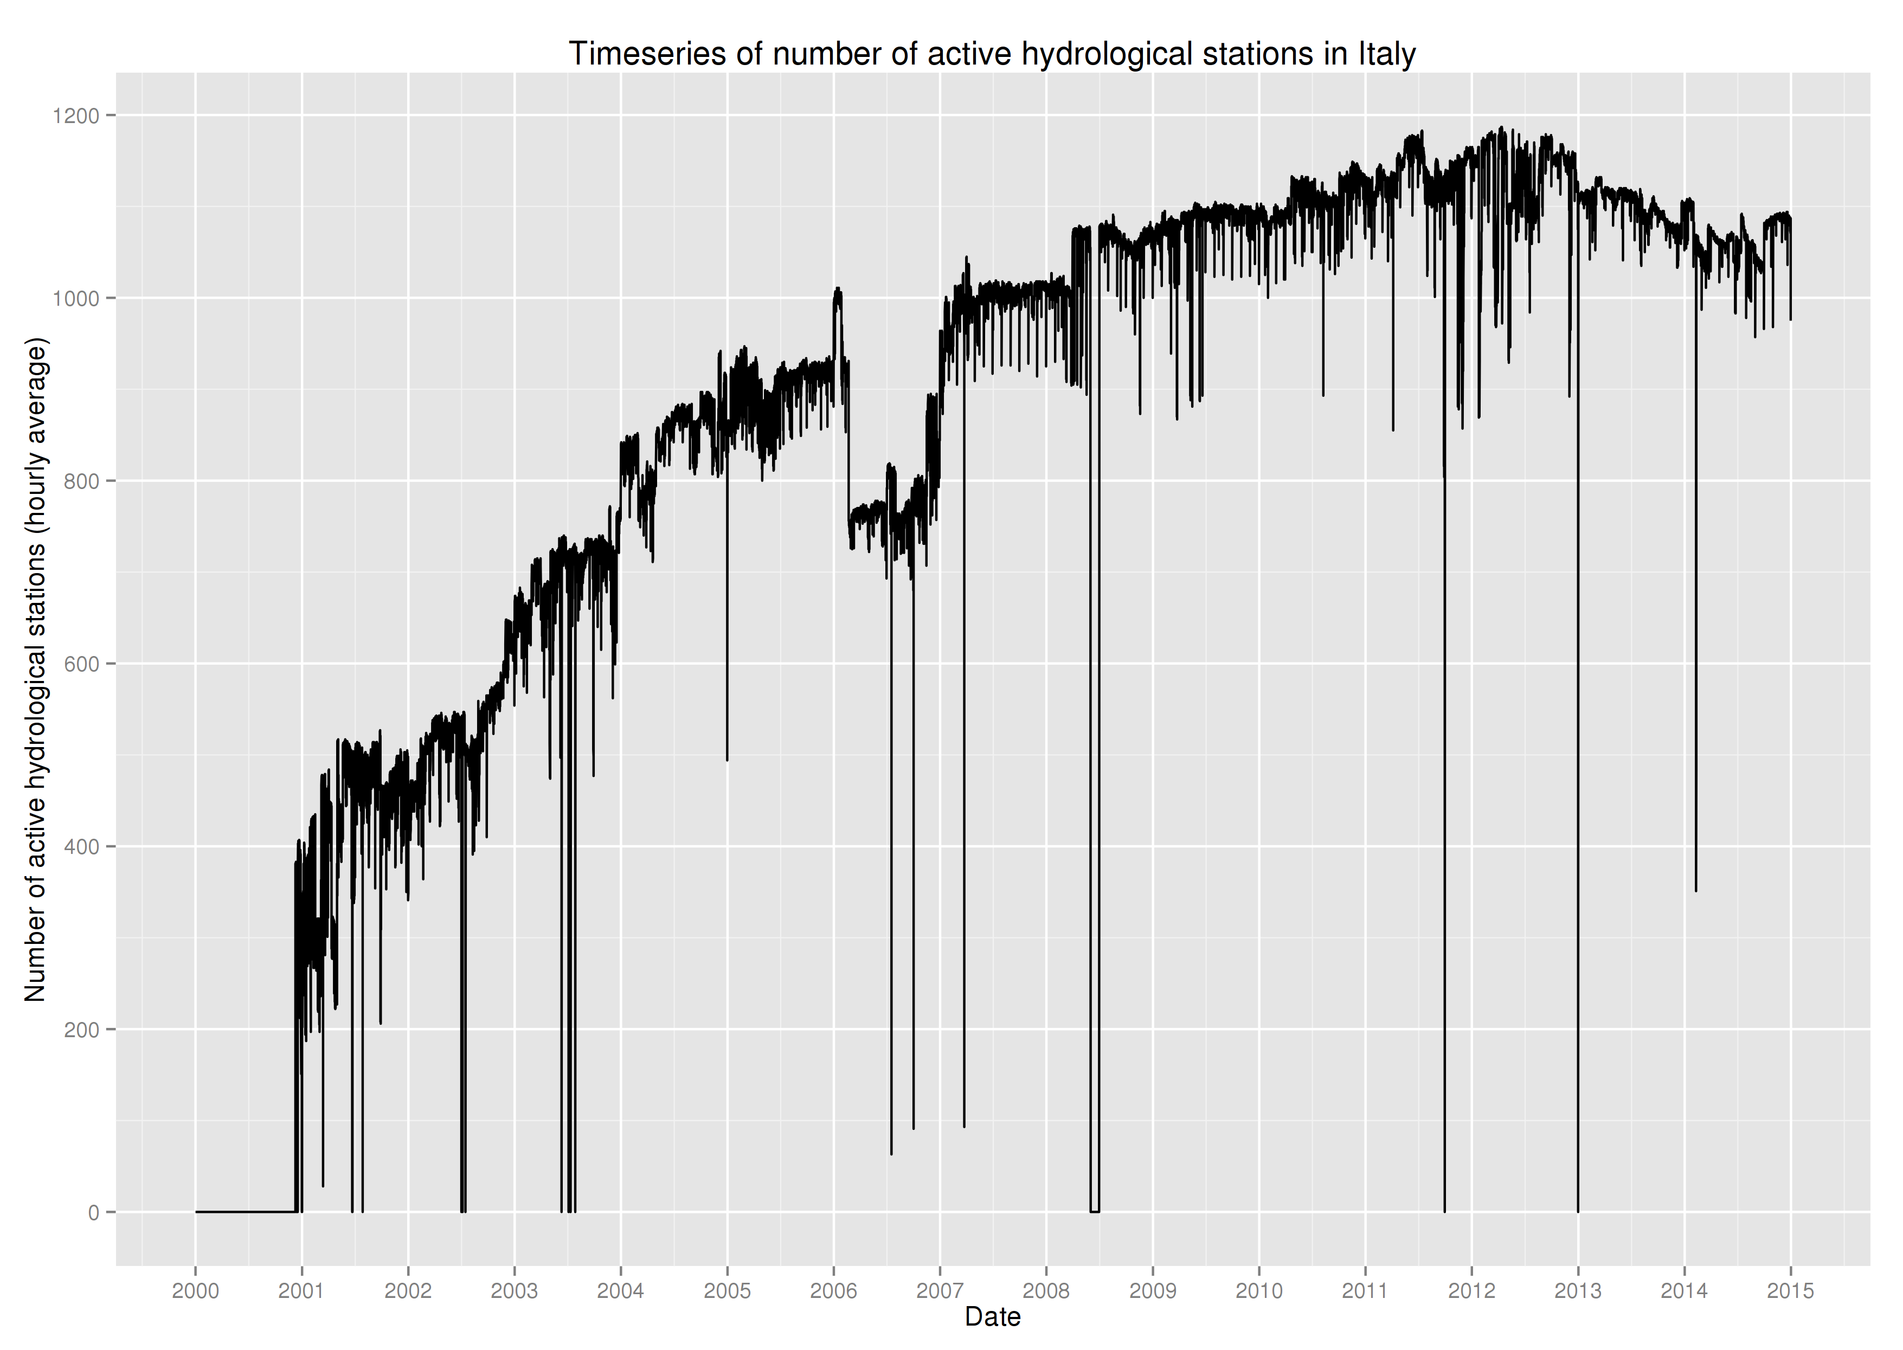
We have access to several Italian observational datasets provided by the University of L'Aquila for:
- temperature
- precipitation
- water level
- discharge
1.1 - Observations
Step 2 - identify station problems:
- short timescale
- shifts
- (out)liers
- errors
- breaks
- fill values
Step 1 - transform the (binary) station datasets in more useful (netCDF) files
Step 3 - fix problems, homogenize datasets, create gridded databases
1.2 - Observations
Some examples...
Outliers
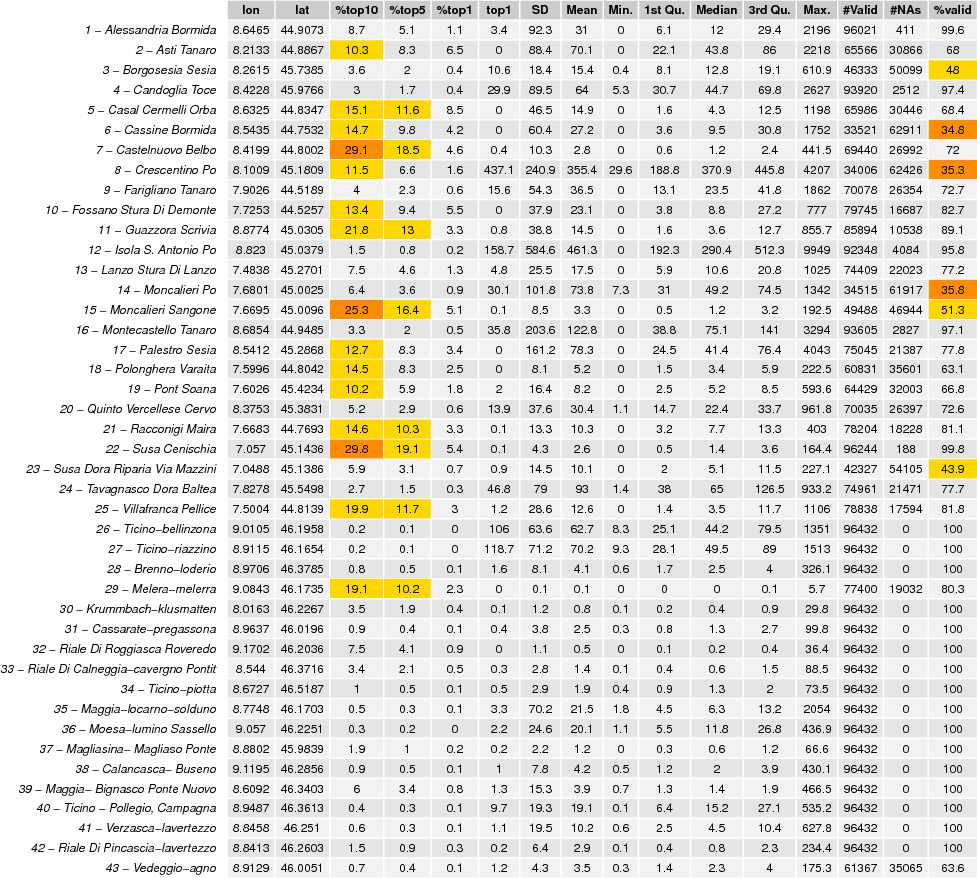
1.3 - Observations
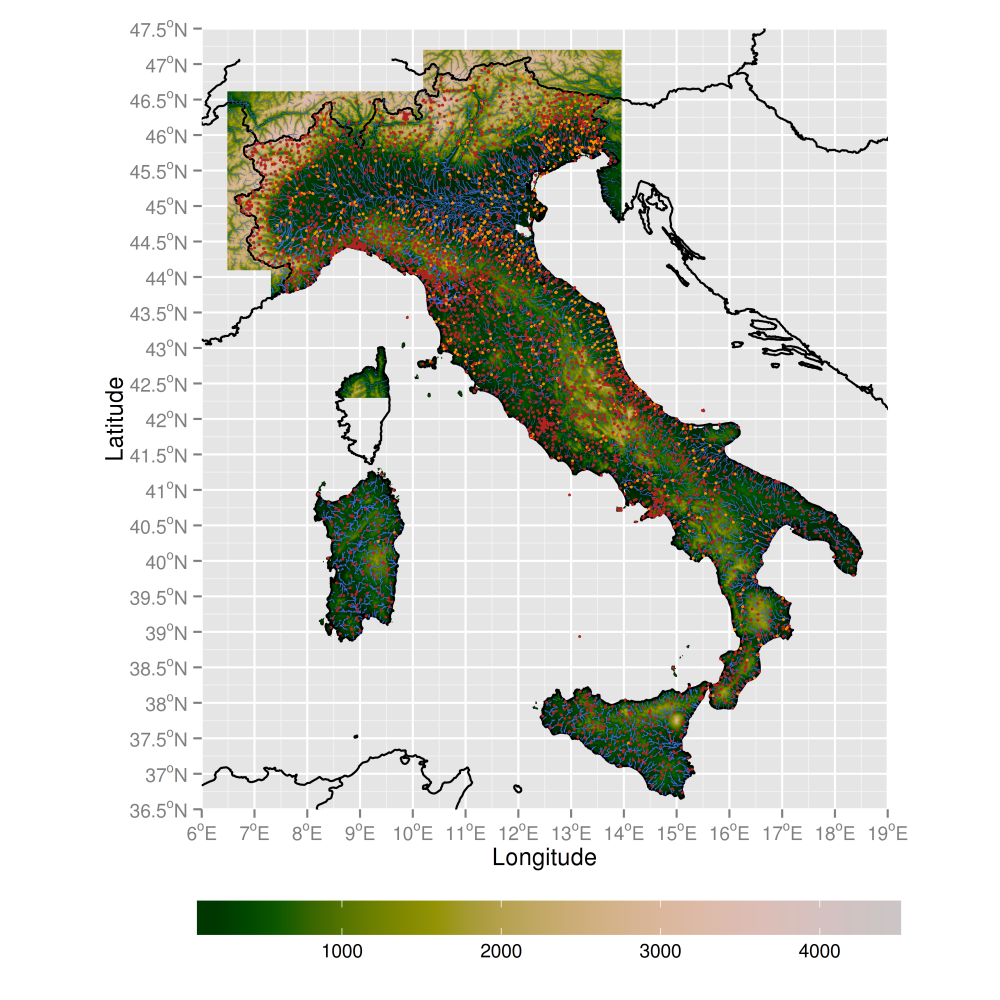
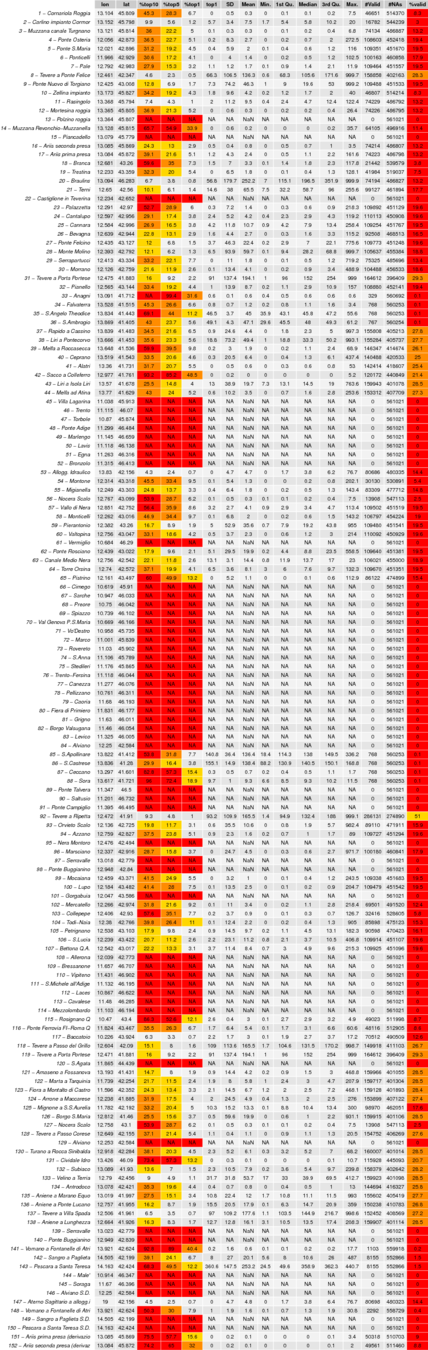
Po discharge database
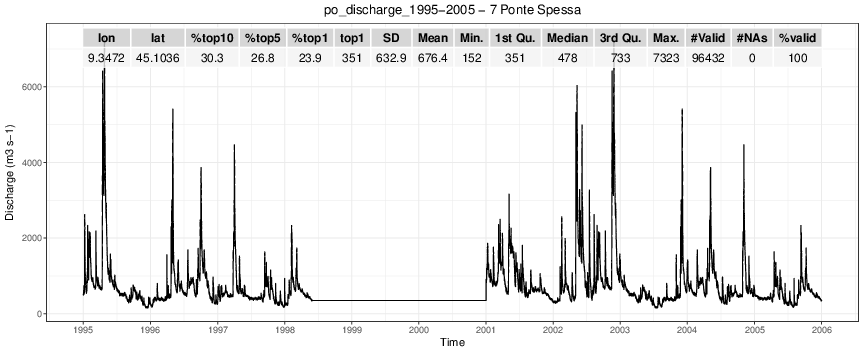
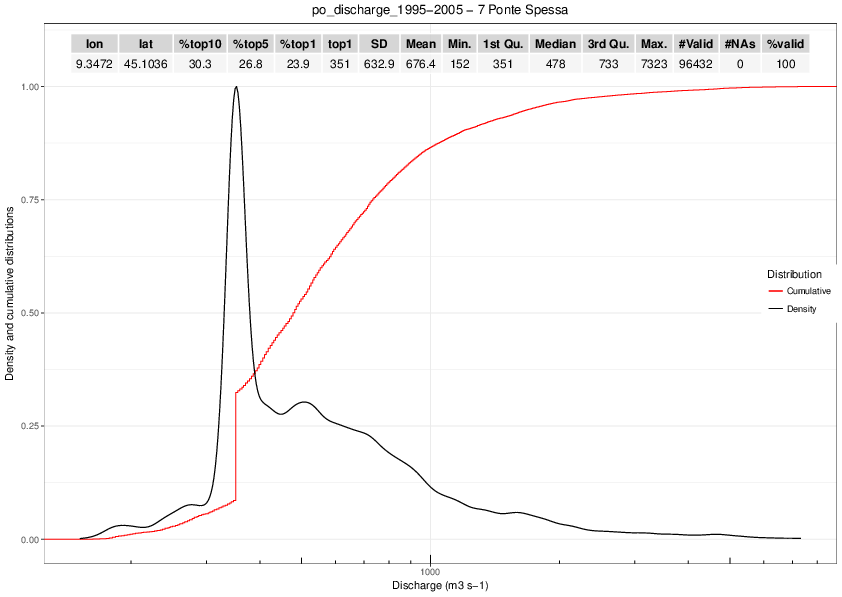
Fill constant
1.4 - Observations
Dewetra discharge database
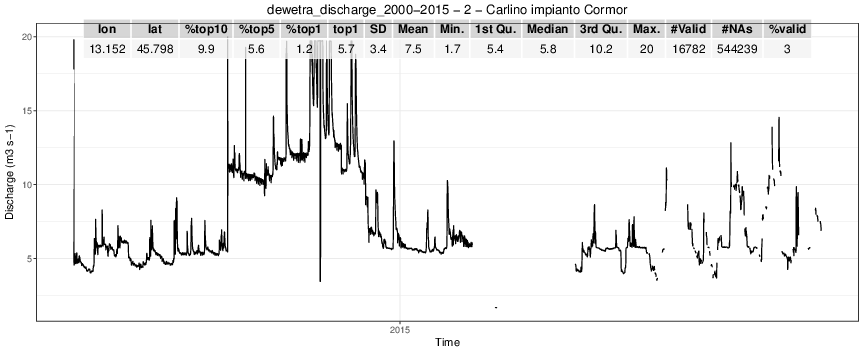
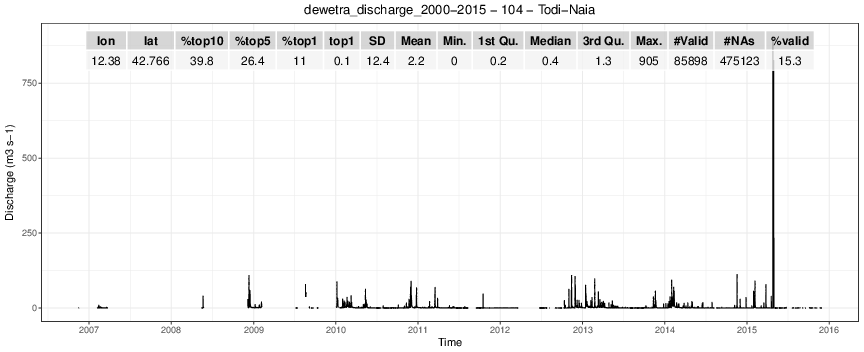
Break
Shifts
Outlier
1.5 - Observations
Dewetra waterlevel database
Short time scales for most stations
1.6 - Observations
Acqwapo discharge database
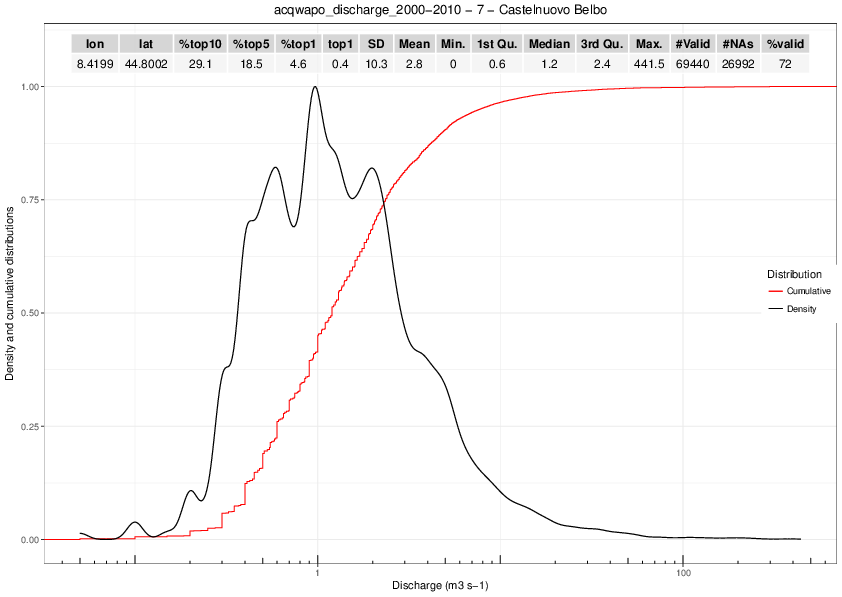
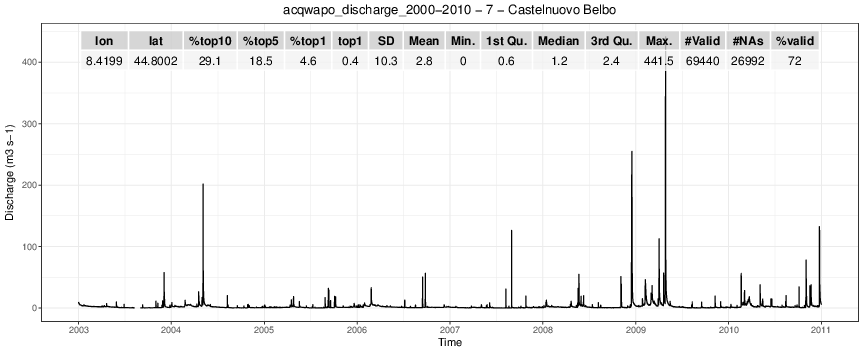
Quantization
2.0 - Regional Climate Models
RCMs will be used later in the project to provide gridded input data to the CHyM hydrological model for future projections under climate change scenarios
I have obtained experience with:
- Data analysis of 9 CORDEX RCMs against 9 high resolution European observational datasets (Fantini et al. 2016)
- Model tuning of the RegCM4.6 model
- RegCM4.6 performance assessment with different clusters (Argo, CINECA-Marconi A1/A2)
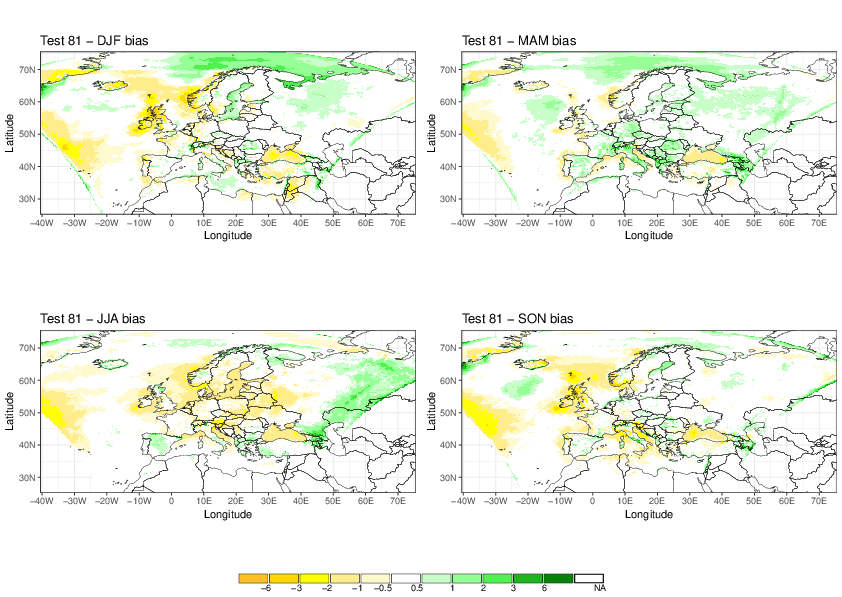
2.1 - Regional Climate Models
We have assessed the performance of 9 RCMs over 9 regions for precipitation:
- High resolution observations
- Several metrics, with focus on extreme precipitation
- We found consistent added value in higher-resolution modelling (12km vs 50km) for most regions and most models
2.2 - Regional Climate Models
I performed more than 100 model simulations over the EURO-CORDEX domain in both Argo and CINECA's Marconi A1/A2
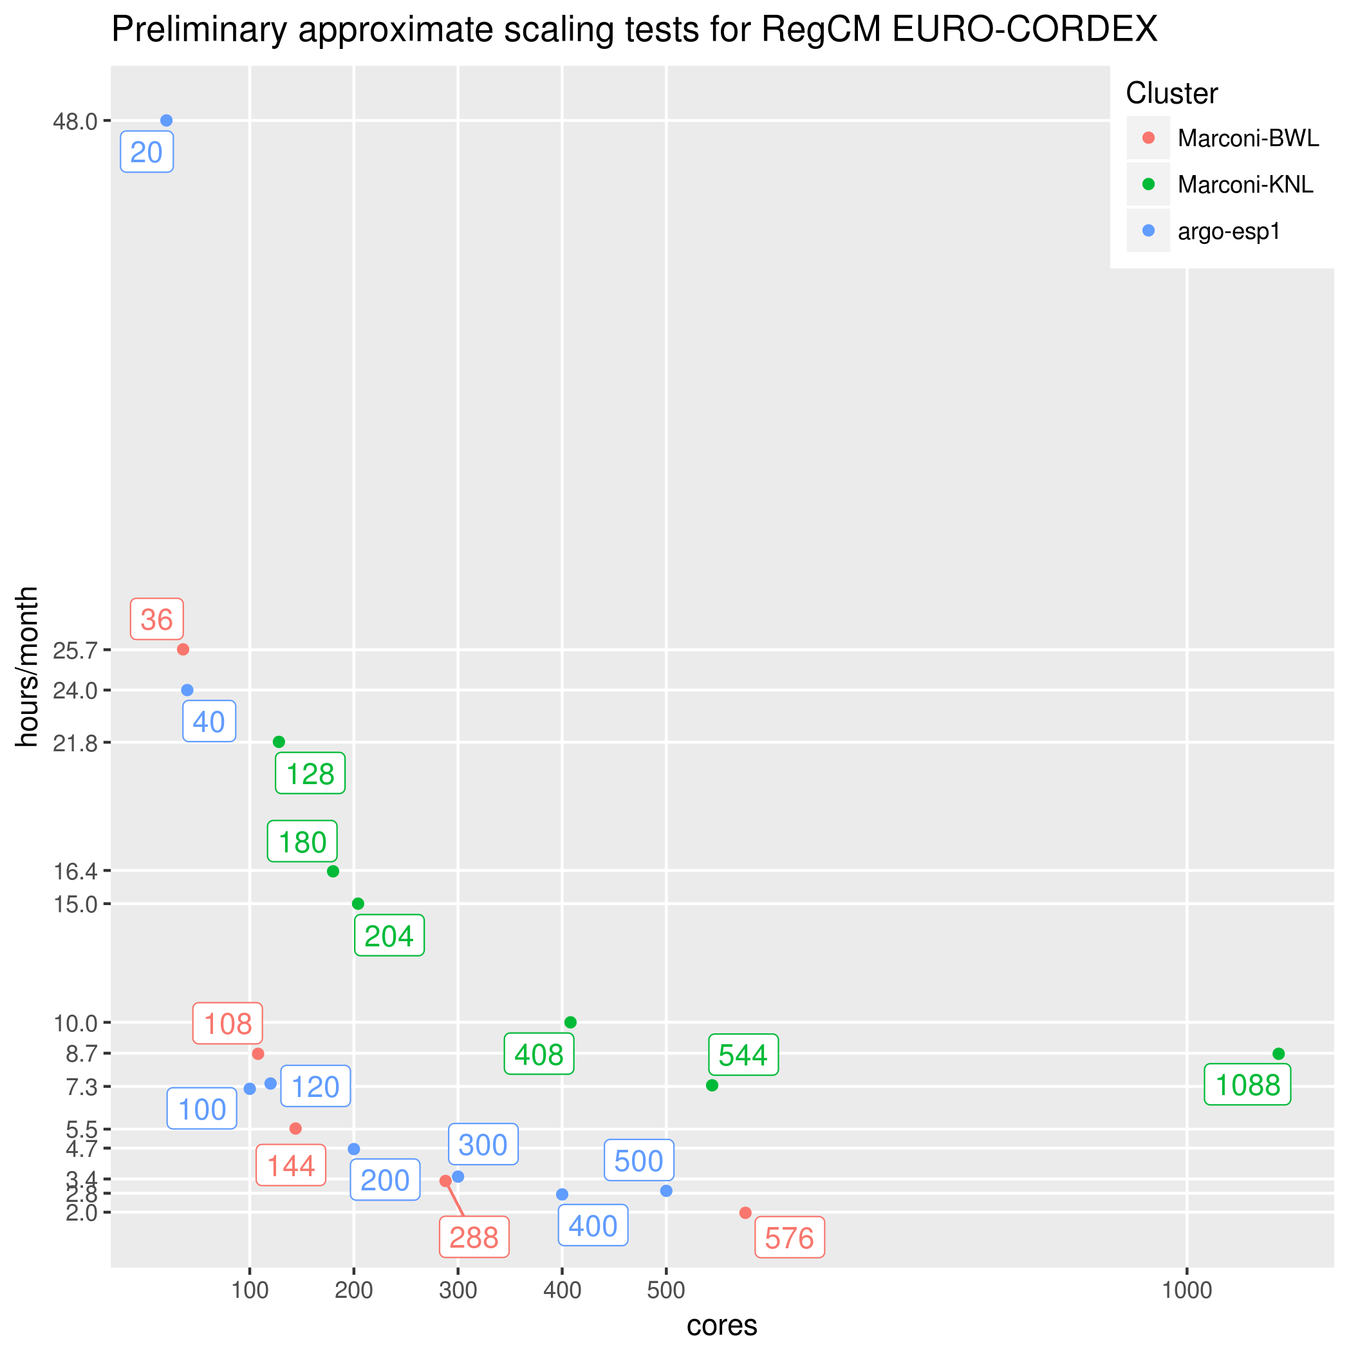
- Model tuning
- Performance assessment
- PRACE proposal 2016153590 approved
3.0 - Cetemps Hydrological Model
CHyM Is a distributed (gridded) hydrological model. Peculiarities:
- Can build DEM from various sources, smoothing by cellula automata algorithms
- Can use several kind of inputs, such as station observations, gridded model data, etc.
- Designed to work on any domain
- NetCDF output
3.1 - Cetemps Hydrological Model
Successes so far:
- Model now working on all test domains
- Model code and design has been streamlined (thanks to Fabio di Sante!)
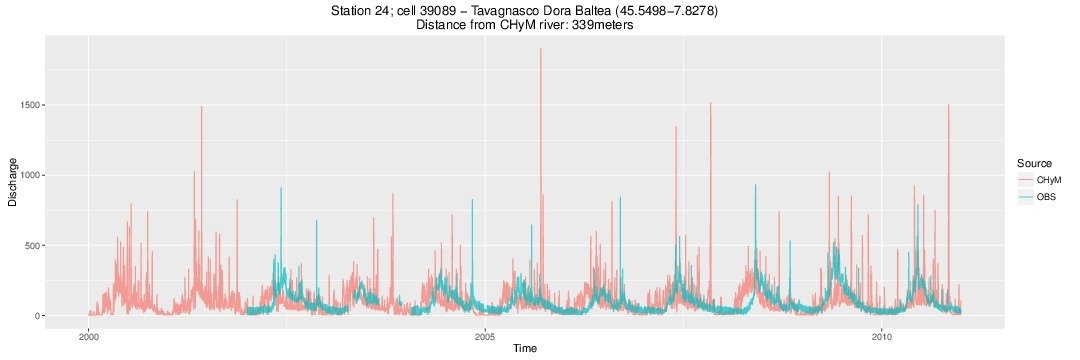
- We can reproduce past results (Coppola et al. 2013) on our test domain (western Po basin)
- HR DEMs working (at low model res)
3.2 - Cetemps Hydrological Model
Failures so far:
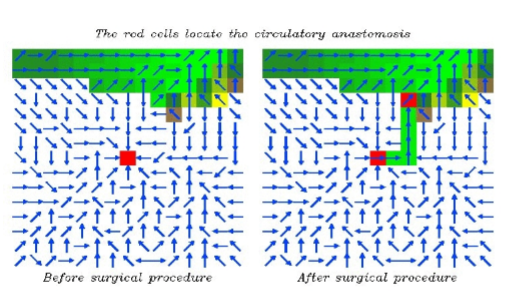
- River network reconstruction at high resolutions (<500m) fails due to singularities in the DEMs
- Discharge at low resolutions must be rescaled
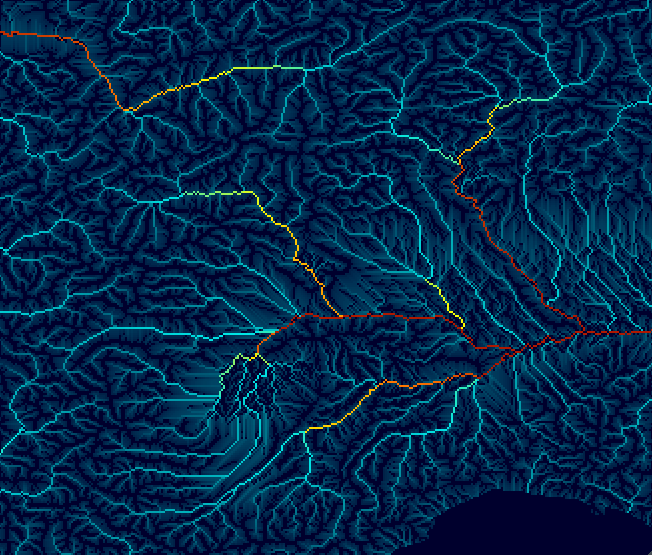
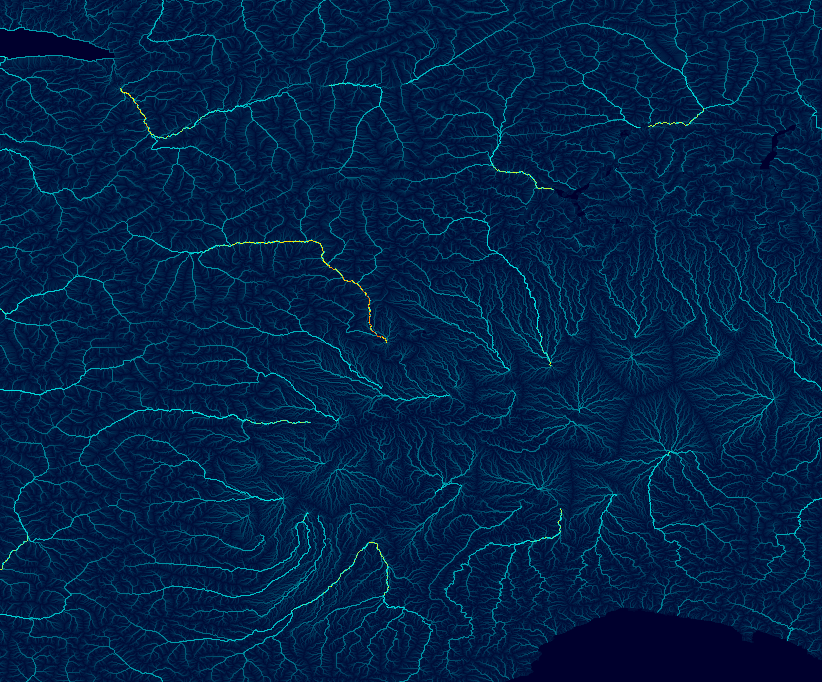
3.3 - Cetemps Hydrological Model
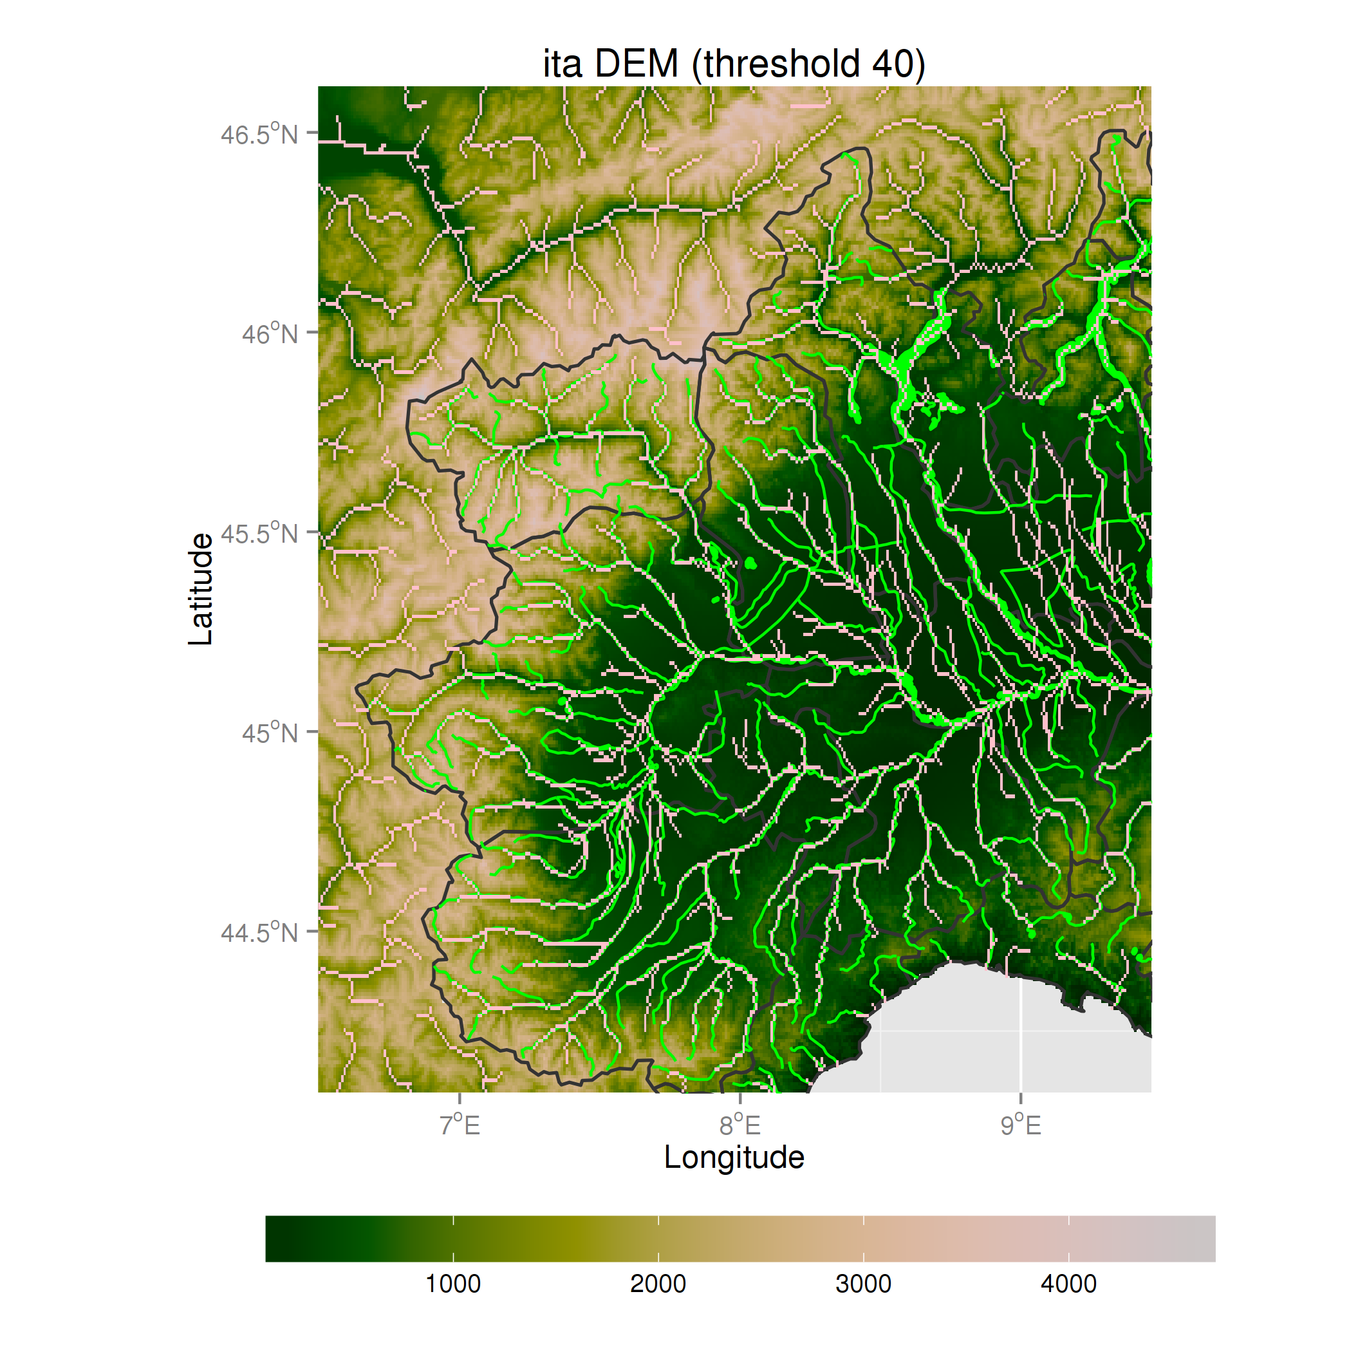
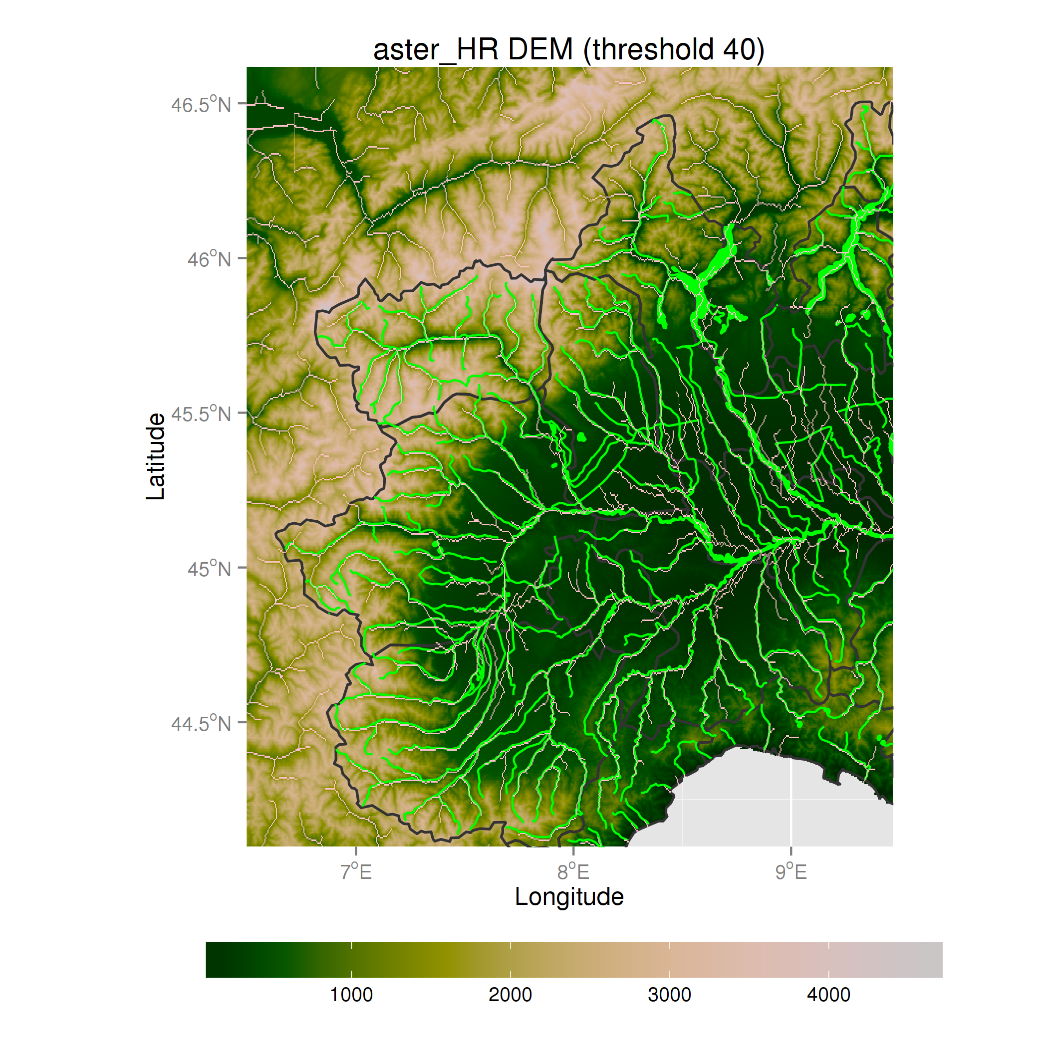
CHyM default Italian DEM is 300m in resolution, we wanted to try higher resolution DEMs:
- ASTER 30m
- HydroSHEDS 90m
- SRTM 90m
- JAXA 30m (wip)
New HR DEM is able to reconstruct the river network at low model resolutions (900m)
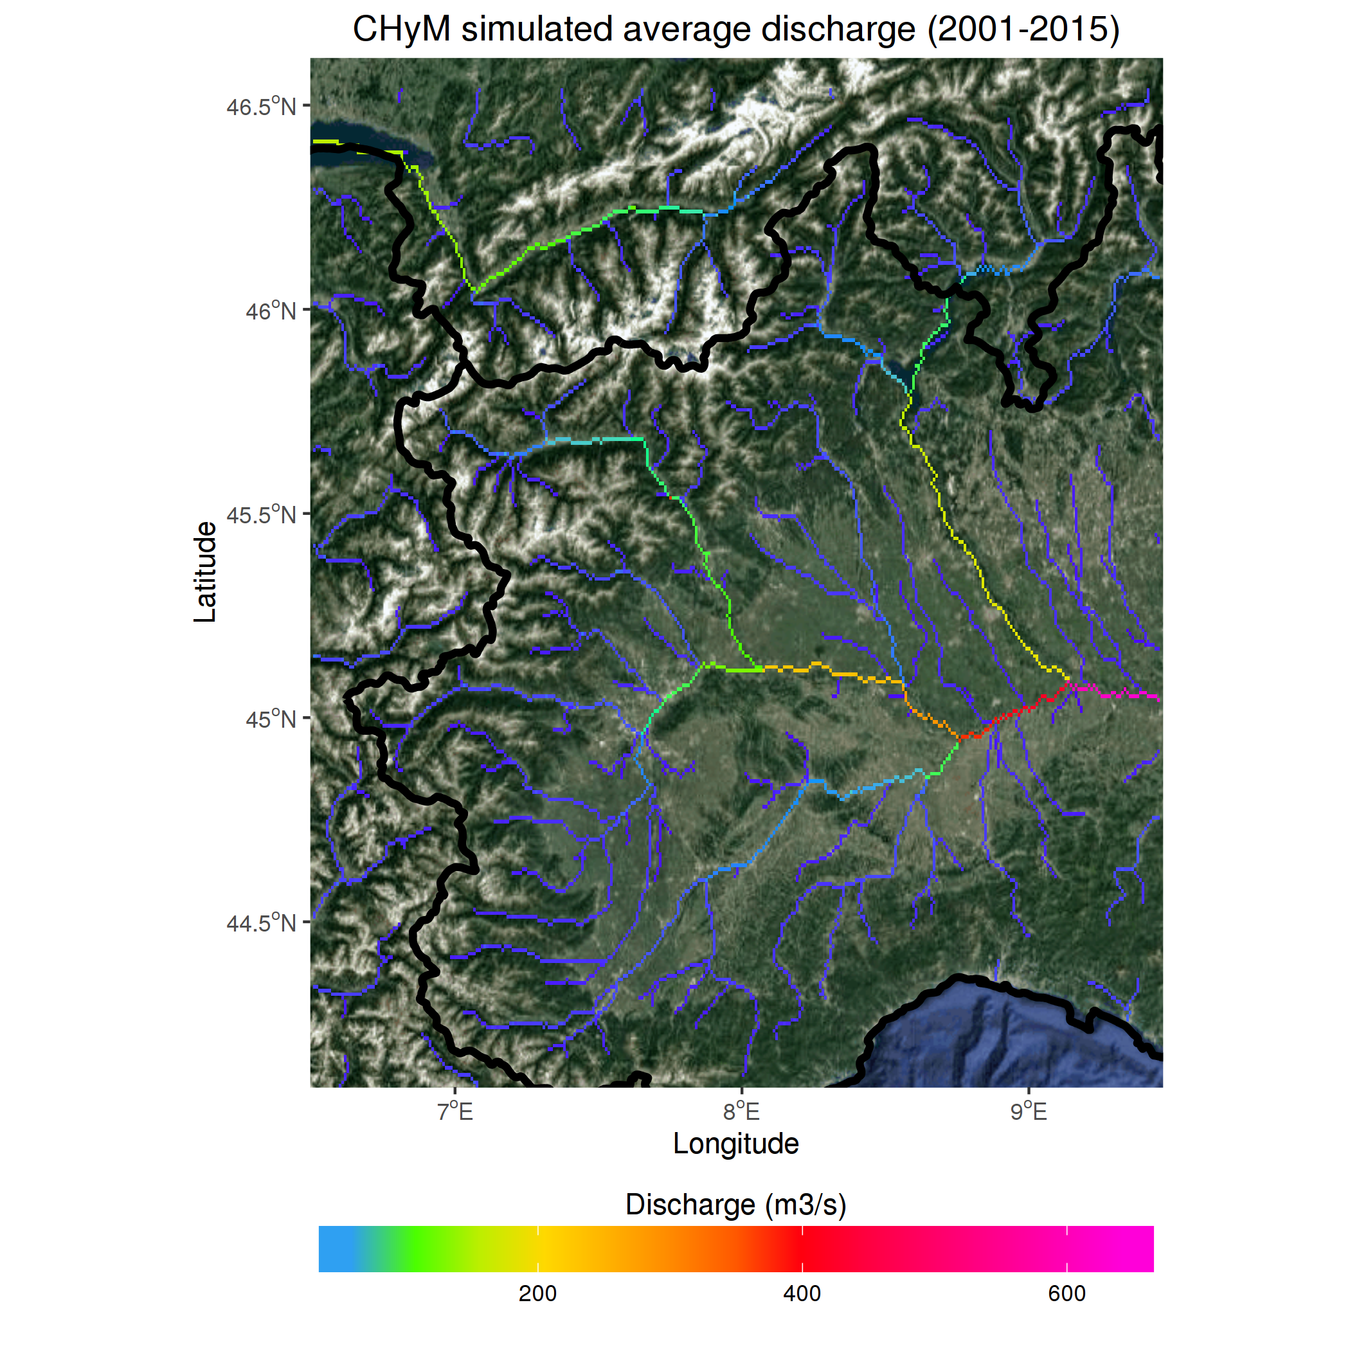
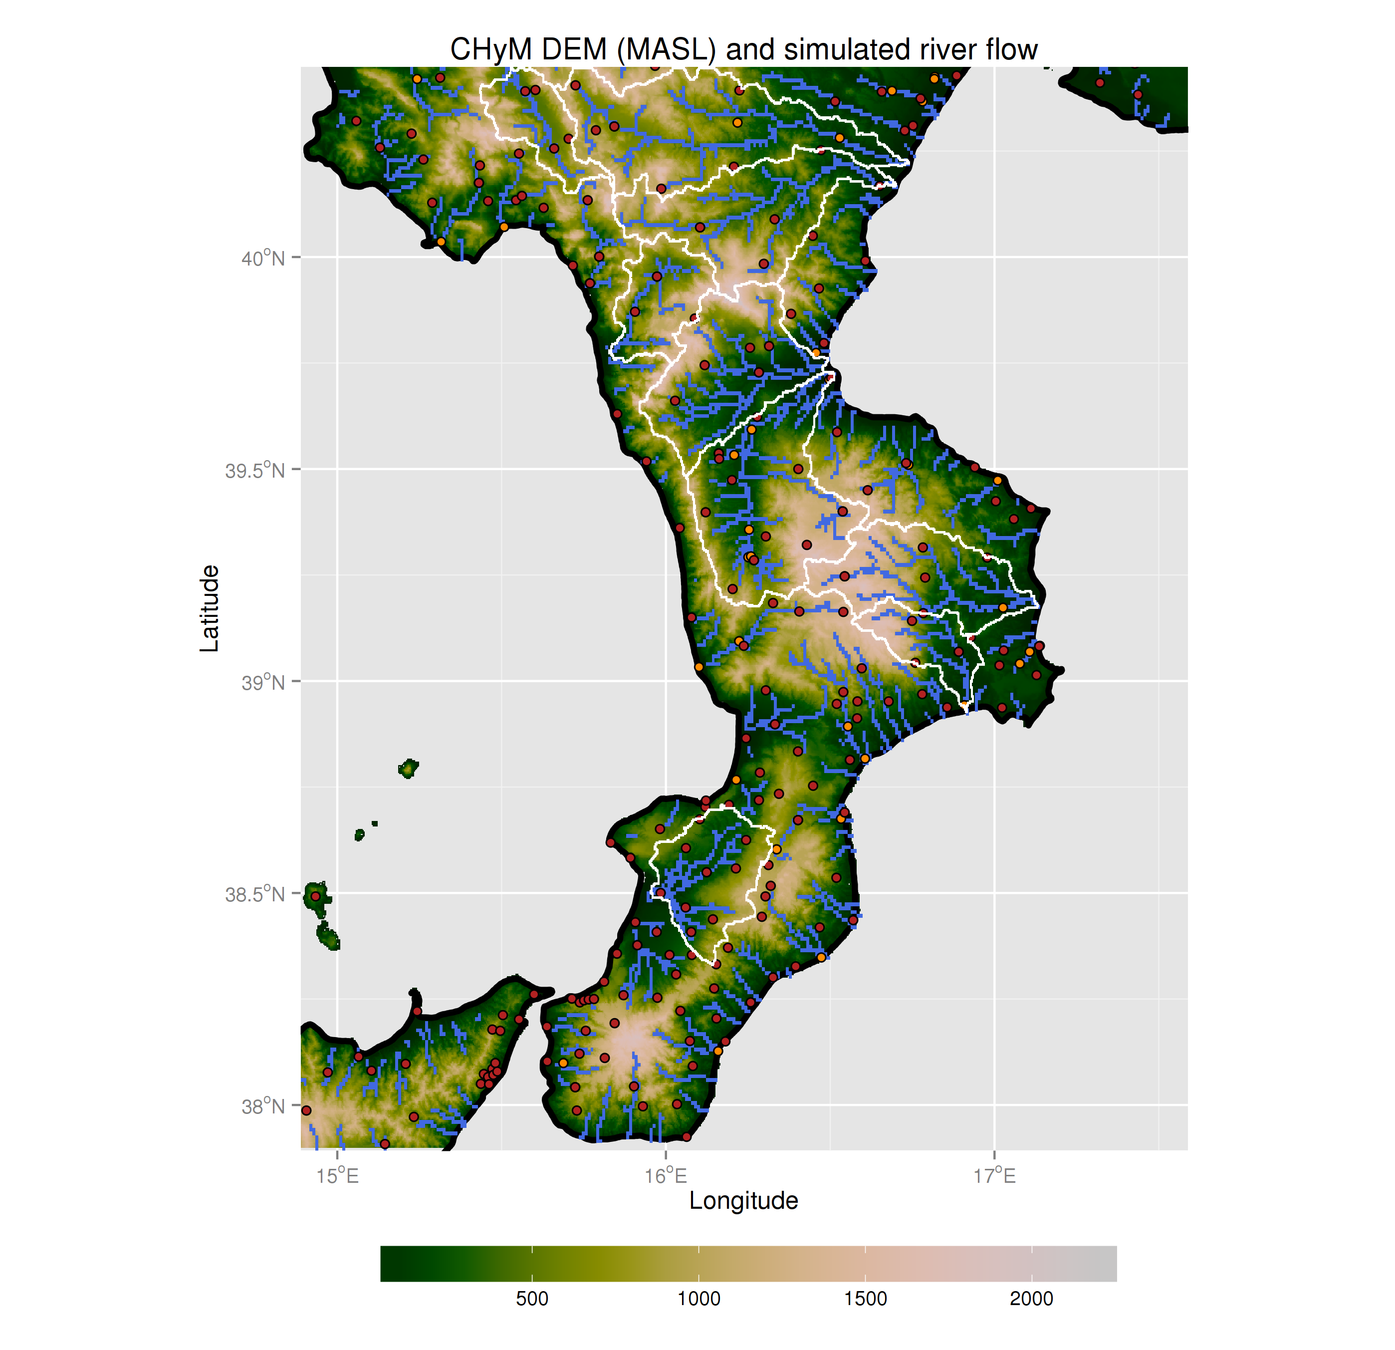
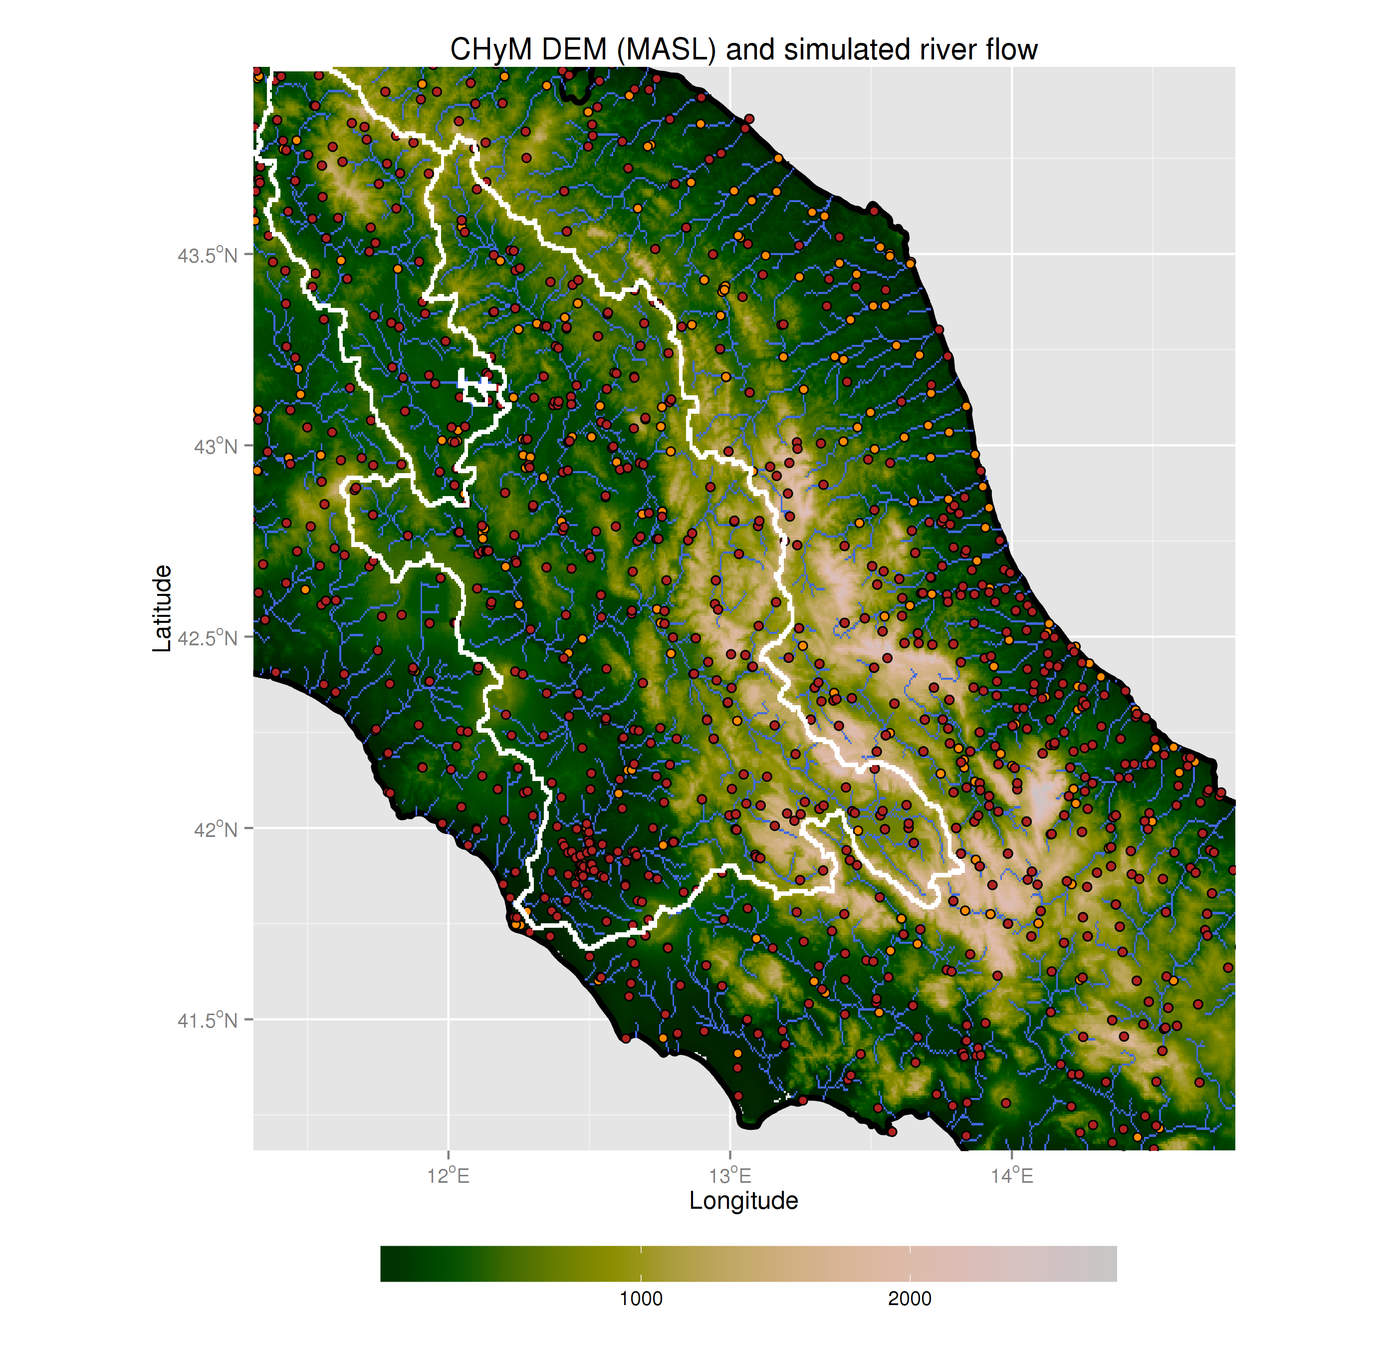
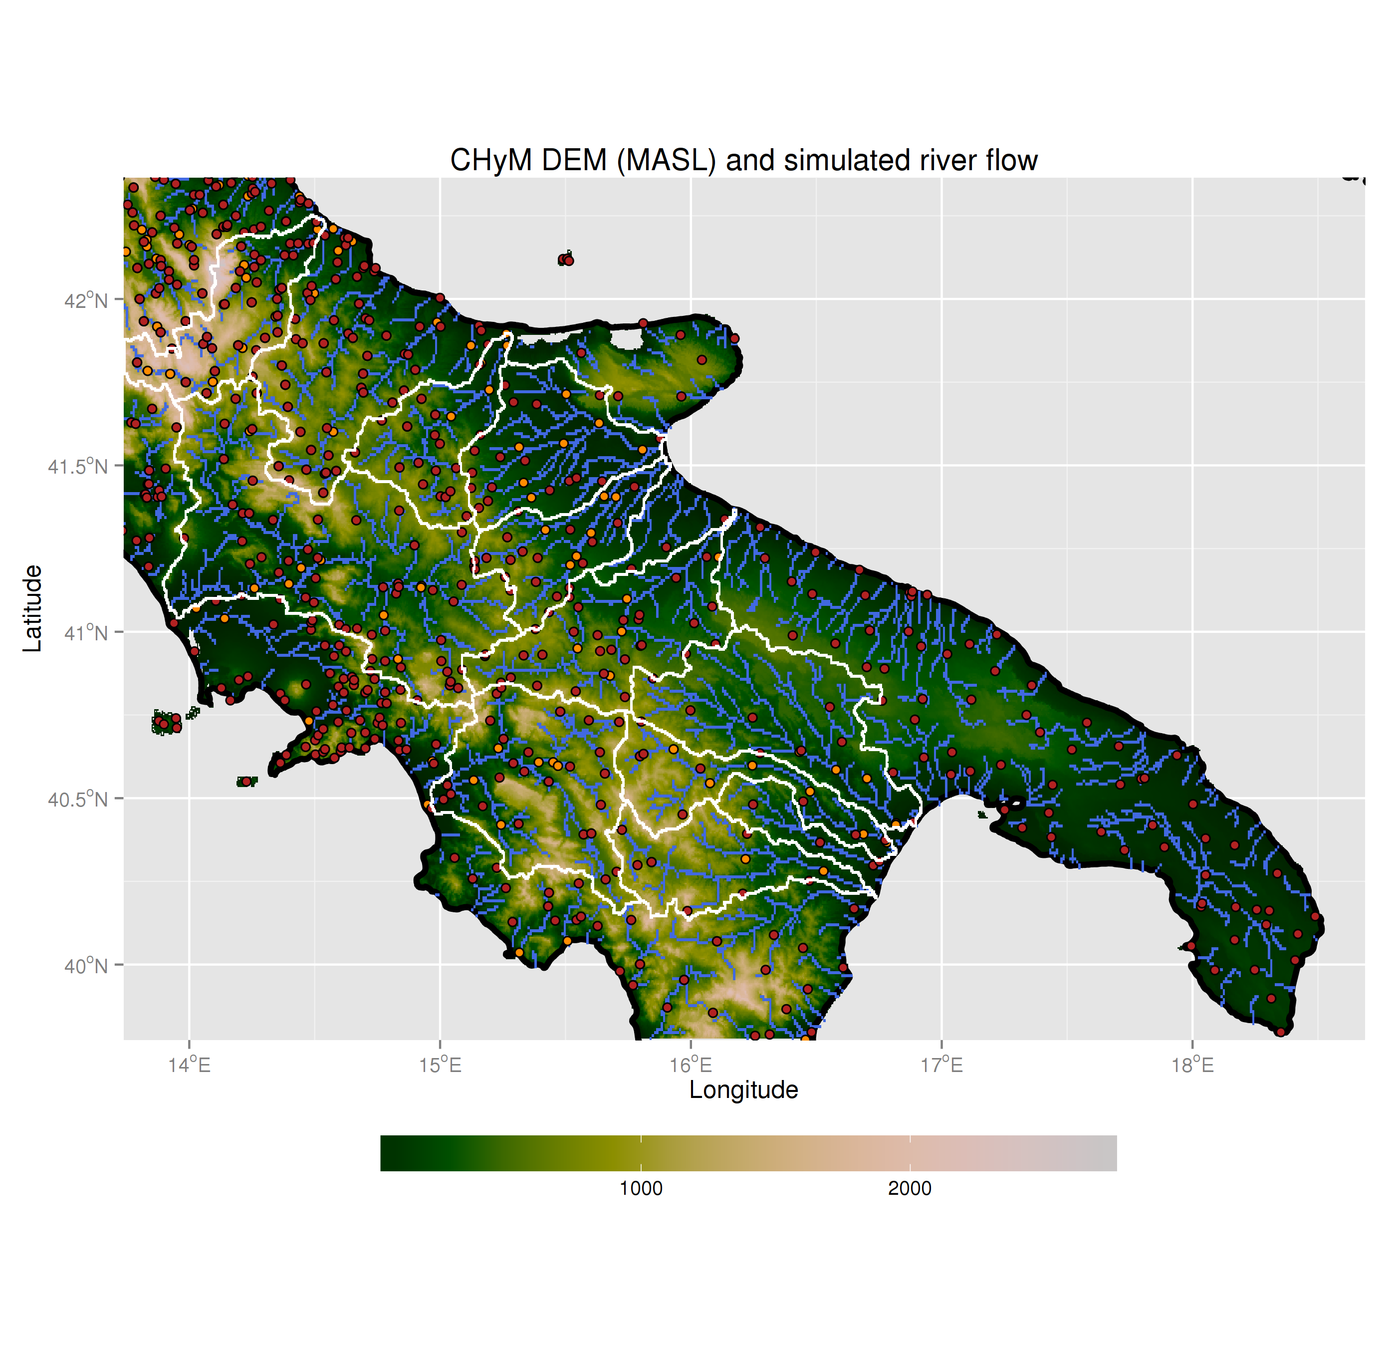
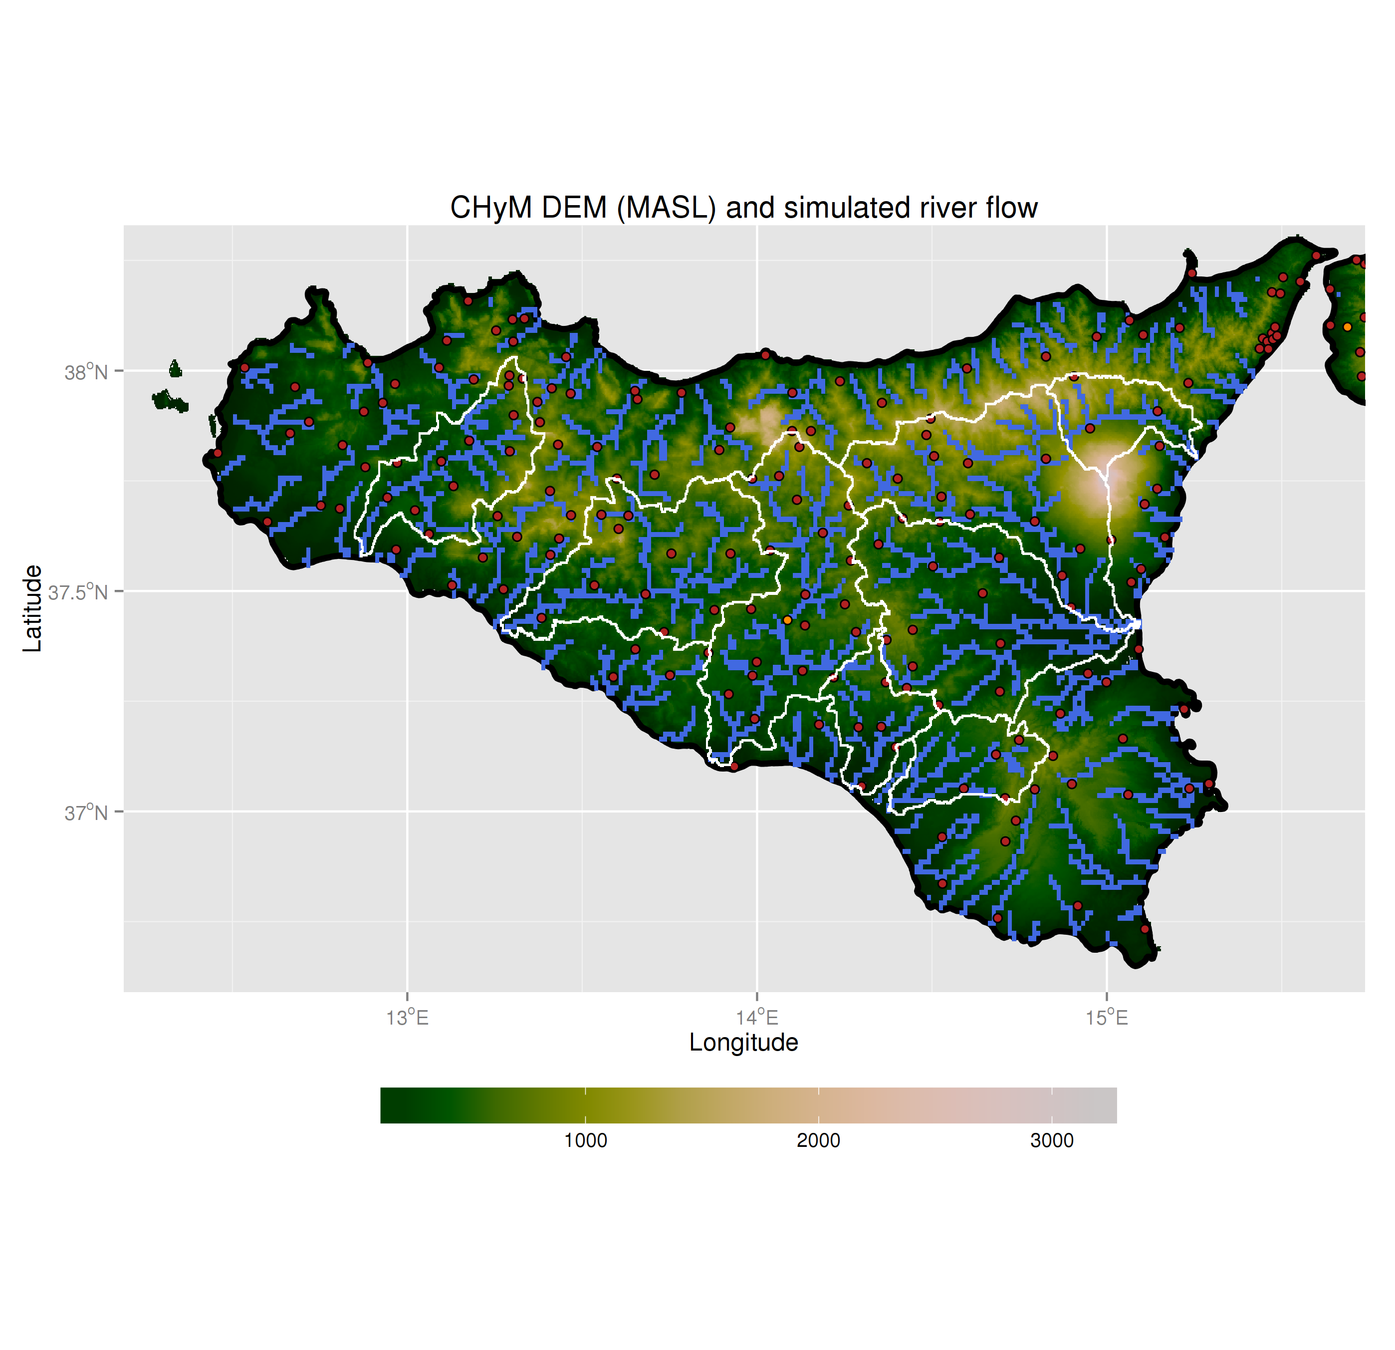
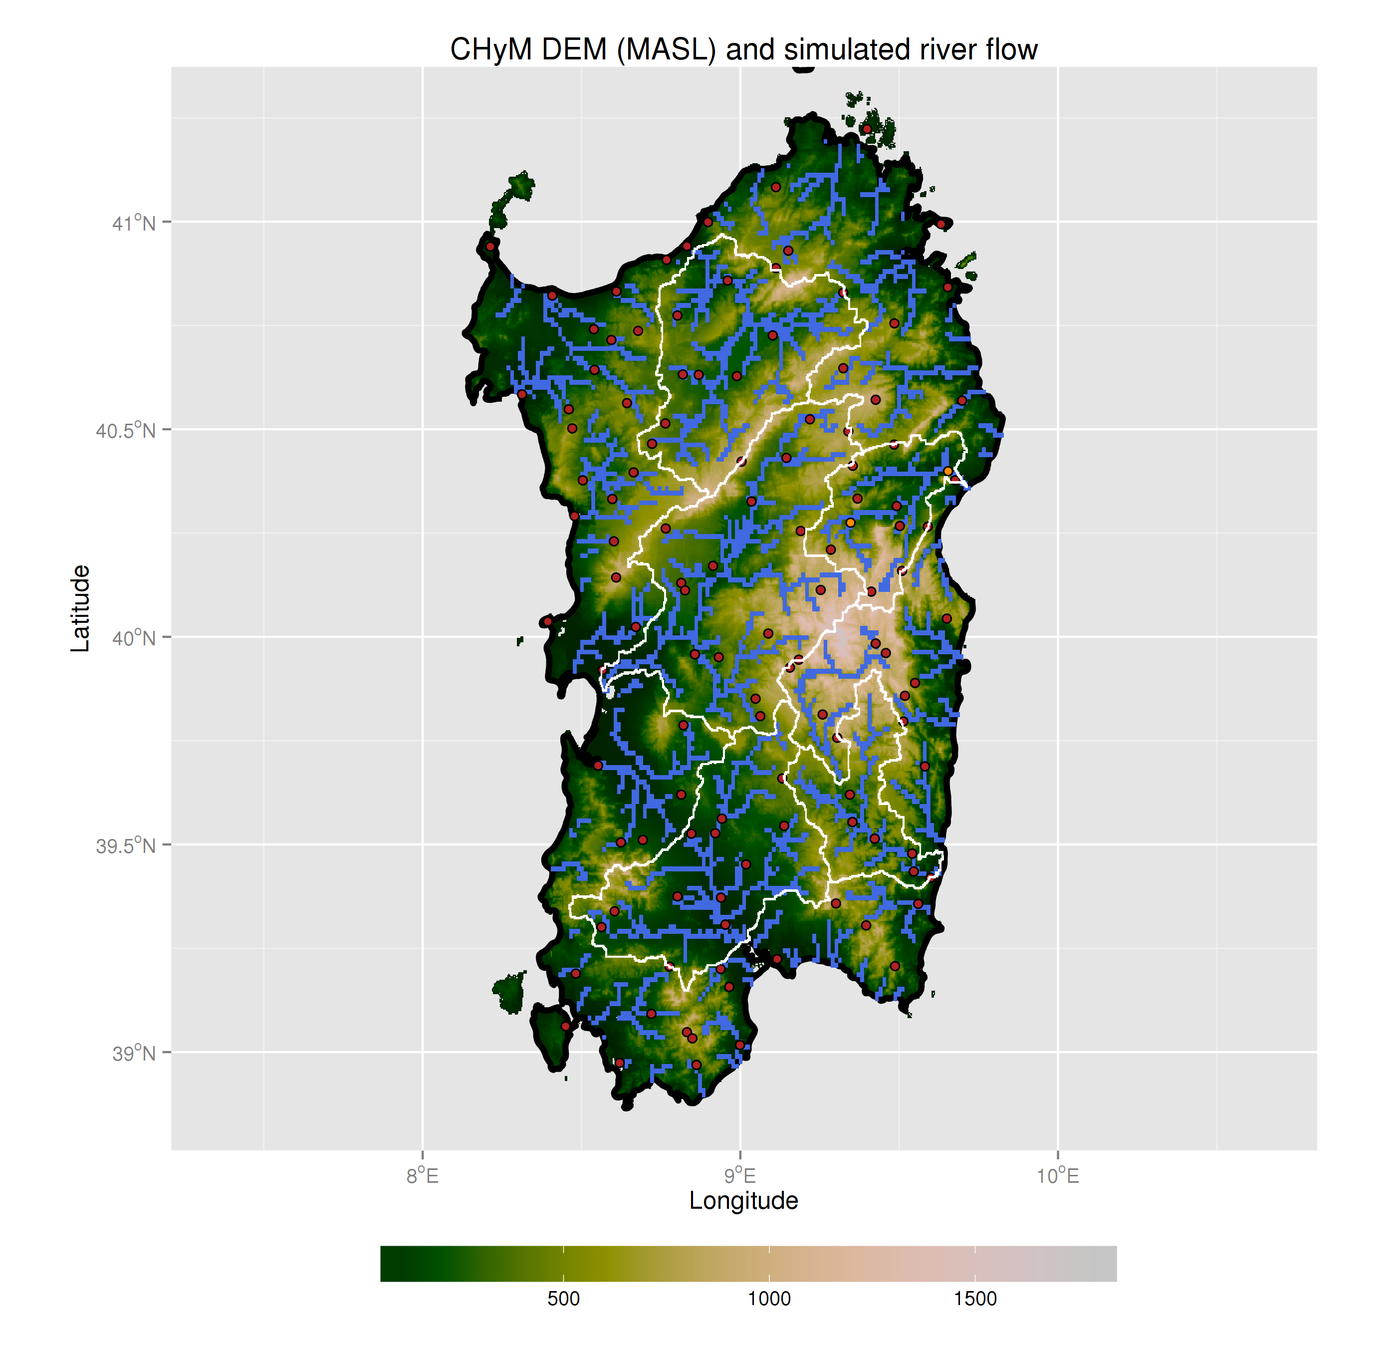
3.4 - Cetemps Hydrological Model
CHyM-OP reproduced domains:
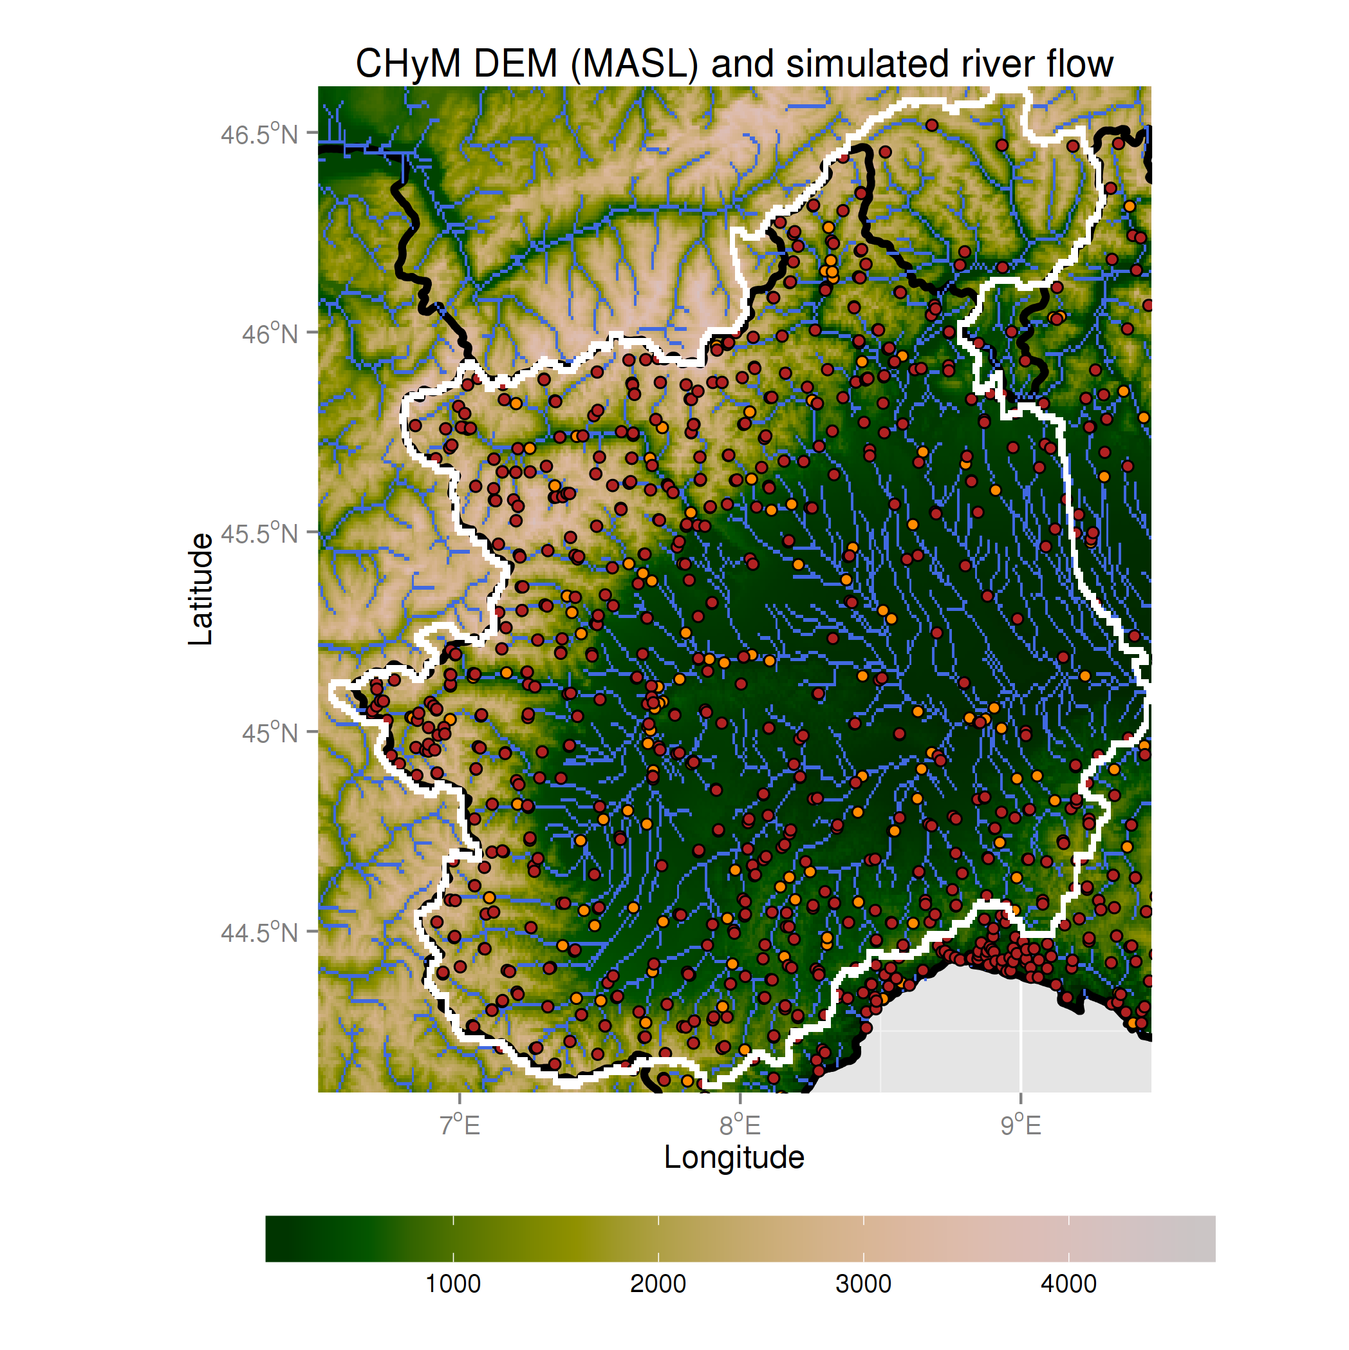
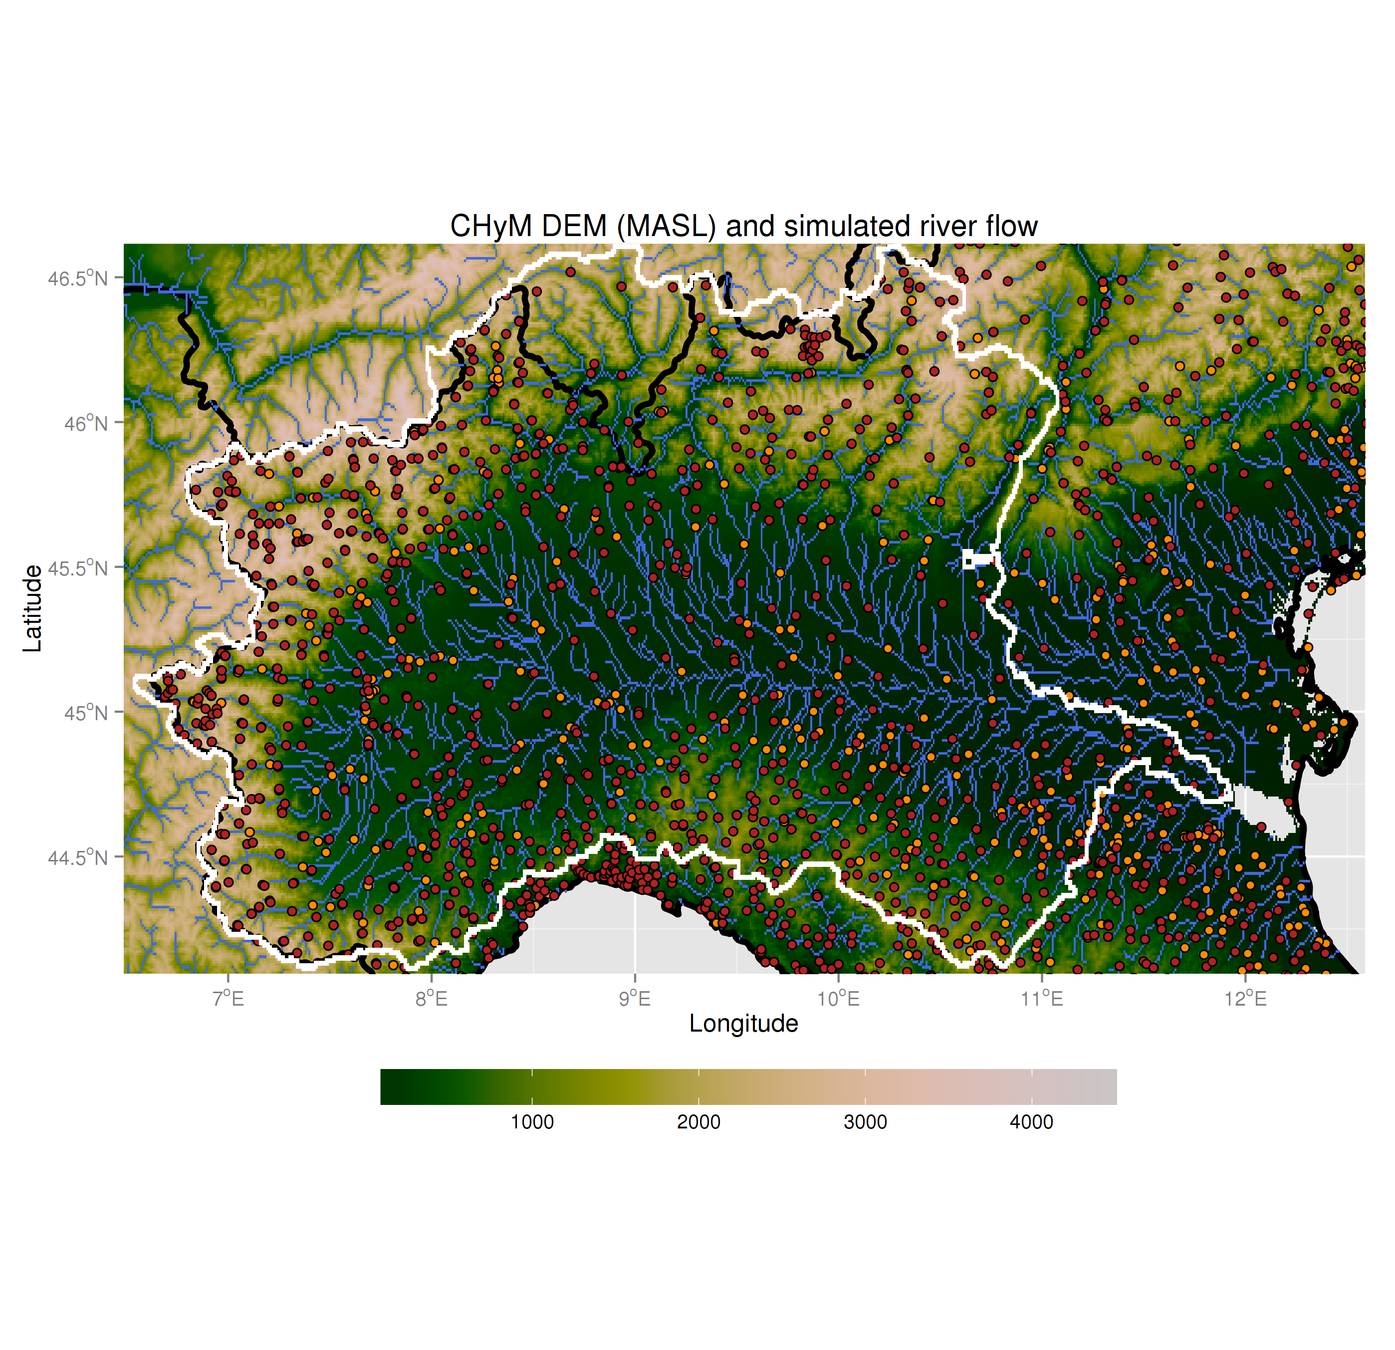
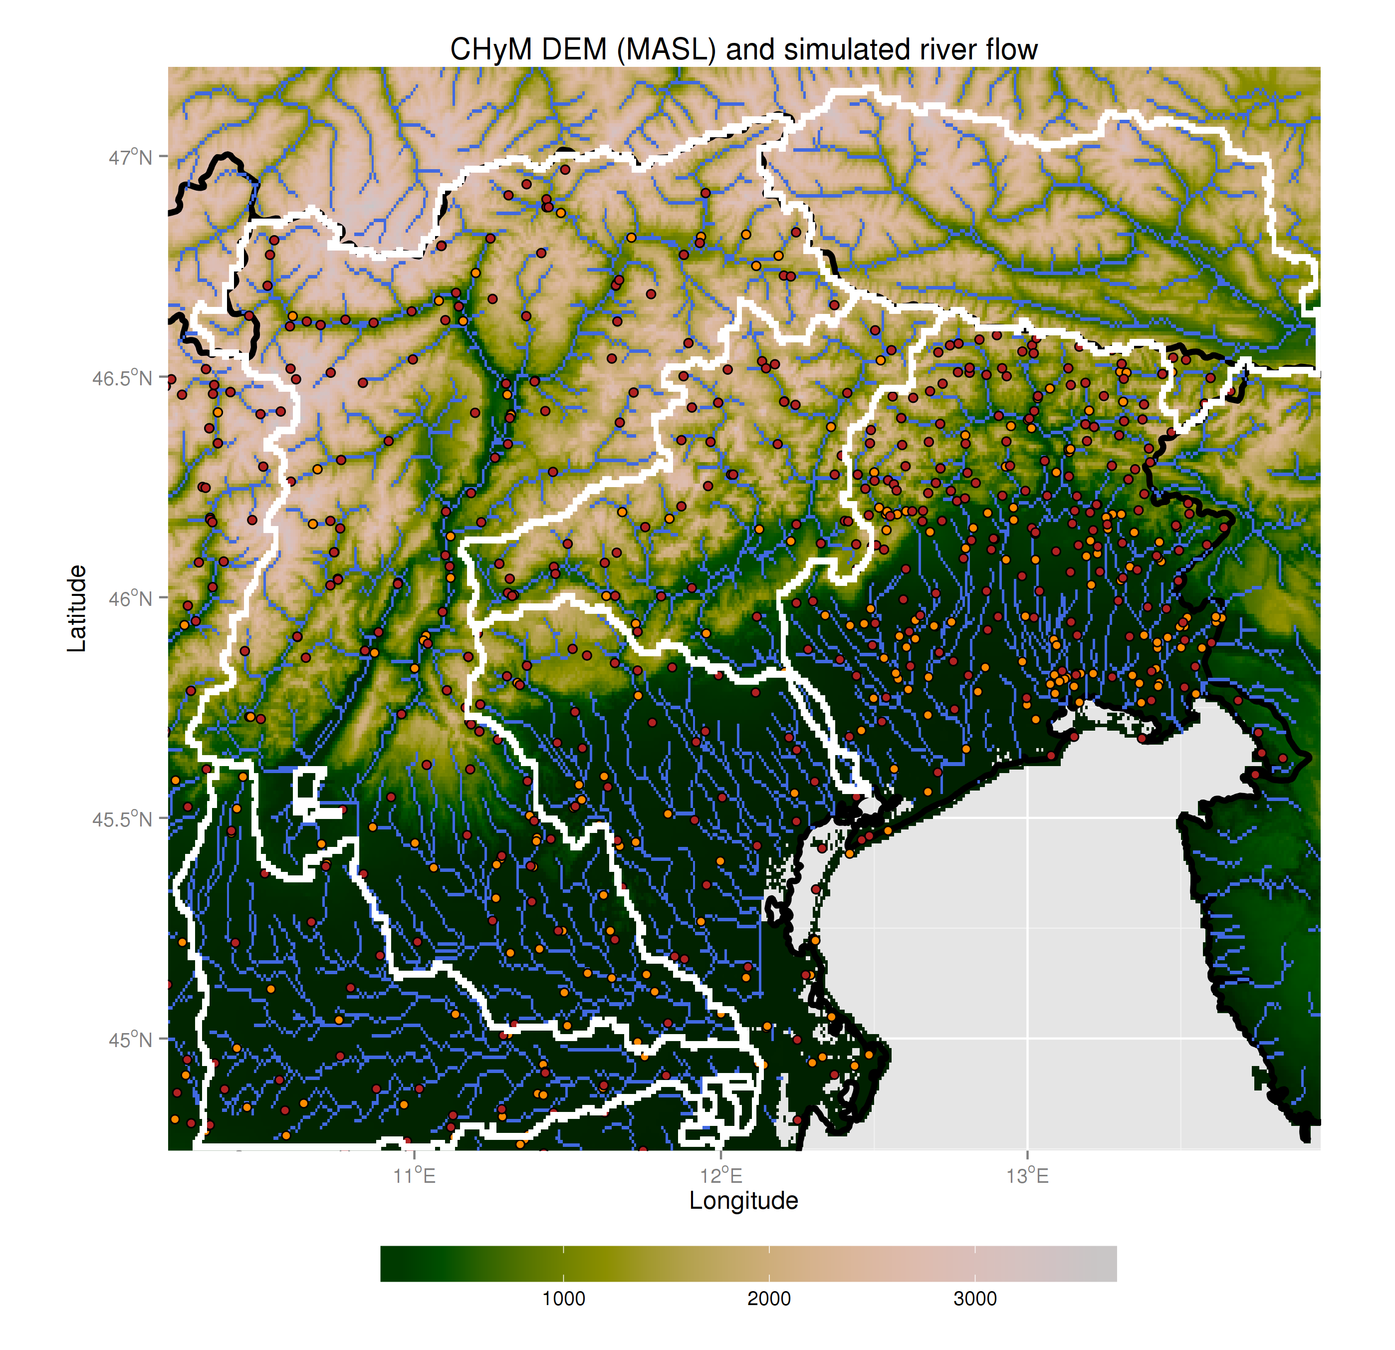
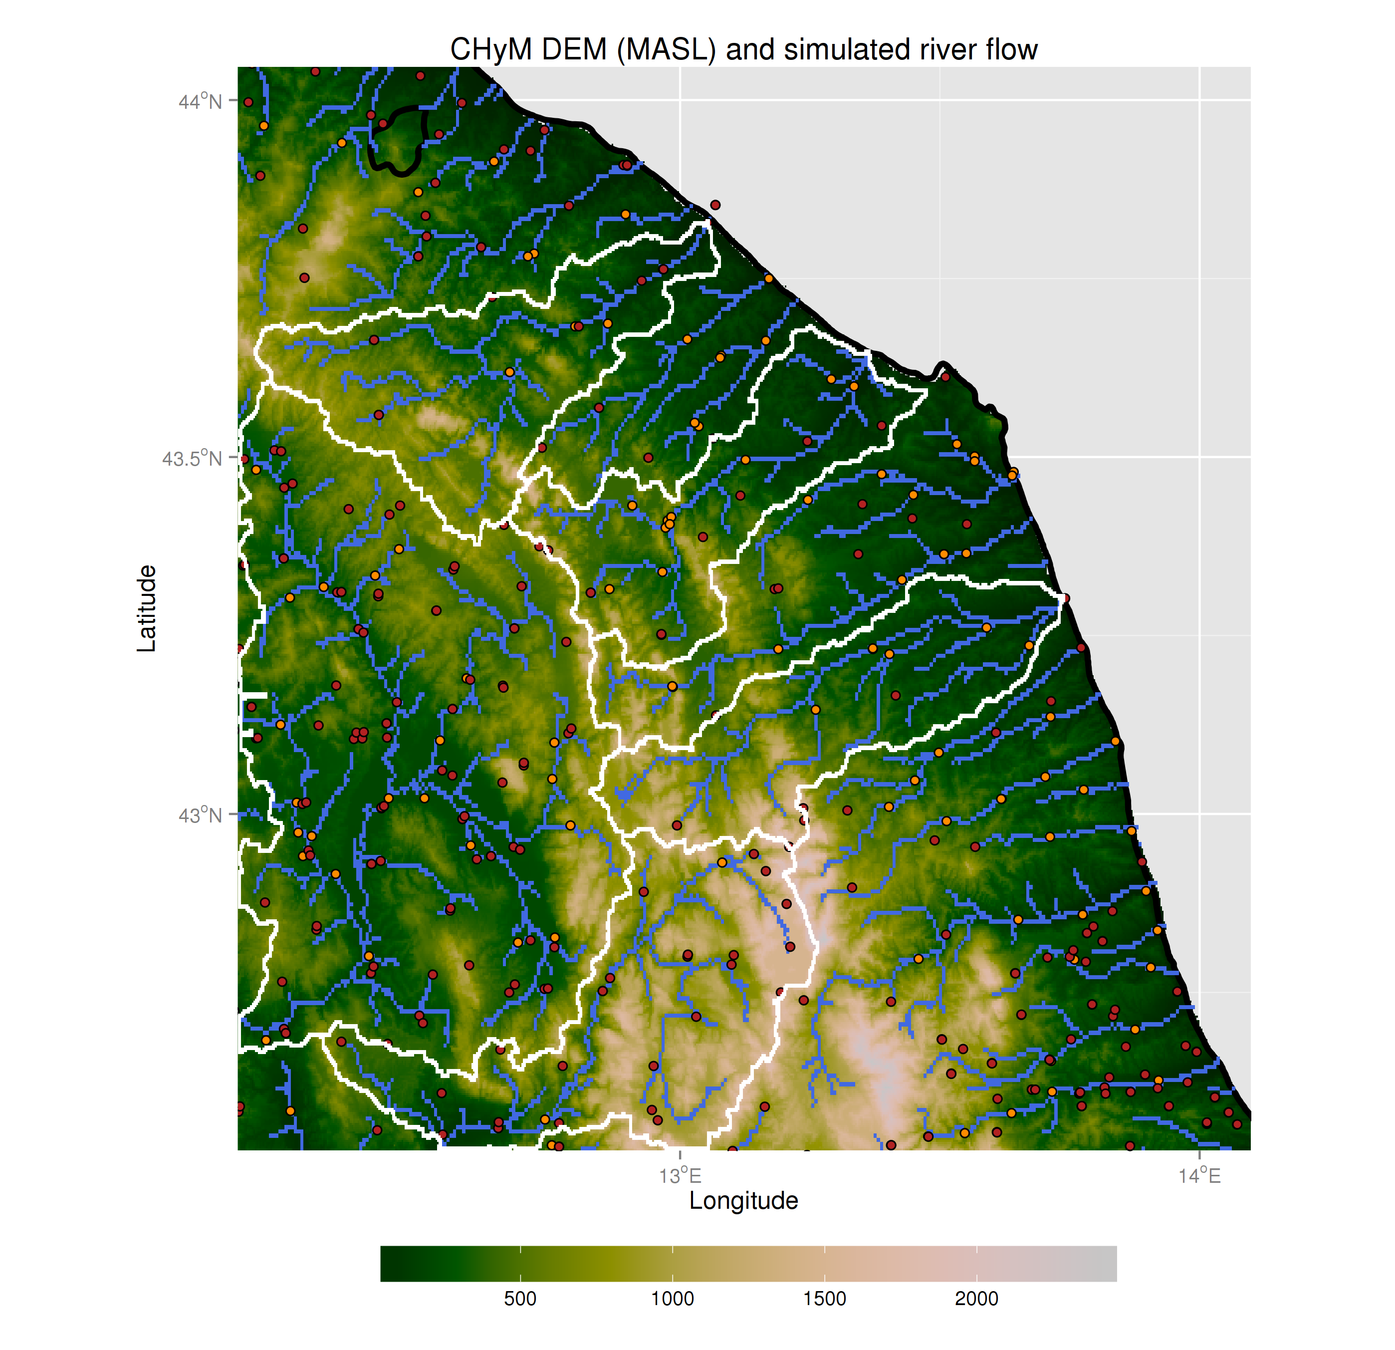
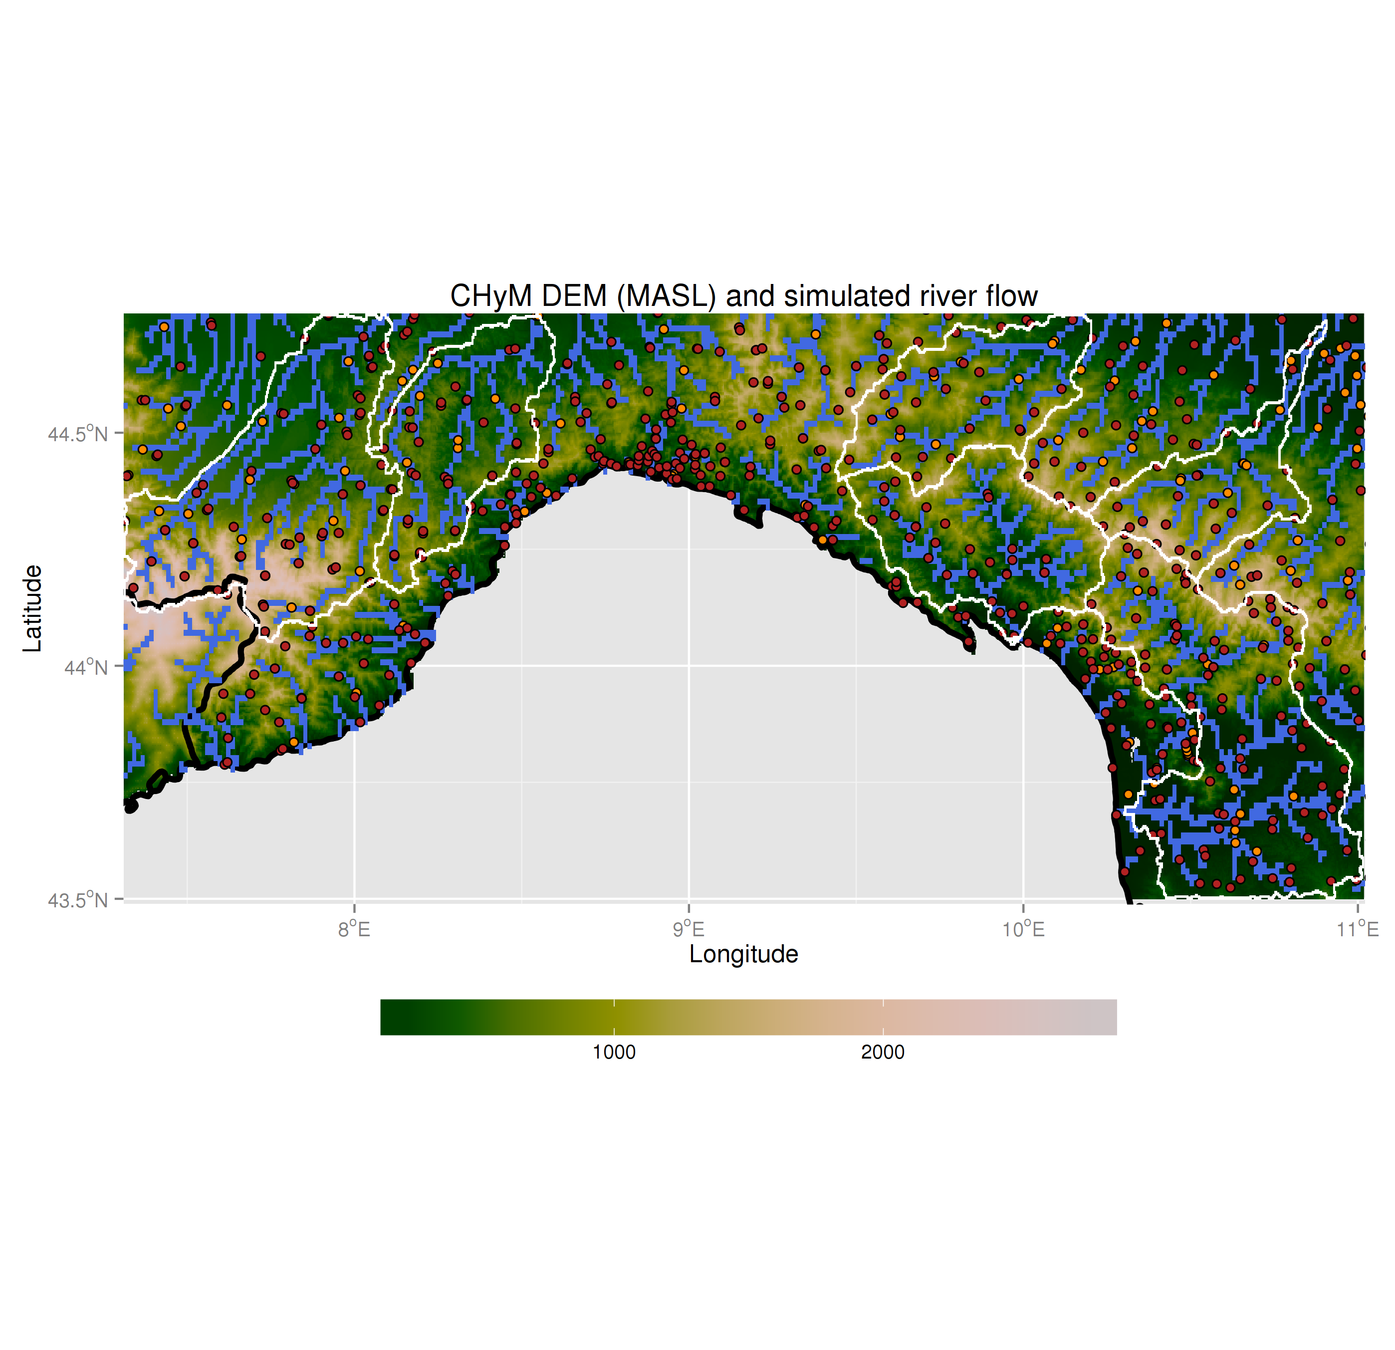
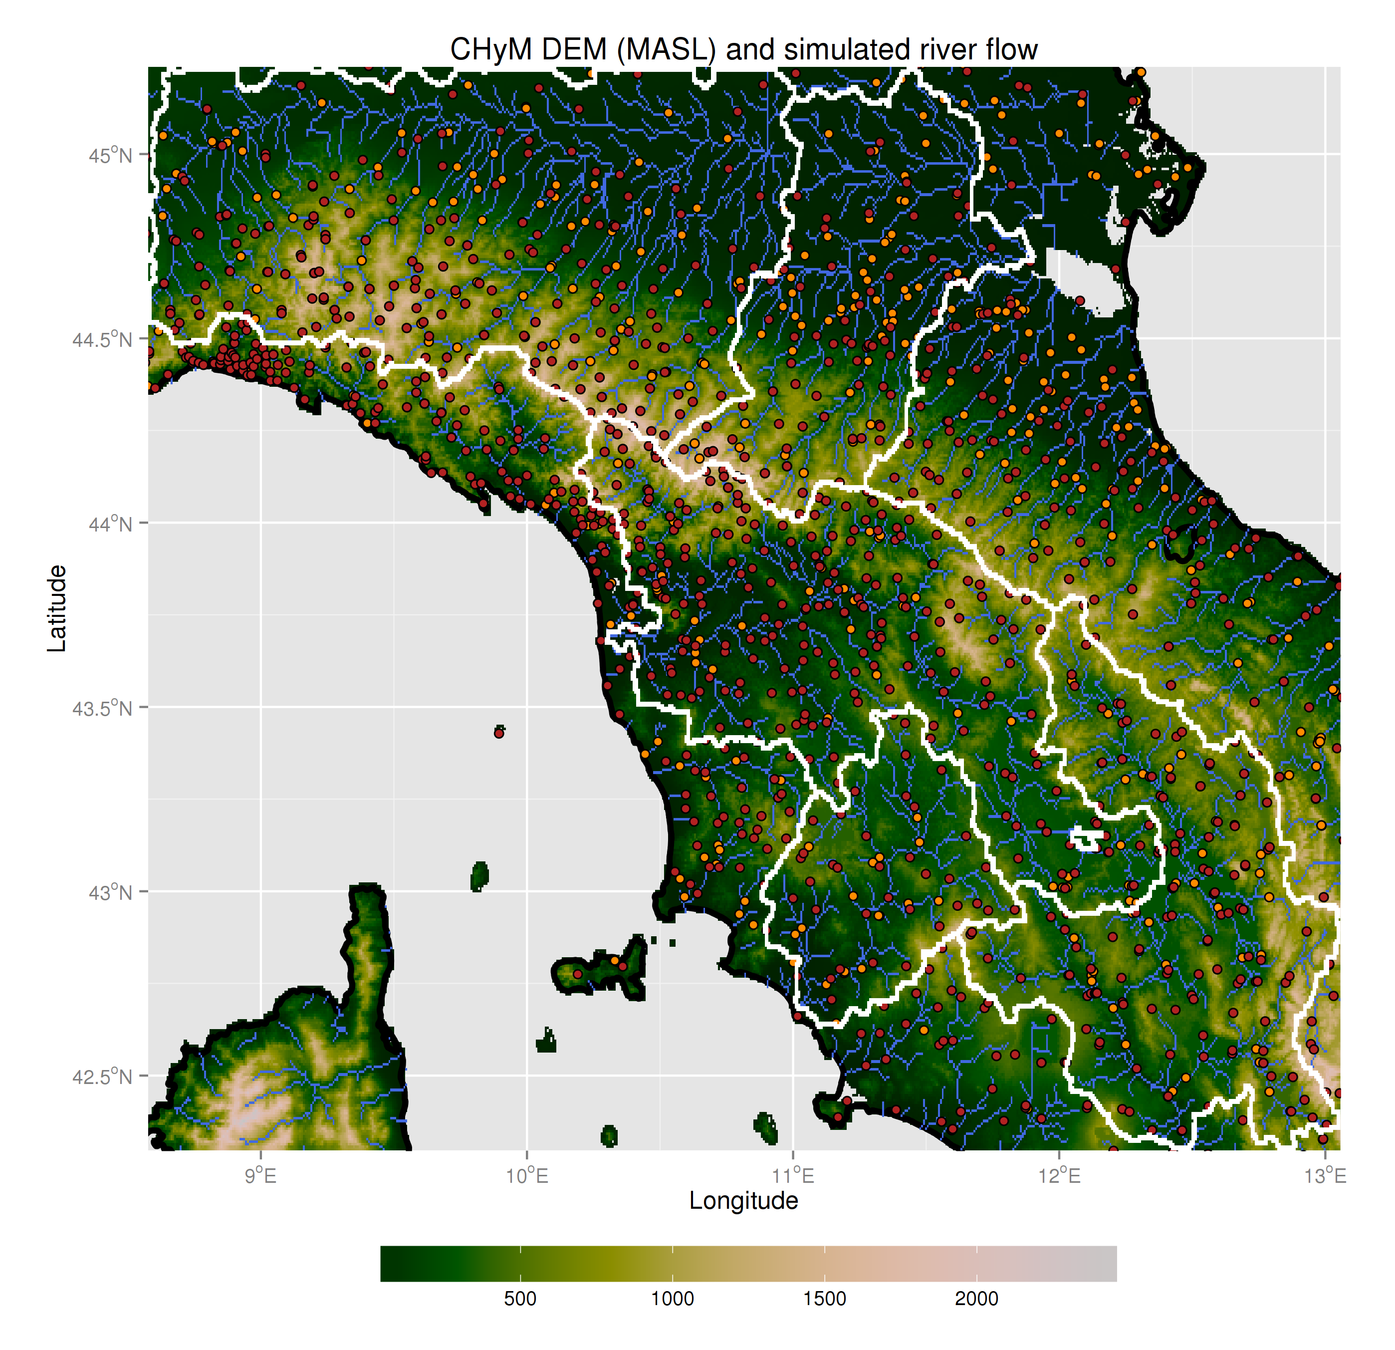
3.5 - Cetemps Hydrological Model
CHyM-OP reproduced domains:
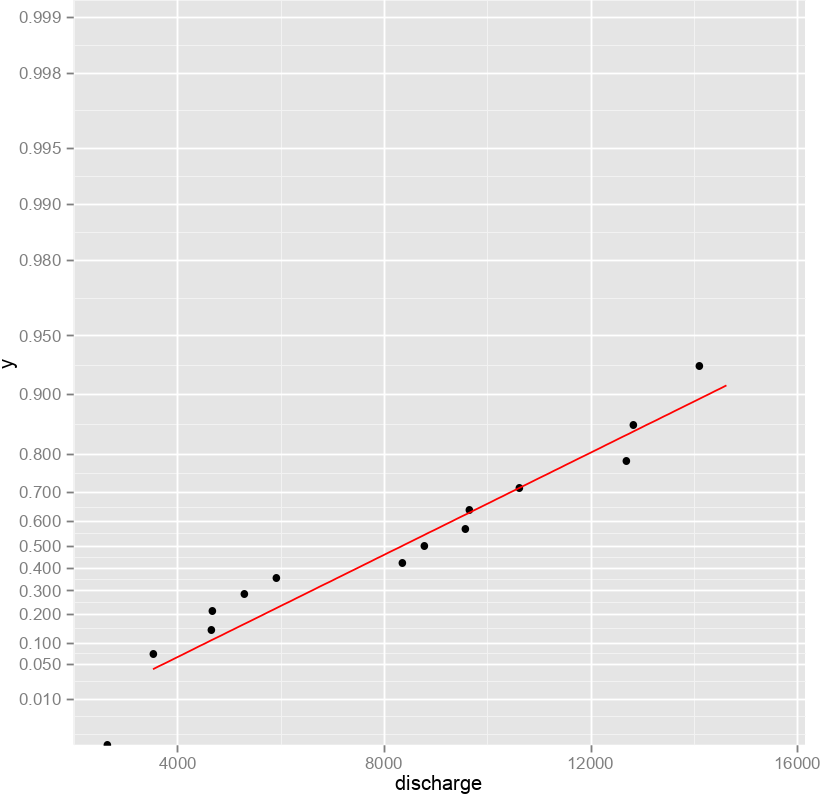
4 - Statistics
How to estimate hundred-years floods with only a few (~20) years worth of data?
The methodology is taken from Maione et al., 2003
Annual maxima
Gumbel extreme value distribution
Fit parameters
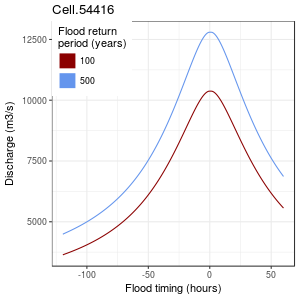
SDH: "Typical" flood timing curve for each river cell
LISFLOOD-FP input data
5.0 - LISFLOOD-FP hydraulic model
Widely-used flood inundation model from the University of Bristol (Bates et al., 2010)
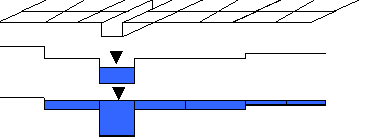
- DEM
- D4 River network
- SDH
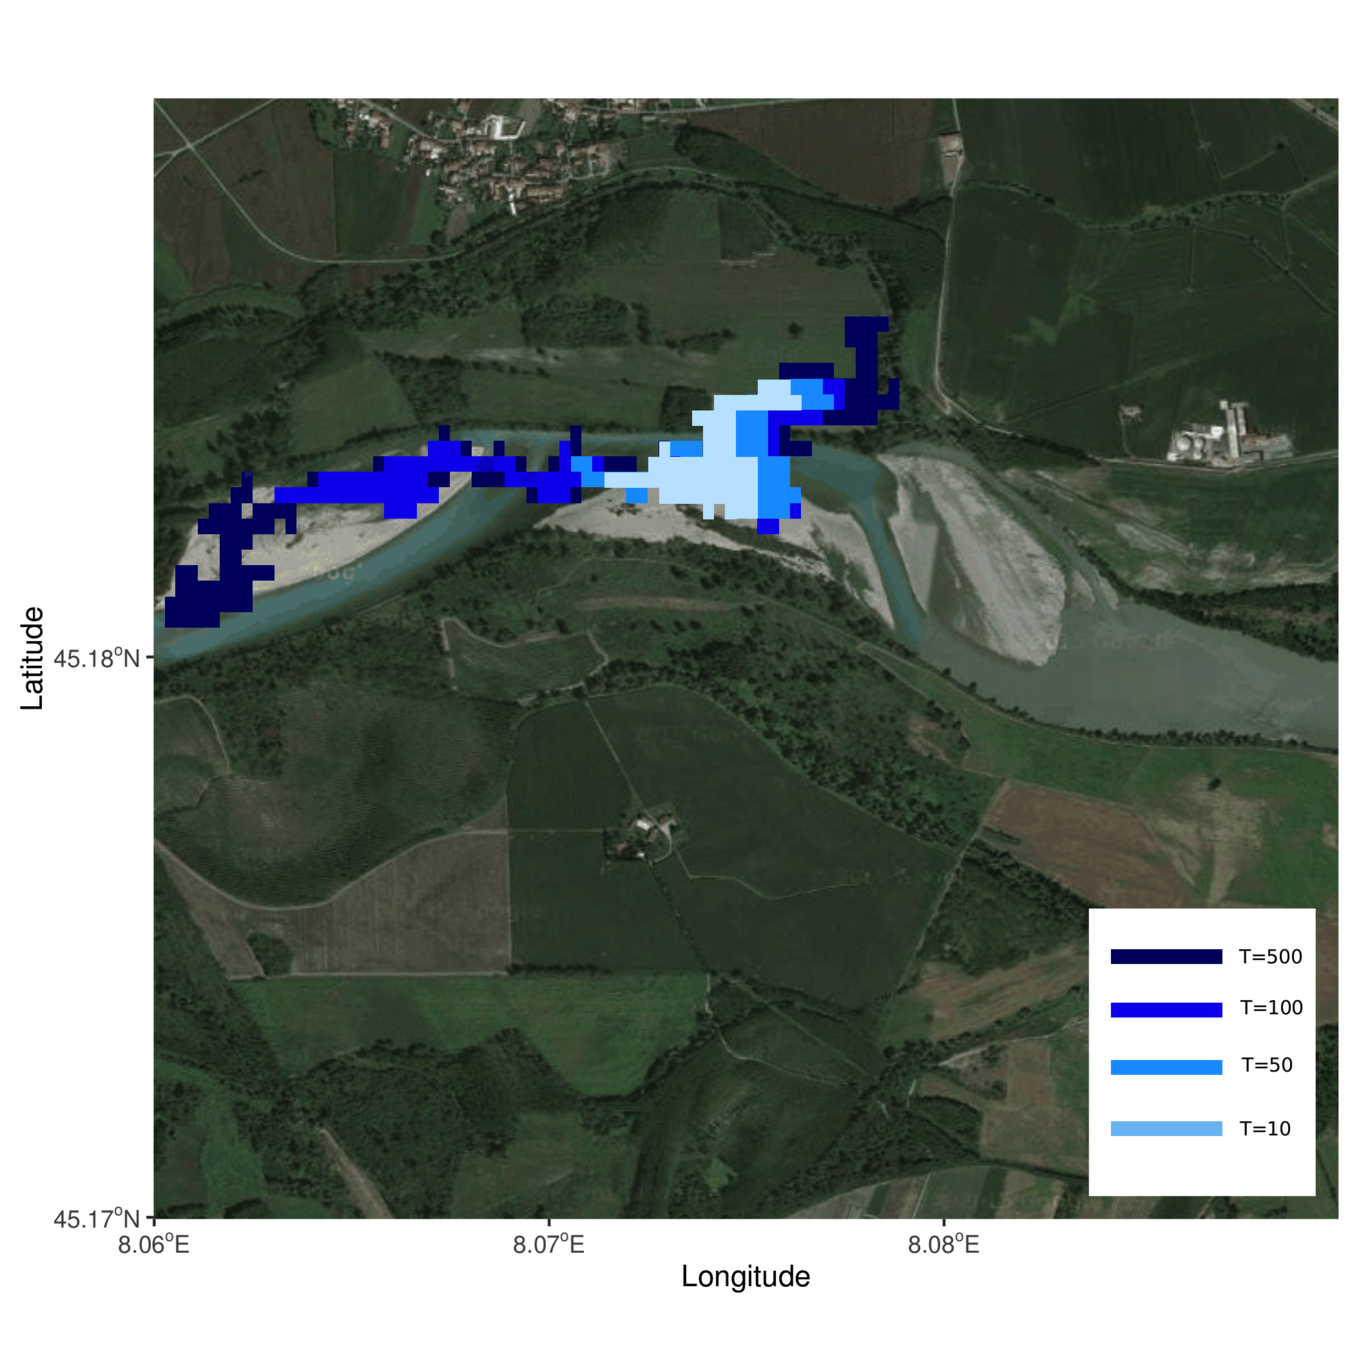
5.1 - LISFLOOD-FP hydraulic model
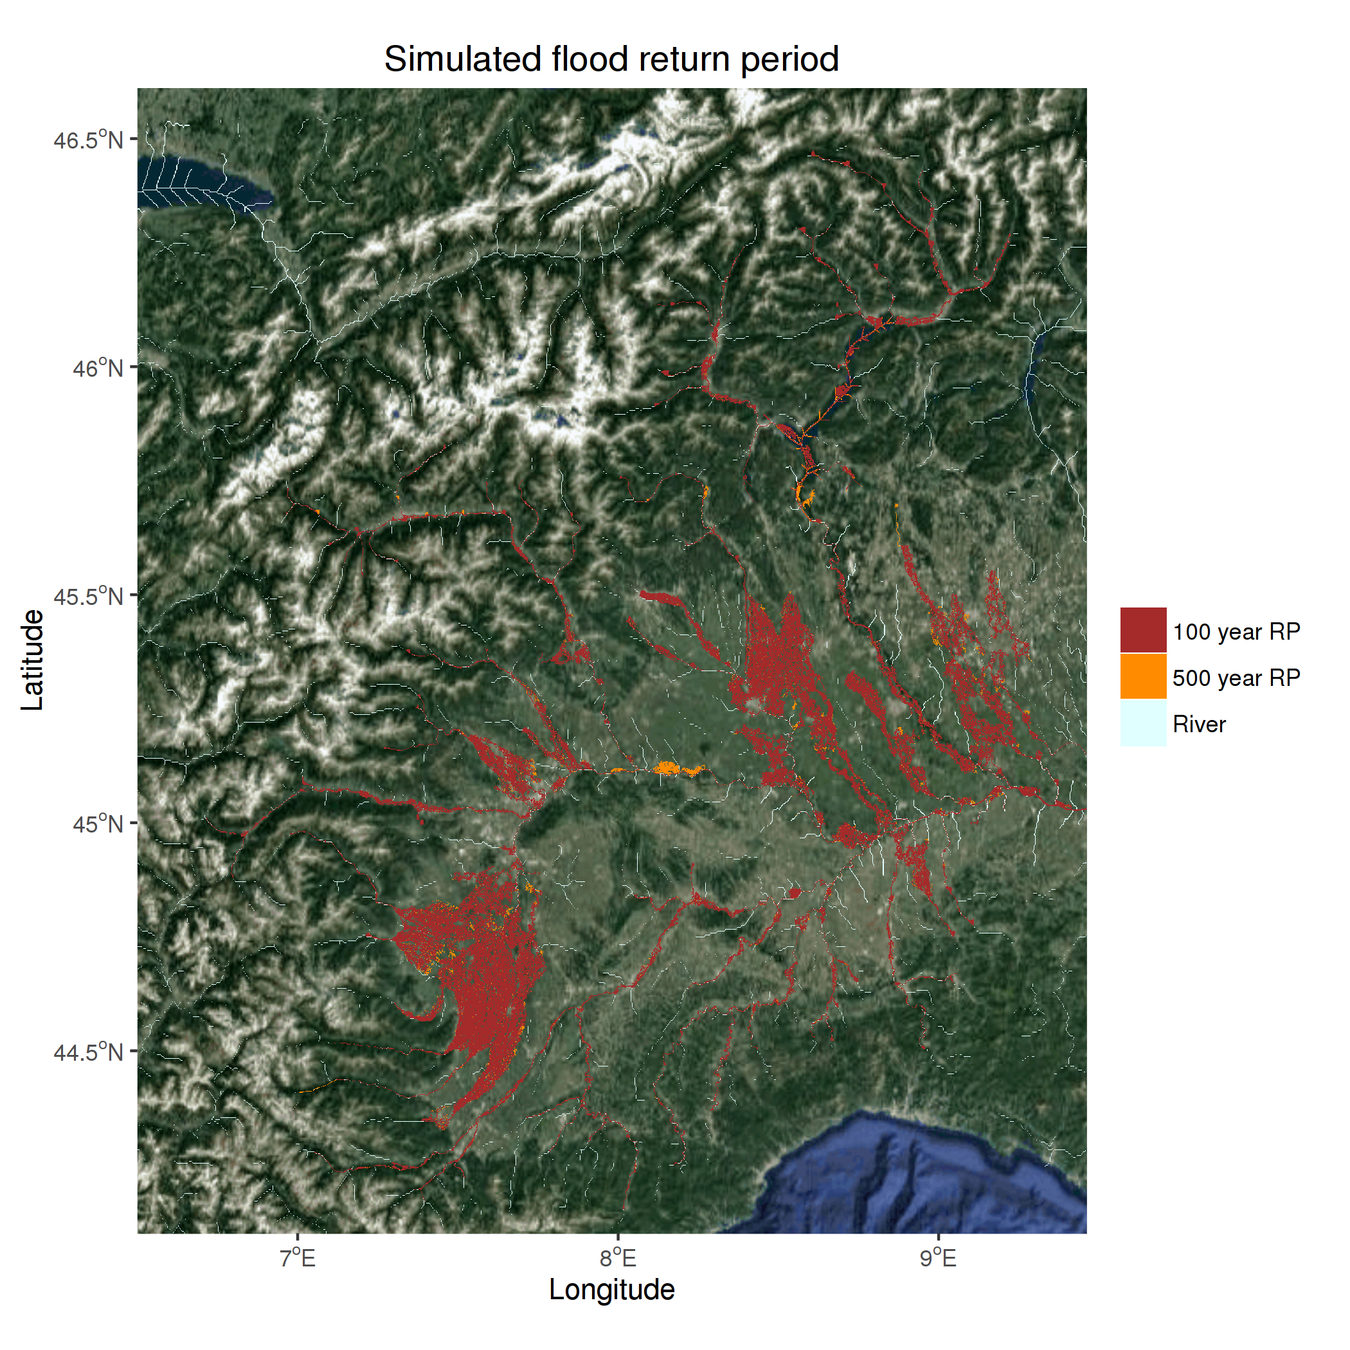
Problems!
- Excessive flooding in low RPs
- Not enough difference between RPs
Solutions?
- Higher resolution (~50m)
- Better DEMs (HydroSHEDS)
- ?
6.0 - Visualization
An R/Leaflet tool for flood, river, DEM, basin and station visualization
6.1 - Visualization
Click_edit: an R/Shiny tool for WYSISYG editing of NetCDF files

7 - Validation

Conferences and papers for 2015-2016
- EGU General Assembly, Vienna 2016, oral presentation
- ICRC CORDEX, Stockholm 2016
- ICTP RegCM Workshop, Trieste 2016, oral presentation
- EMS Annual Meeting, Trieste 2016, oral presentation
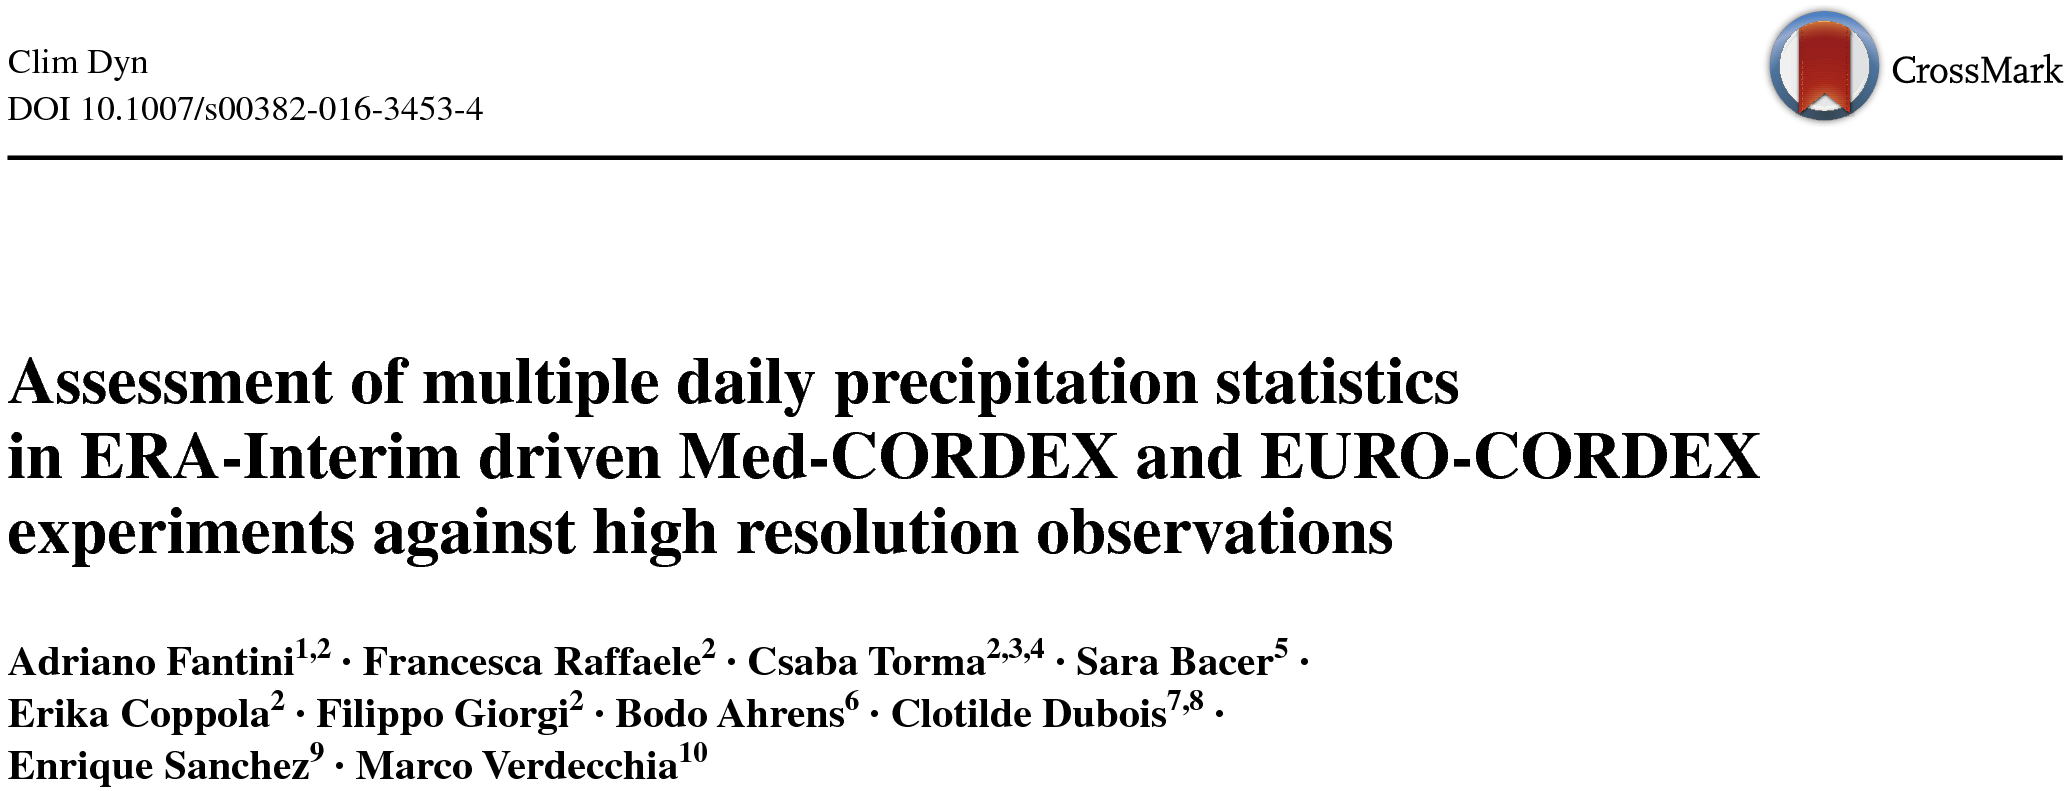
- Assessment of multiple daily precipitation statistics in ERA-Interim driven Med-CORDEX and EURO-CORDEX experiments against high resolution observations; A. Fantini, F. Raffaele,
-
The European mountain cryosphere: A review of past, current and future issues; M. Beninston et al.; The cryosphere; in review
Thanks for your attention!
Precipitation:
- Observations
- RCM output
Gridded netCDF:
- River network
- Discharges
hydrological model
For each RP, cell:
- Gumbel distr
- Hydrographs
Statistical RP analysis
LISFLOOD-FP model
For each RP, cell:
- Flood extent
- Flood depth
(multiple simulations)
- RCM output
- Discharges
- Past floods
Validation for
ESFM 2015-2016 report (I year)
By odineidolon
ESFM 2015-2016 report (I year)
Presentation for I year of PhD, 15 min


