First steps in flood risk assessment over Italy in a climate change scenario
Adriano Fantini
3rd year PhD Course in Earth Science, Fluid Dynamics, and Mathematics
Supervisor: Erika Coppola
ADRIANO.FANTINI@phd.units.it
Aims
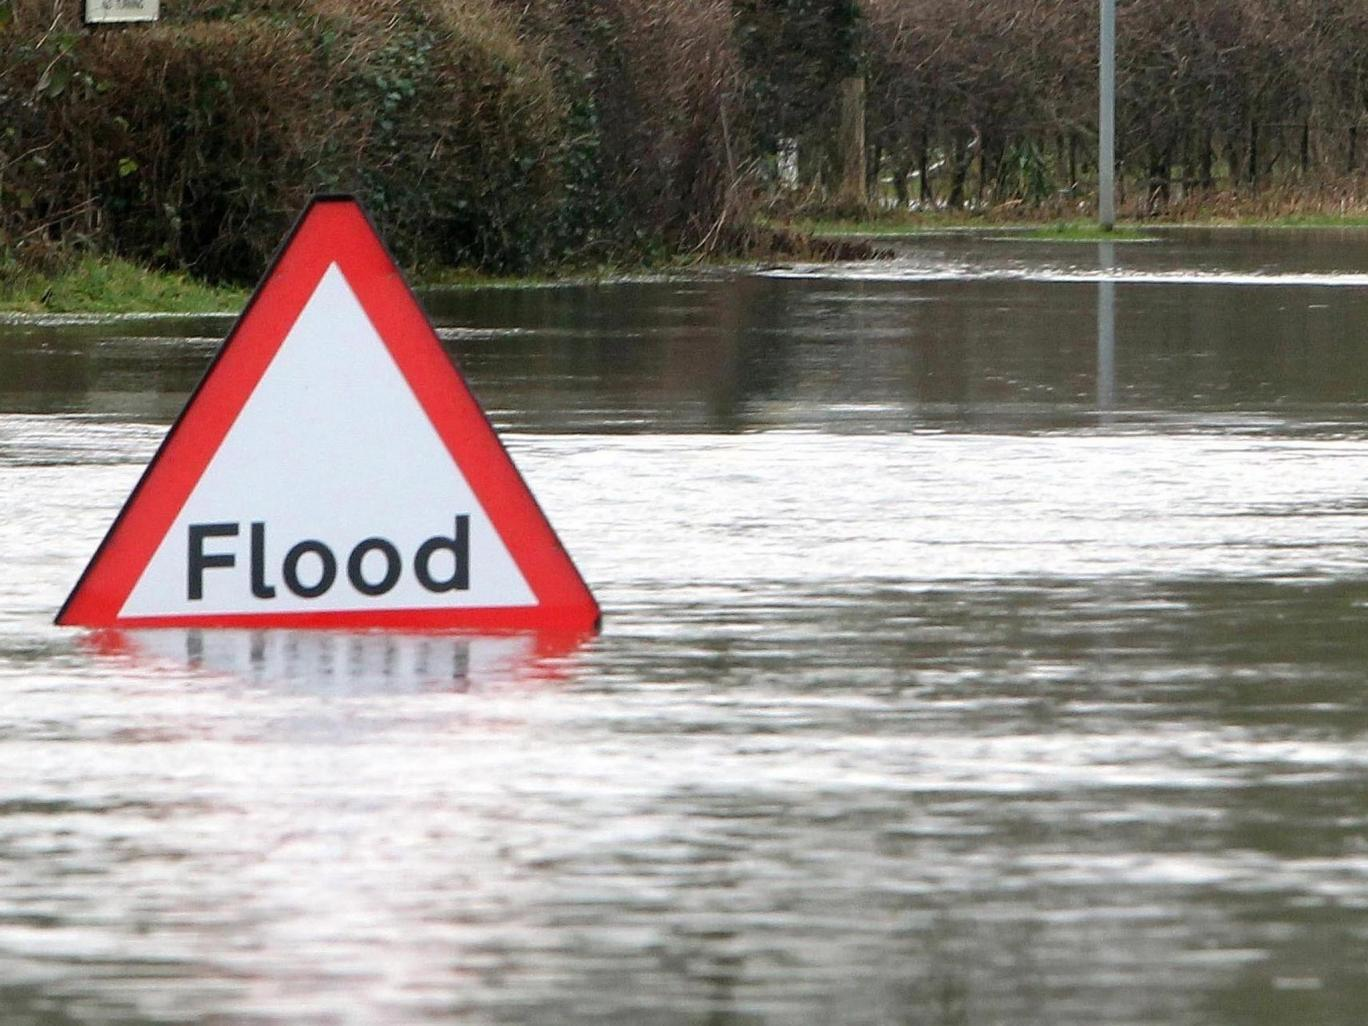
- Flood risk mapping over Italy
- scientific, reliable approach
- future projections
Models
- ICTP RegCM and other Regional Climate Models
- CHyM hydrological model
- CA2D hydraulic model
Project overview
Participants
- Erika Coppola
- Rita Nogherotto
- Filippo Giorgi
- Adriano Fantini
- Francesca Raffaele
Methodology
Precipitation:
- Observations
- RCM output
Gridded netCDF:
- River network
- Discharges
hydrological model

For each RP, cell:
- Gumbel distr
- Hydrographs
Statistical RP analysis
CA2D model
For each RP, cell:
- Flood extent
- Flood depth
(multiple simulations)
- RCM output
- Discharges
- Past floods
Validation for

1.0 - Observations
We have access to several Italian observational datasets provided by the University of L'Aquila for:
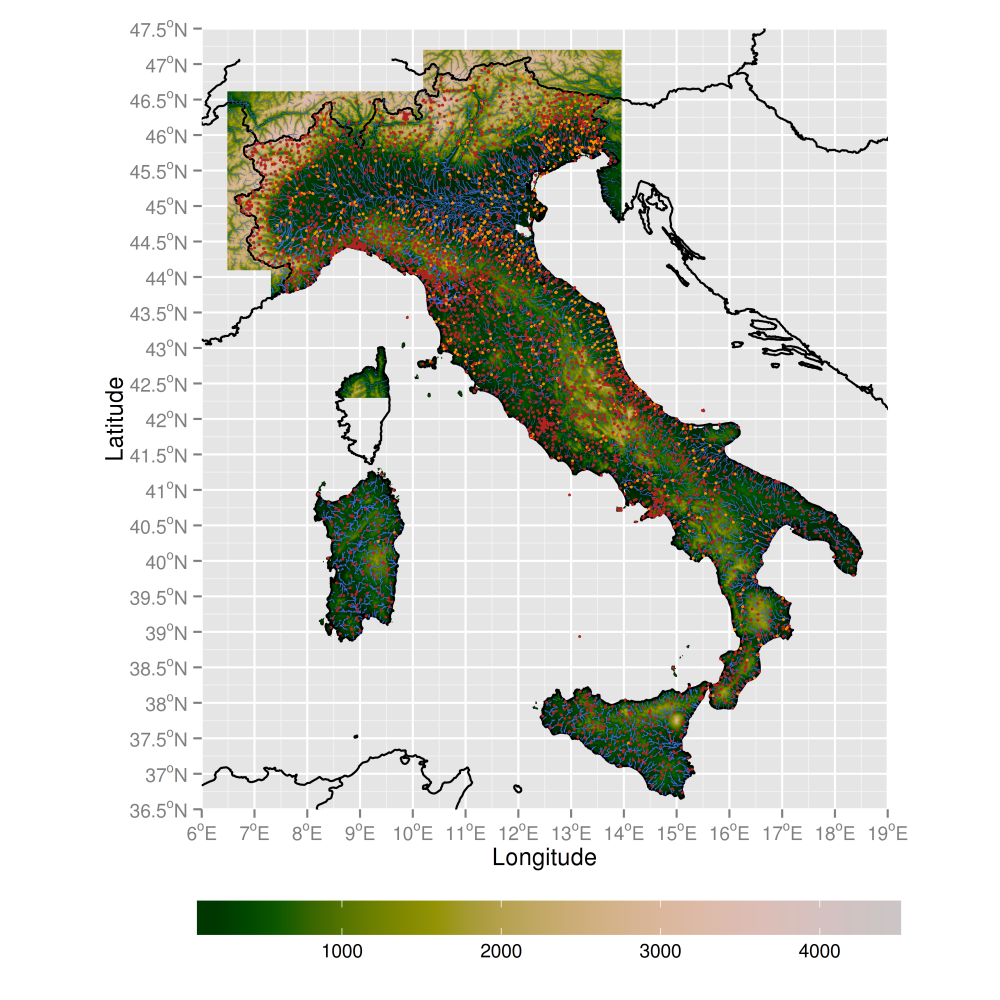
- temperature
- precipitation
- water level
- discharge
1.1 - Observations
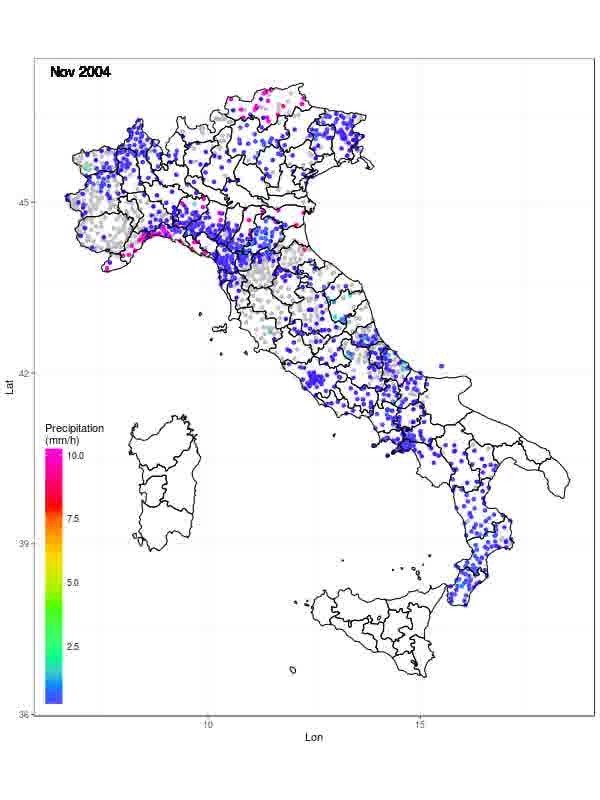
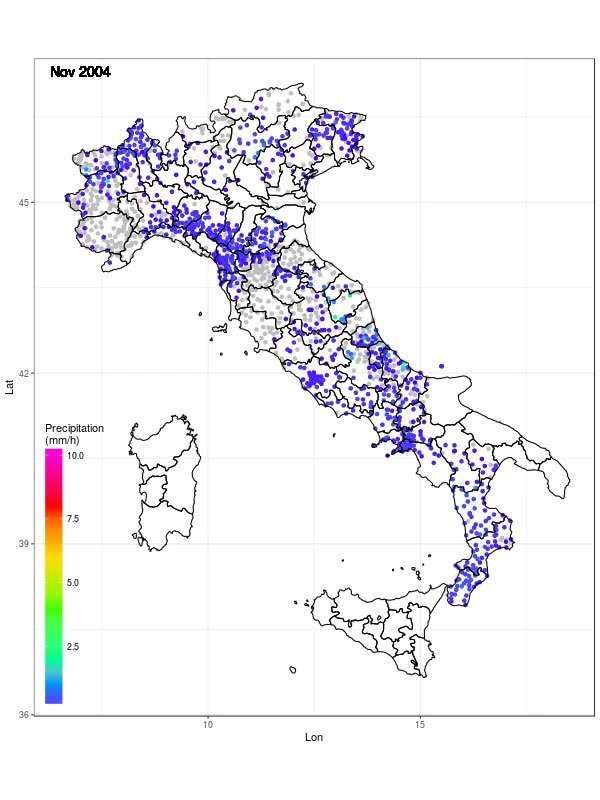
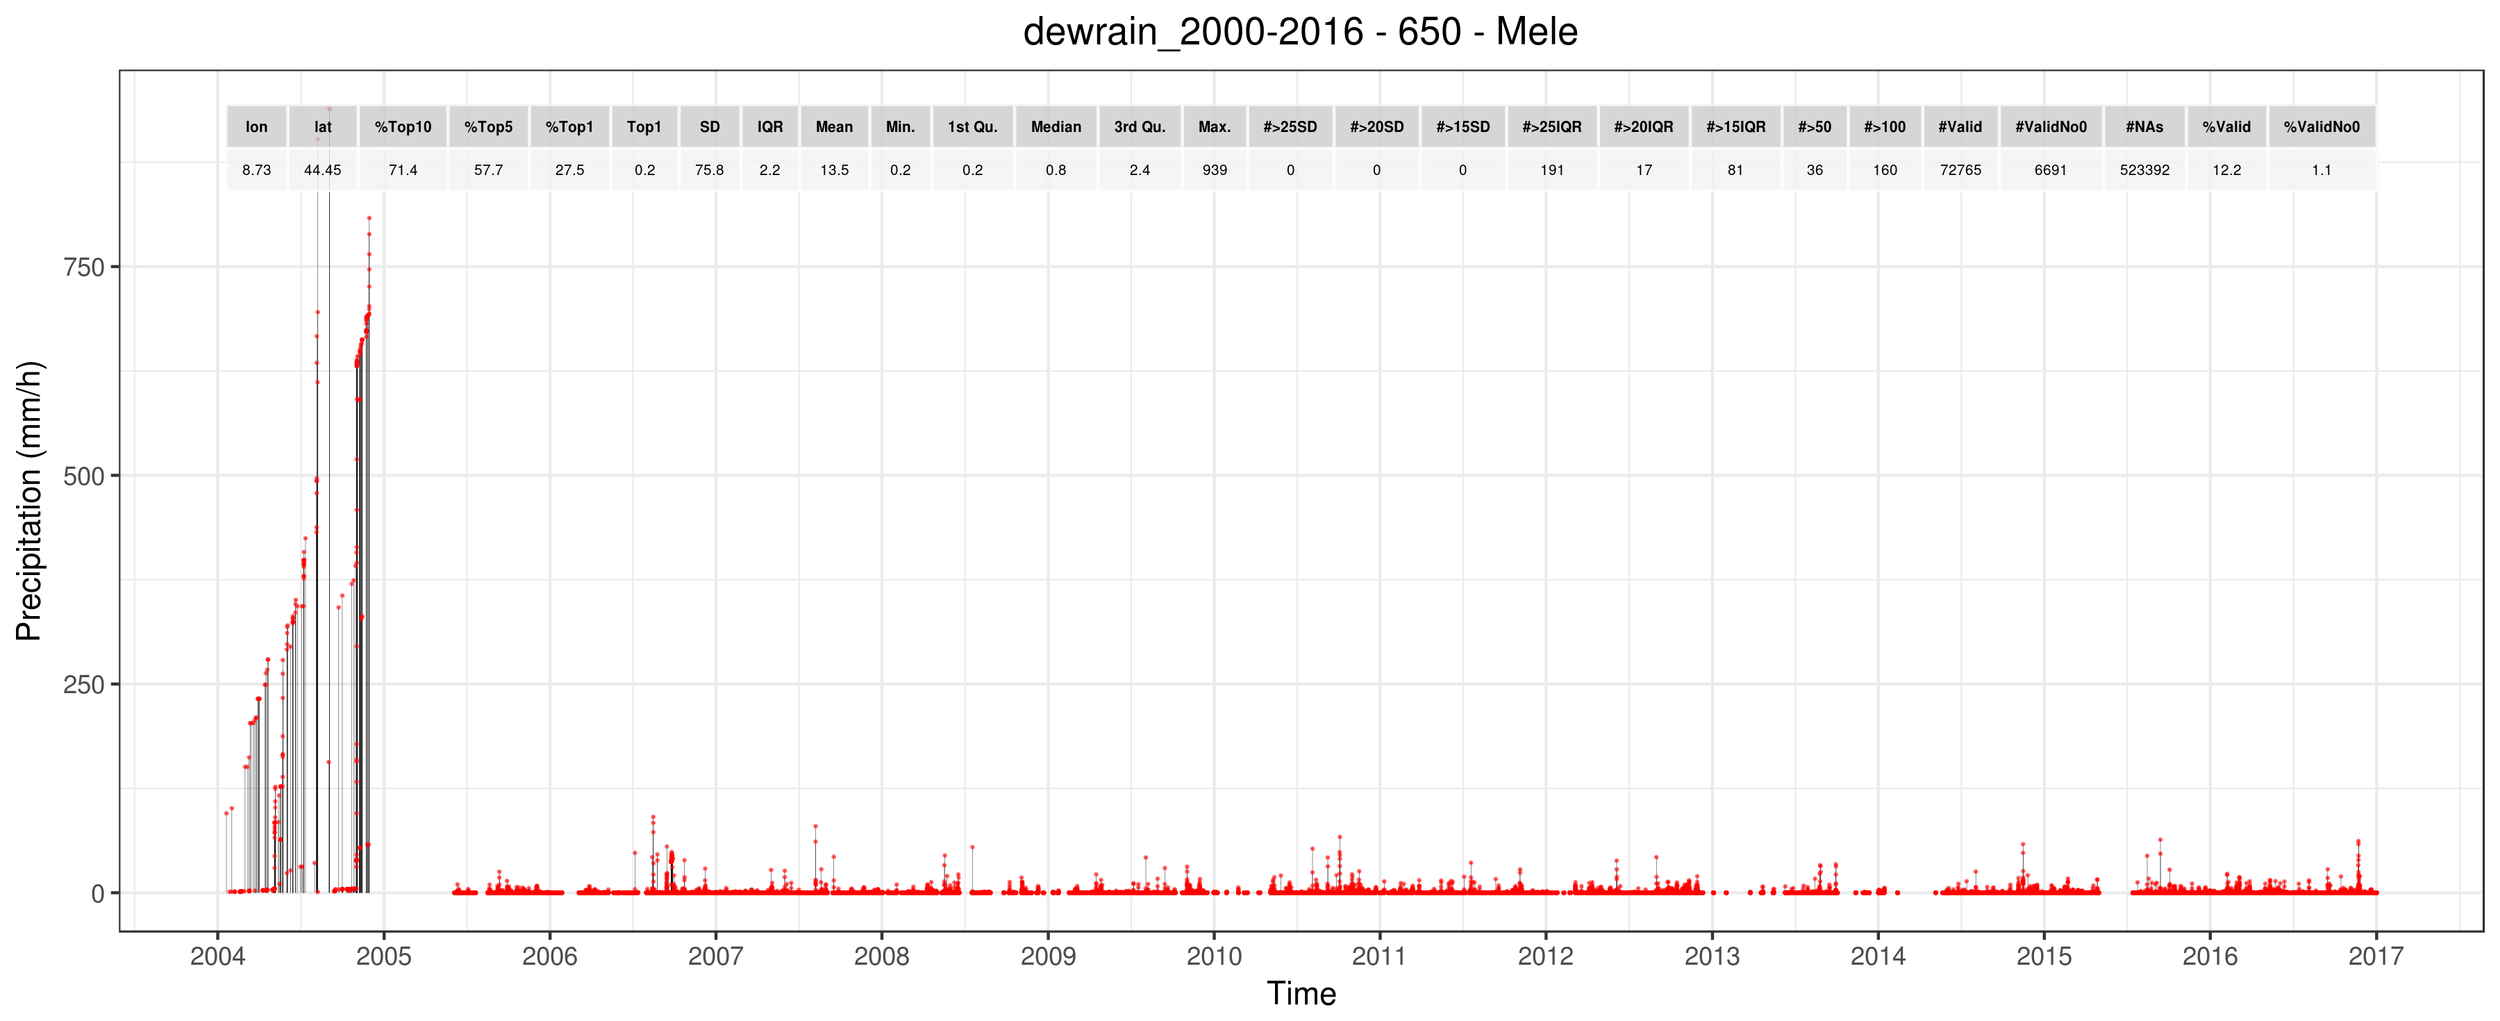
Some examples...
Outliers
1.2 - Observations
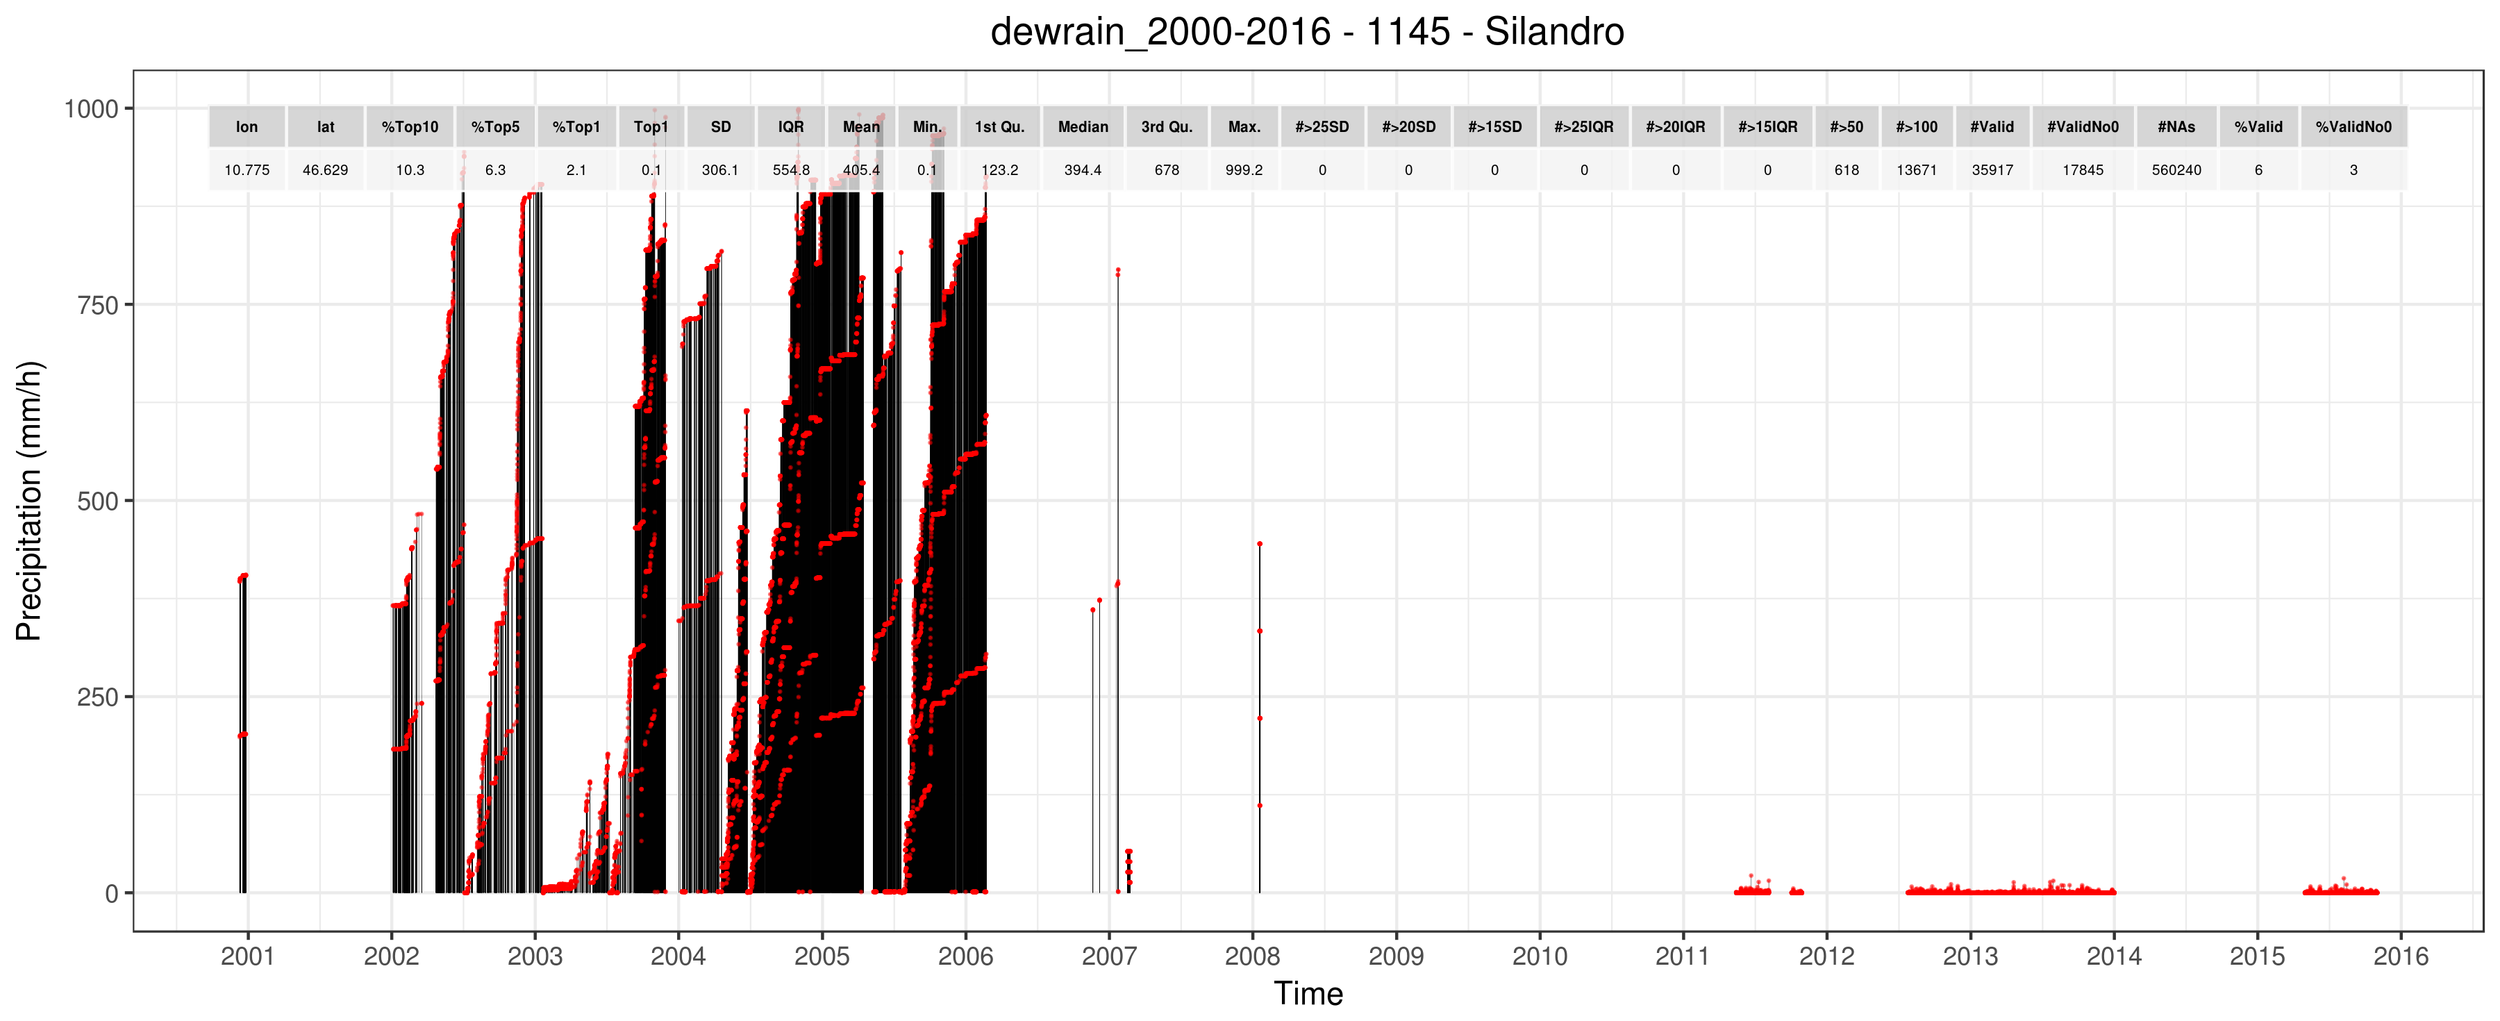
FIRST-STAGE FILTERING
FLAGGING
FLAG CHECKING
CLEANED DATASET!
1.3 - Observations
Presented at HyMeX workshop; Barcelona, 2017
Possible first-stage filtering procedures
- Removal of extreme values > 200 mm/h
- Removal of isolated > 100 mm/h reports
- Removal of complete months with > 1800 mm (2.5 mm/h)
- Removal of continuous identical values
- ...?
Rauthe et al. 2013; A Central European precipitation climatology–Part I: Generation and validation of a high-resolution gridded daily data set (HYRAS)
Isotta et al. 2013; The climate of daily precipitation in the Alps: development and analysis of a high‐resolution grid dataset from pan‐Alpine rain‐gauge data
Perry et al., 2009; The generation of daily gridded datasets of temperature and rainfall for the UK
Hiebl et al., 2017; Daily precipitation grids for Austria since 1961—development and evaluation of a spatial dataset for hydroclimatic monitoring and modelling
1.4 - Observations
Possible flagging procedures
- Mean + n*SD threshold
- Median + n*IQR threshold
- Peaks in the values distribution
- Isolated dry/wet event flagging
- Low correlation of close stations
- ...?
Rauthe et al. 2013; A Central European precipitation climatology–Part I: Generation and validation of a high-resolution gridded daily data set (HYRAS)
Isotta et al. 2013; The climate of daily precipitation in the Alps: development and analysis of a high‐resolution grid dataset from pan‐Alpine rain‐gauge data
Perry et al., 2009; The generation of daily gridded datasets of temperature and rainfall for the UK
Hiebl et al., 2017; Daily precipitation grids for Austria since 1961—development and evaluation of a spatial dataset for hydroclimatic monitoring and modelling
1.5 - Observations
- Visual comparison of maps/videos
- Visual comparison of close timeseries
- Comparison with daily datasets (EURO4M-APGD, E-OBS, ...)
- Comparison with hourly datasets (PERSIANN, ...)
- ...?
Rauthe et al. 2013; A Central European precipitation climatology–Part I: Generation and validation of a high-resolution gridded daily data set (HYRAS)
Isotta et al. 2013; The climate of daily precipitation in the Alps: development and analysis of a high‐resolution grid dataset from pan‐Alpine rain‐gauge data
Perry et al., 2009; The generation of daily gridded datasets of temperature and rainfall for the UK
Hiebl et al., 2017; Daily precipitation grids for Austria since 1961—development and evaluation of a spatial dataset for hydroclimatic monitoring and modelling
Possible flag-checking procedures
1.6 - Observations
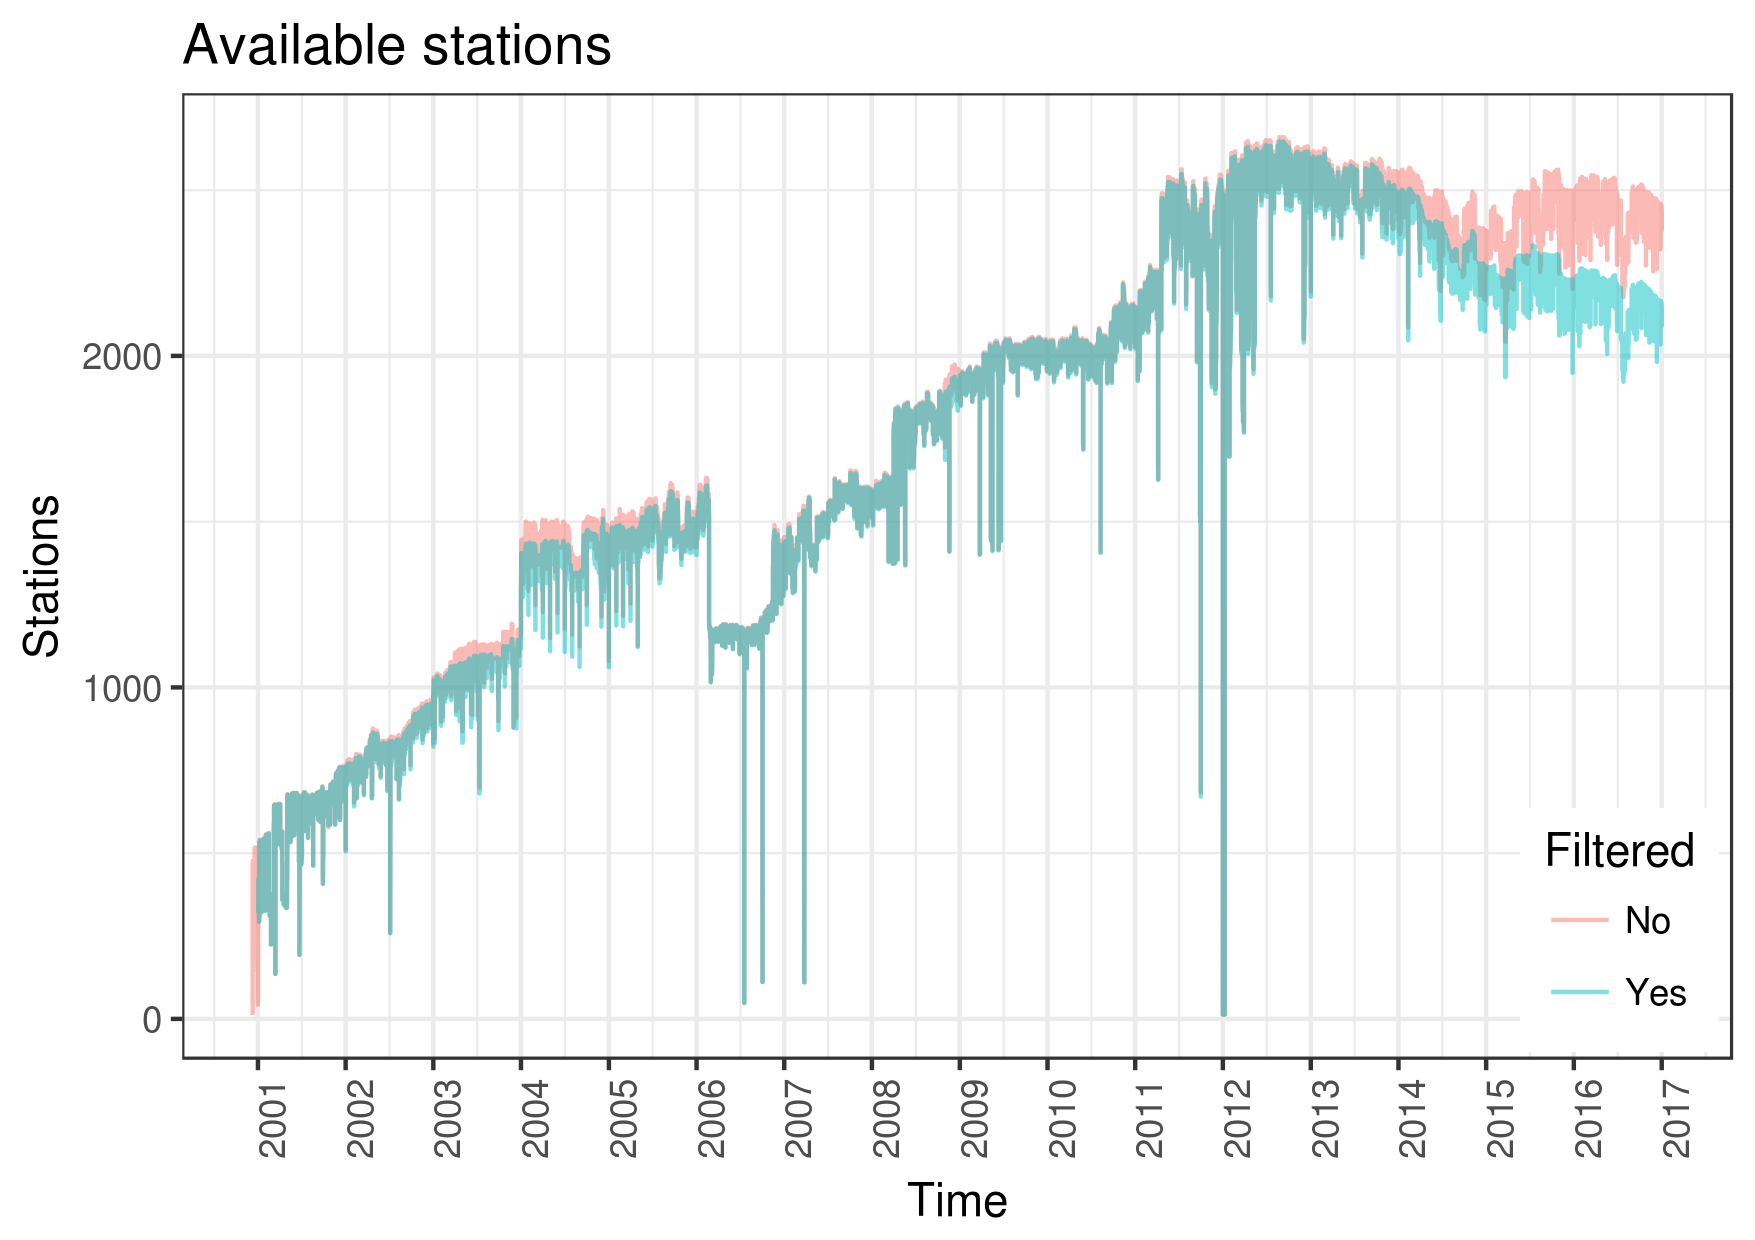
Results so far...
(by applying first-stage filtering procedures only)
| Before | After | Diff | |
|---|---|---|---|
| Total valid values | 250M | 243M | -2.6% |
| Total flags | 324468 | 58008 | -82.1% |
| pr > Mean + 20SD | 3240 | 2538 | -21.7% |
| pr > Median + 20IQR | 49753 | 22519 | -54.7% |
| pr > 100 mm/h | 221822 | 711 | -99.6% |
| Other softer flags | 49646 | 32240 | -35.1% |
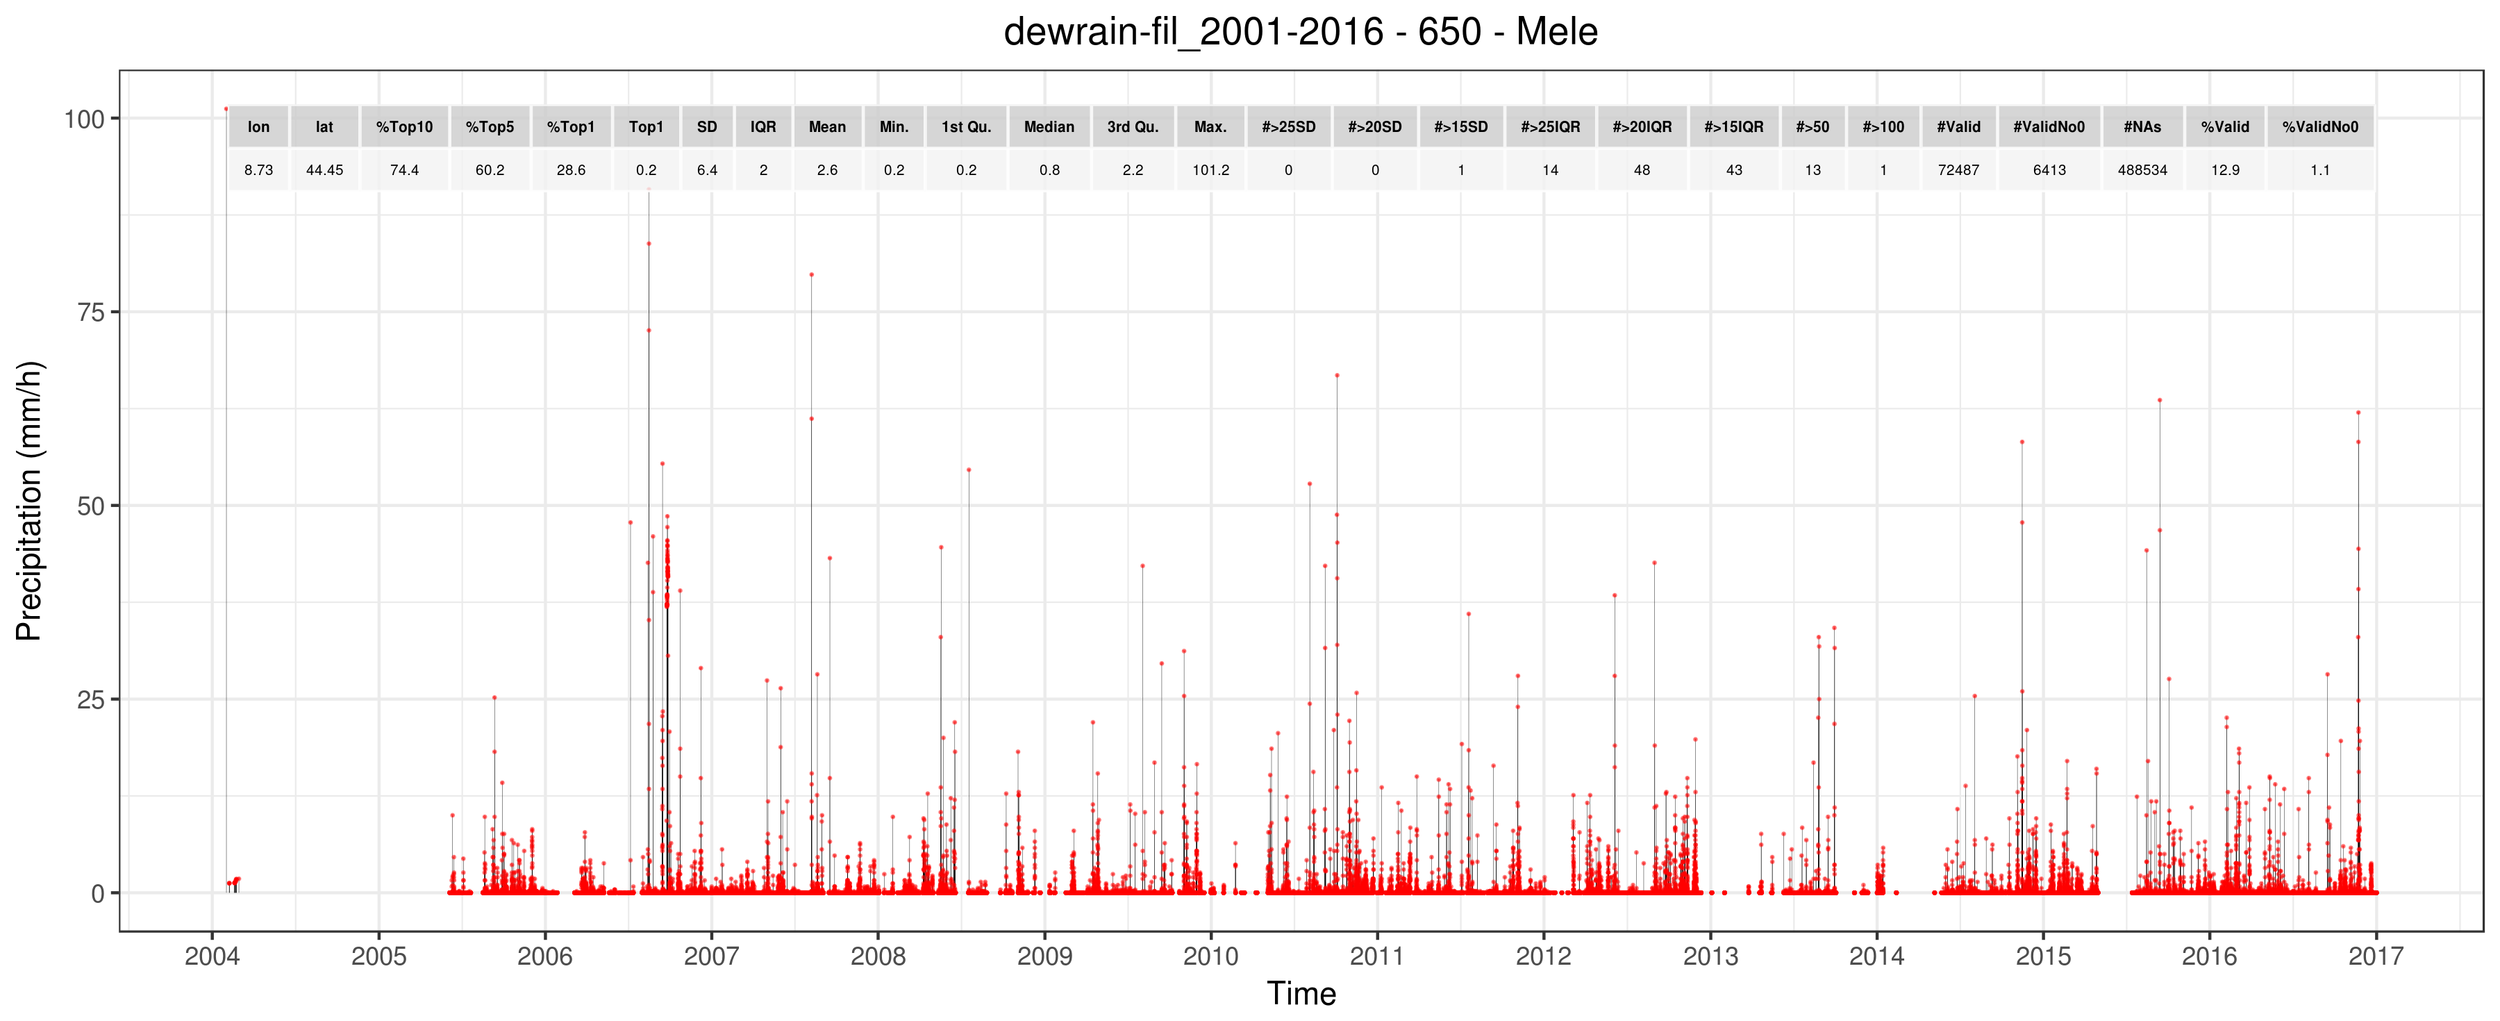
1.7 - Observations
FILTERED
ORIGINAL
1.8 - Observations
Monthly averages
1.10 - Observations
REMOVED!
1.9 - Observations
2.0 - Regional Climate Models
RCMs will be used later in the project to provide gridded input data to the CHyM hydrological model for future projections under climate change scenarios.
- Continue ongoing EURO-CORDEX simulations on Argo and on Marconi
- Test and validate post-processing scripts provided by eXact-lab (still ongoing)
2.1 - Regional Climate Models
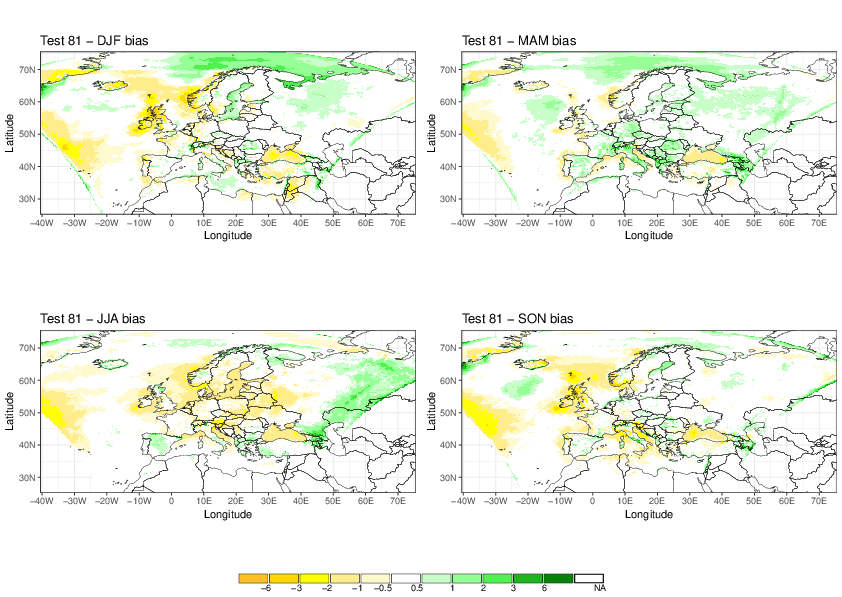
We have assessed the performance of 9 RCMs over 9 regions for precipitation:
- High resolution observations
- Several metrics, with focus on extreme precipitation
- We found consistent added value in higher-resolution modelling (12km vs 50km) for most regions and most models
2.2 - Regional Climate Models
I performed more than 100 model simulations over the EURO-CORDEX domain in both Argo and CINECA's Marconi A1/A2
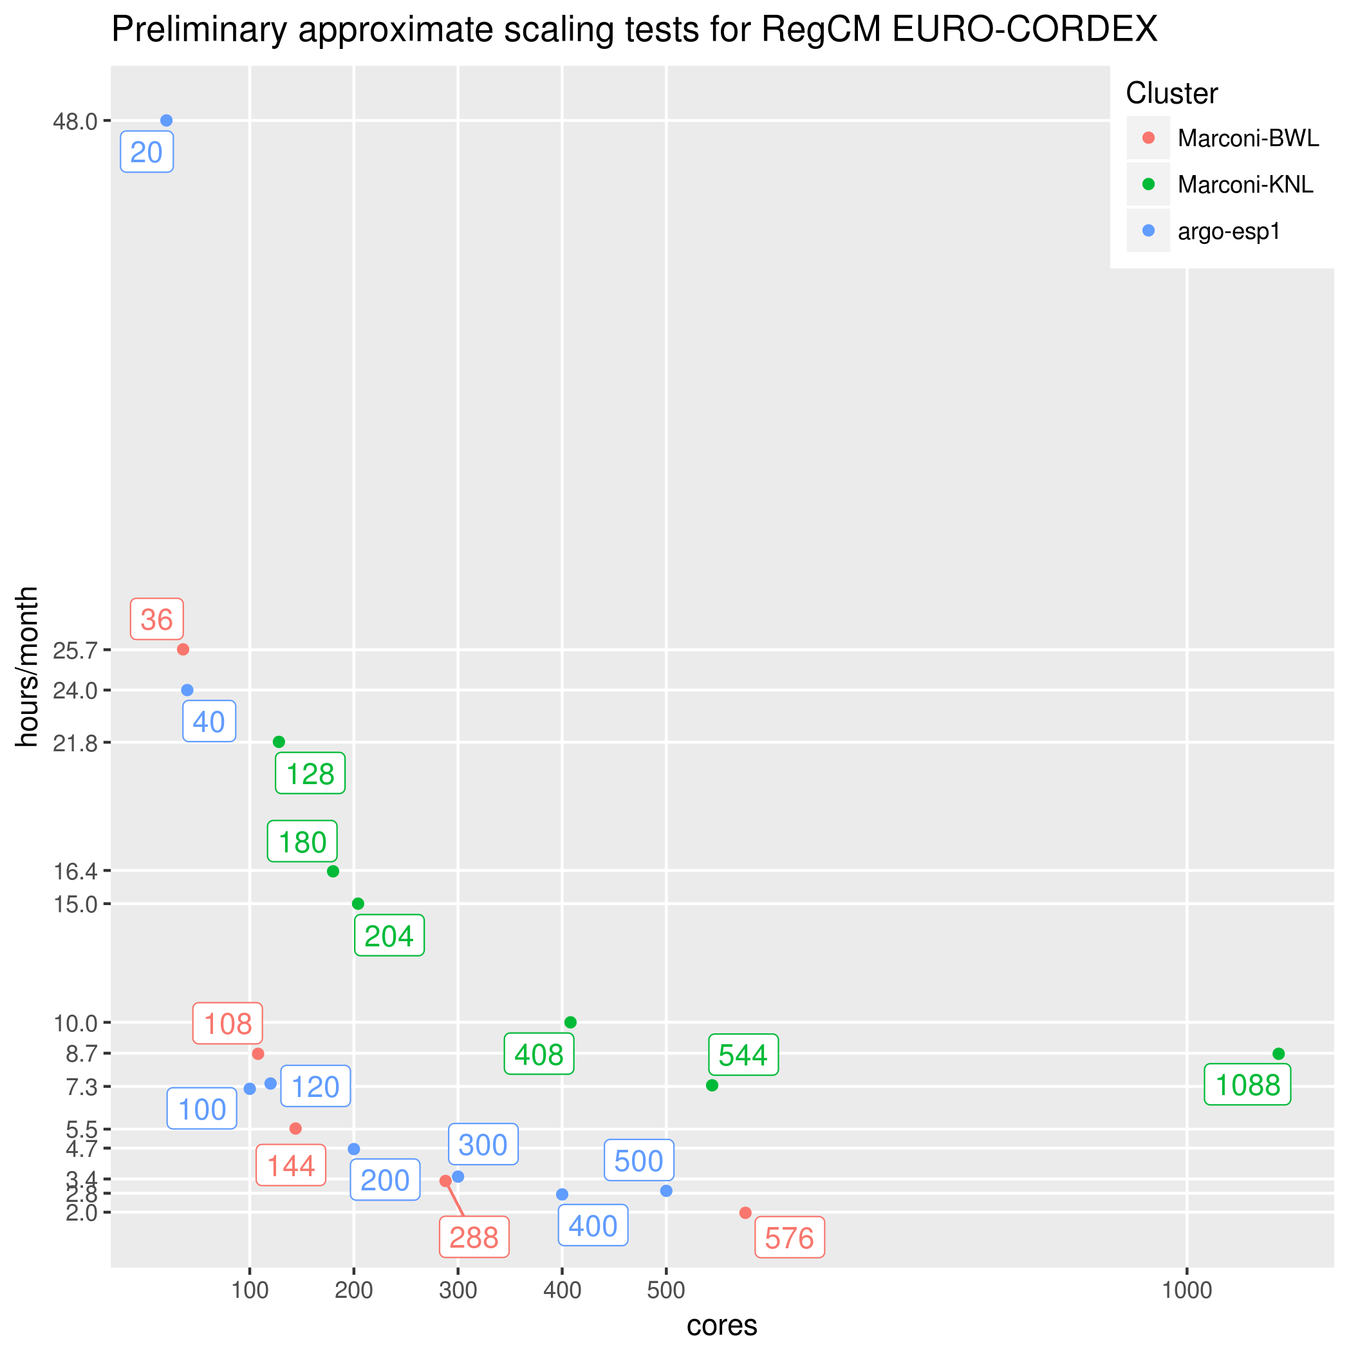
- Model tuning
- Performance assessment
- PRACE proposal 2016153590 approved
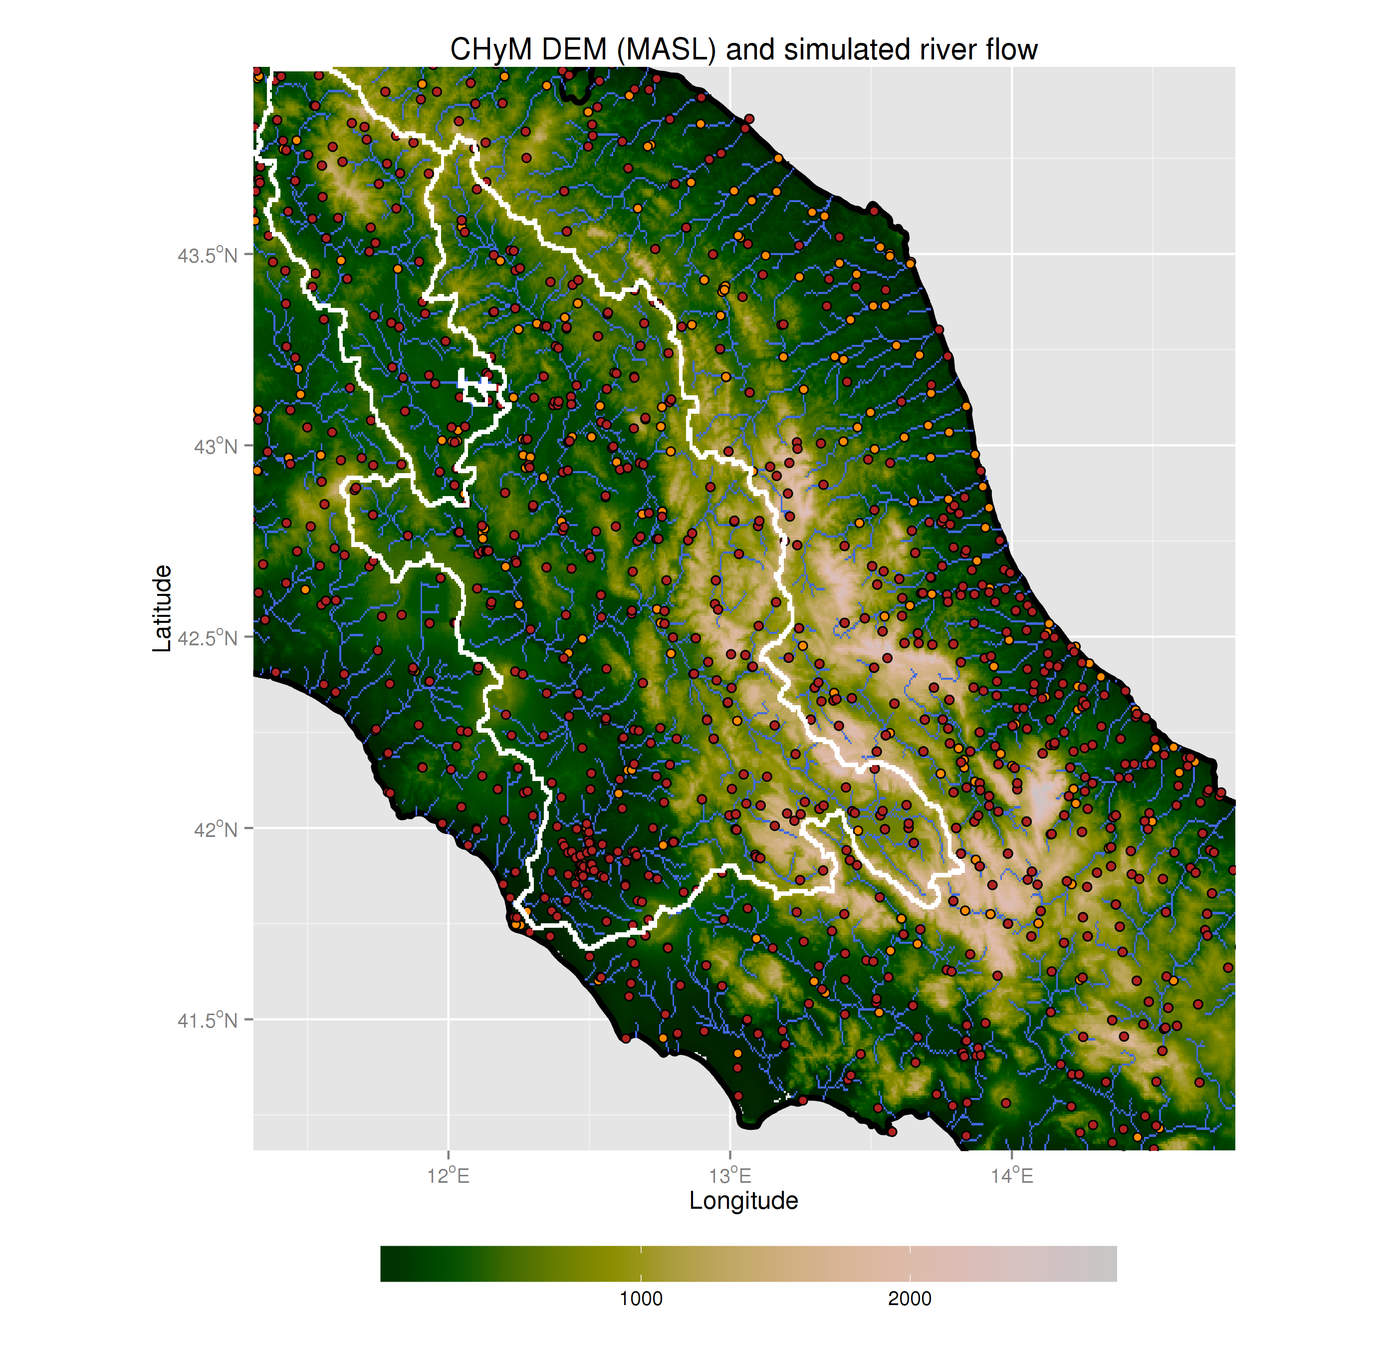
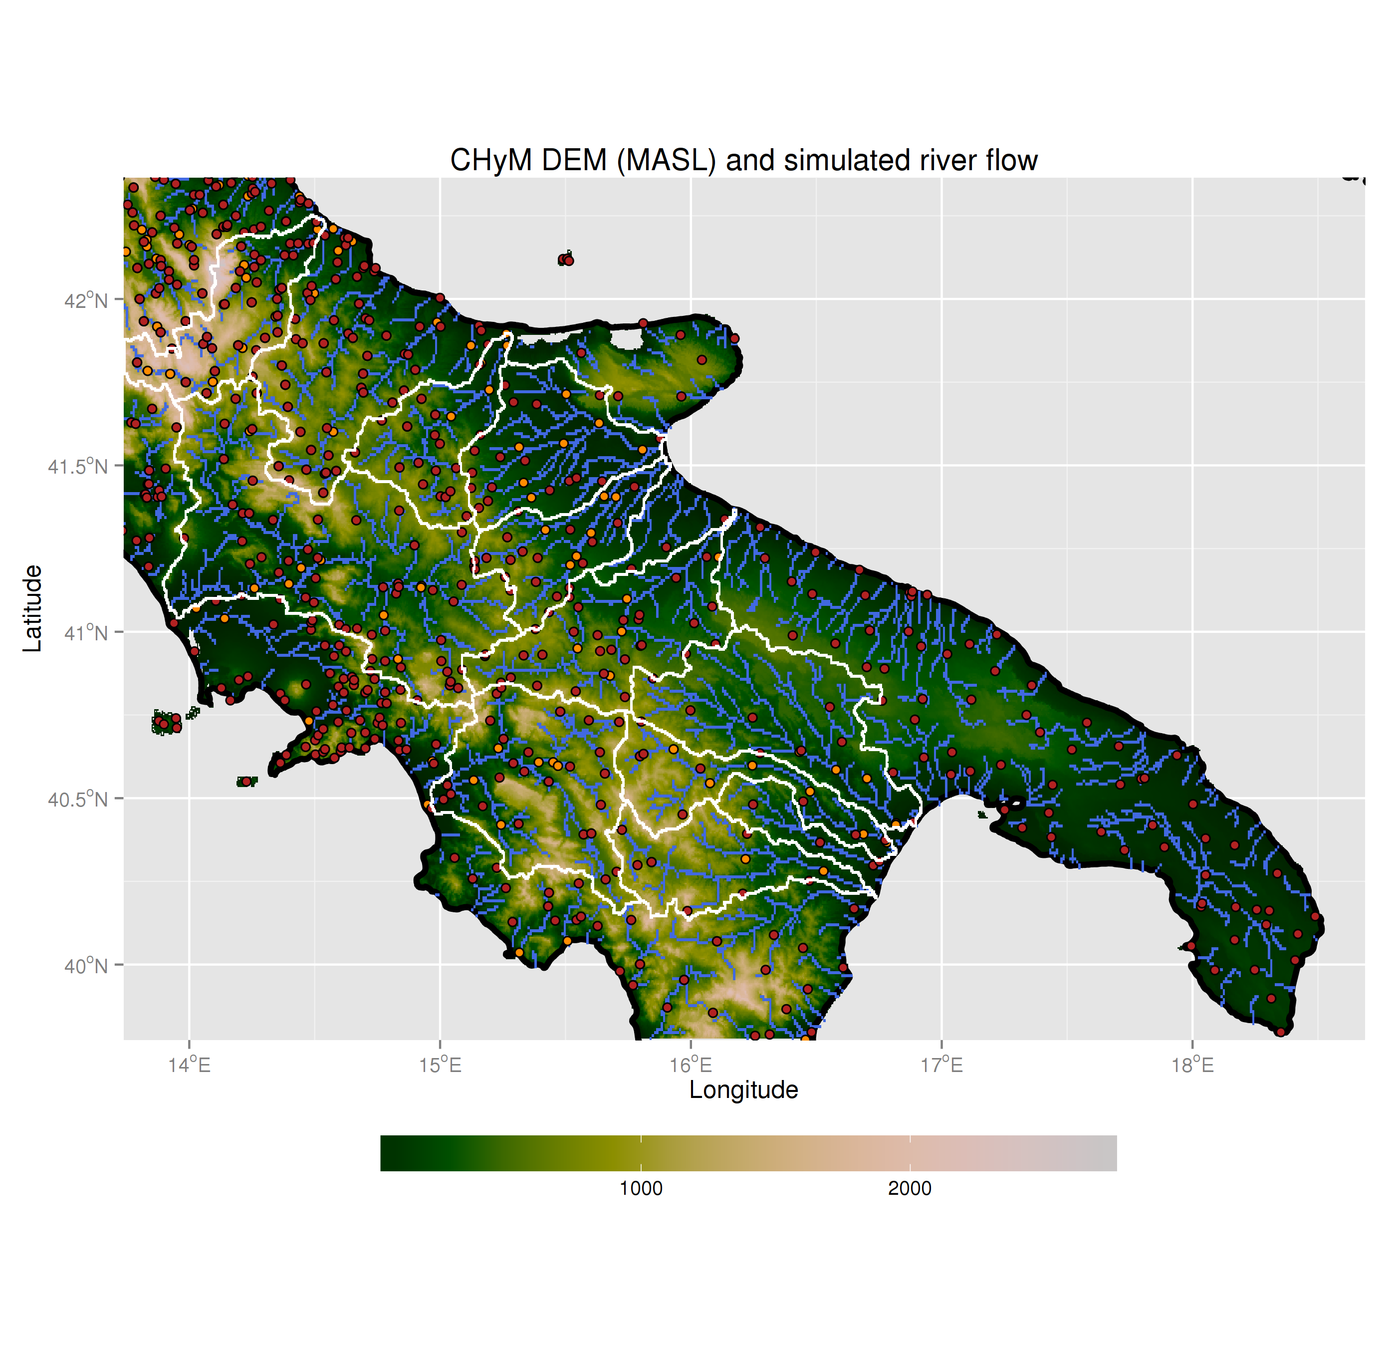
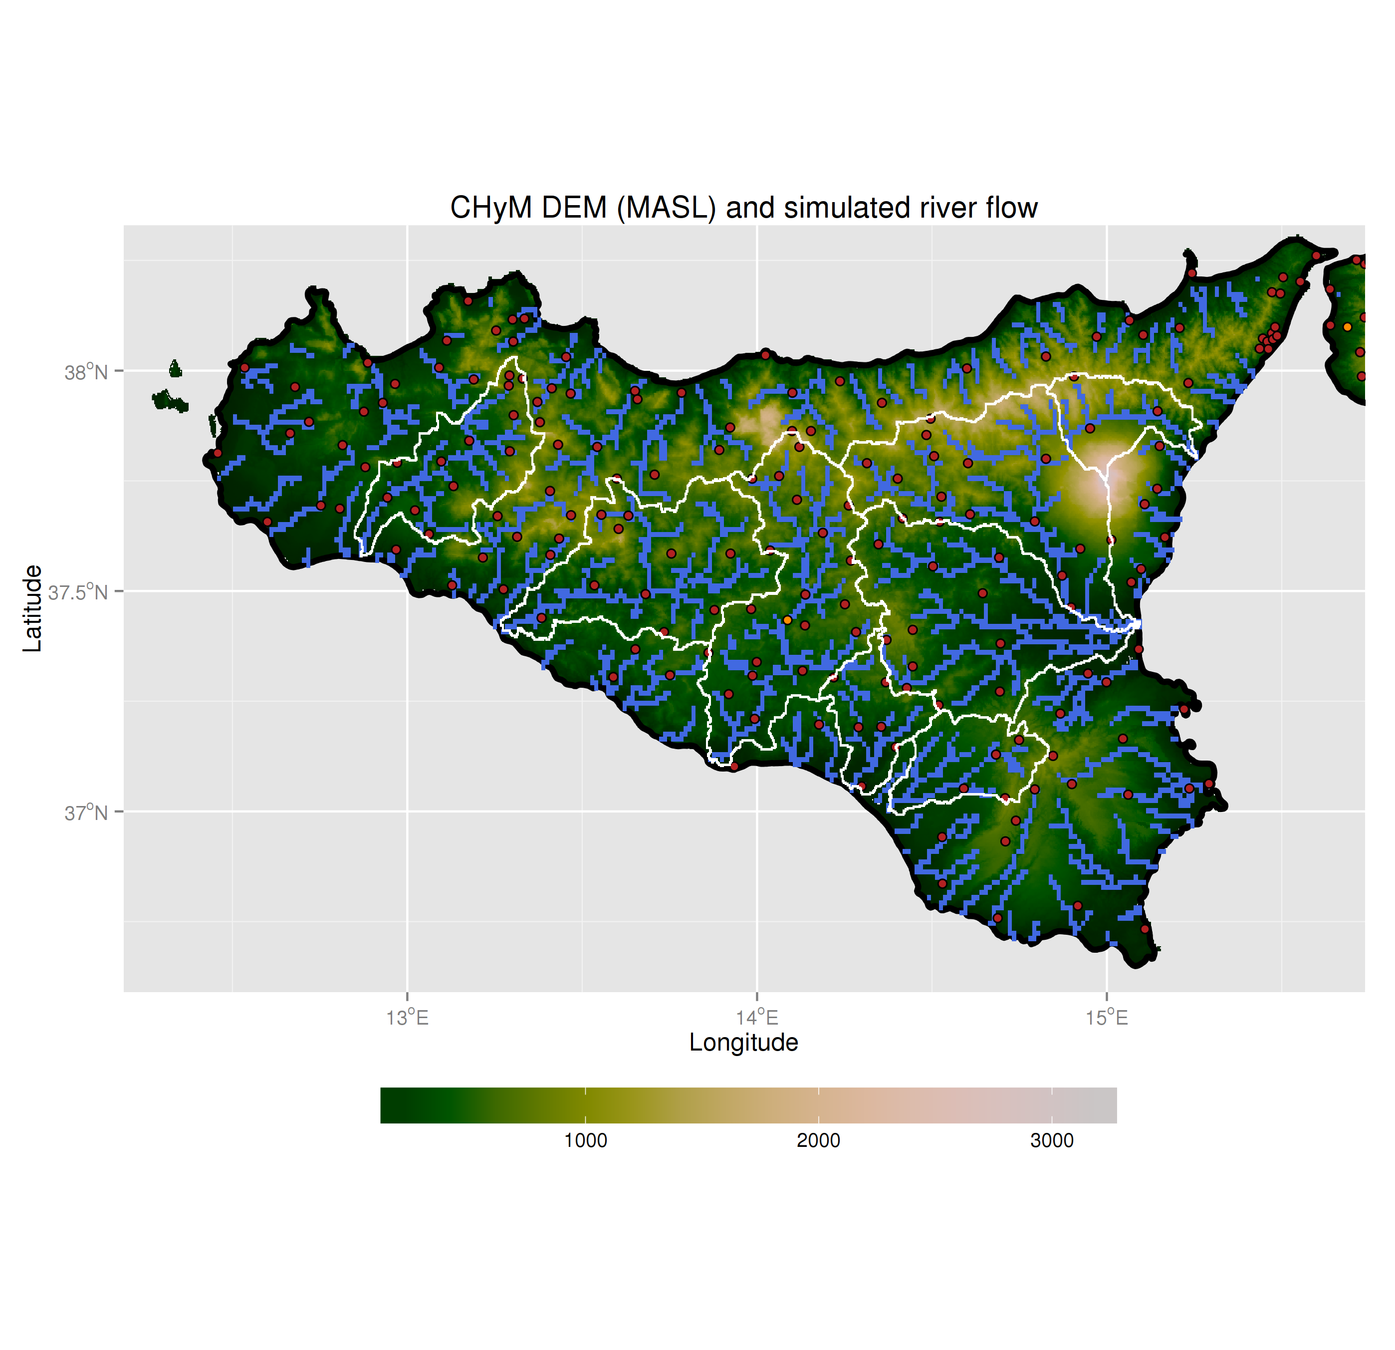
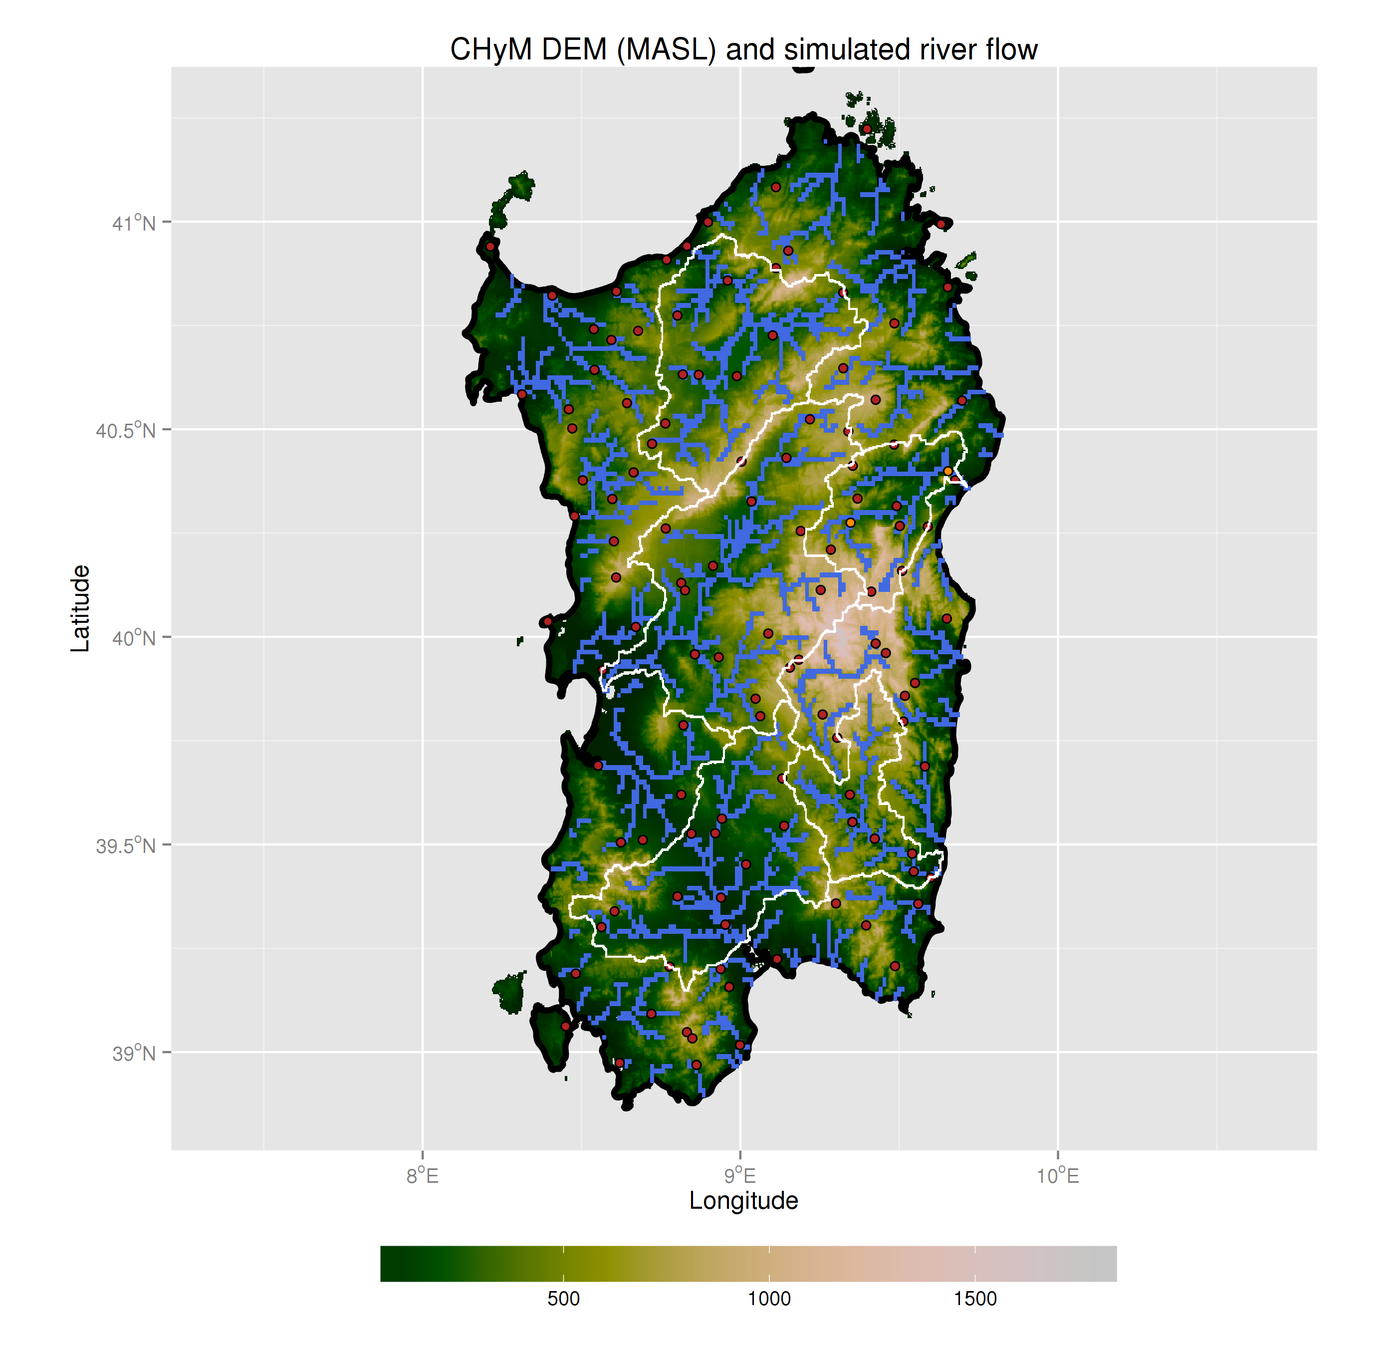
3.0 - Cetemps Hydrological Model
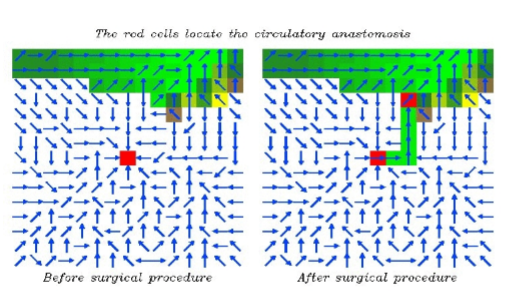
CHyM Is a distributed (gridded) hydrological model. Peculiarities:
- Can build DEM from various sources, smoothing by cellula automata algorithms
- Can use several kind of inputs, such as station observations, gridded model data, etc.
- Designed to work on any domain
- NetCDF output
3.1 - Cetemps Hydrological Model
Successes so far:
- Model now working on all test domains
- Model code and design has been streamlined (thanks to Fabio di Sante!)
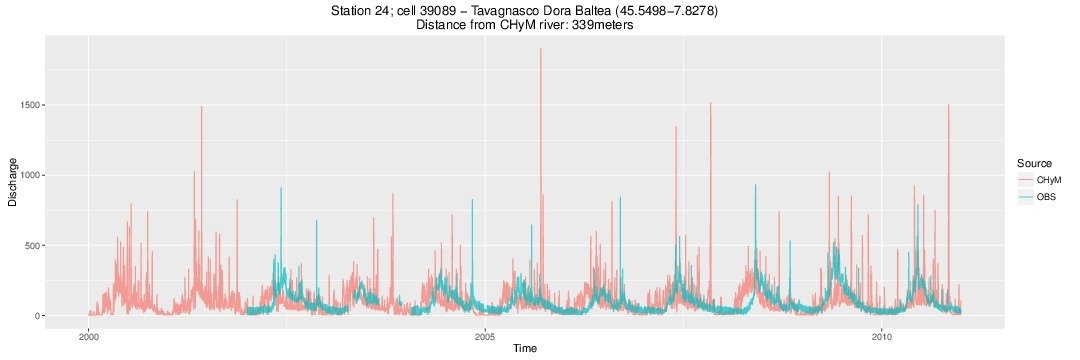
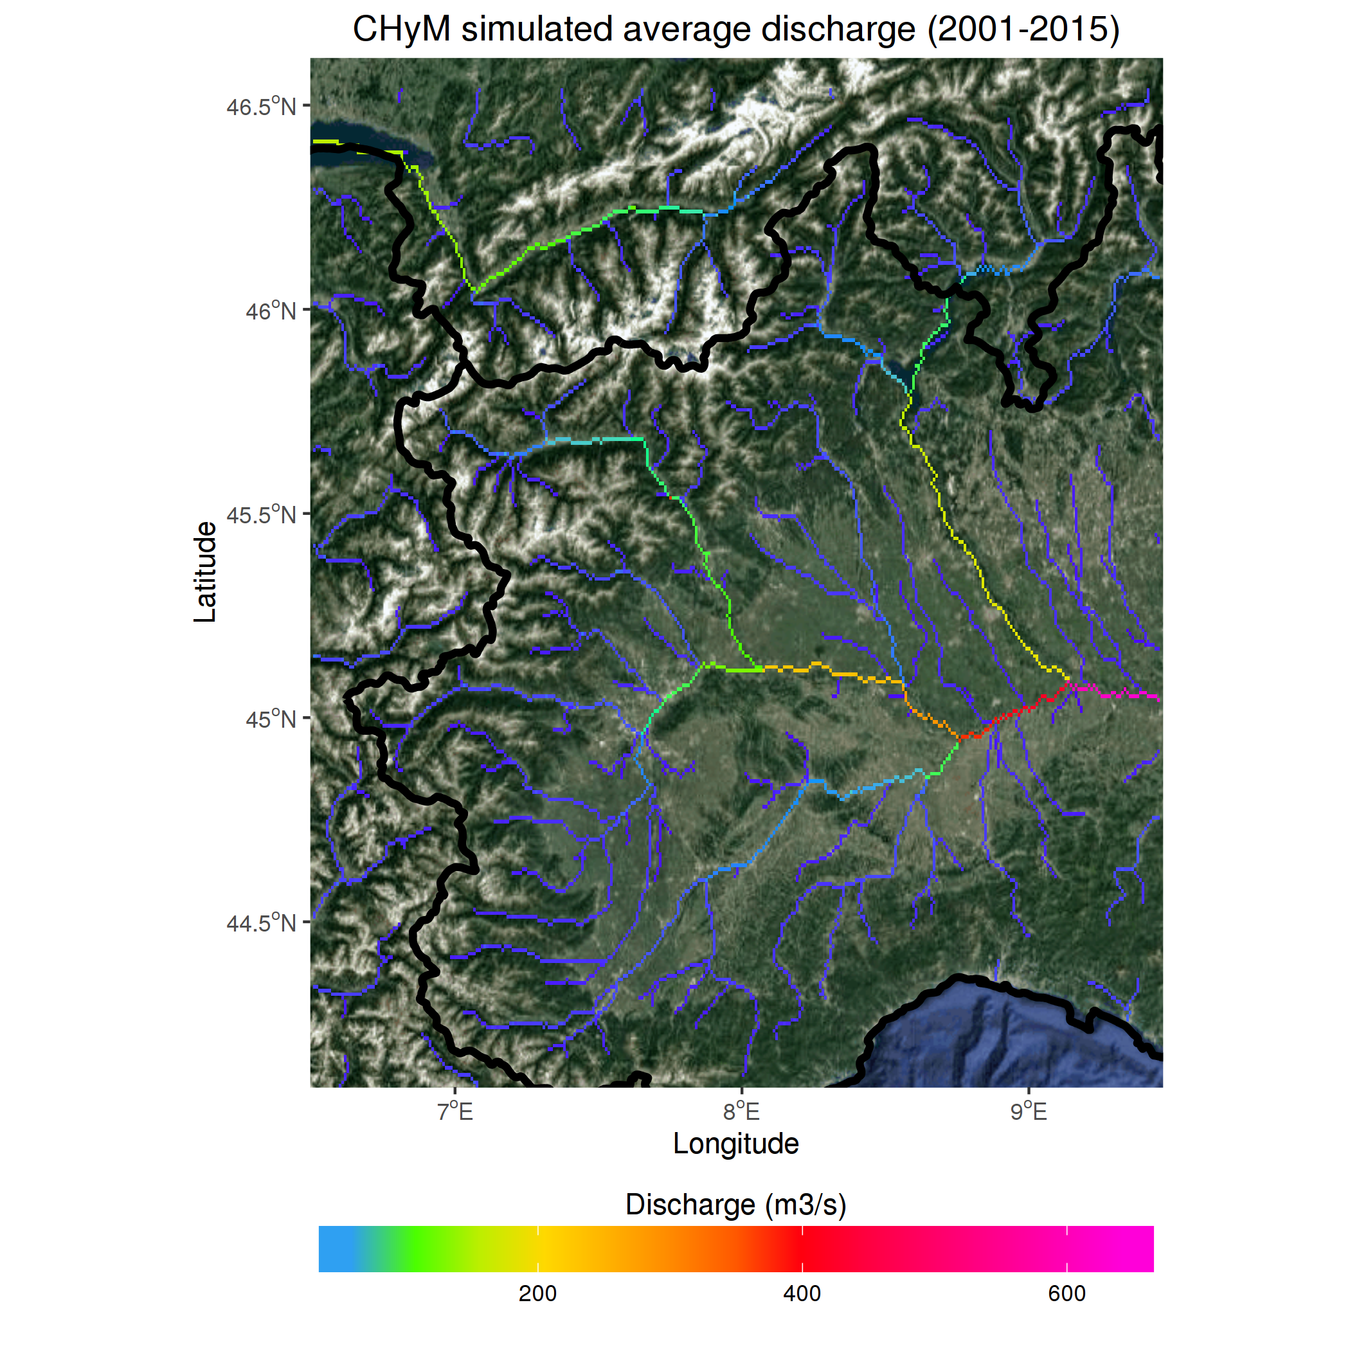
- We can reproduce past results (Coppola et al. 2013) on our test domain (western Po basin)
- HR DEMs working (at low model res)
3.2 - Cetemps Hydrological Model
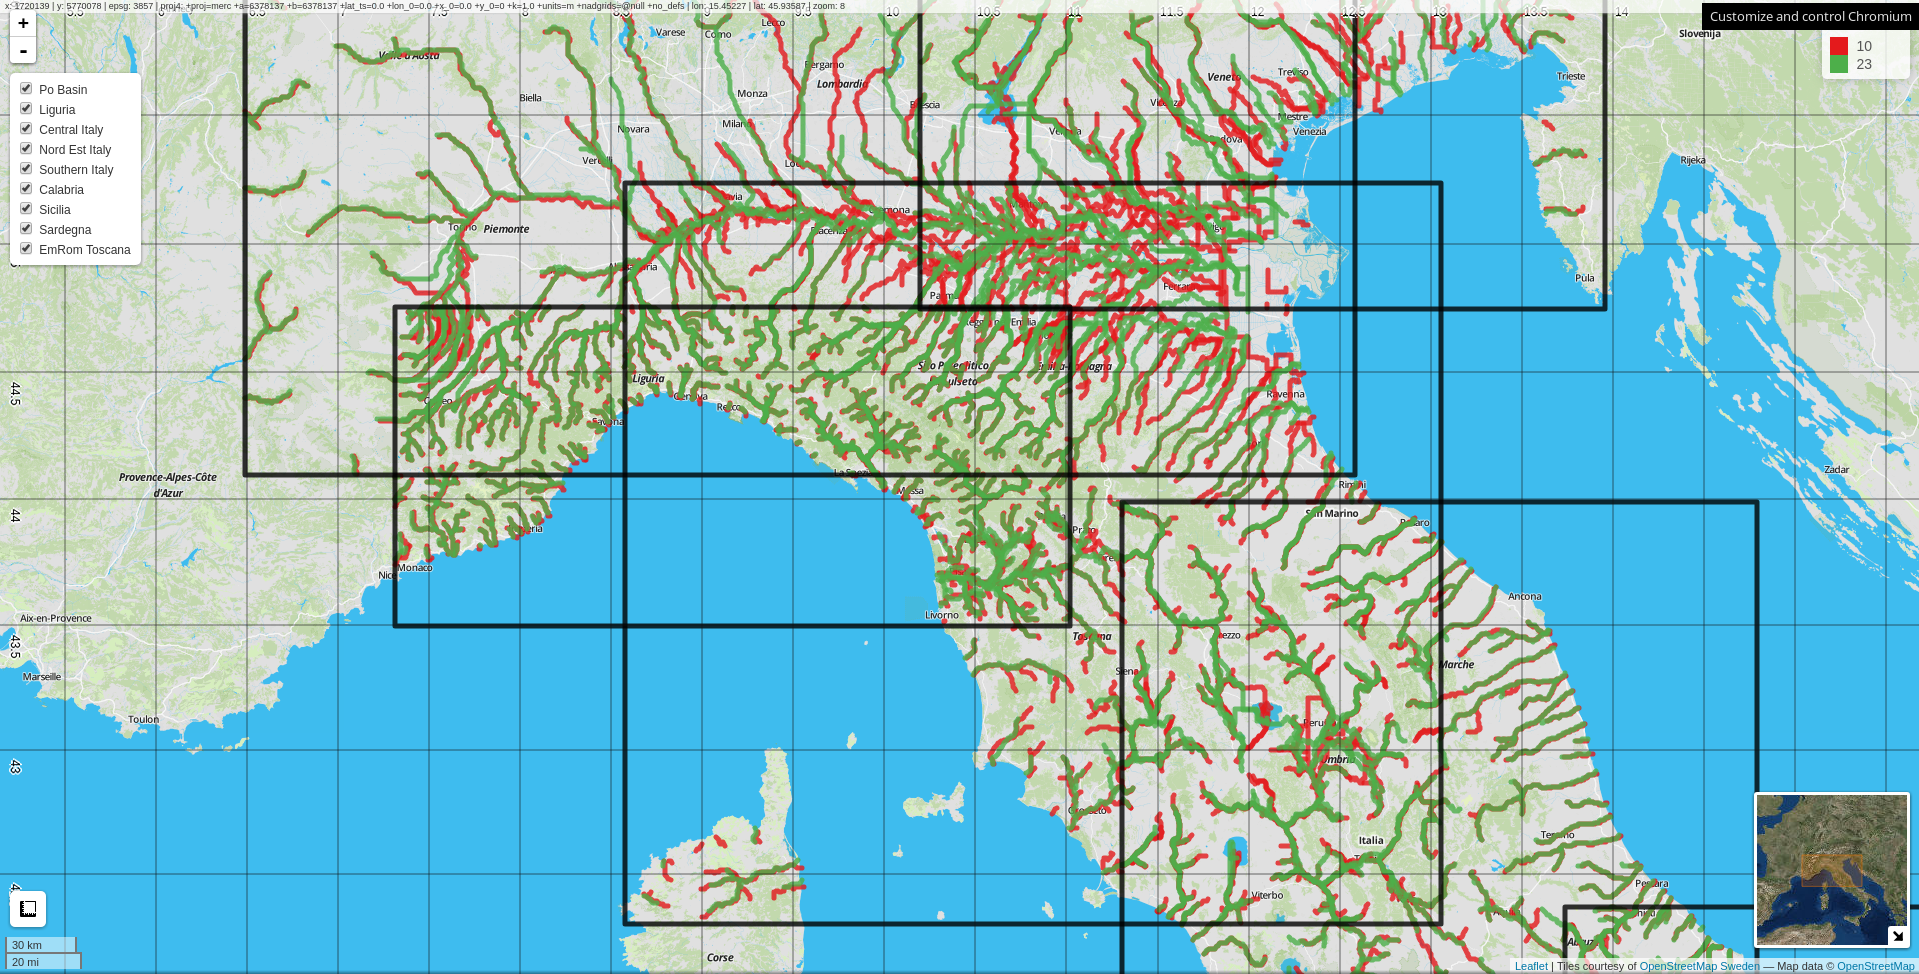
CHyM-OP reproduced domains:
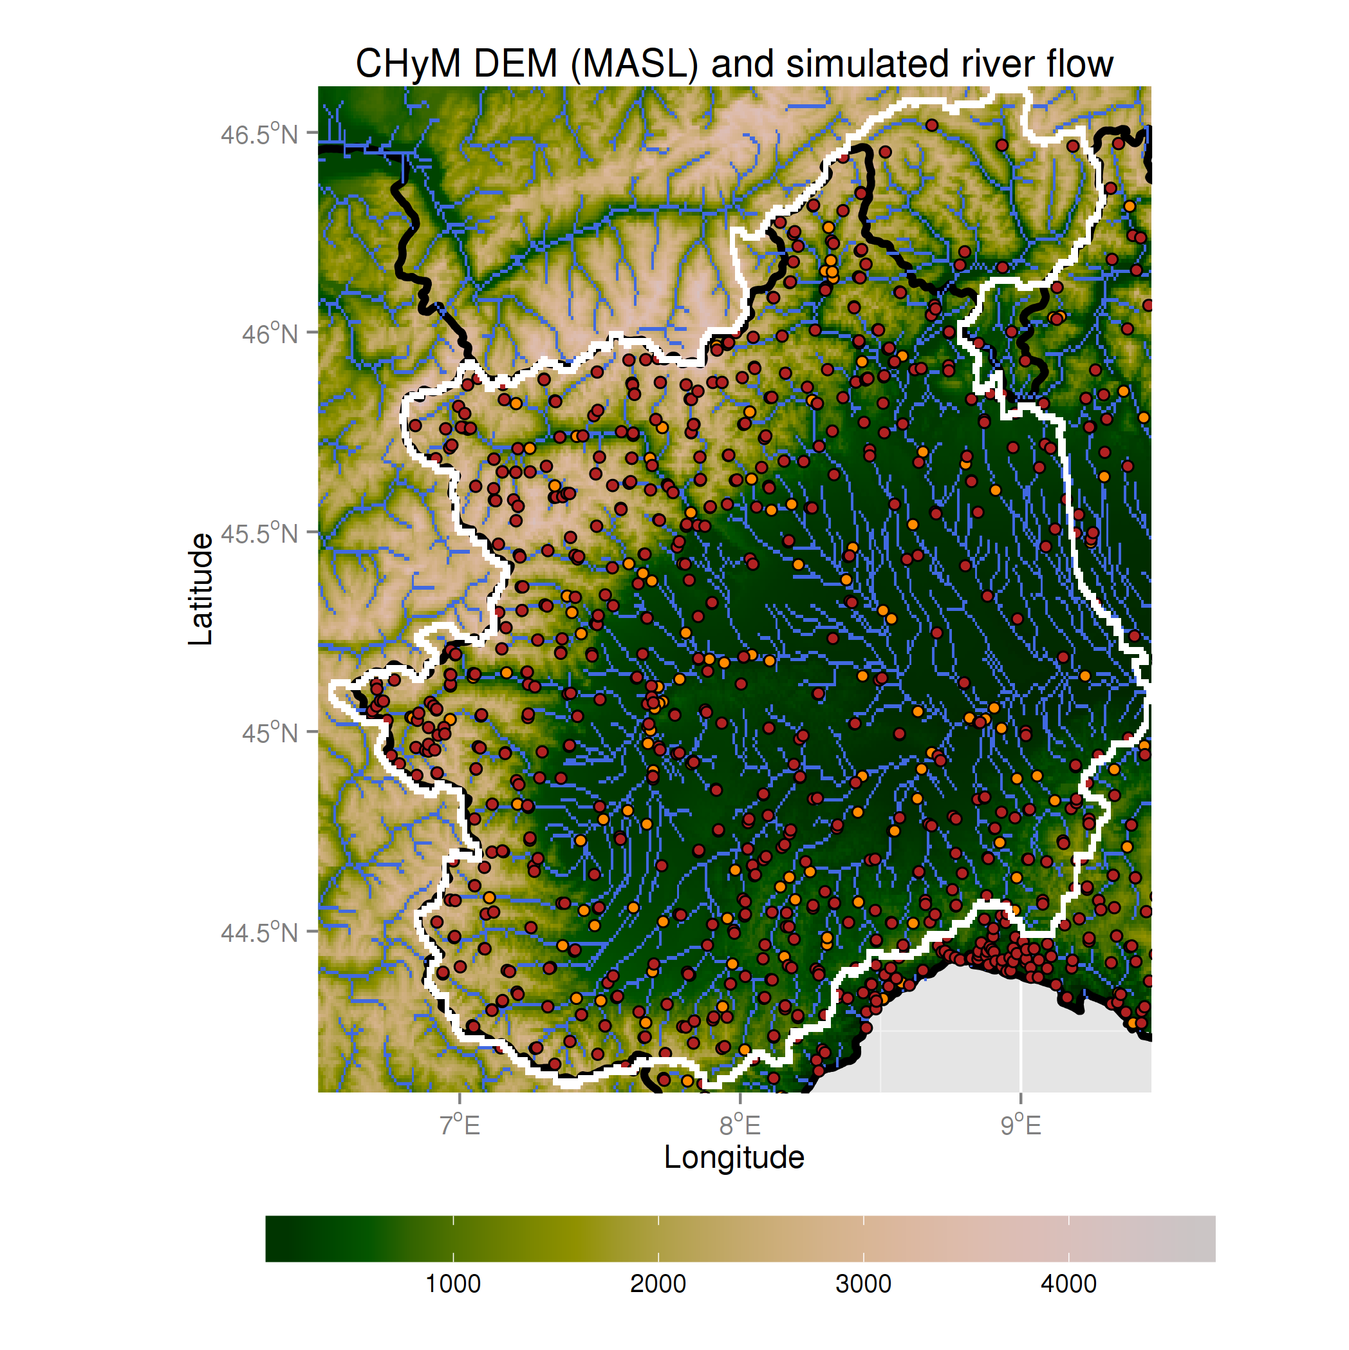
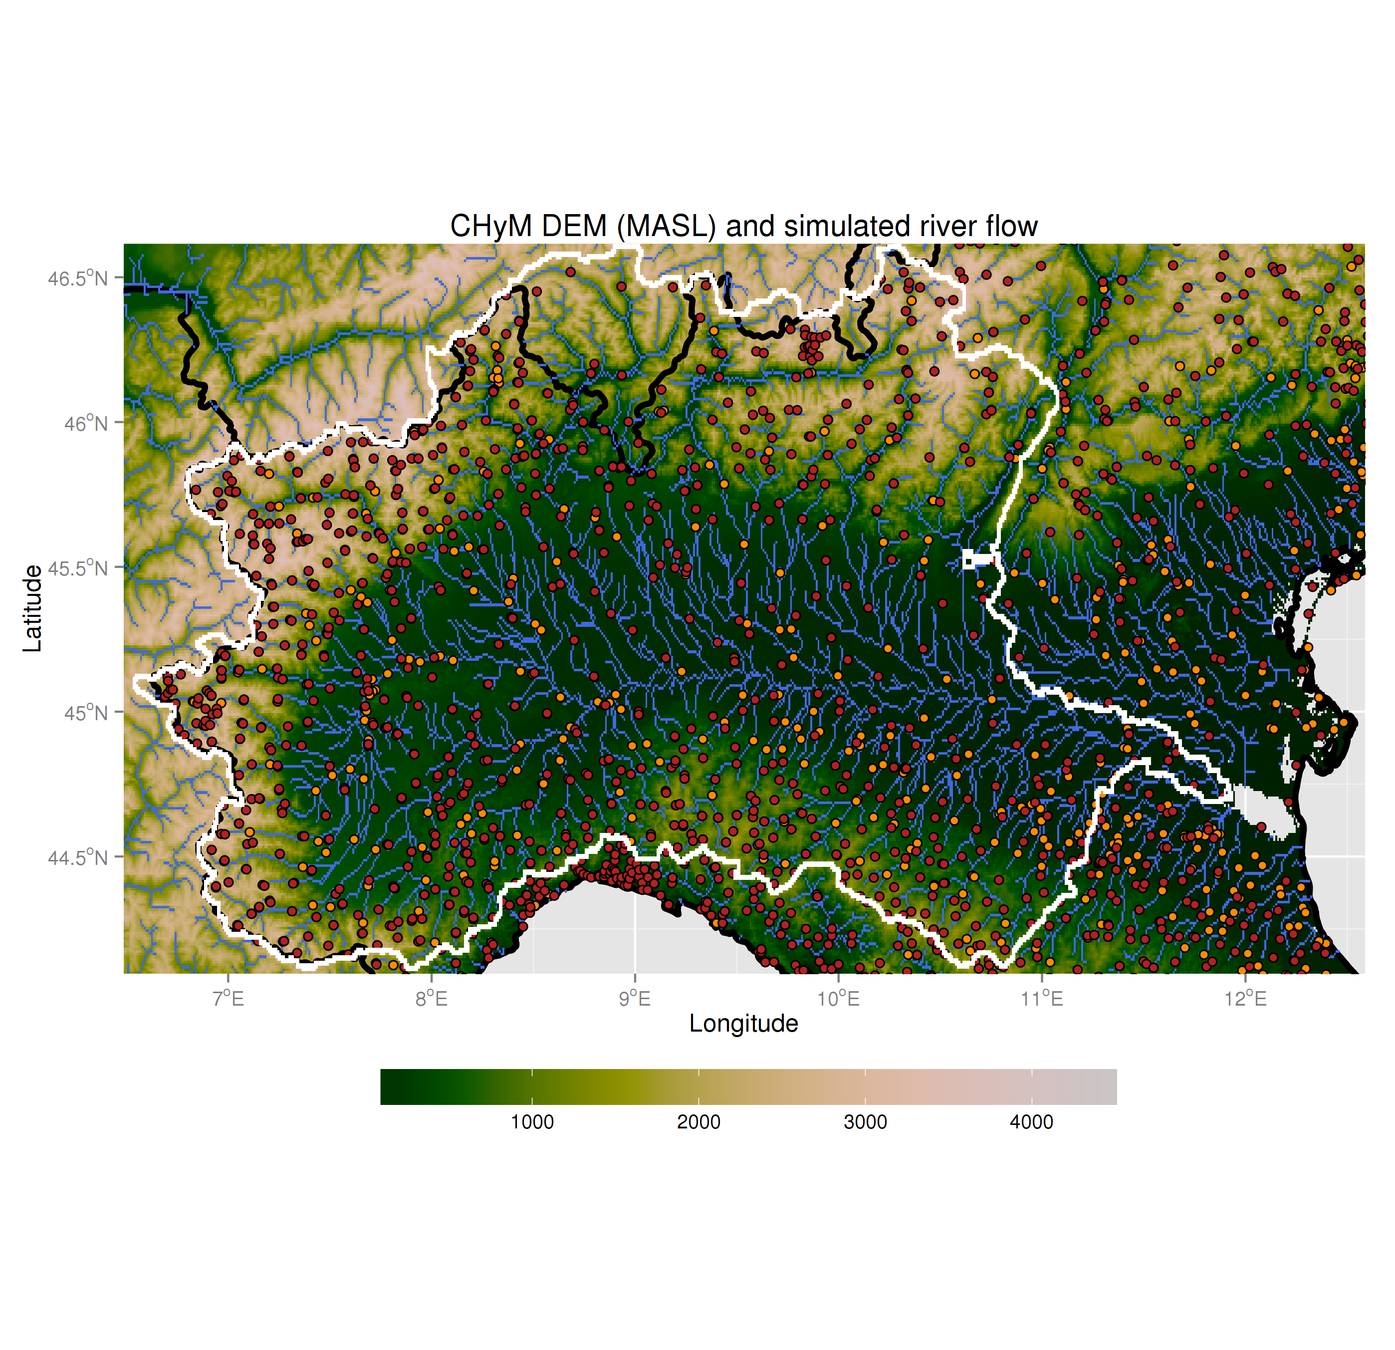
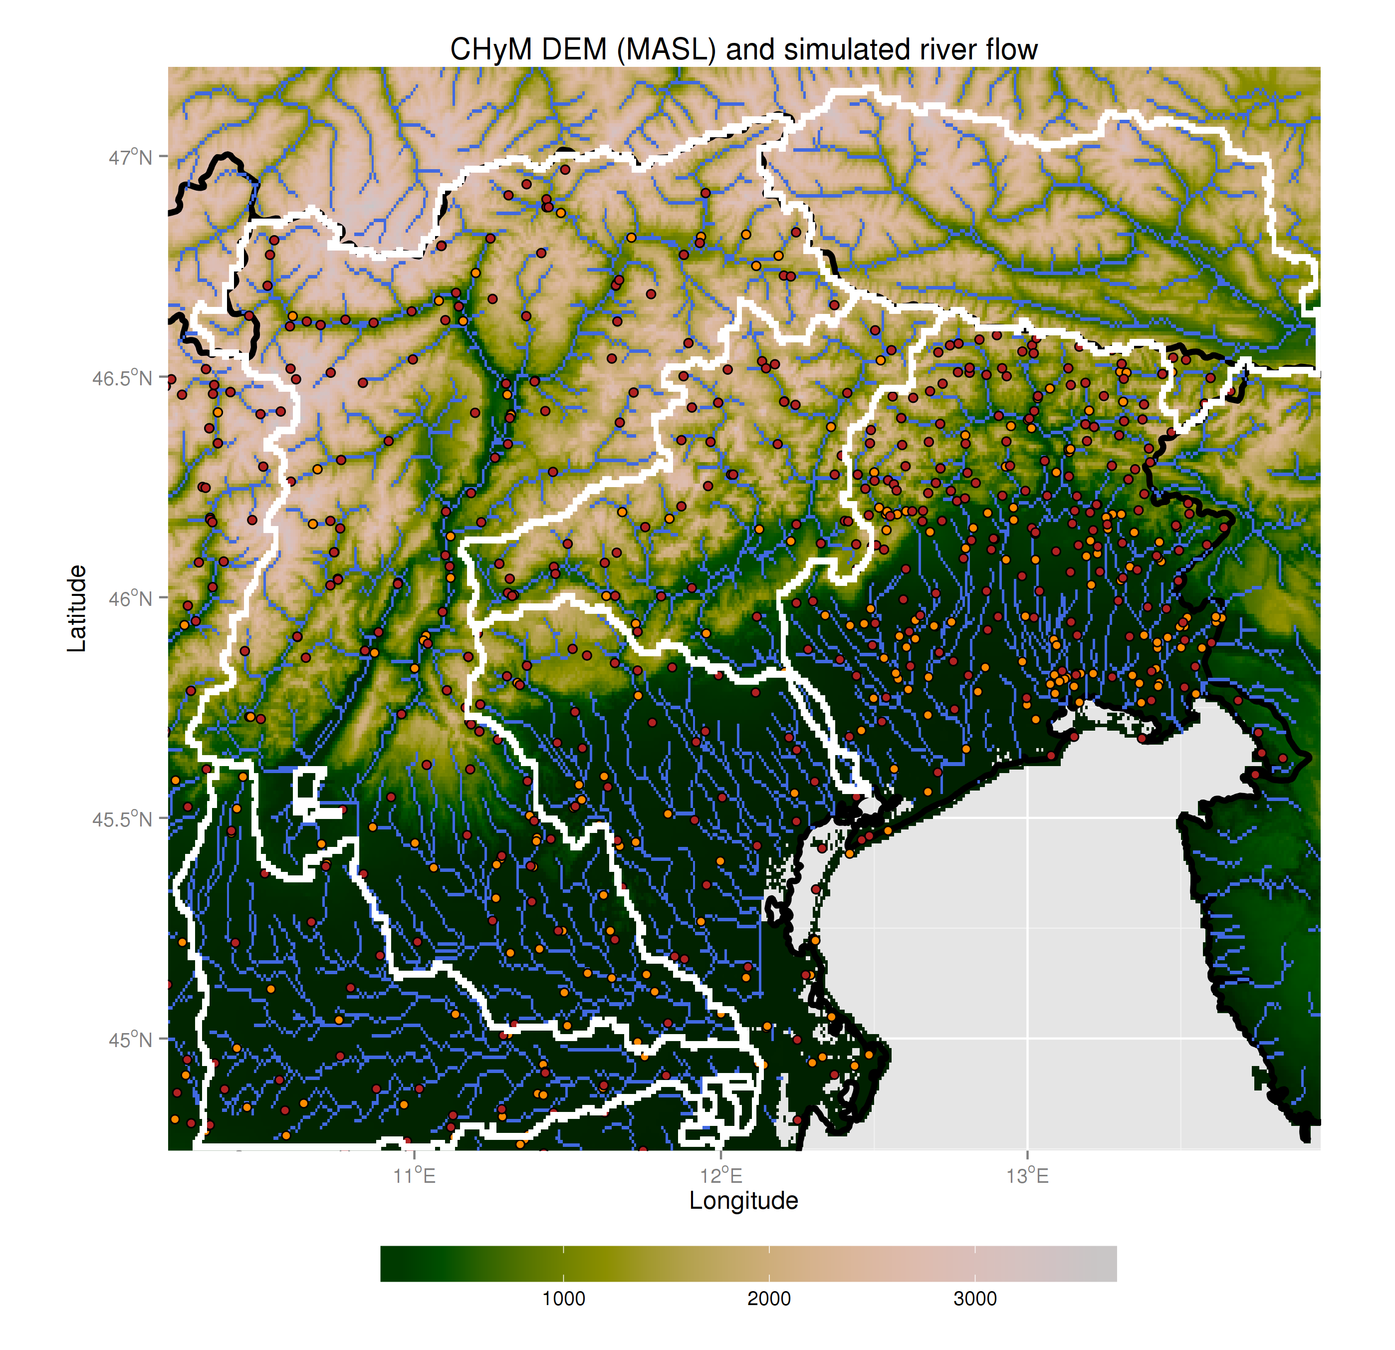
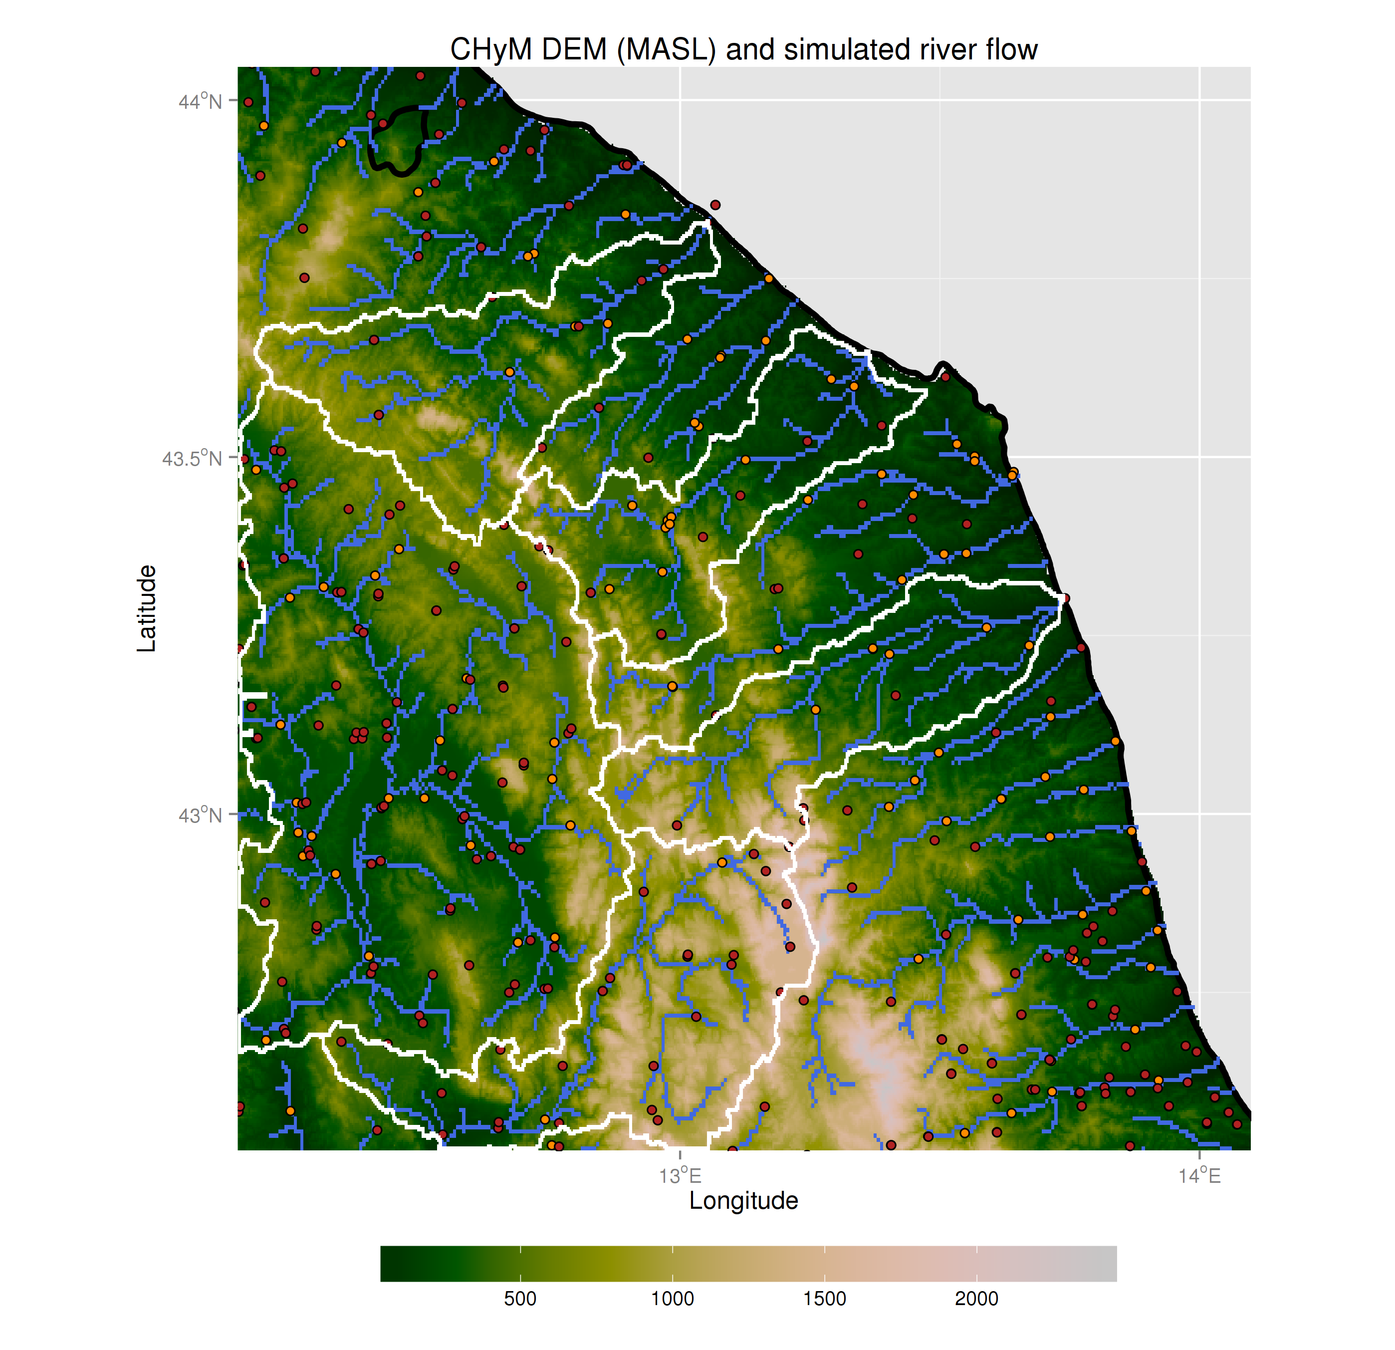
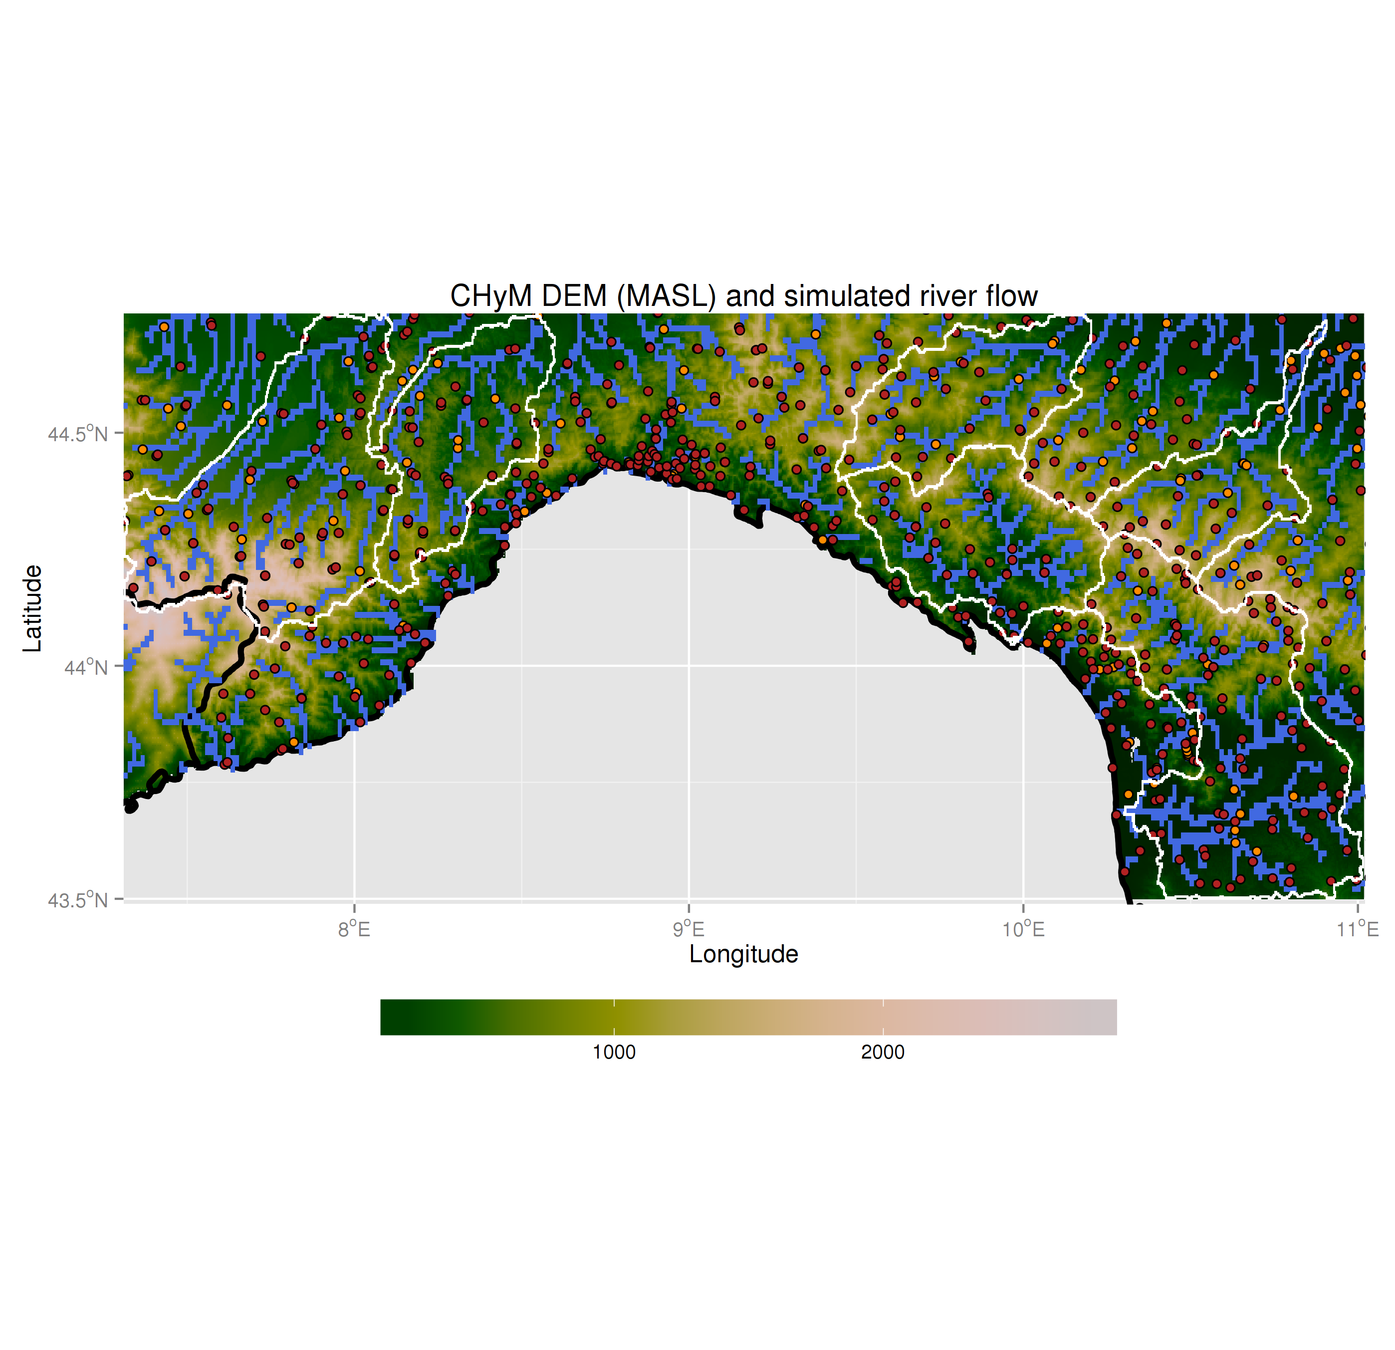
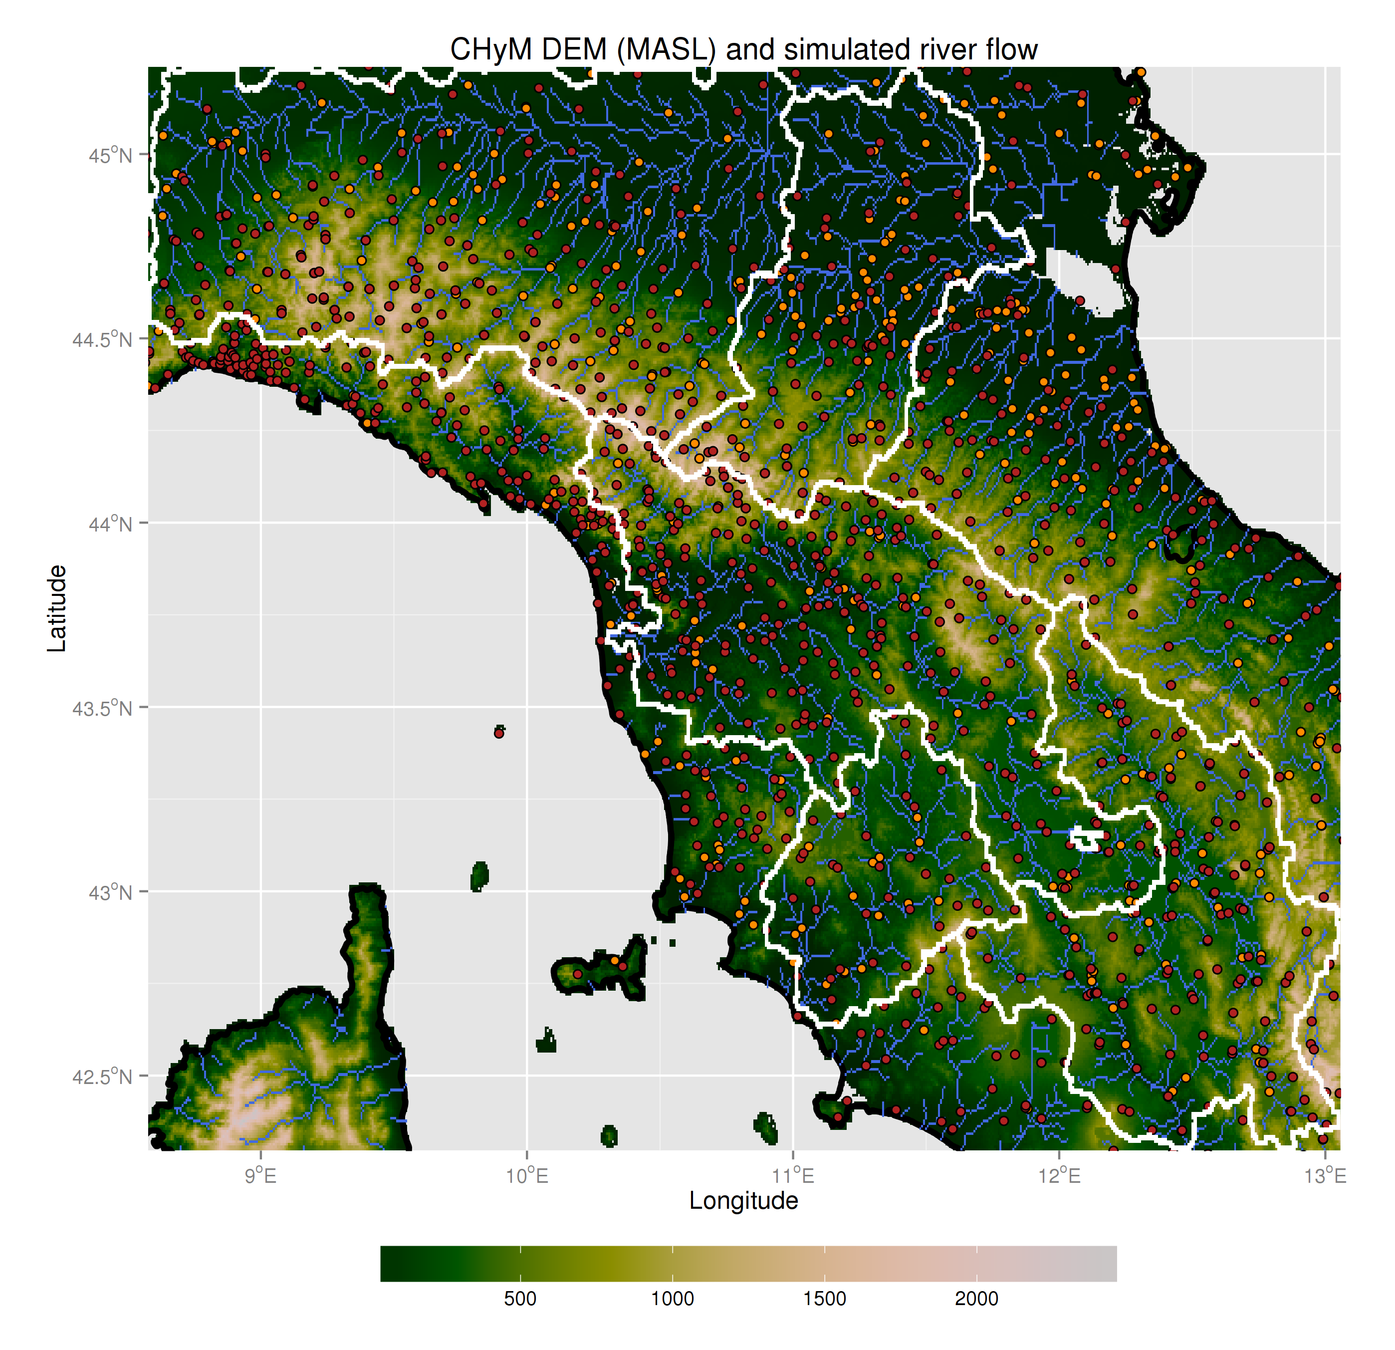
3.3 - Cetemps Hydrological Model
CHyM-OP reproduced domains:
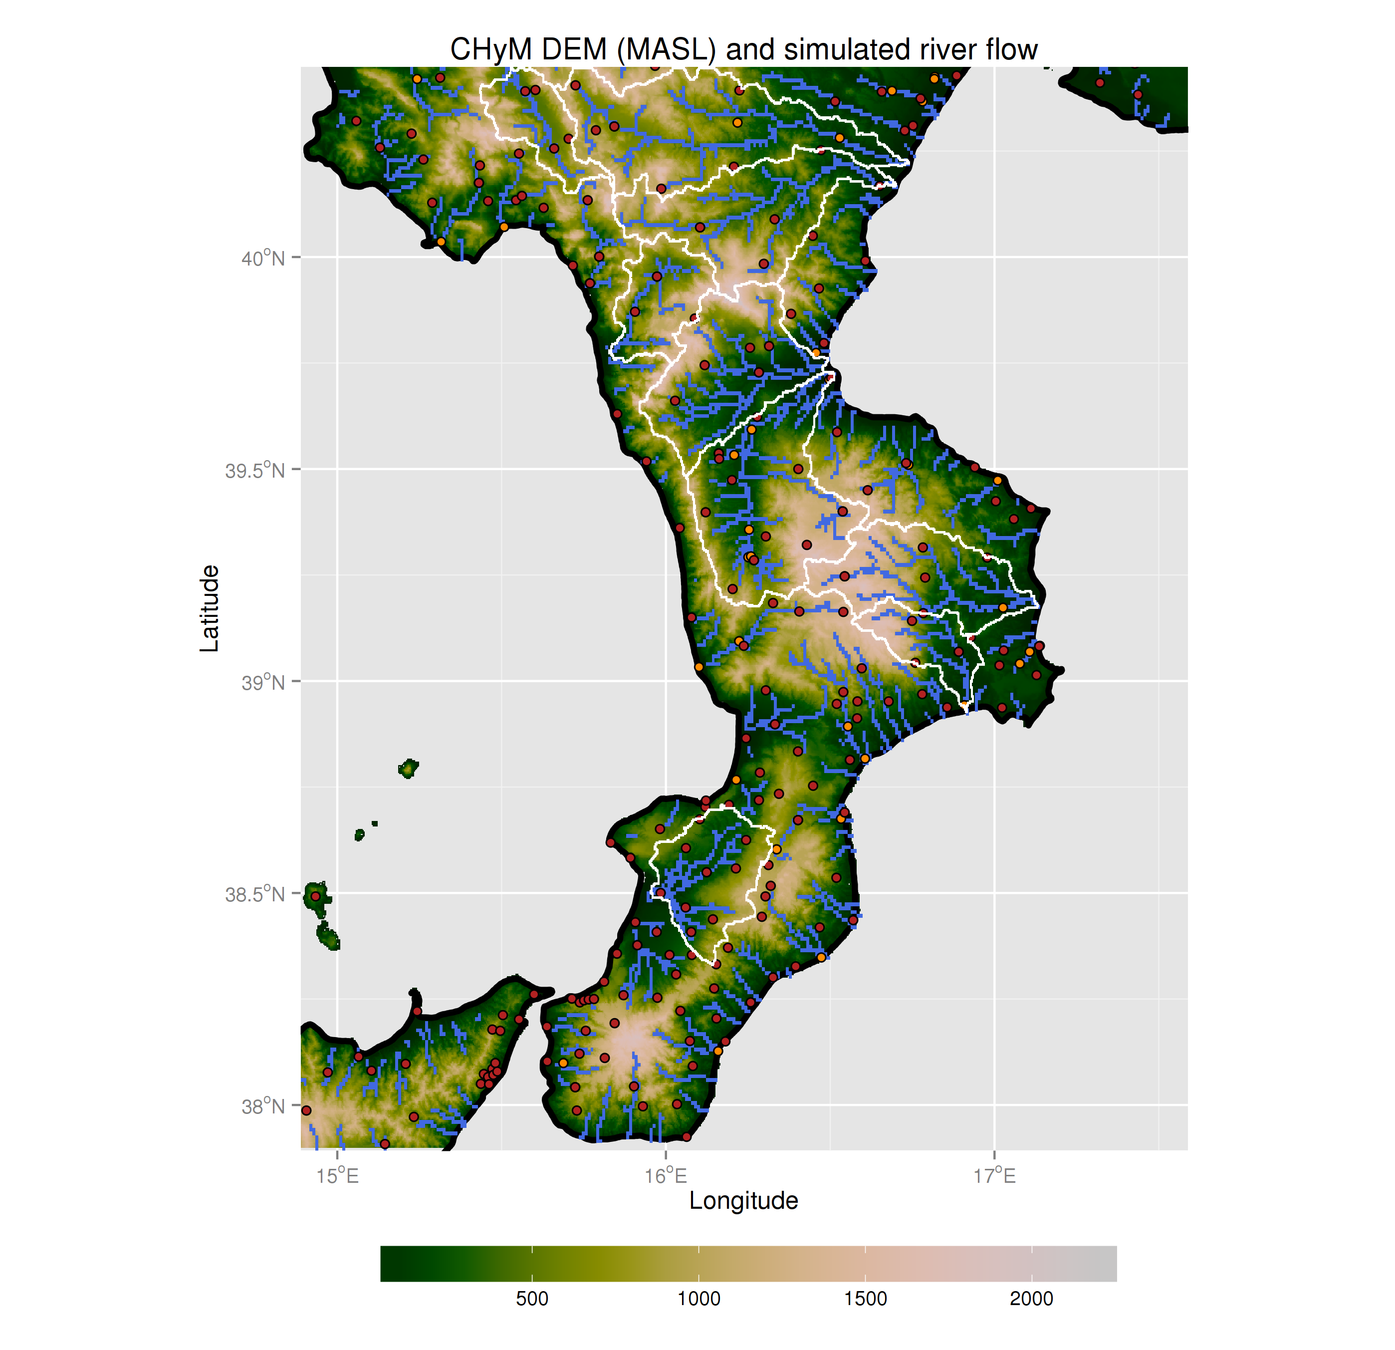
3.4 - Cetemps Hydrological Model
3.5 - Cetemps Hydrological Model
So far:
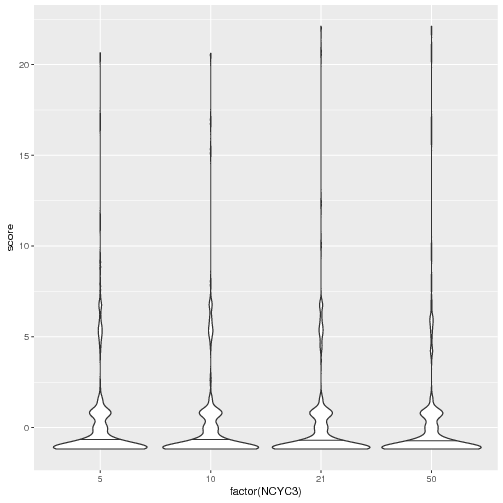
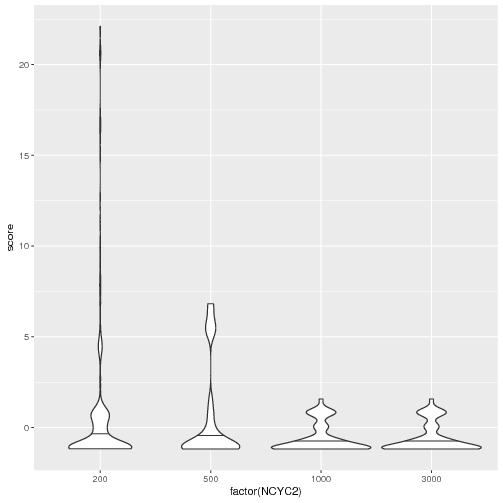
- Performed ~2000 model simulations to find the best configuration for the river network reconstruction
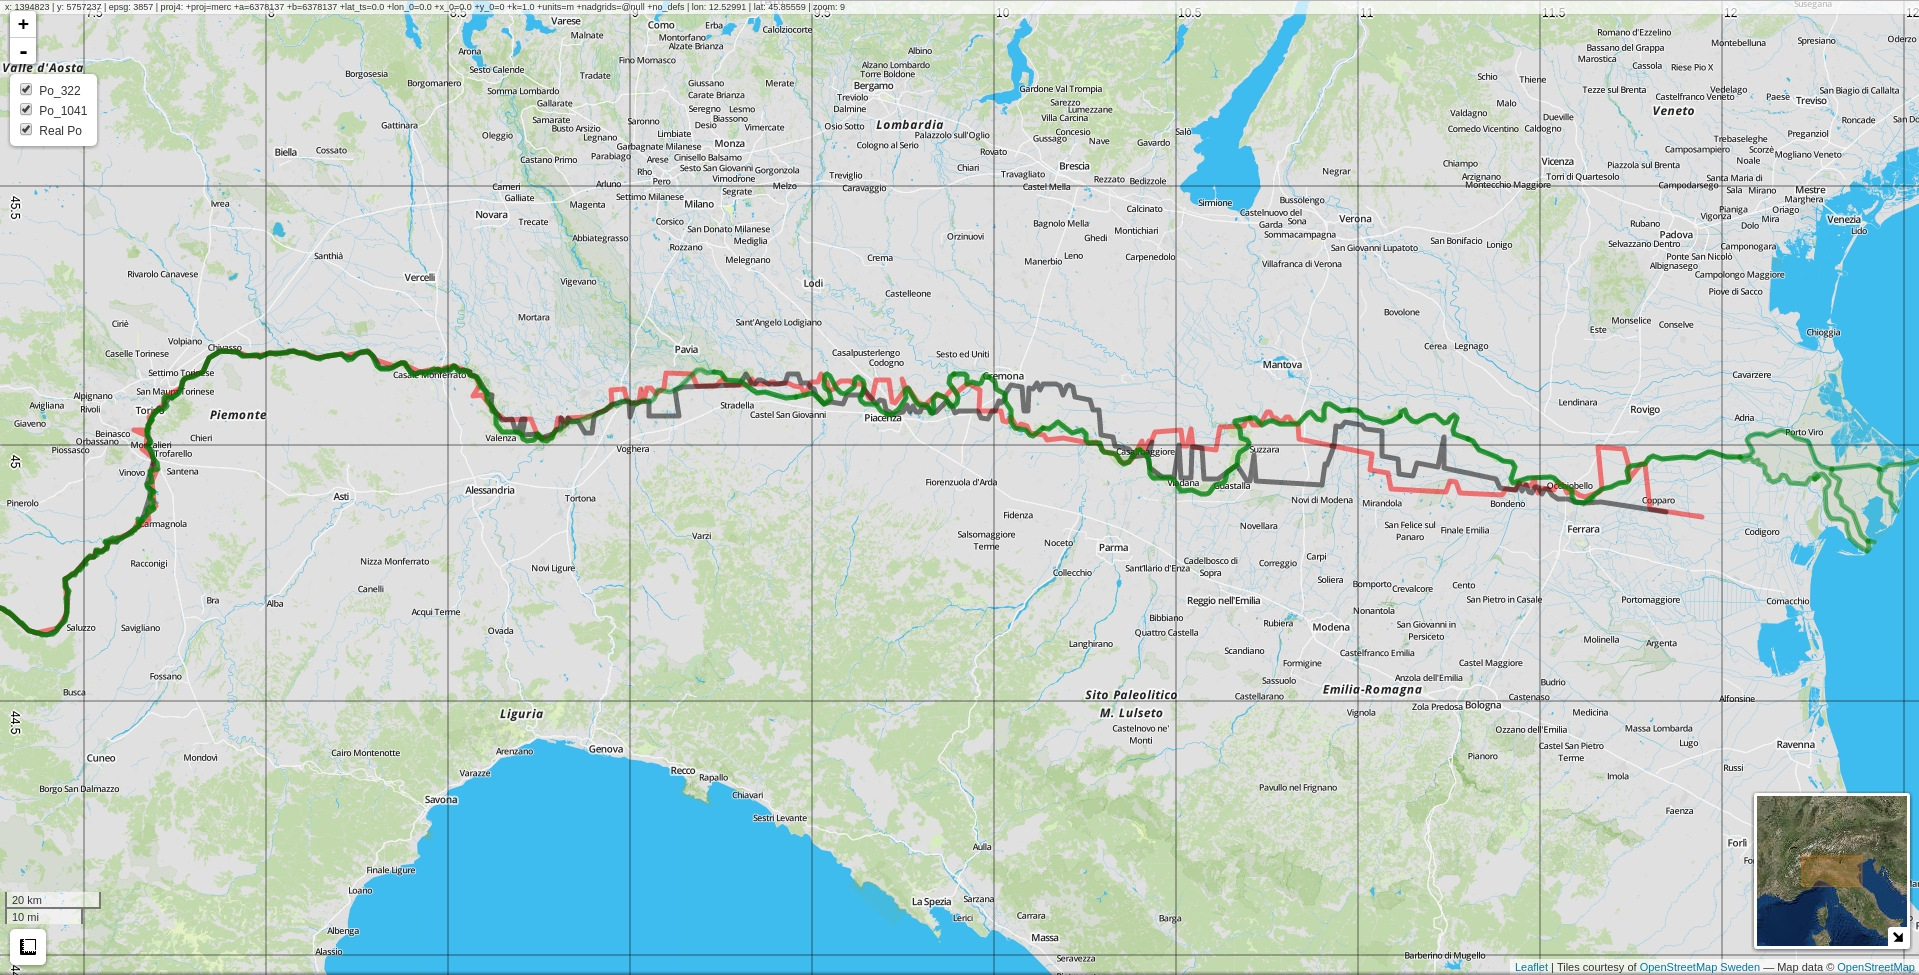
- Identify and compare the reconstruction of the Po river with different metrics: mean distance, basin area, distance Q95...
3.6 - Cetemps Hydrological Model
3.7 - Cetemps Hydrological Model
4 - Statistics
How to estimate hundred-years floods with only a few (~20) years worth of data?
The methodology is taken from Maione et al., 2003
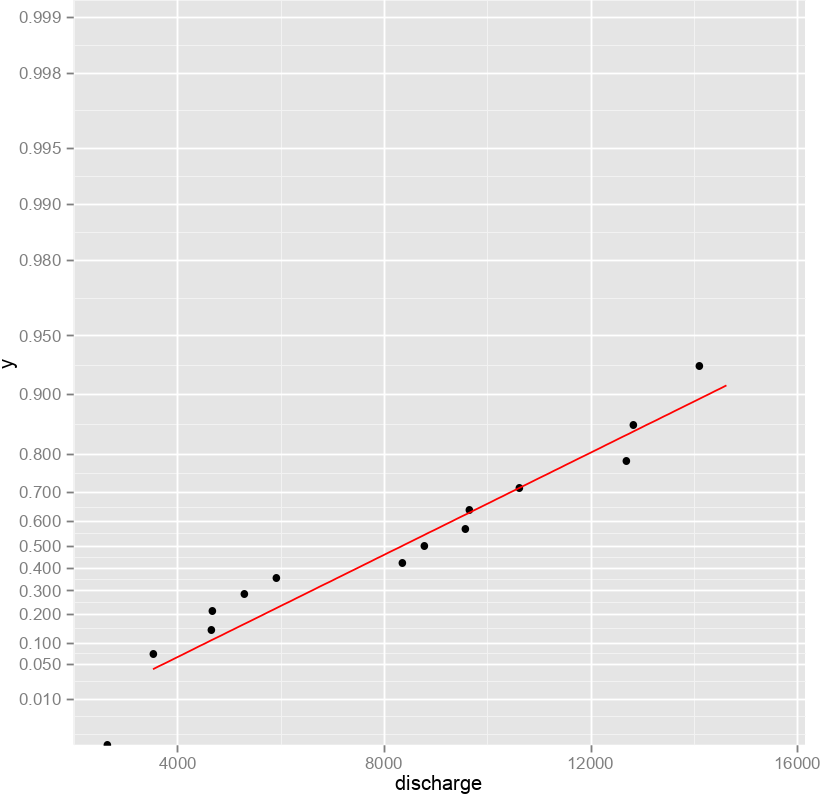
Annual maxima
Gumbel extreme value distribution
Fit parameters
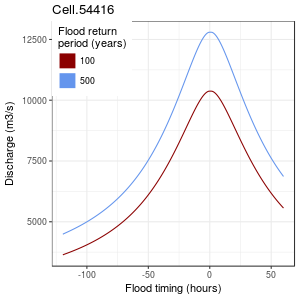
SDH: "Typical" flood timing curve for each river cell
CA2D input data
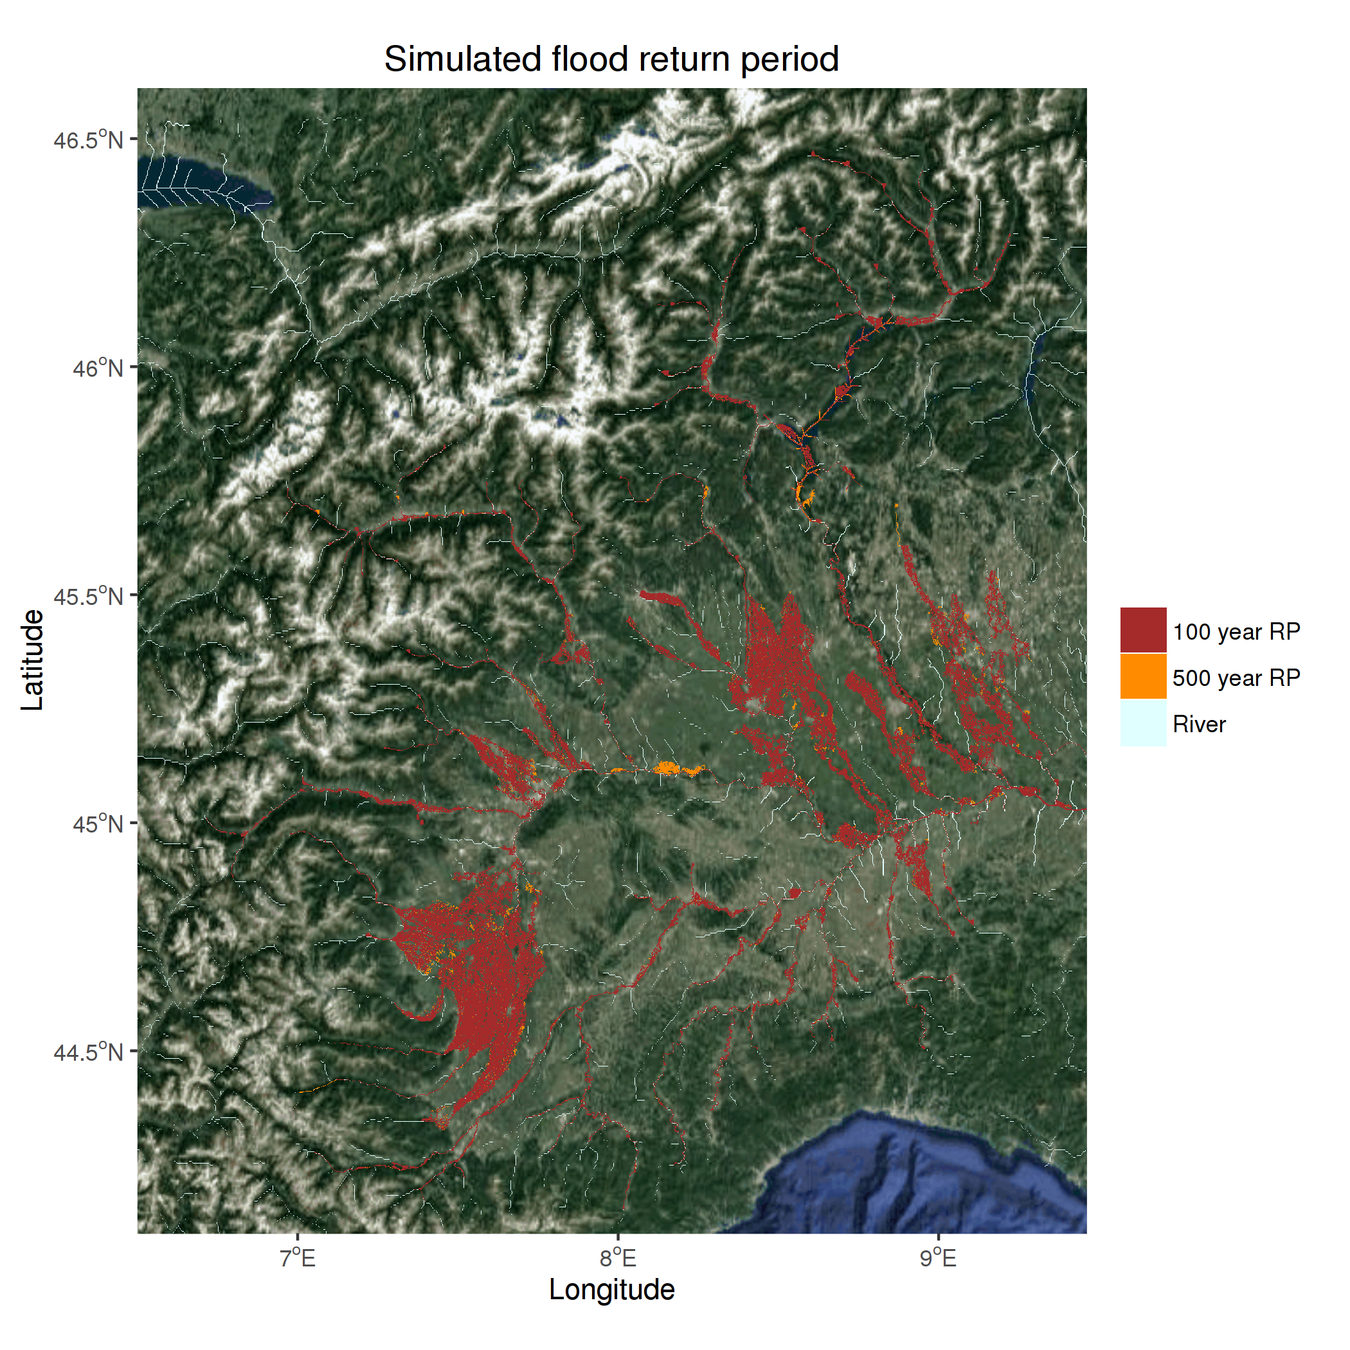
5.0 - CA2D hydraulic model
After using LISFLOOD-FP, we switched to the food inundation model from Dottori and Todini, 2011
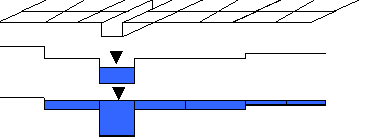
- DEM
- D4 River network
- SDH
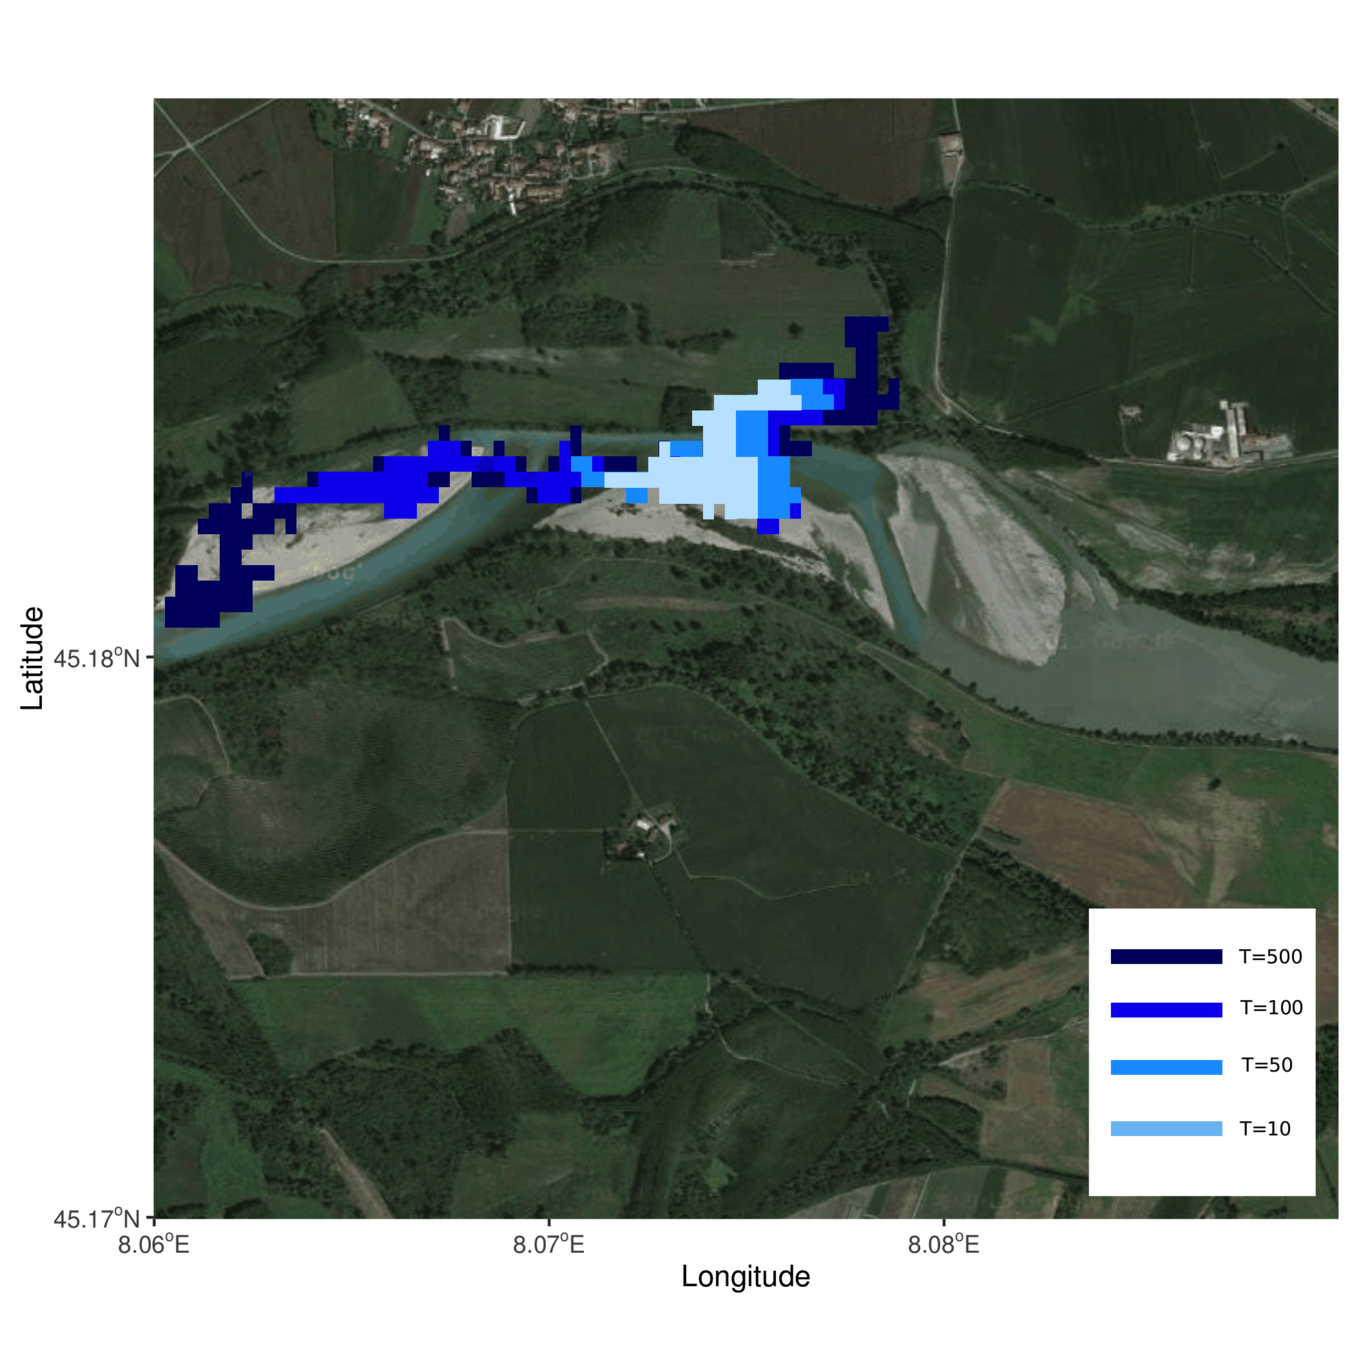
5.1 - CA2D hydraulic model
Problems!
- Excessive flooding in low RPs
- Not enough difference between RPs
Solutions?
- Higher resolution (~50m)
- Better DEMs (HydroSHEDS)
- ?
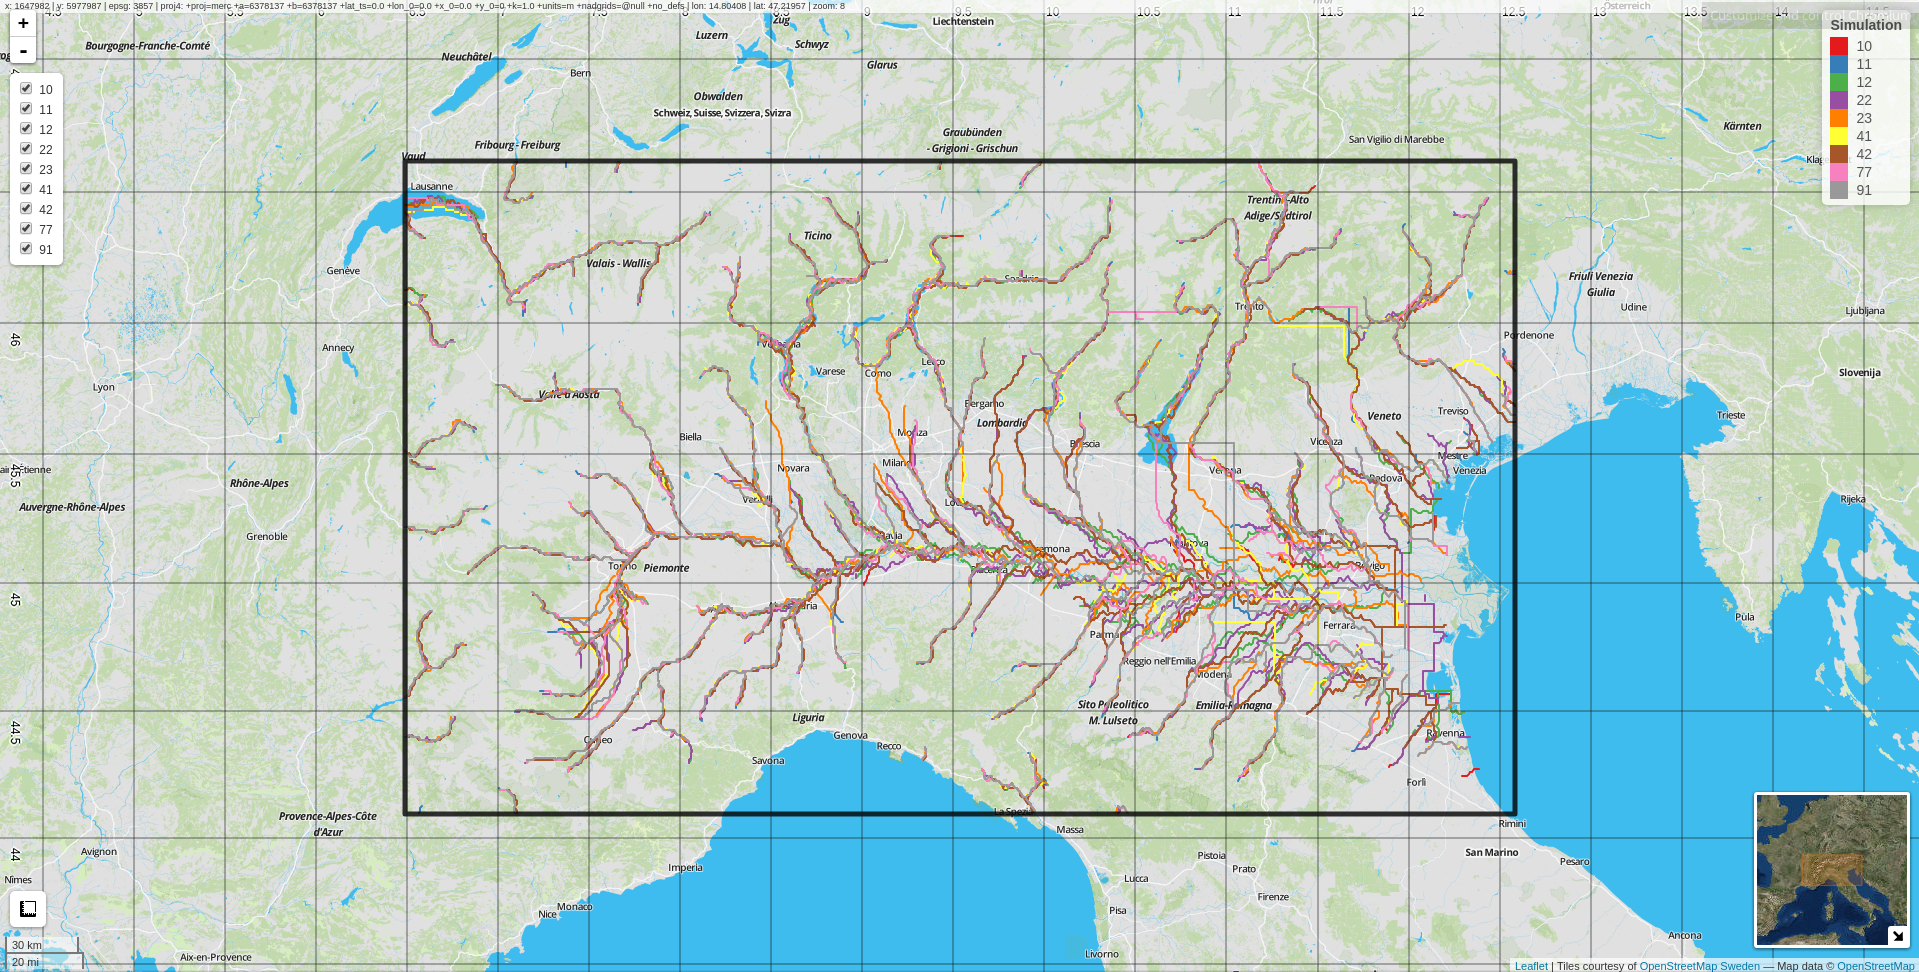
6.0 - Visualization
An R/Leaflet tool for flood, river, DEM, basin and station visualization
6.3 - Visualization
Click_edit: an R/Shiny tool for WYSISYG editing of NetCDF files

Thanks for your attention!
Precipitation:
- Observations
- RCM output
Gridded netCDF:
- River network
- Discharges
hydrological model
For each RP, cell:
- Gumbel distr
- Hydrographs
Statistical RP analysis
For each RP, cell:
- Flood extent
- Flood depth
(multiple simulations)
- RCM output
- Discharges
- Past floods
Validation for
- EGU General Assembly, Vienna 2017, attended;
- ICTP CHyM Workshop, Trieste 2017, oral presentation;
- 10th HyMeX workshop, Barcelona 2017, oral presentation;
- AGU fall meeting, New Orleans 2017, poster
CA2D model
adriano.fantini@phd.units.it
Precipitation:
- Observations
- RCM output
Gridded netCDF:
- River network
- Discharges
hydrological model
For each RP, cell:
- Gumbel distr.
- Hydrographs
- Extreme Q
Statistical analysis
For each RP, cell:
- Flood extent
- Flood depth
(multiple simulations)
- RCM output
- Discharges
- Past floods
Validation and change for
CA2D hydraulic model
Based on Maione et al., 2003
(over nine domains)
ESFM 2016-2017 report (II year)
By odineidolon
ESFM 2016-2017 report (II year)
Presentation for II year of PhD, 15 min


