


Pablo Bravo PRO
Postdoc at Caltech (Datta Lab). PhD at GT (Yunker Lab). Studying how the dynamics of microbial communities under wetting and drying cycles, mainly the feedback between biotic and abiotic processes at the pore scale.
Quantitative Biosciences
PhD Defense
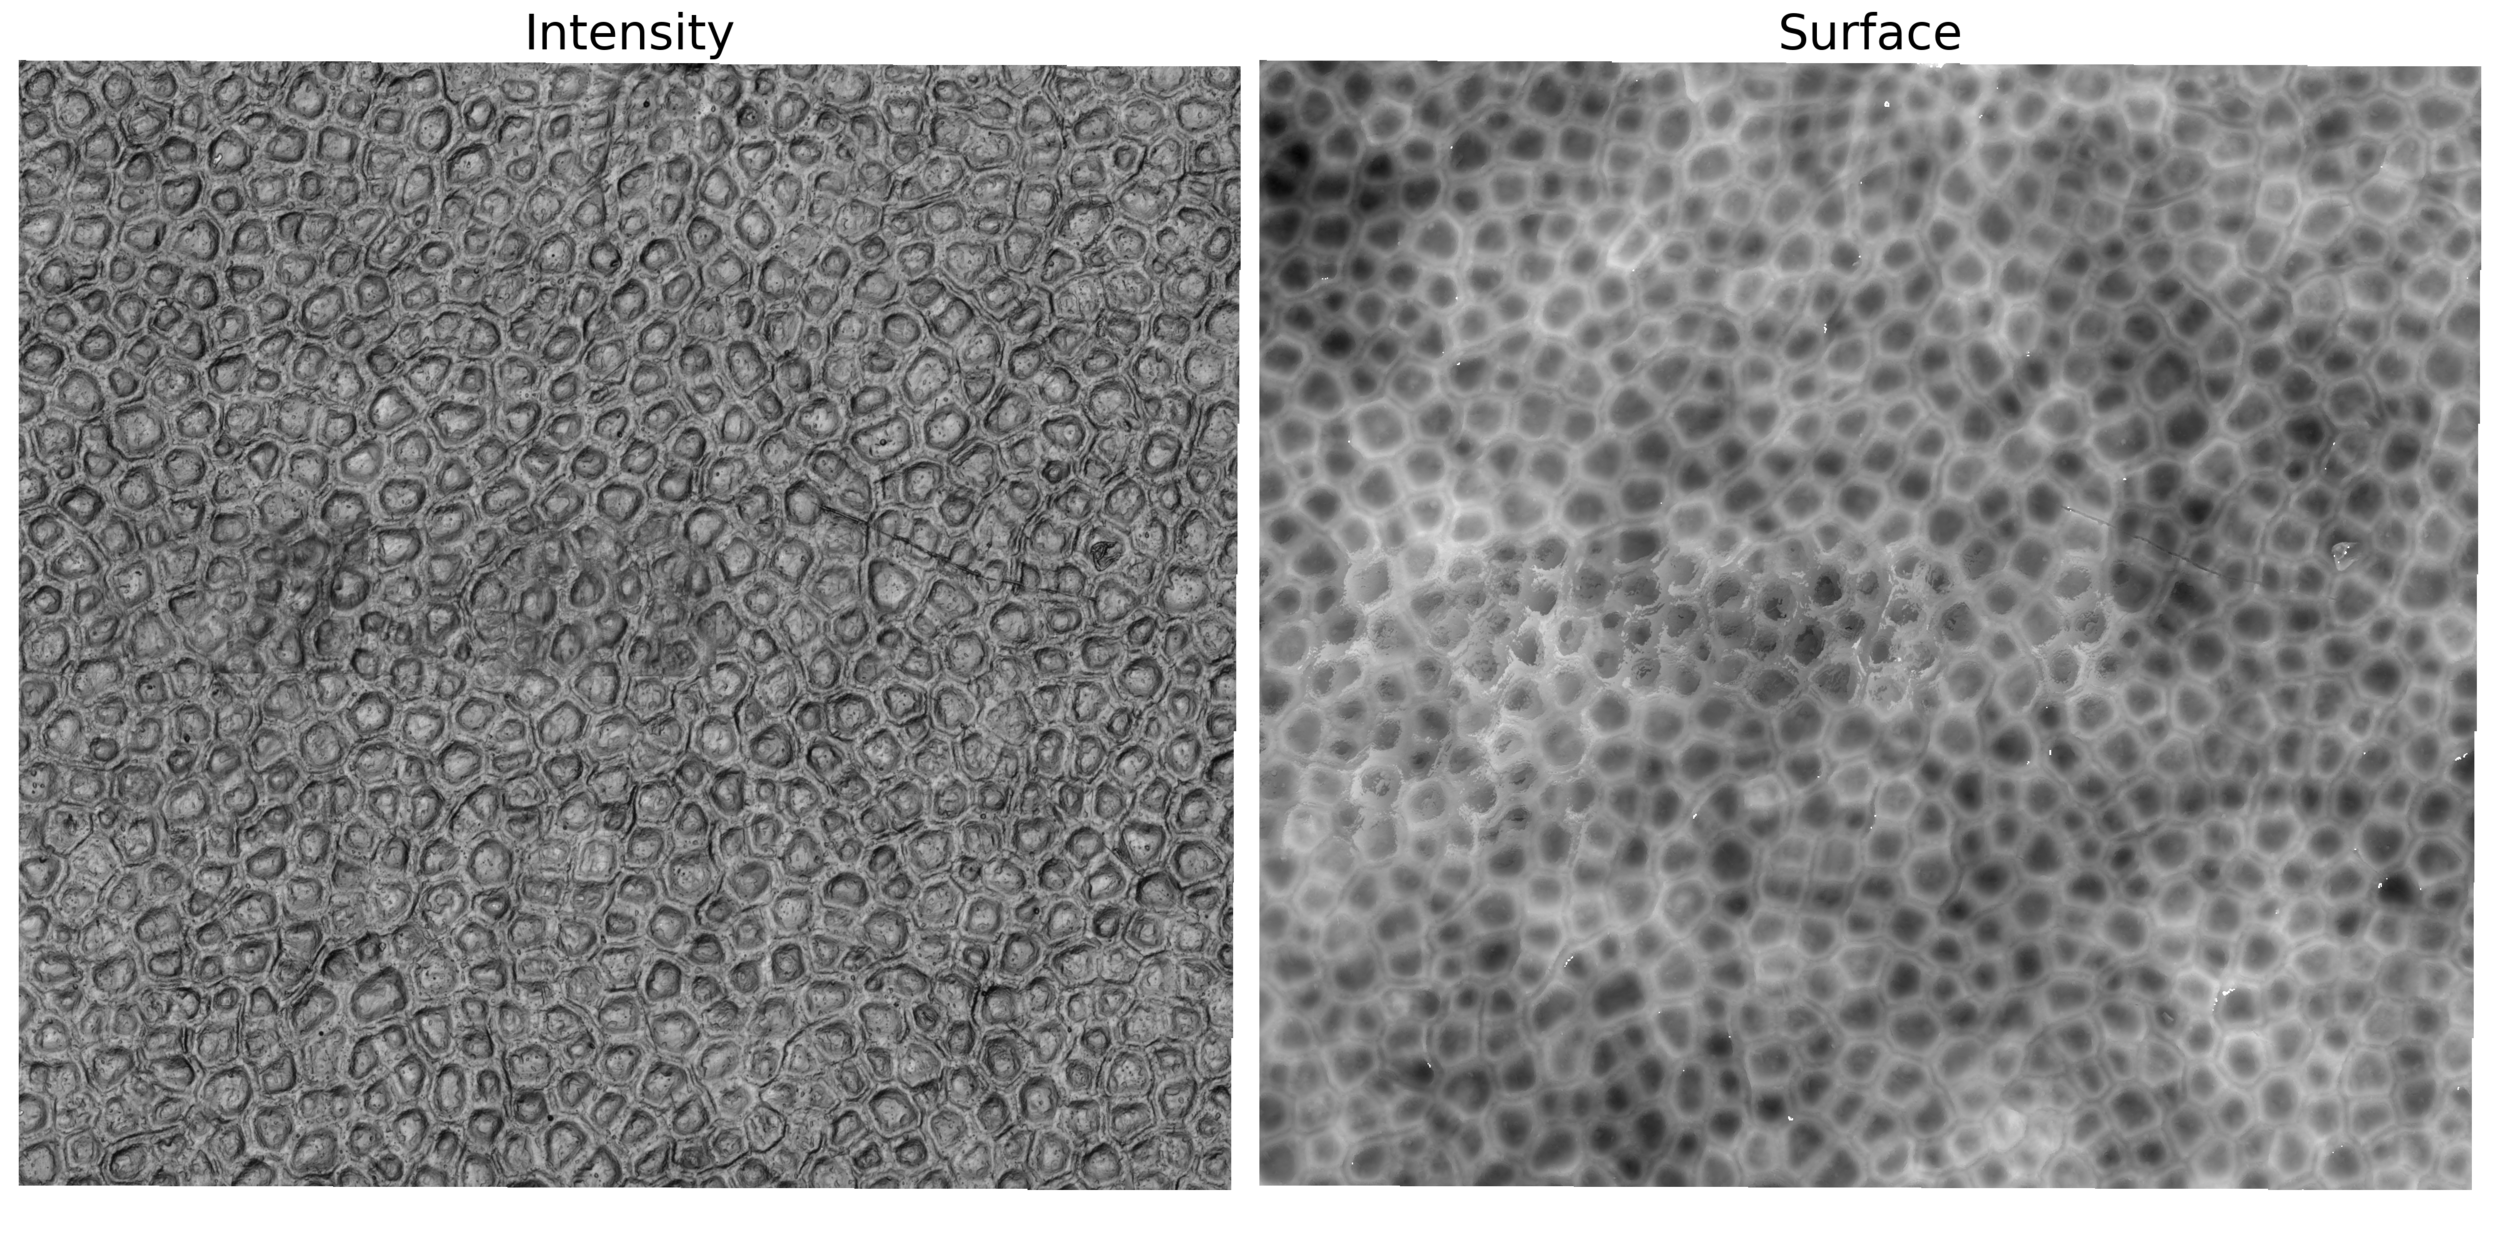
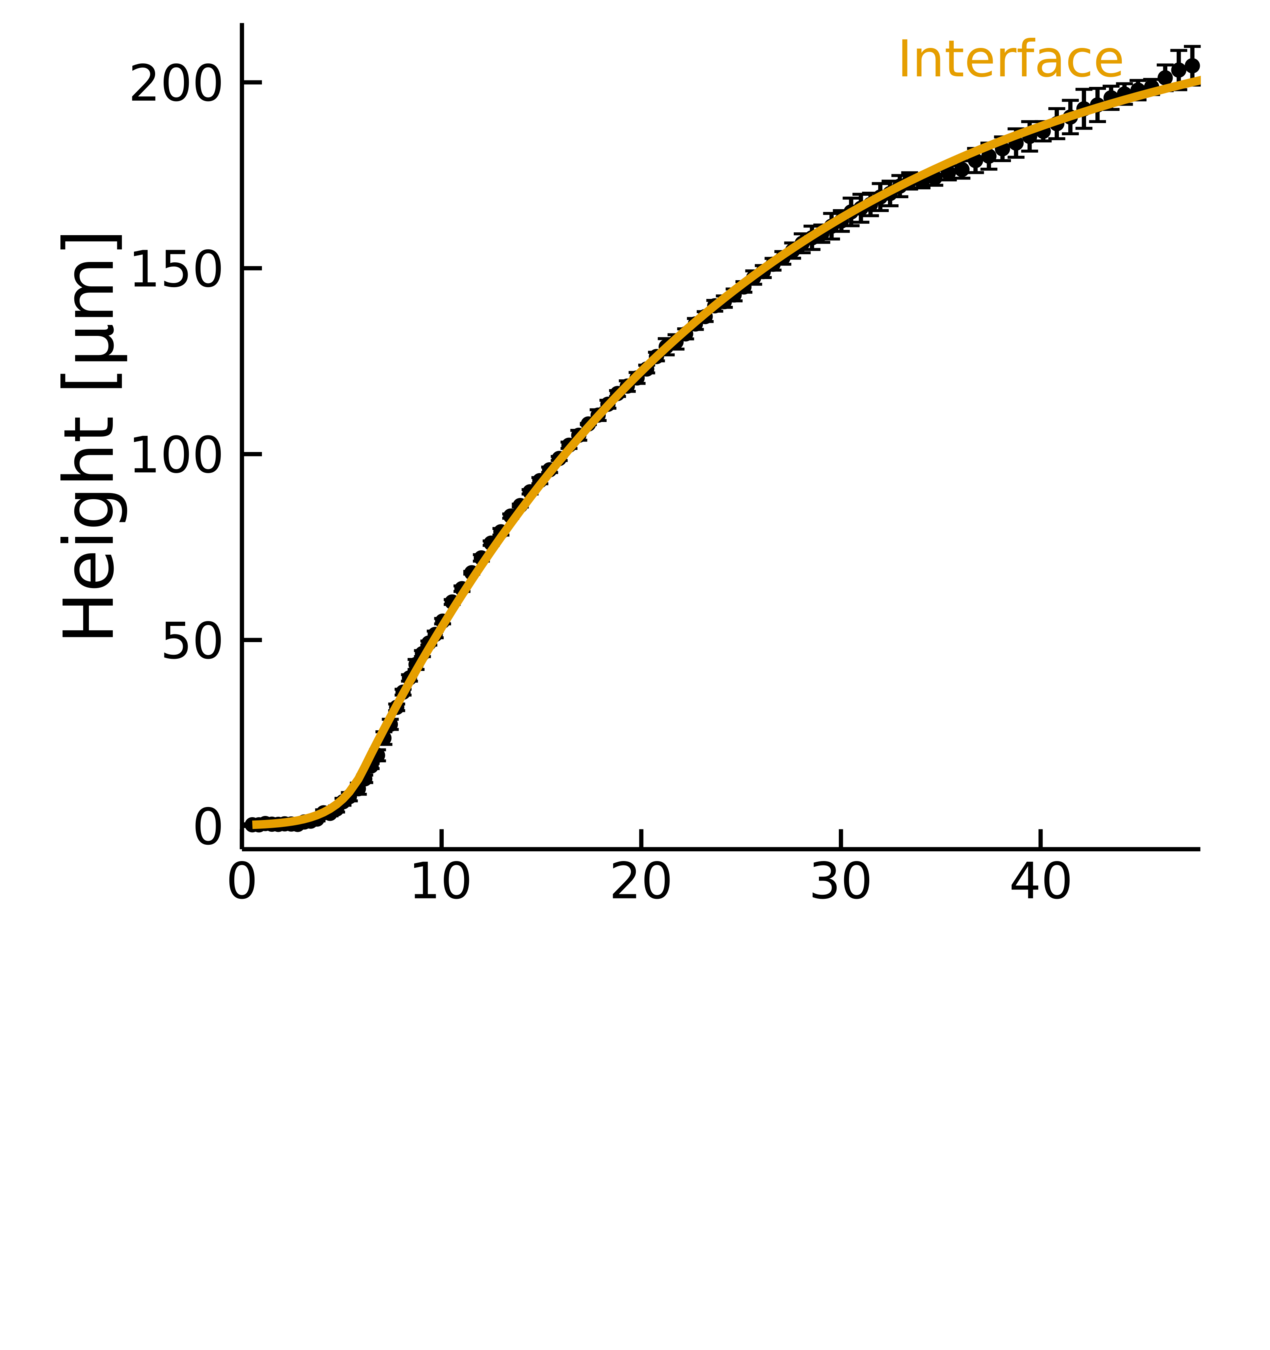
Surface
Interface
Cells
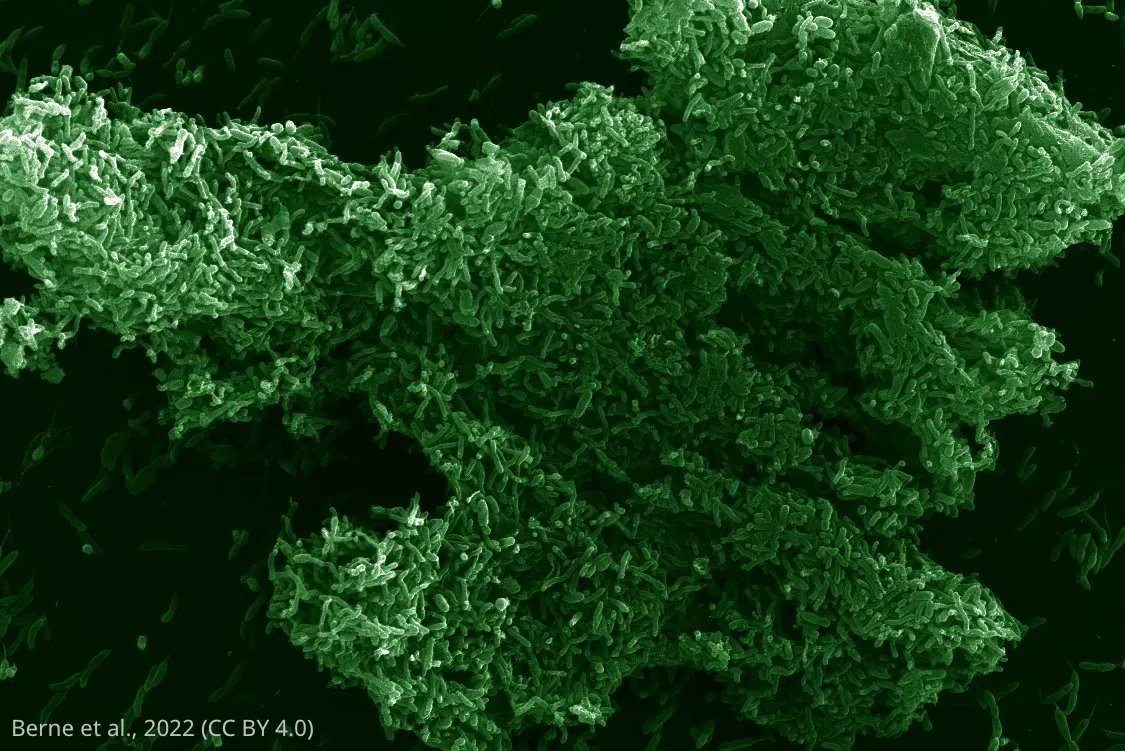
Extracellular matrix formed of polysaccharides, DNA, and proteins
Extracellular matrix formed of polysaccharides, DNA, and proteins
Surface
Interface
Cells
\(1 cm\)
\(1 cm\)
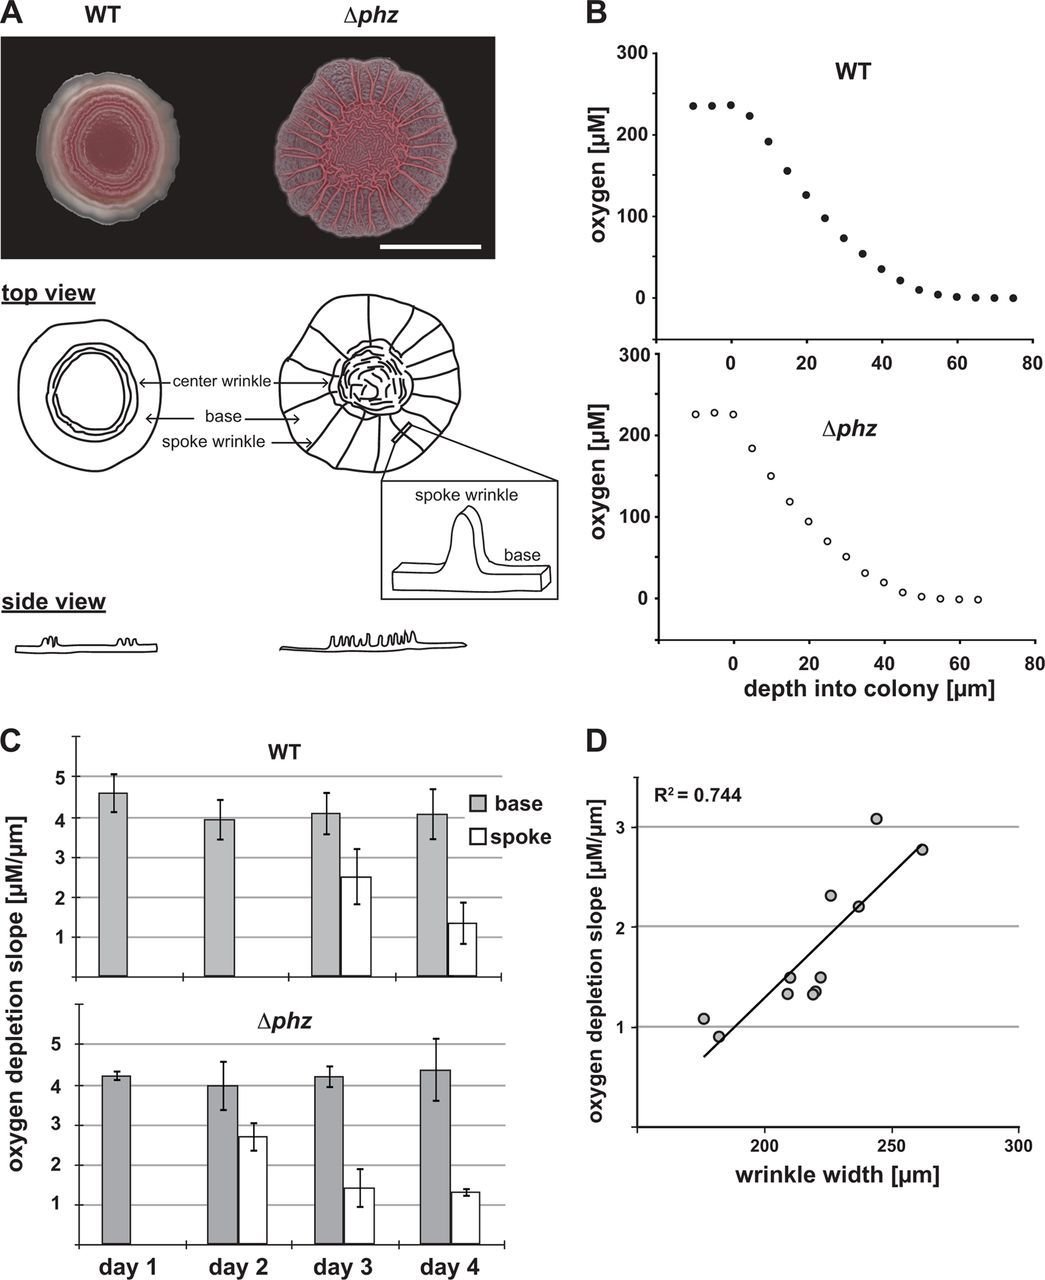
Dietrich, L., et al. Journal of Bacteriology (2013)
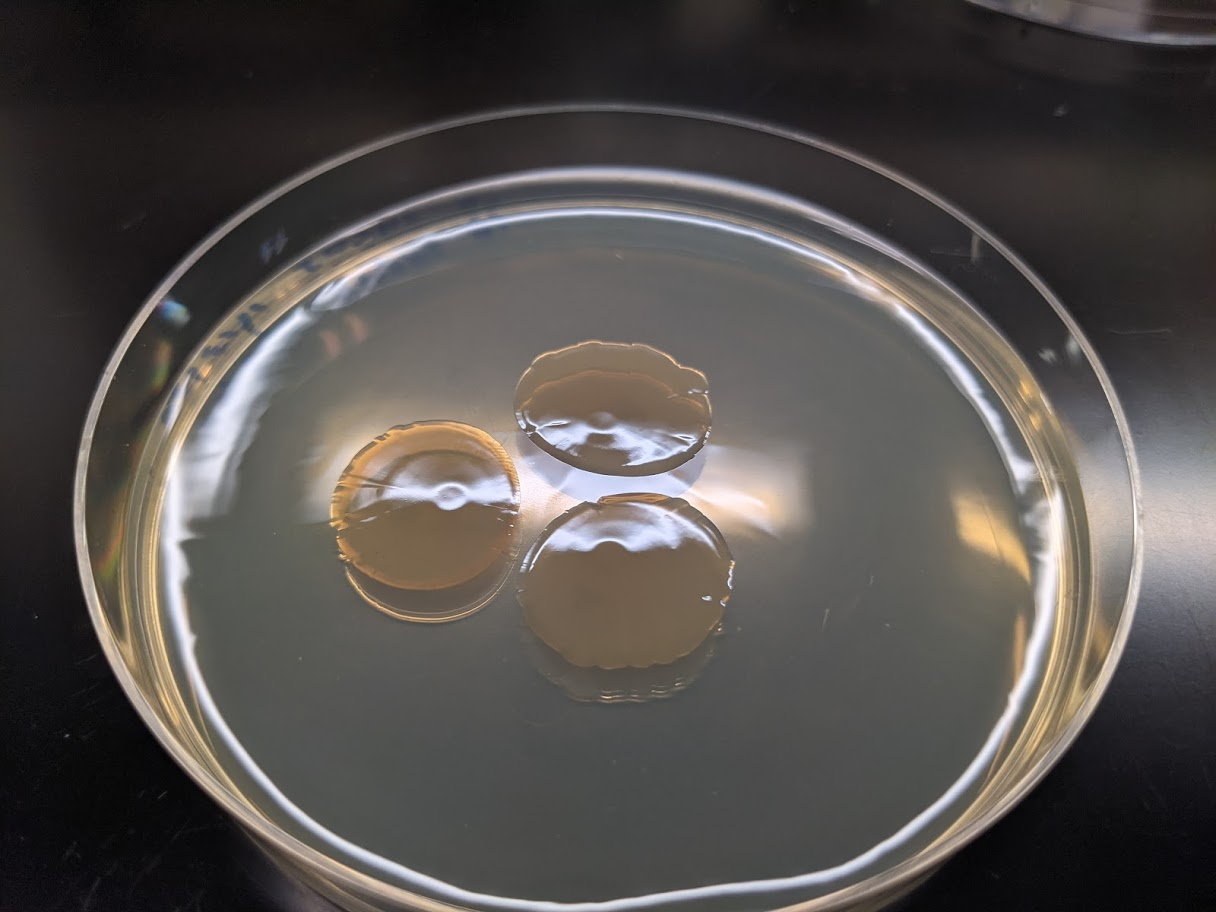
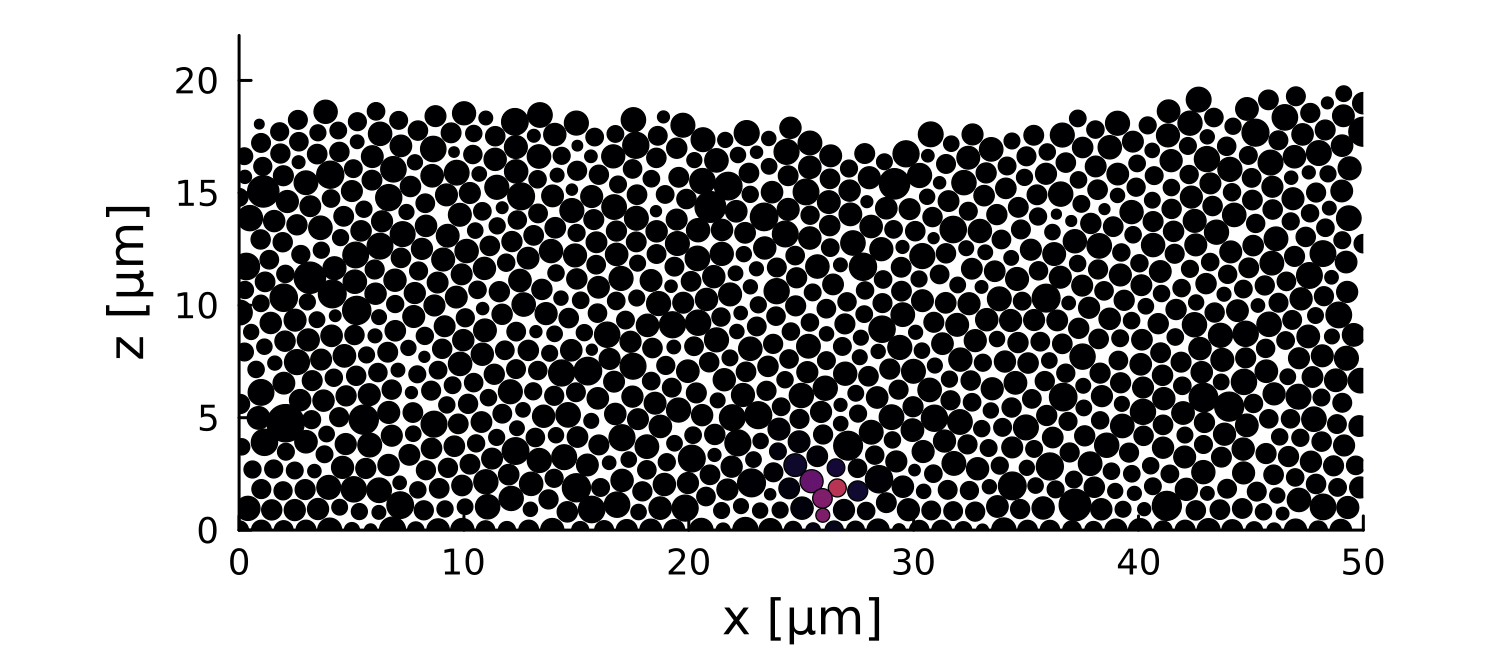
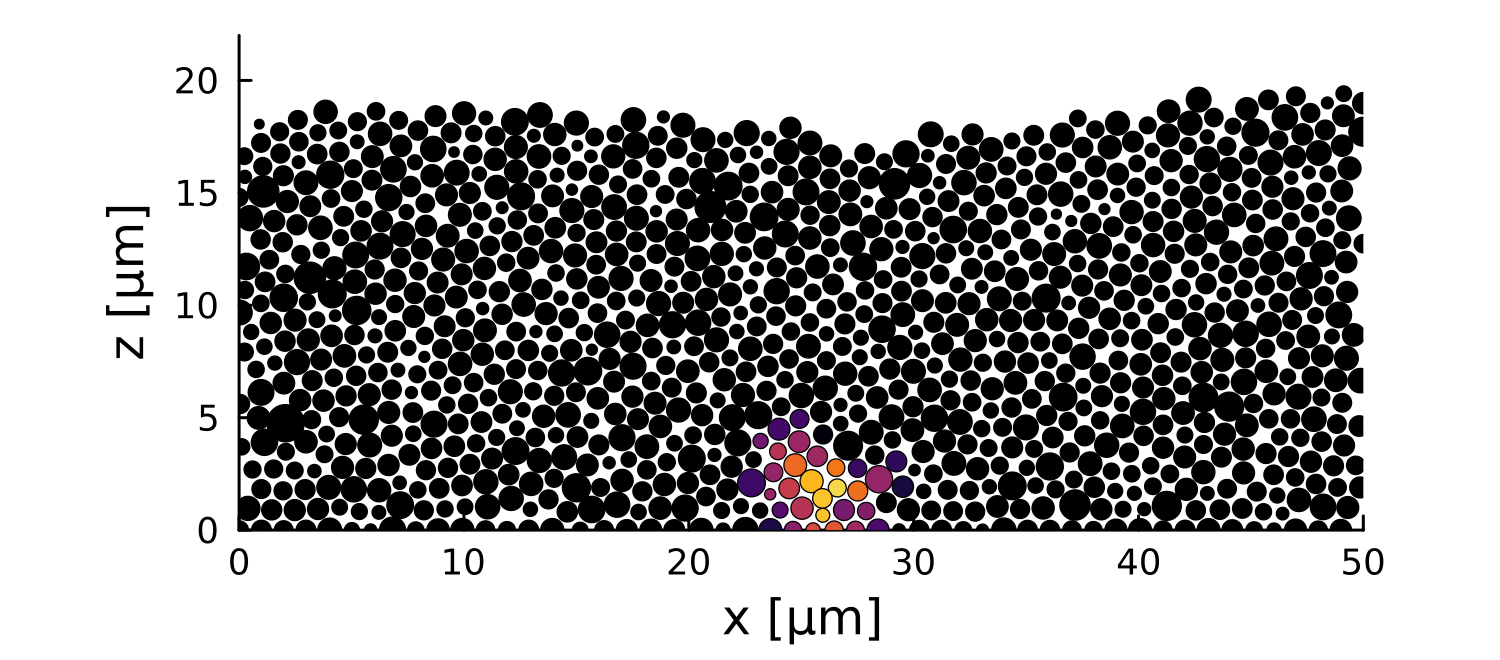
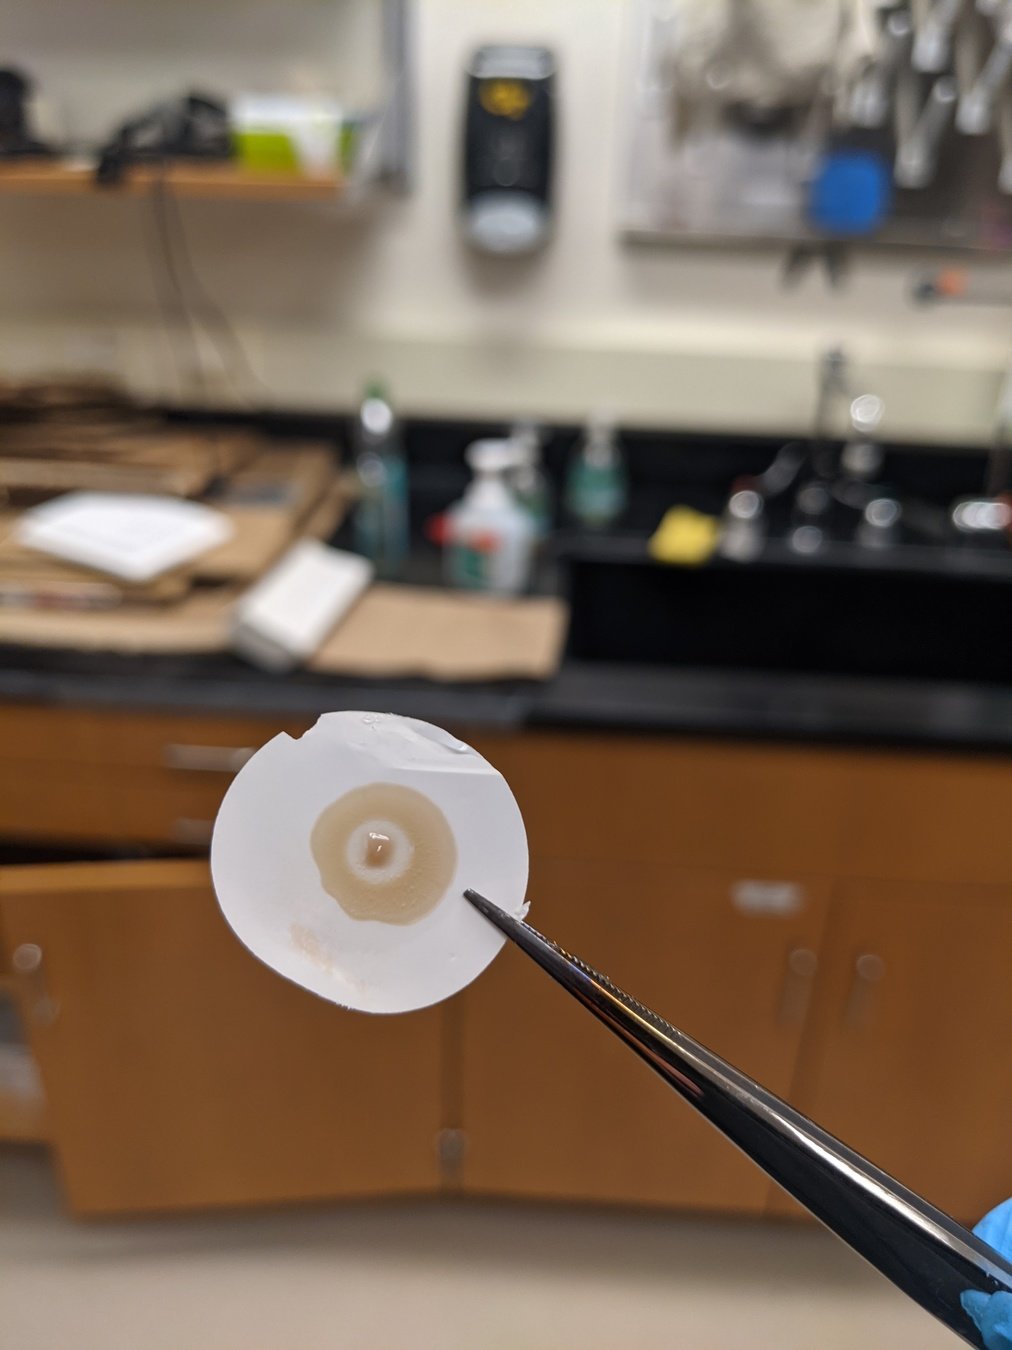
Each circle is a colony
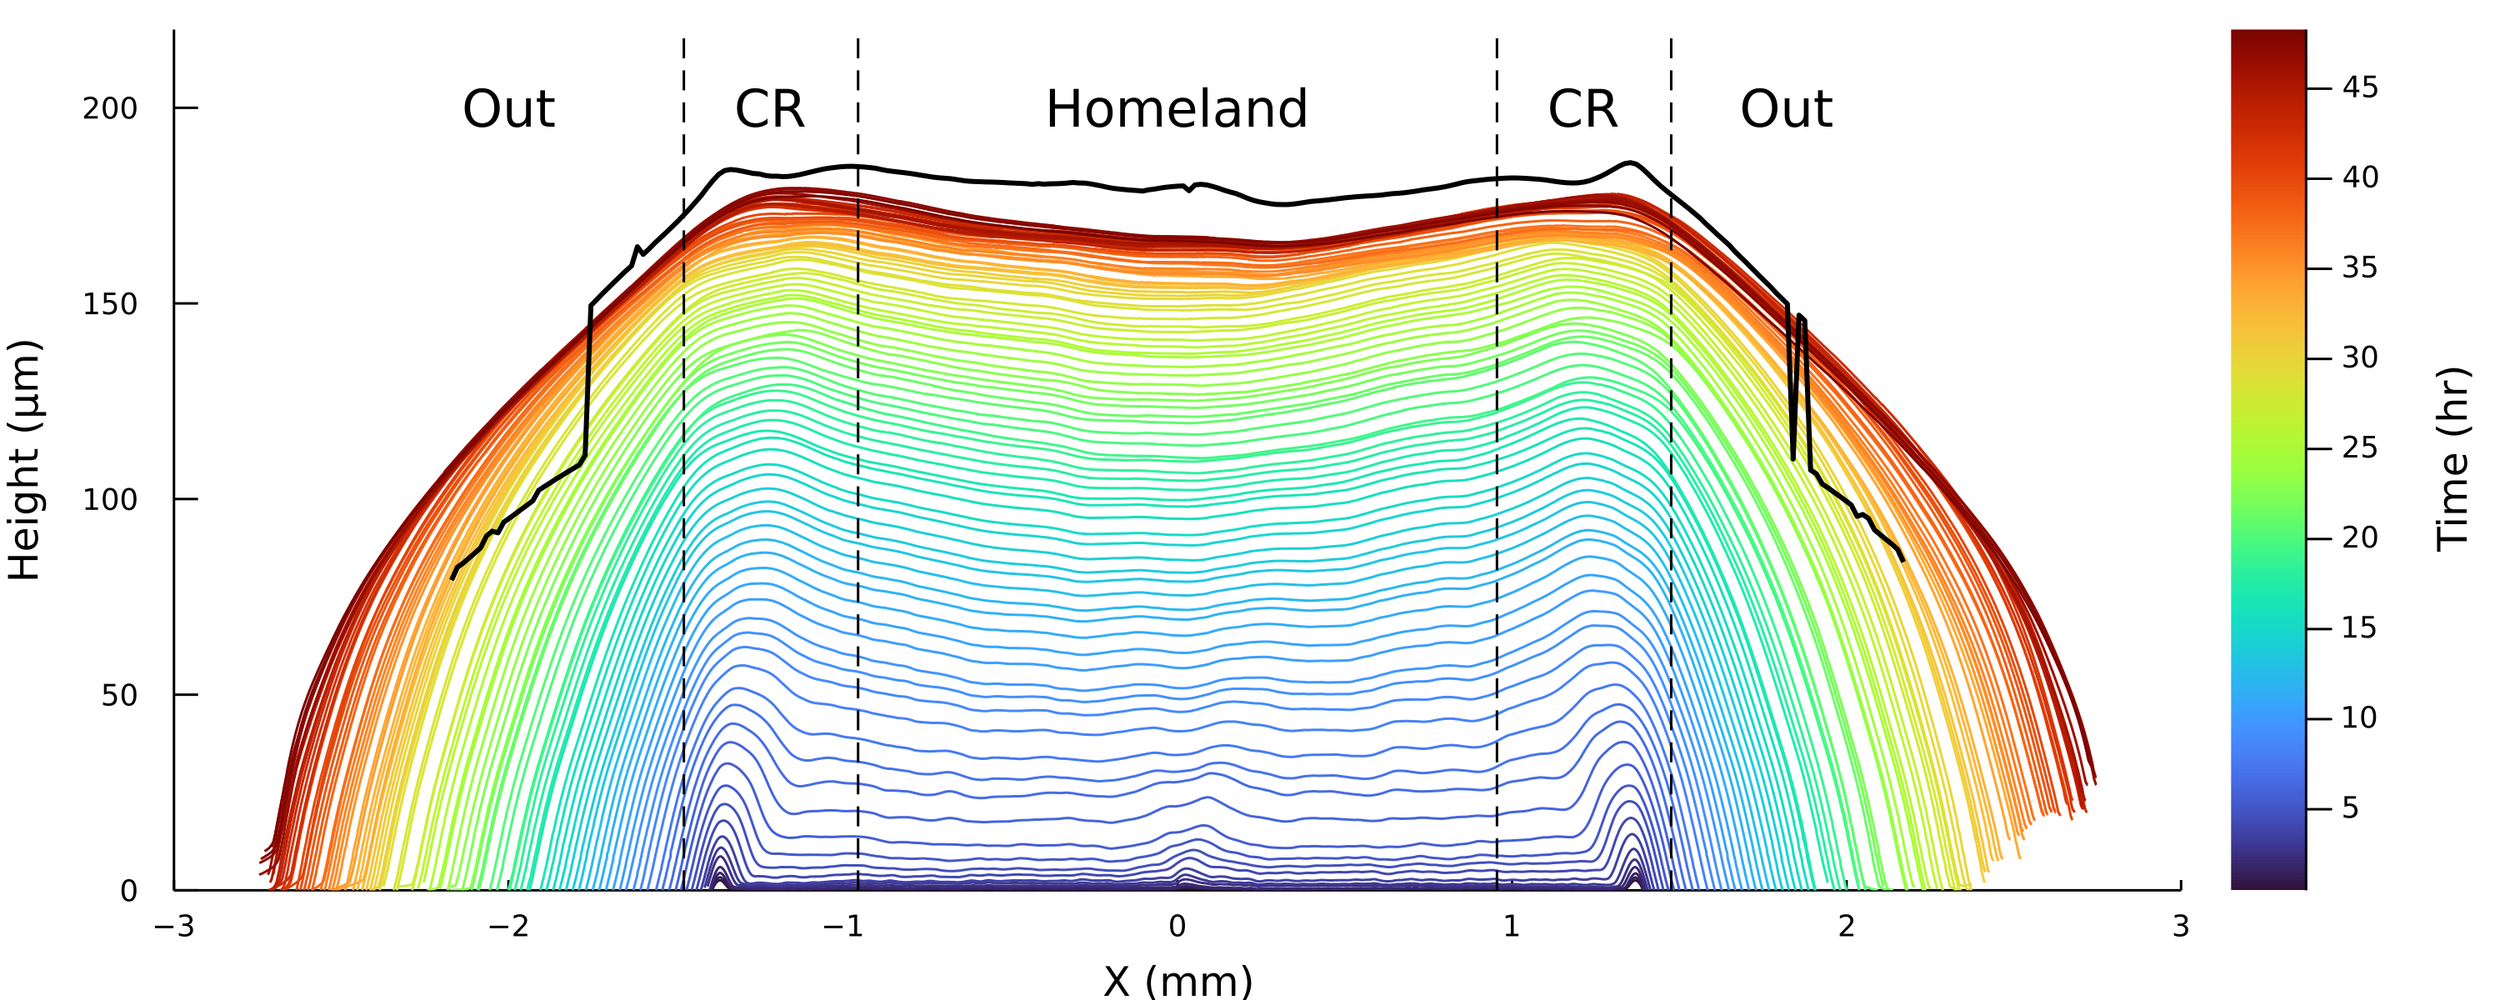
Starting inoculums also exhibit the coffee ring effect!
Understanding vertical growth could provide insight in the developmental process
Visualizing Bacterial Colony Morphologies Using
Time-Lapse Imaging Chamber MOCHA
Peñil Cobo et al. 2017
Sauer, K., et al. Nature Reviews Microbiology (2019)
Hartmann, R., et al. Nature Microbiology (2021)
Images by Dr. Gabi Steinbach
Unprocessed
Processed
Horizontal Growth
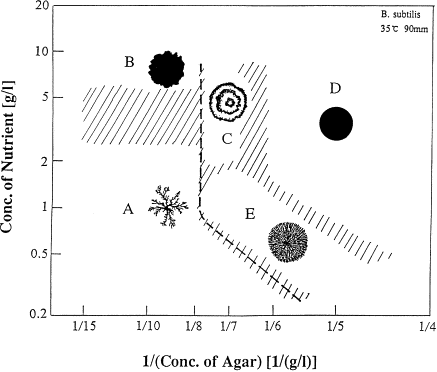
Matsuyama, T., et al. FEMS Microbiology Letters (1989)
Fujikawa, H. et al. JPSJ (1989)
Farrel, F.D.C., et al. Physical Review Letters (2013)
The same strain can exhibit different morphologies depending in the environment!
Adkins, R., Kolvin, I., You, Z., et al. Science (2022)
Horizontal Growth
Vertical
Growth
\( 0.5 mm\)
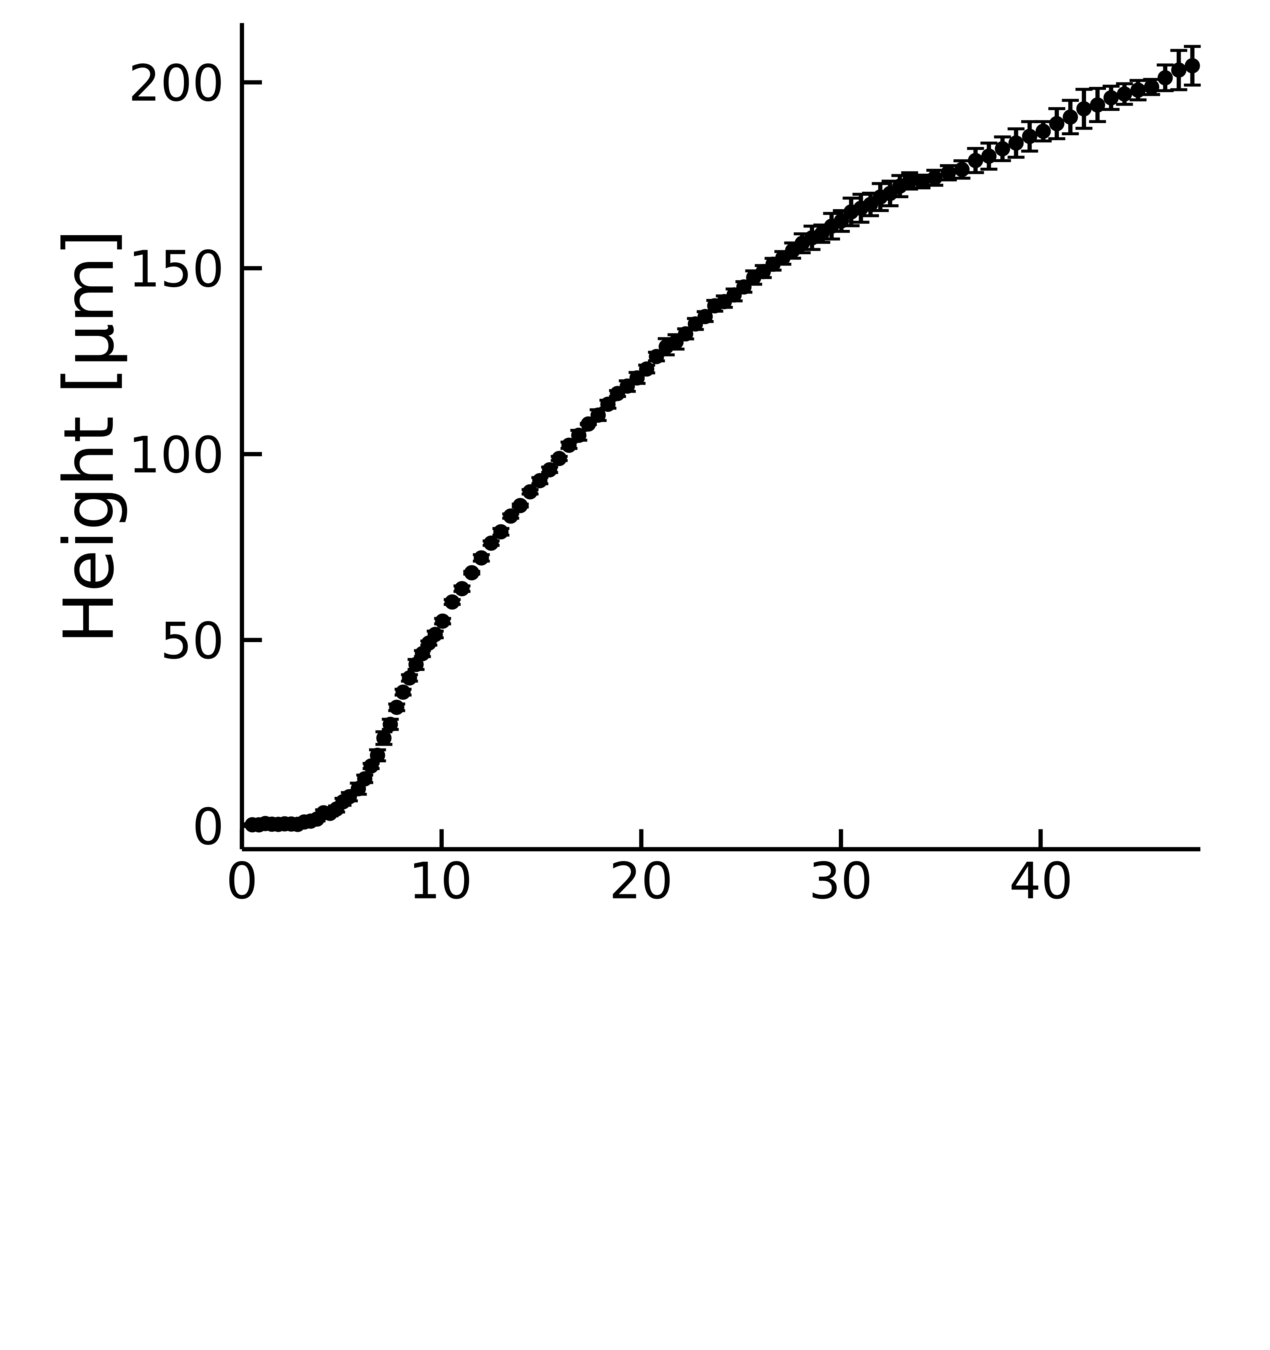
0
2
4
6
8
10
\(\Delta z\) (\( \mu m\))
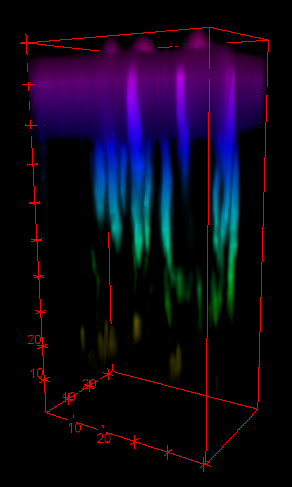
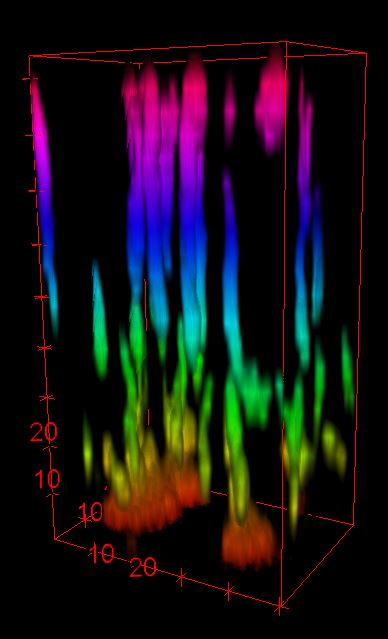
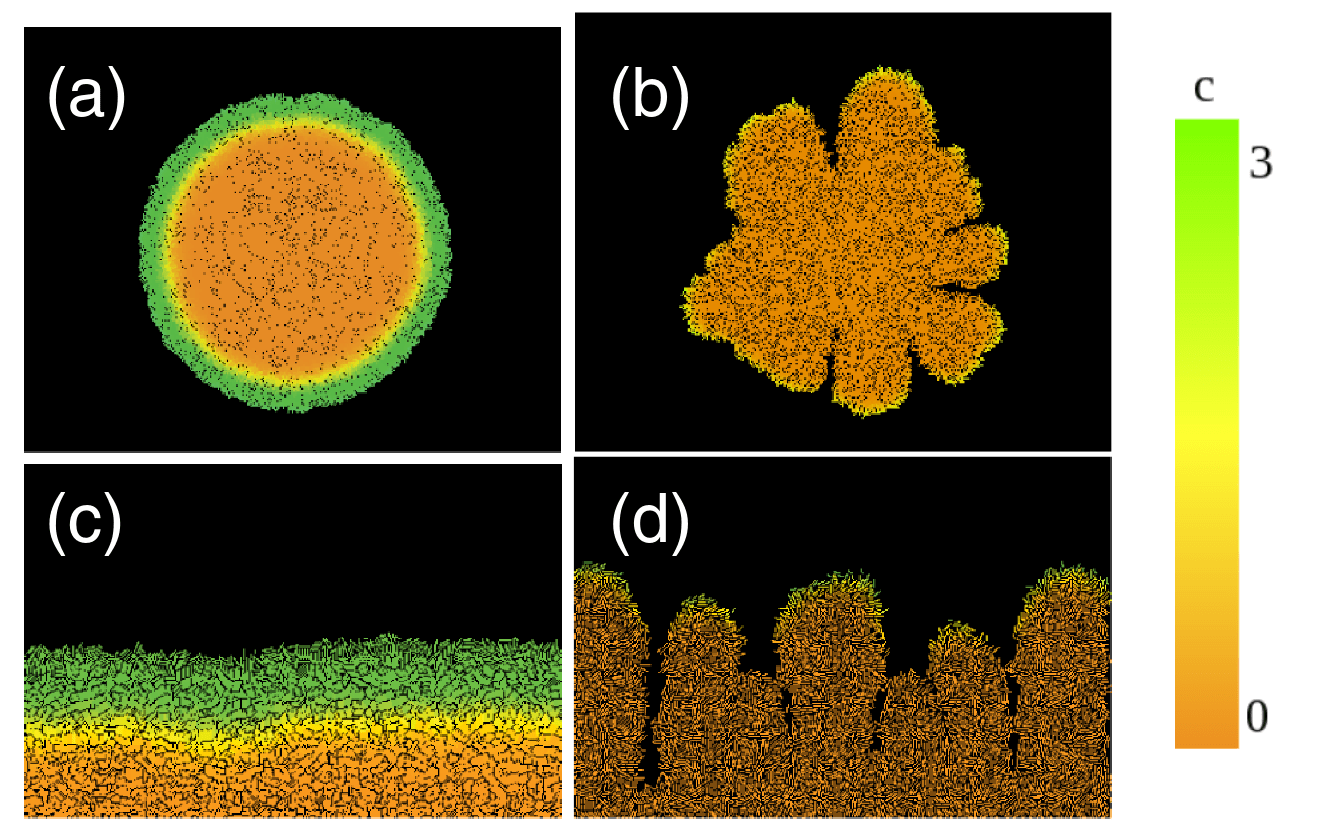
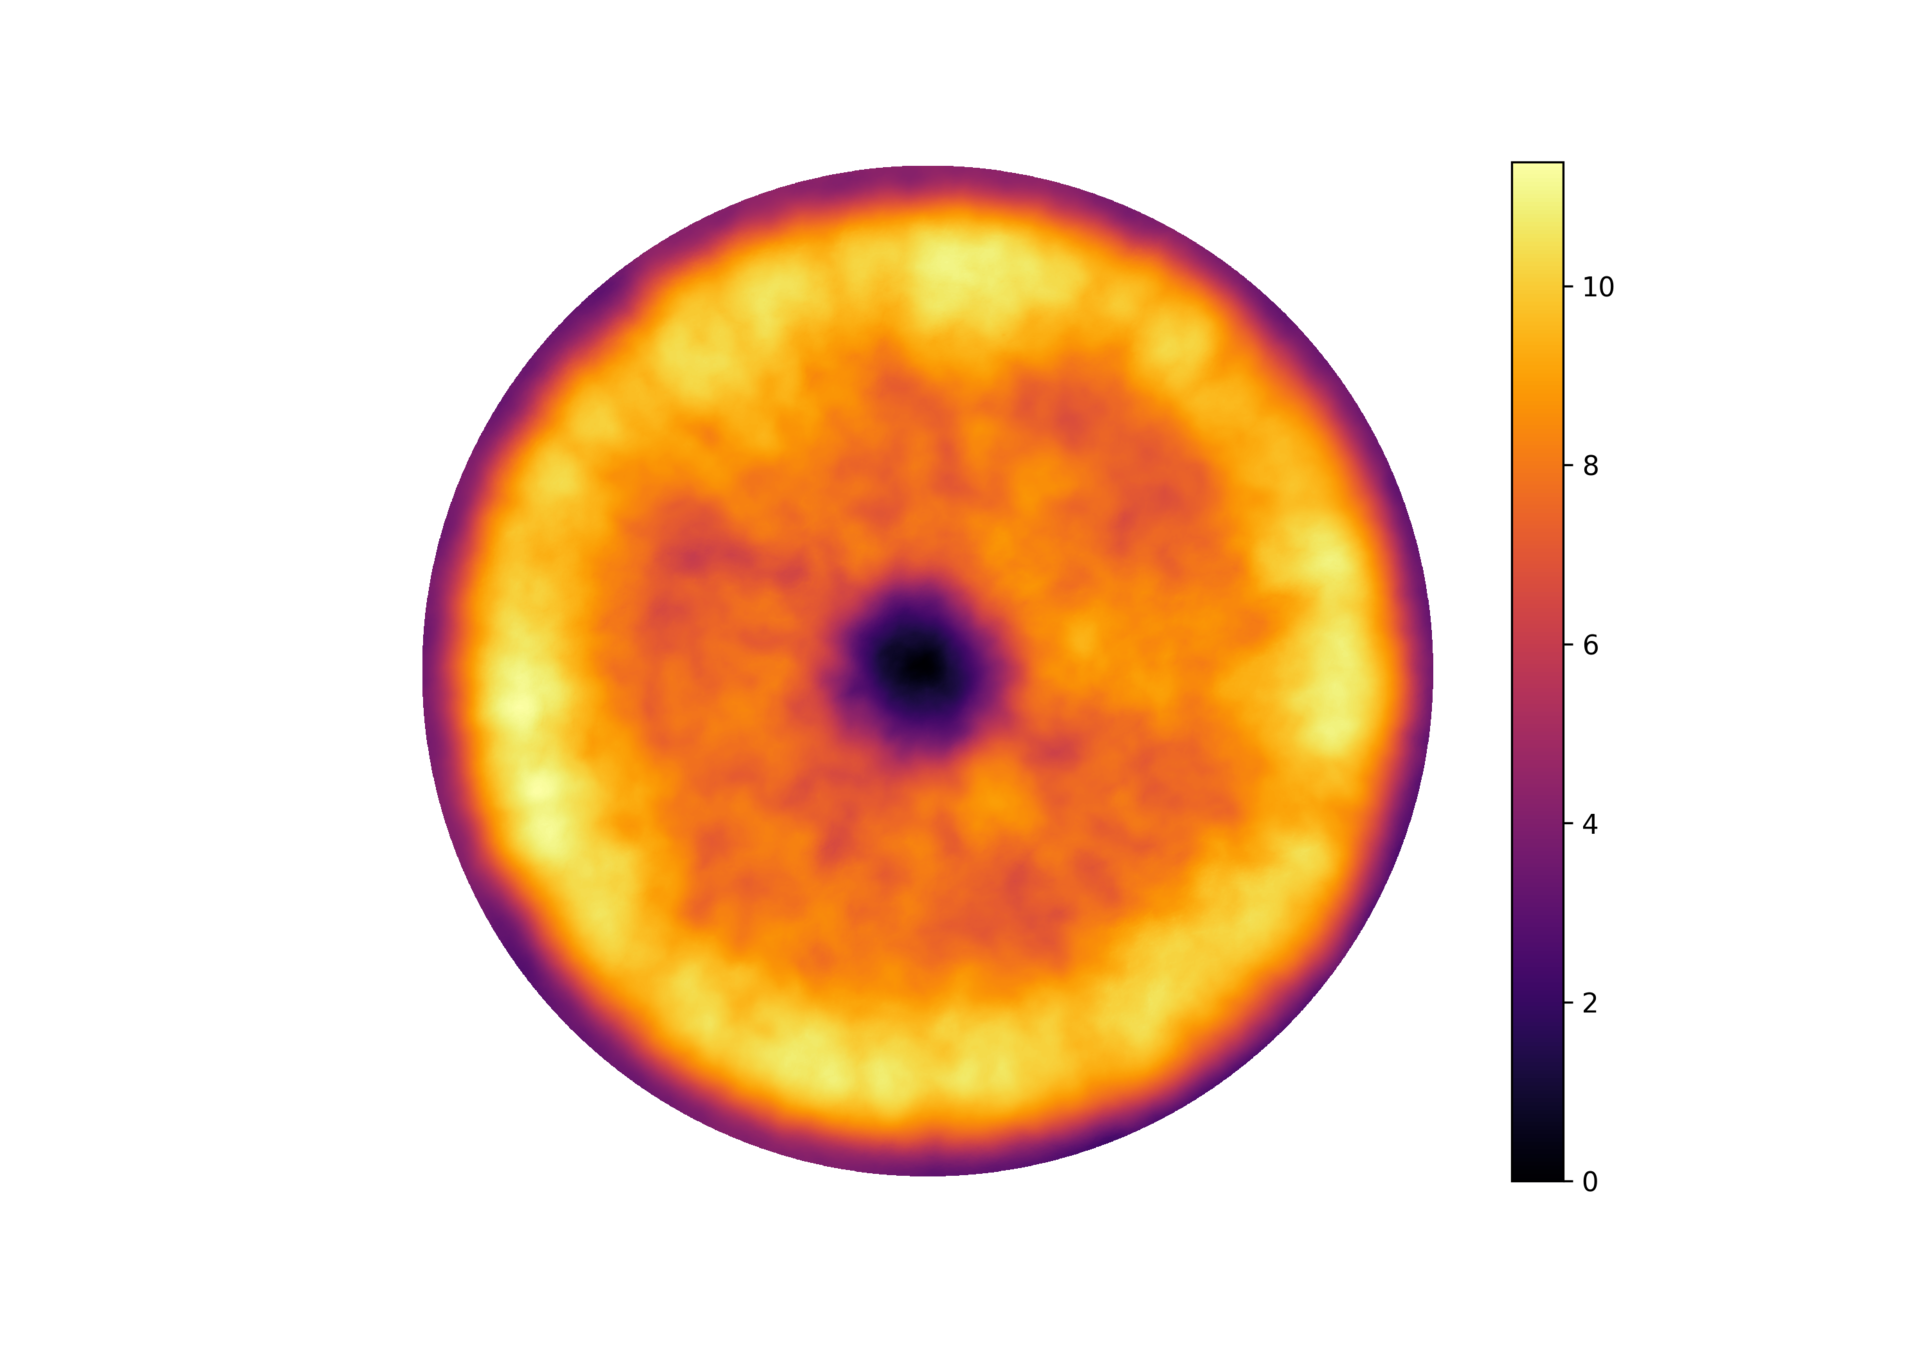
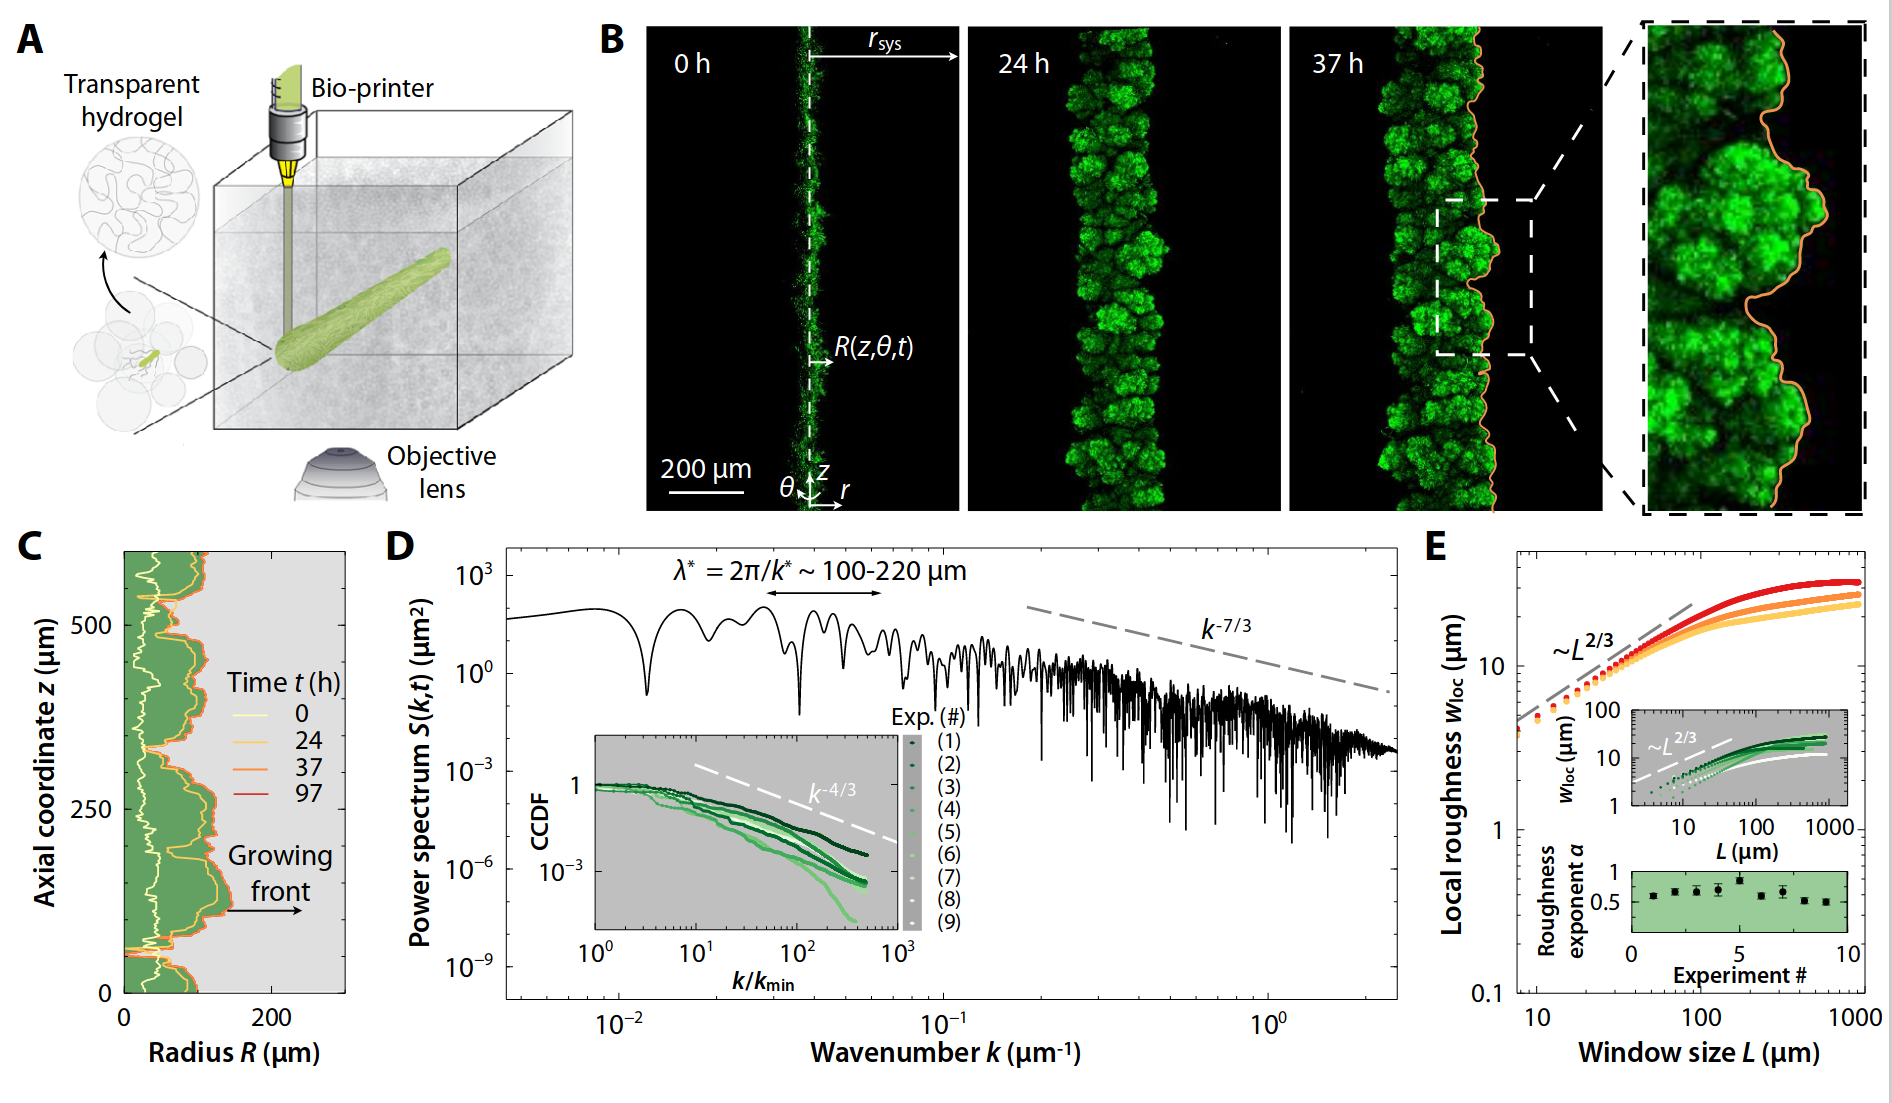
Central region of a vibrio cholerae biofilm
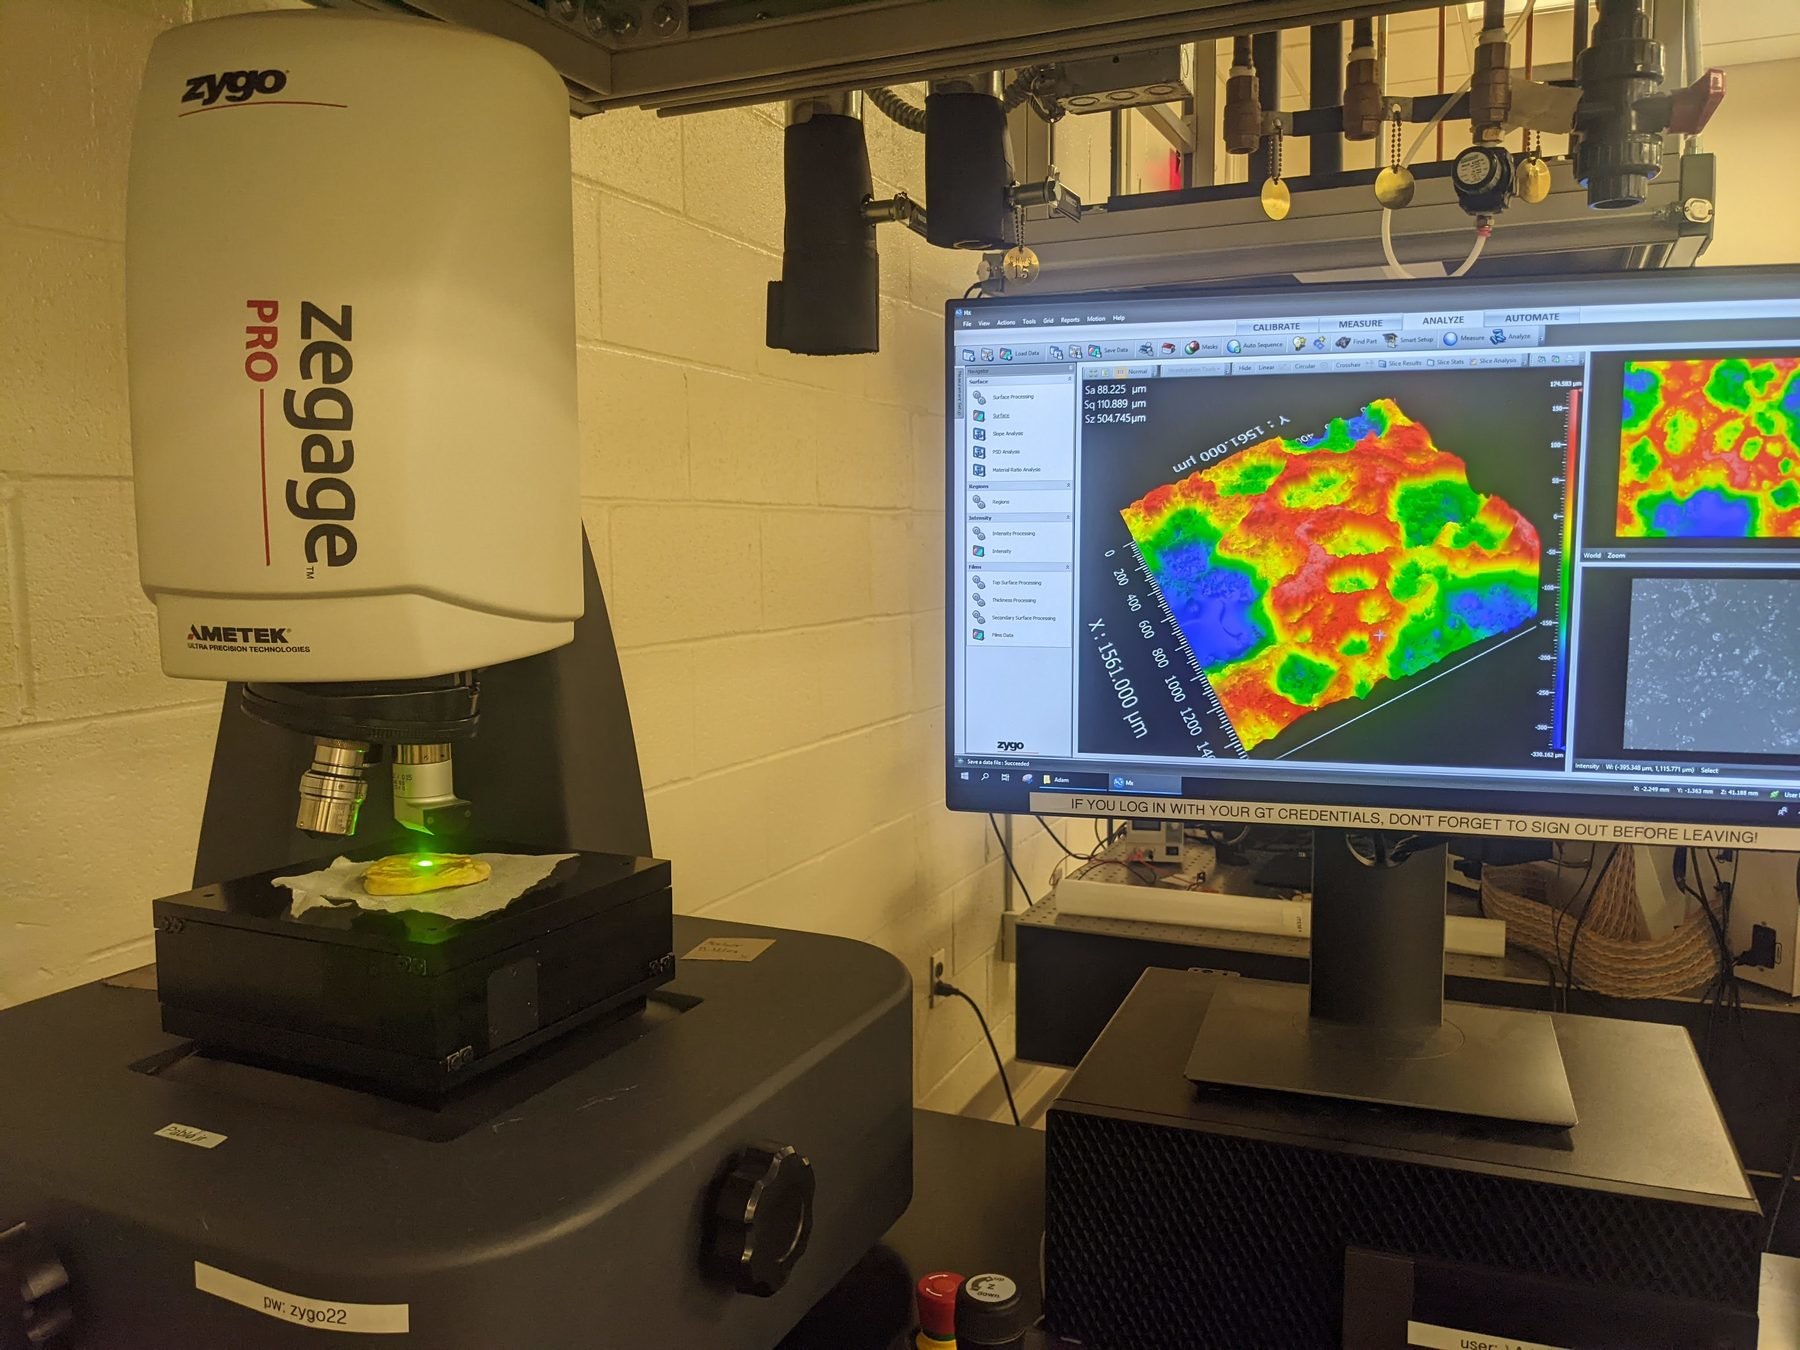
Surface topography + intensity!
Kalziqi, A., et al. PRL (2018)
Kalziqi, A., et al. ArXiv preprint (2019)
Yan, J., et al. eLife (2019)
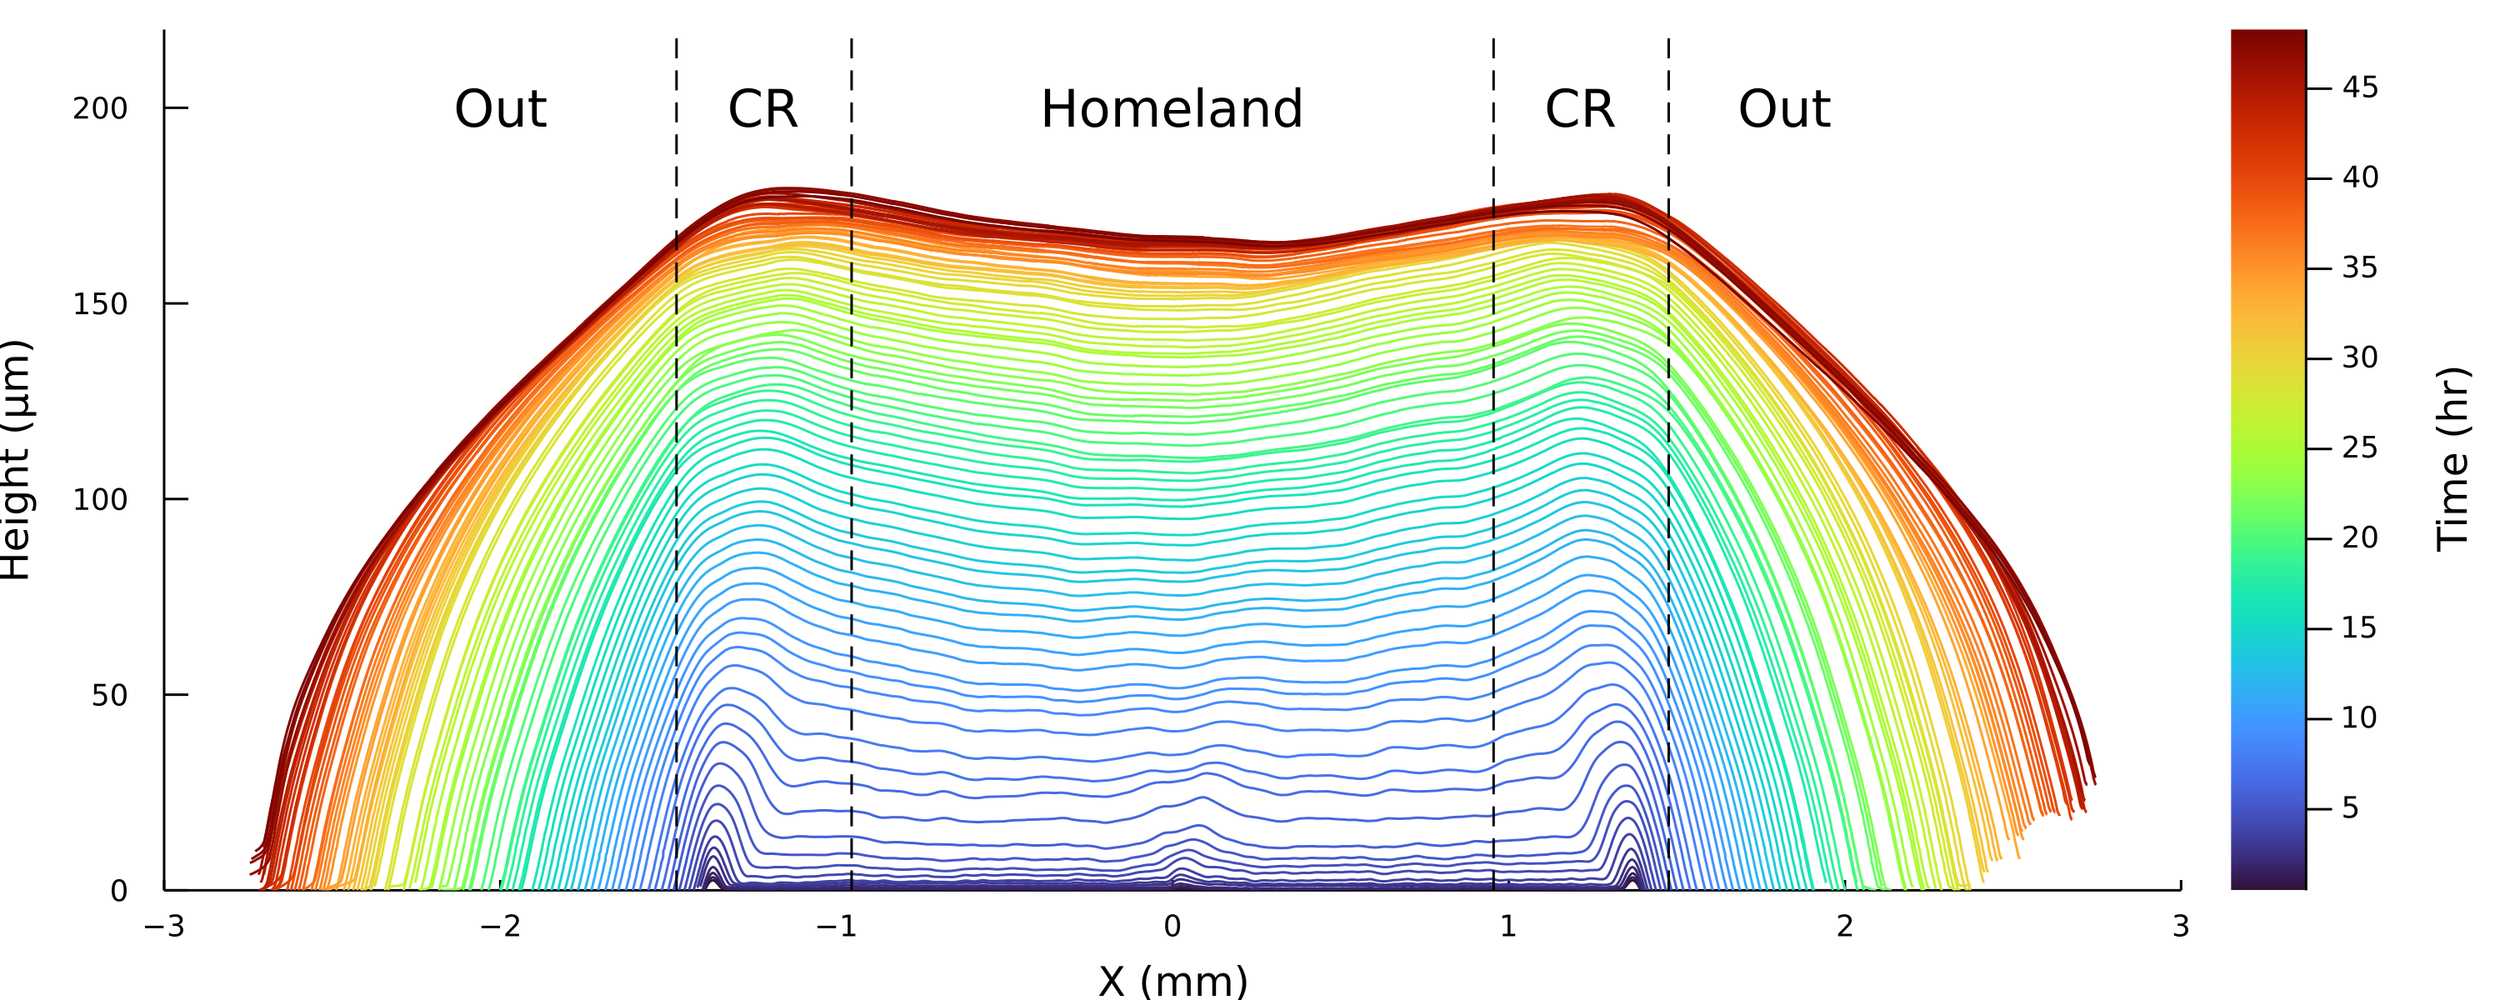
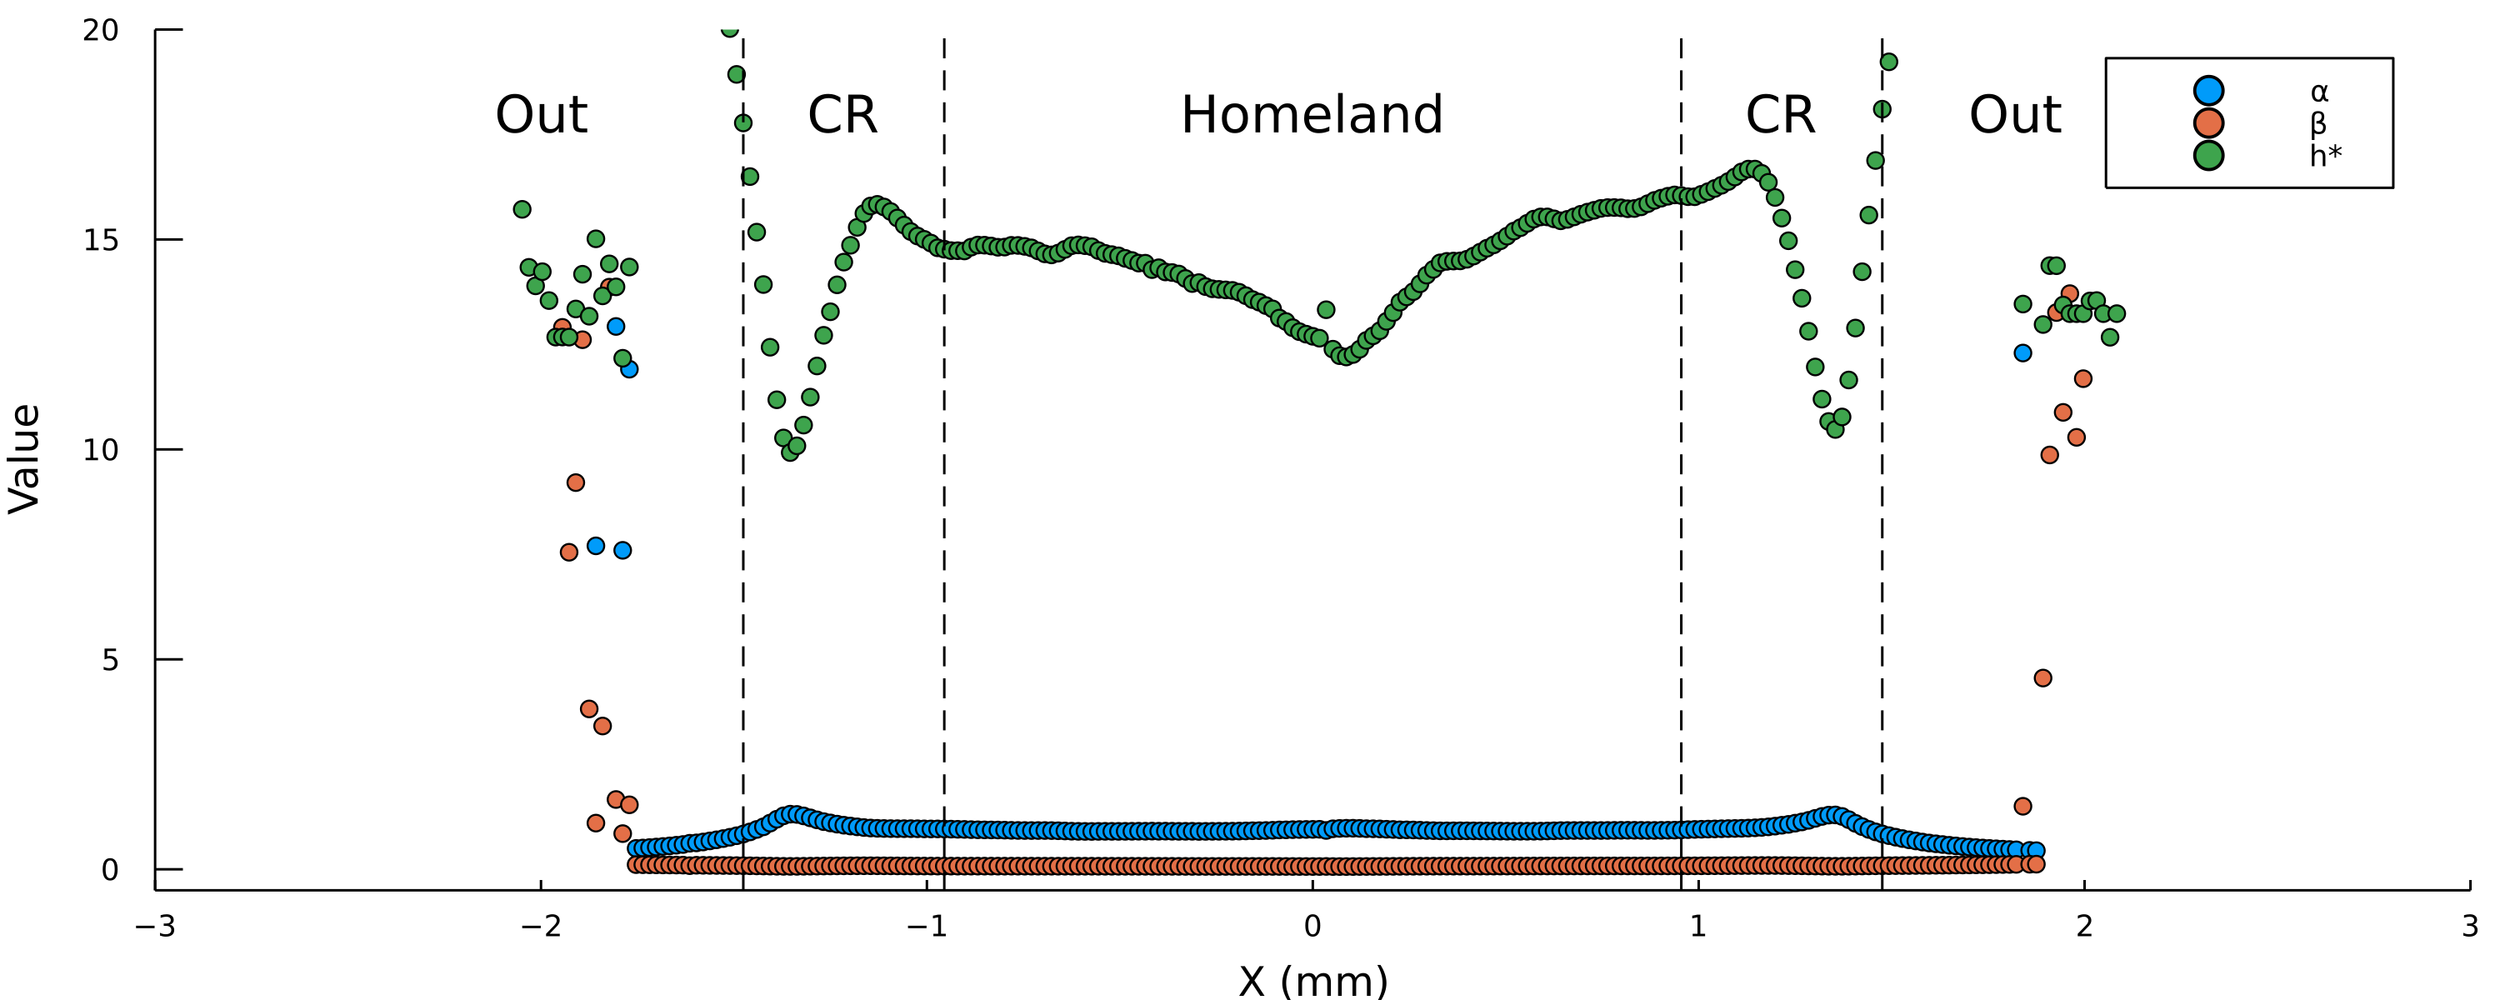
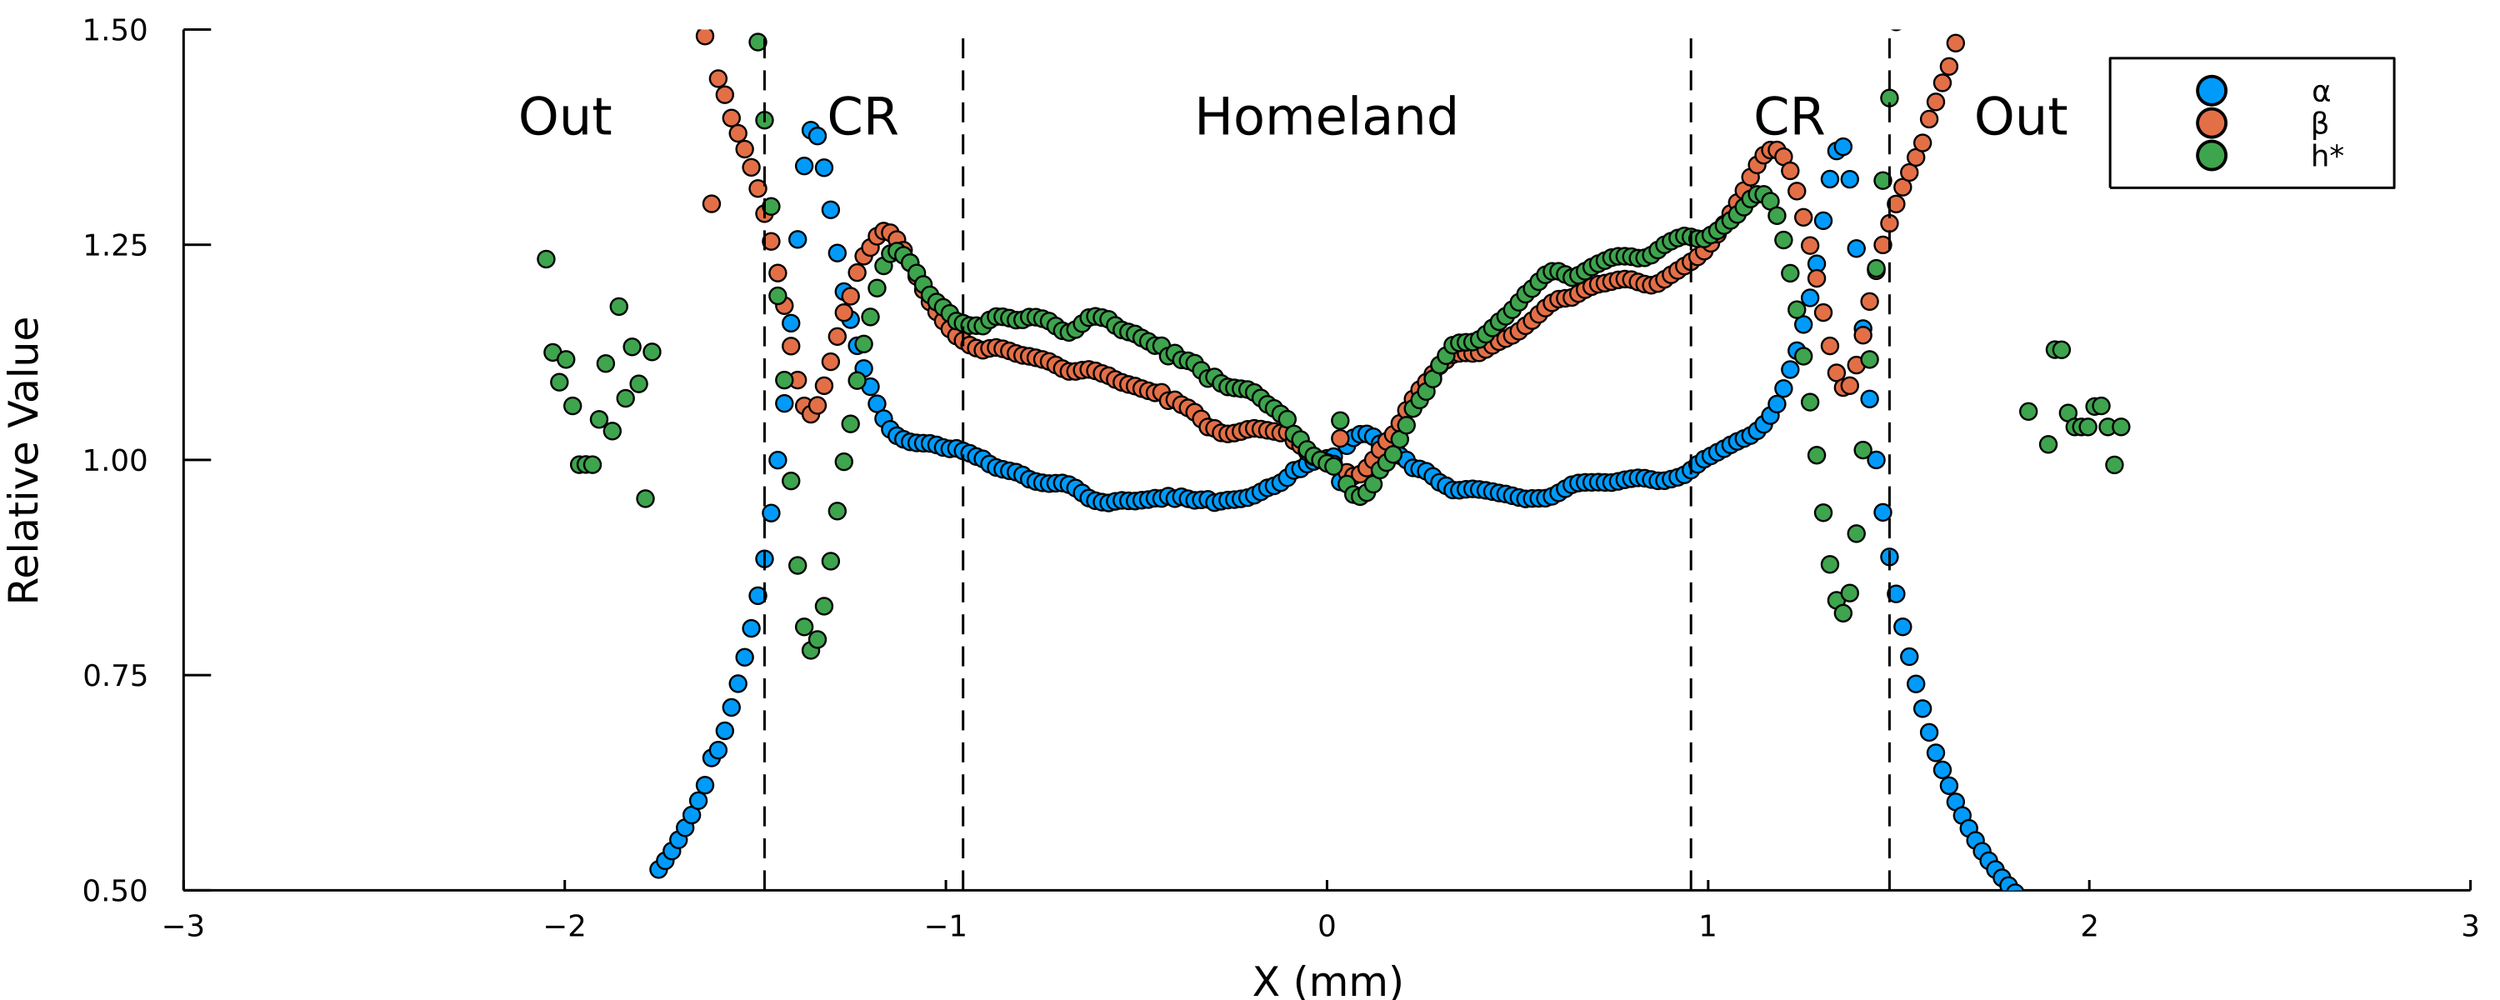
Homeland
Agar
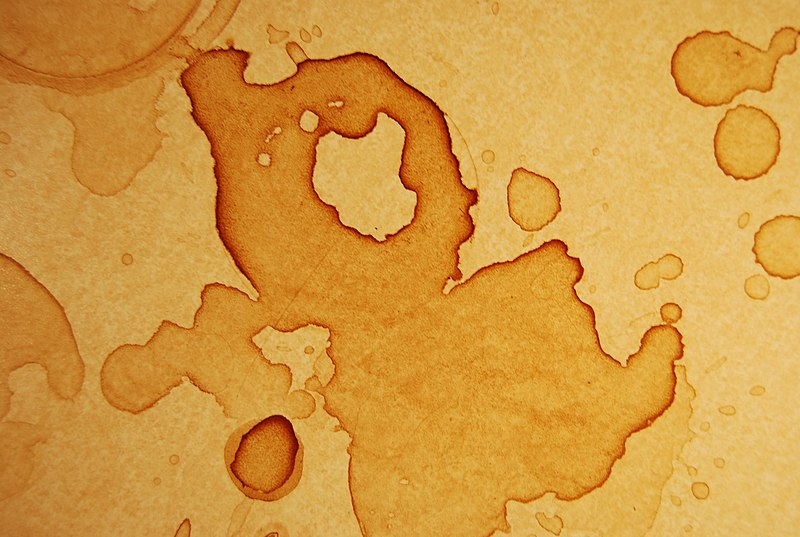
Coffee Ring
Surface topography and intensity from Interferometry
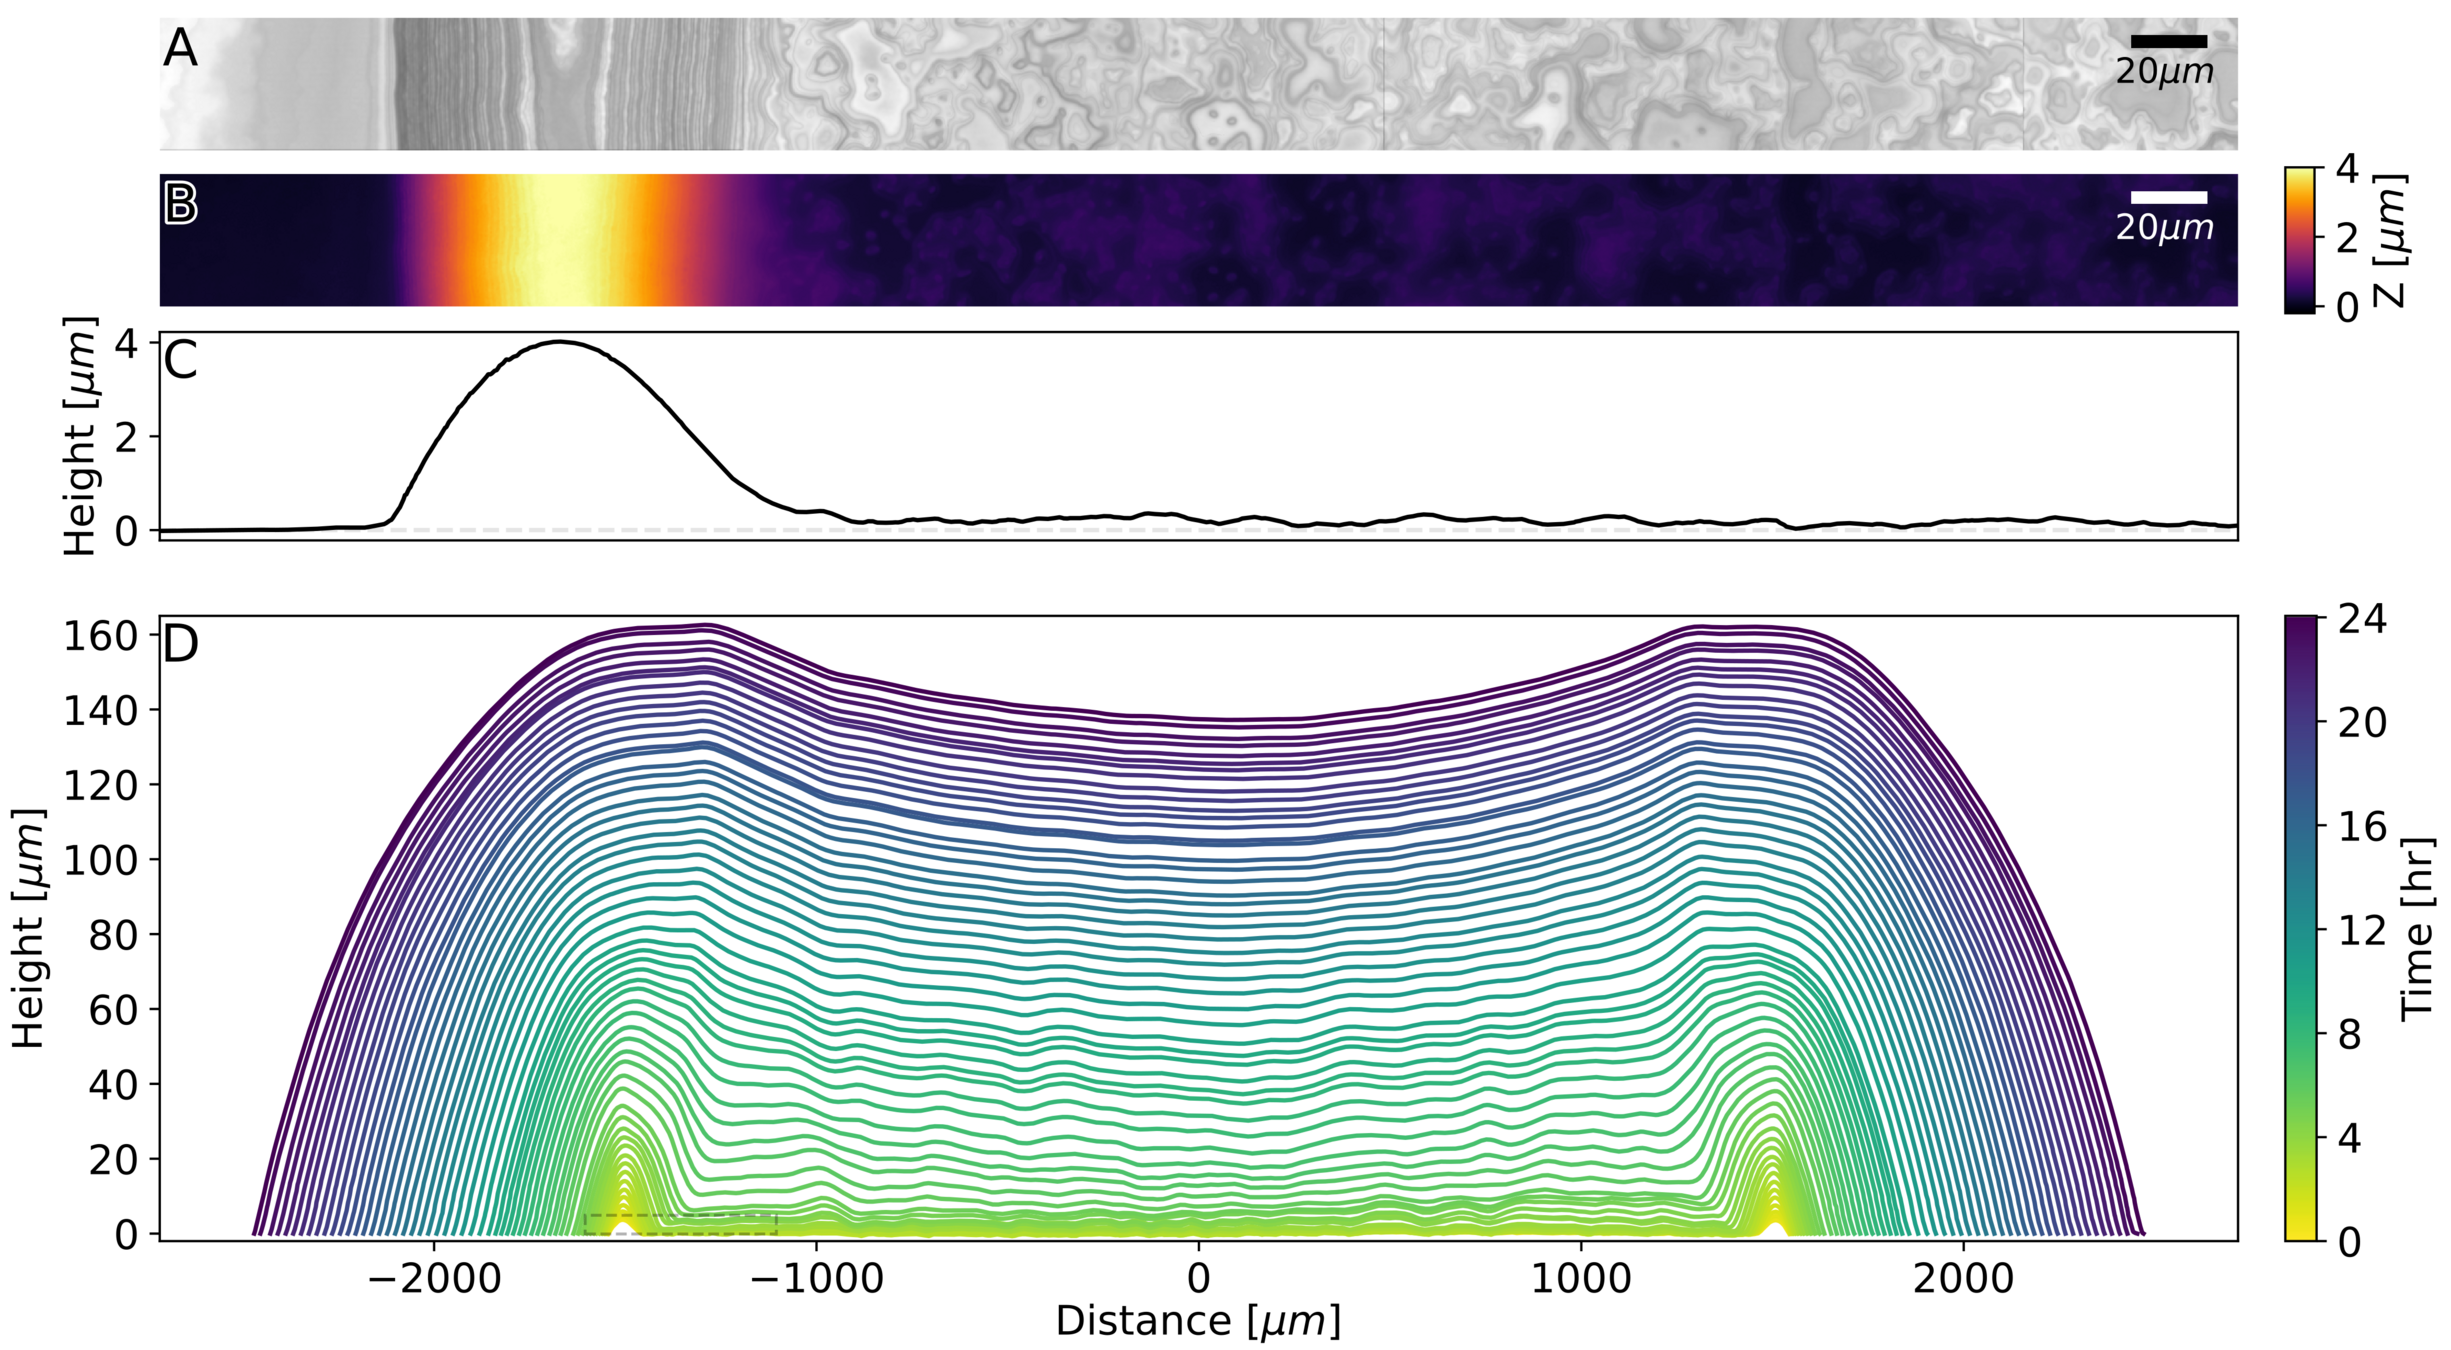
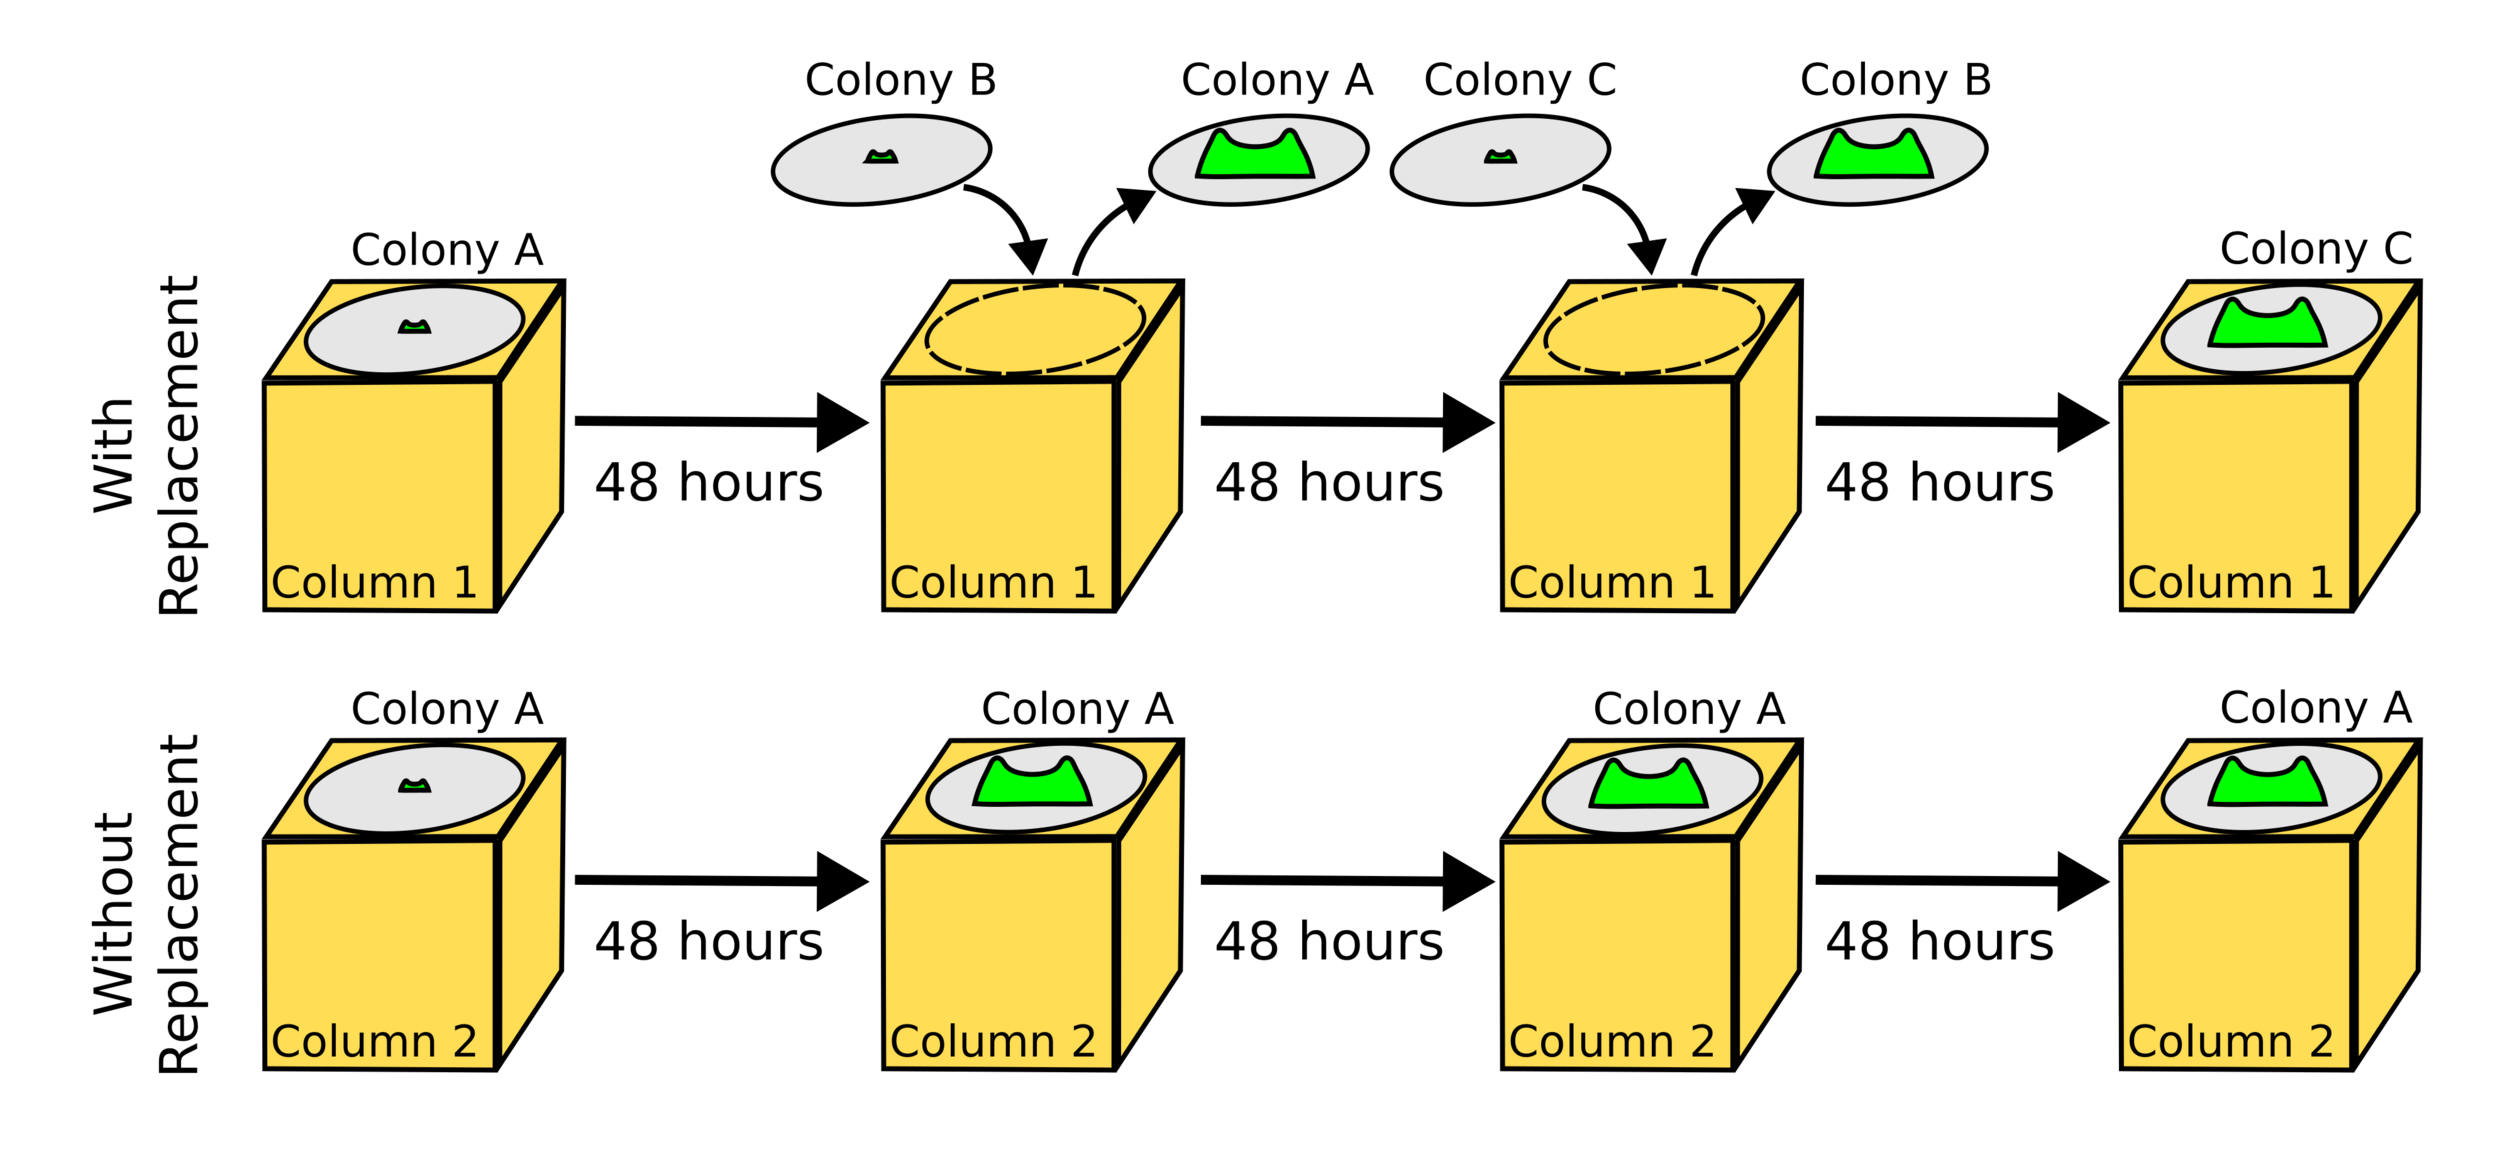
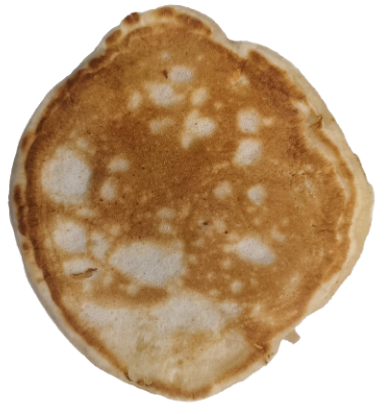
S. cerevisiae, 48 hours of growth.
Bravo 2022
Things didn't go quite well the first ~10 attempts
Hours
0
48
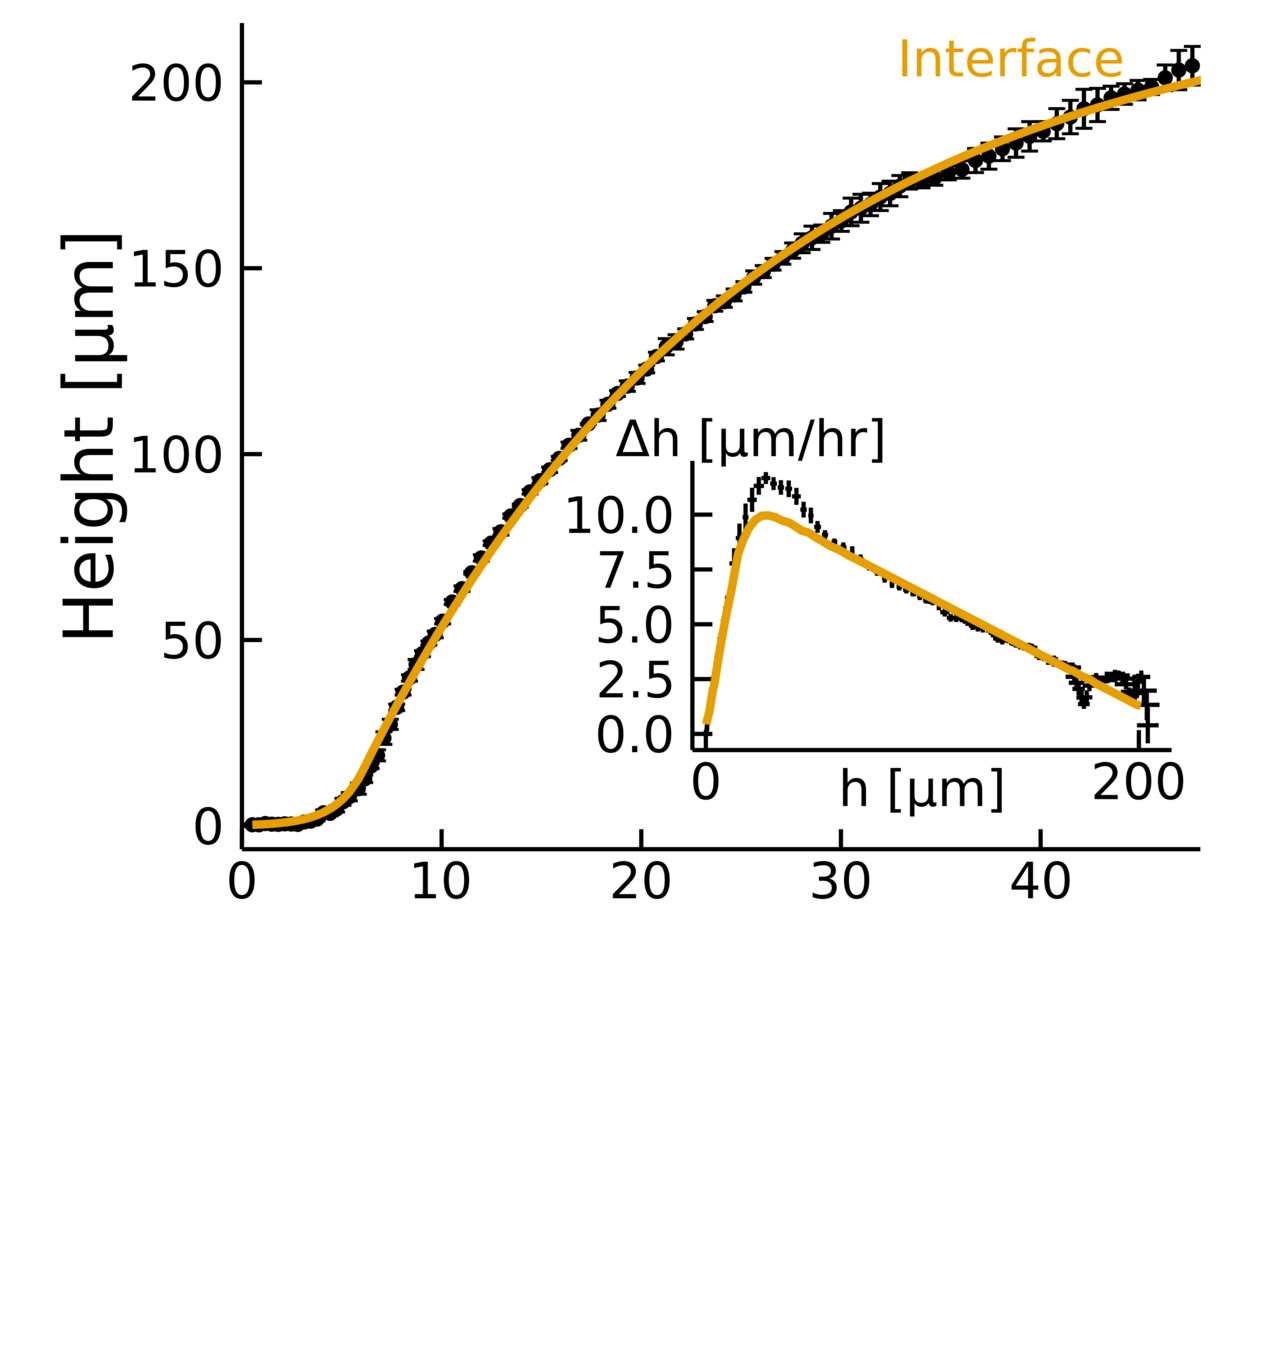
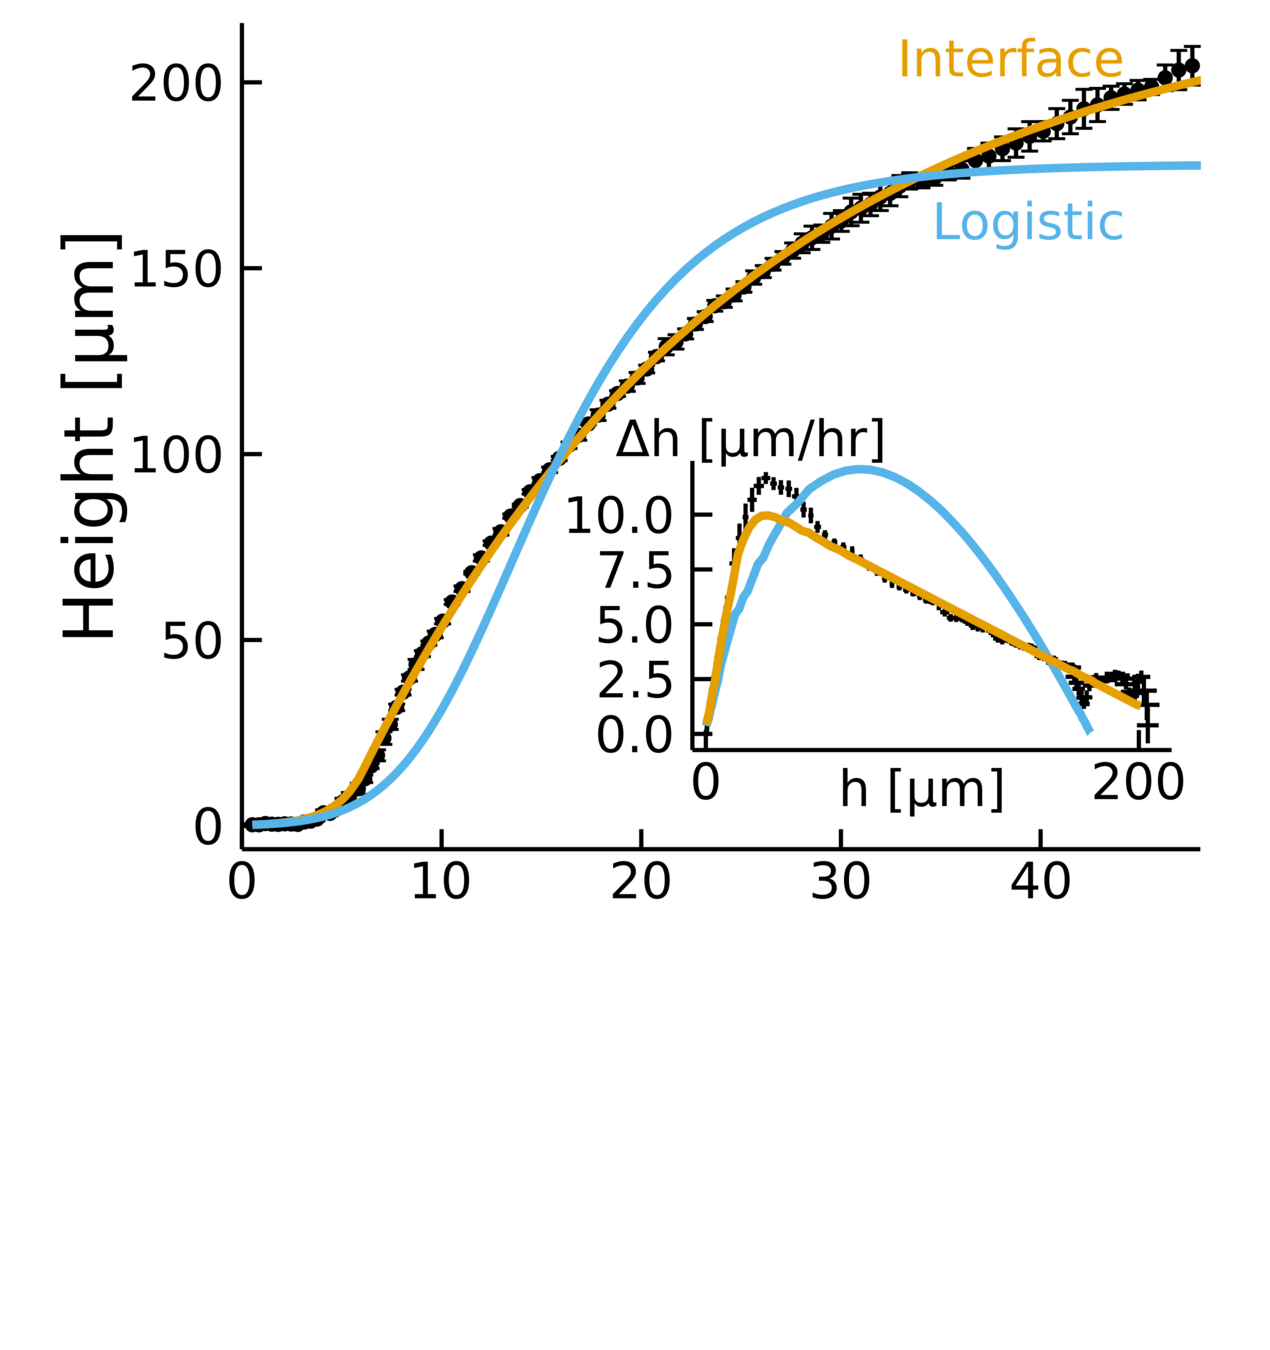
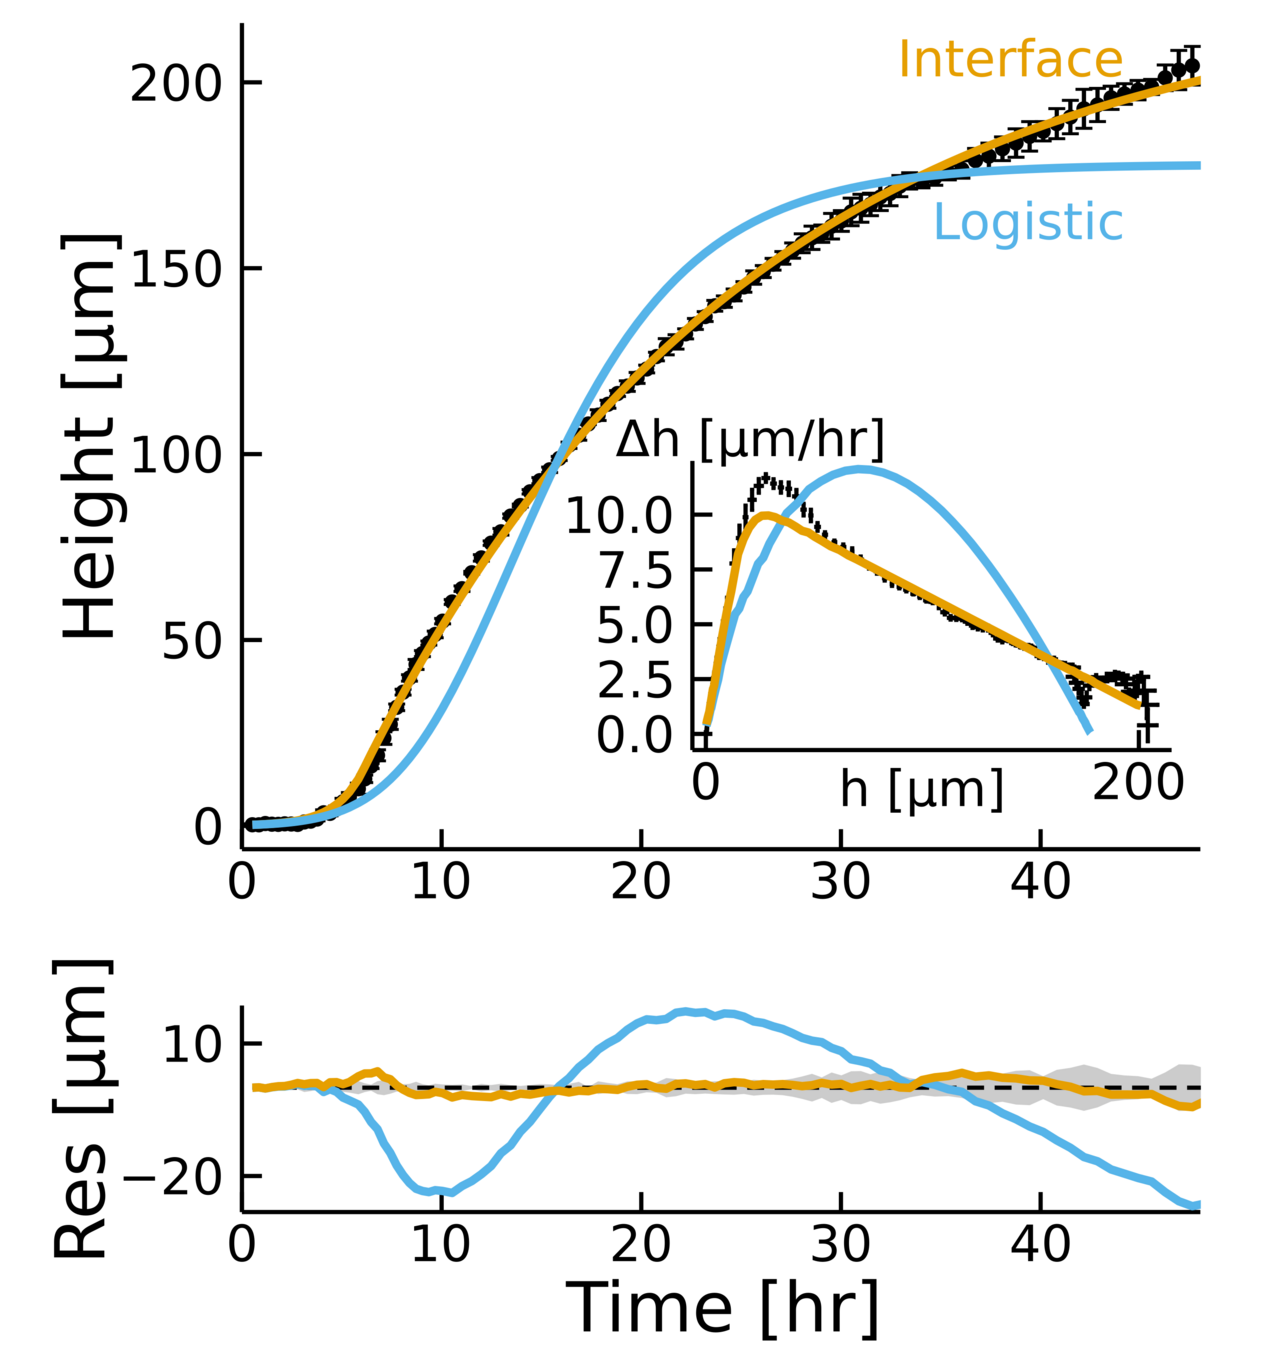
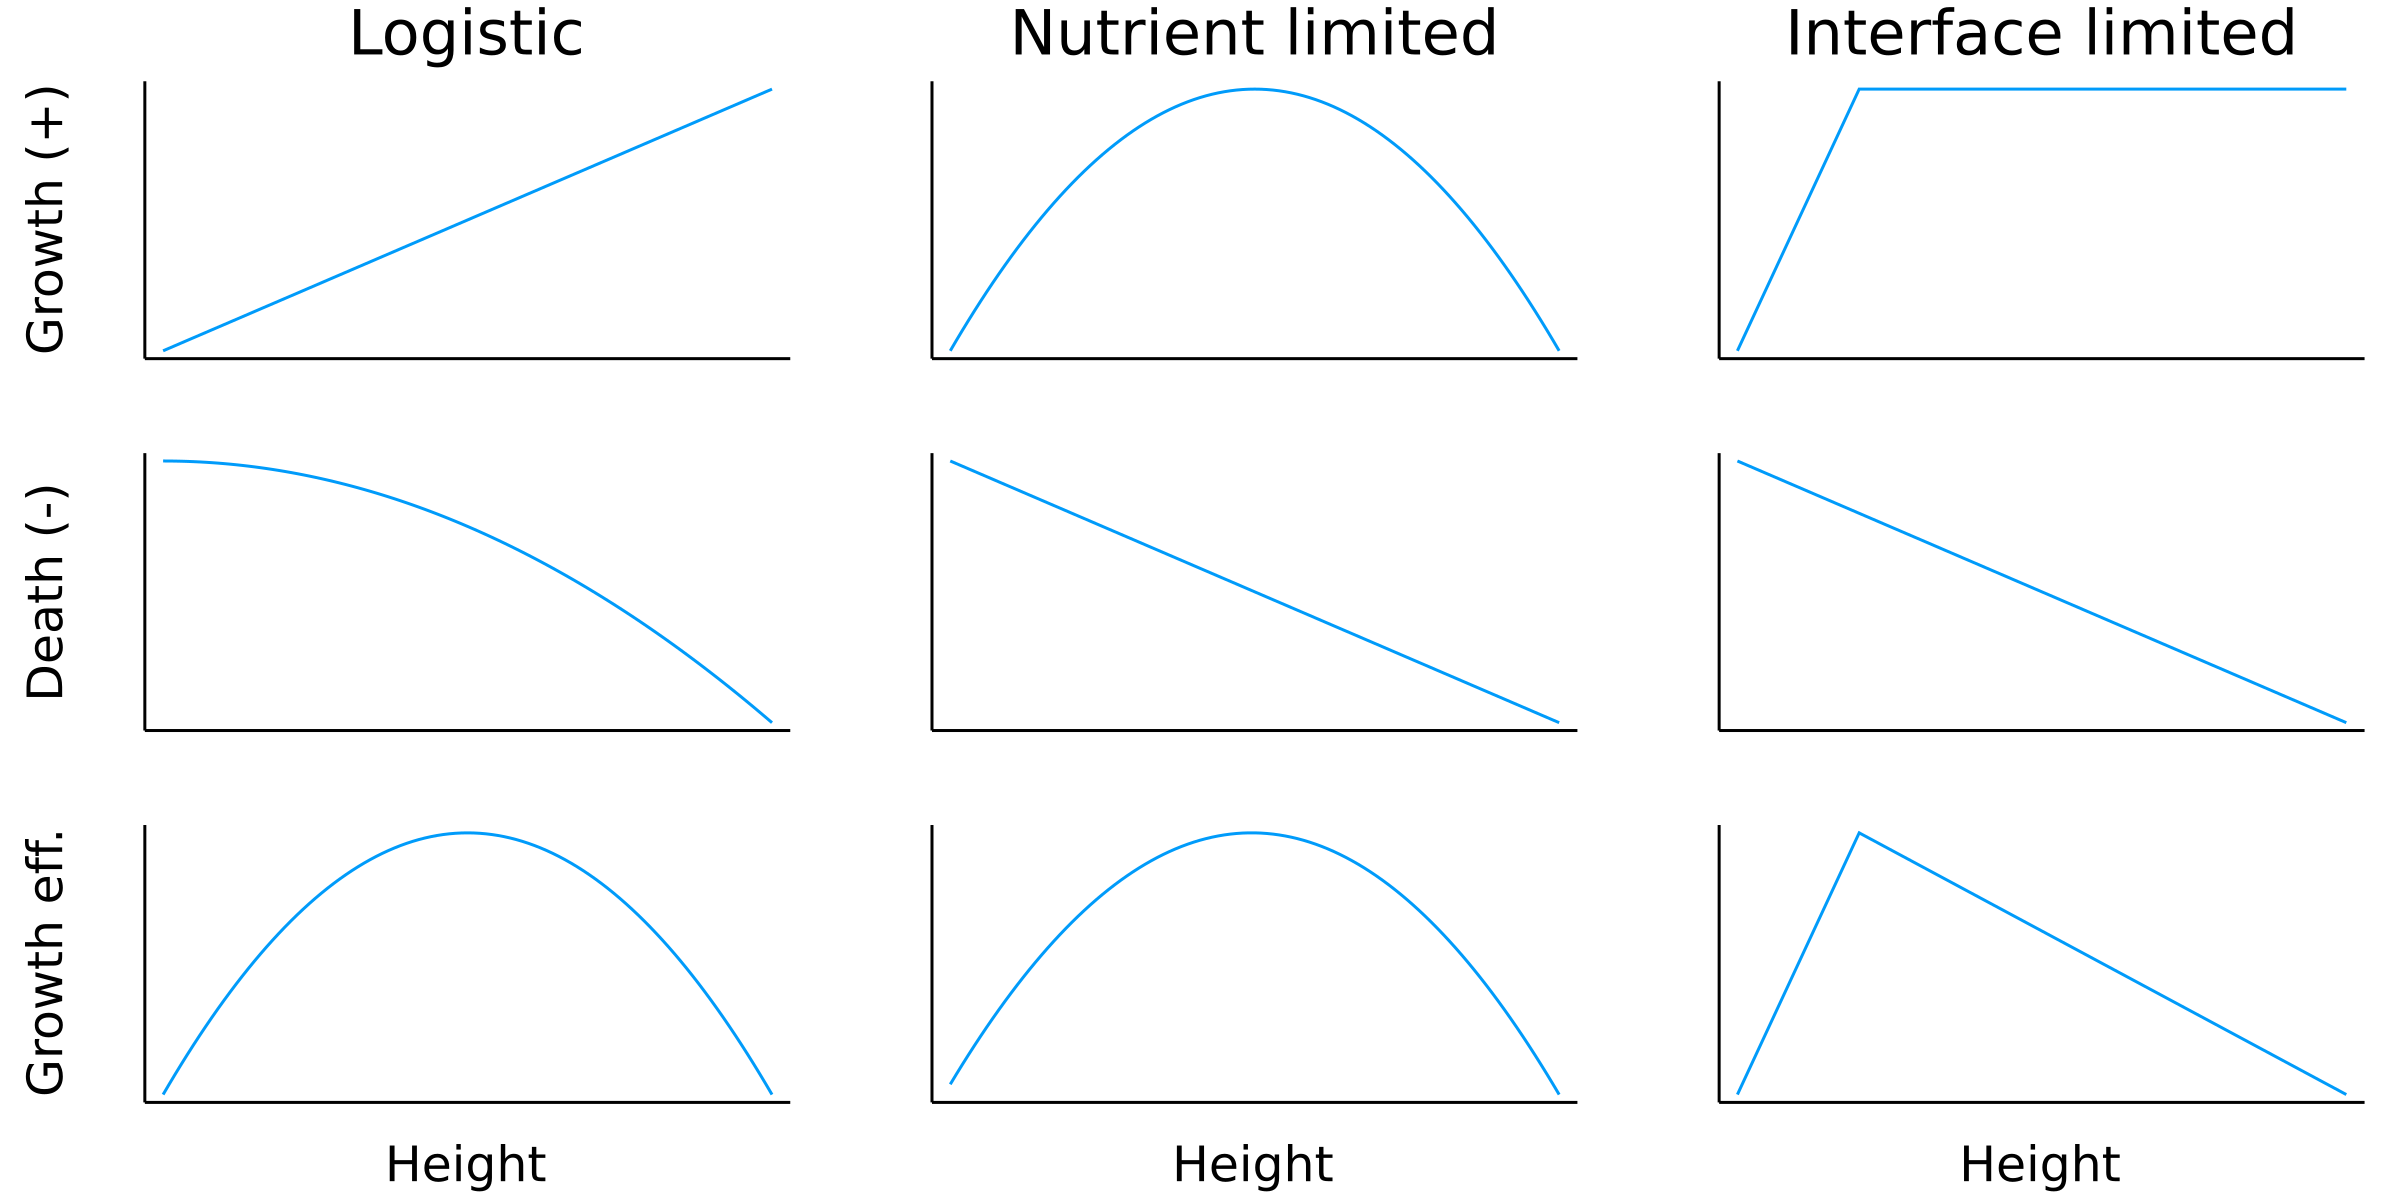
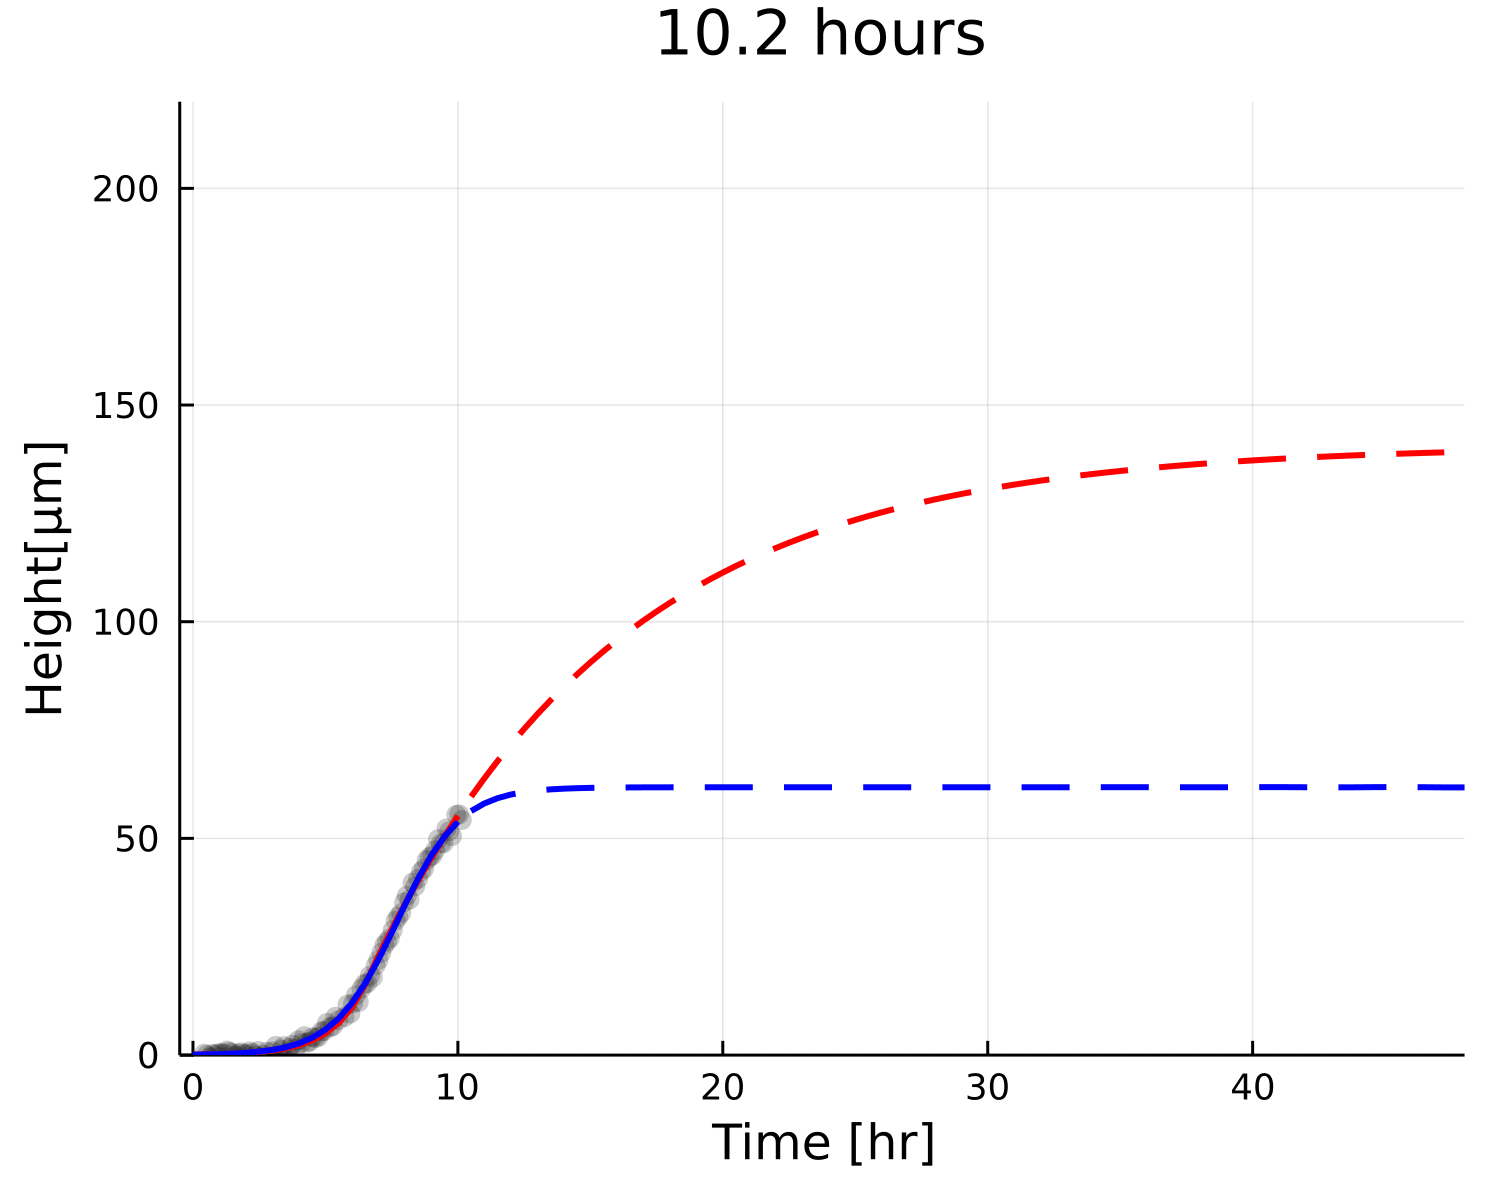
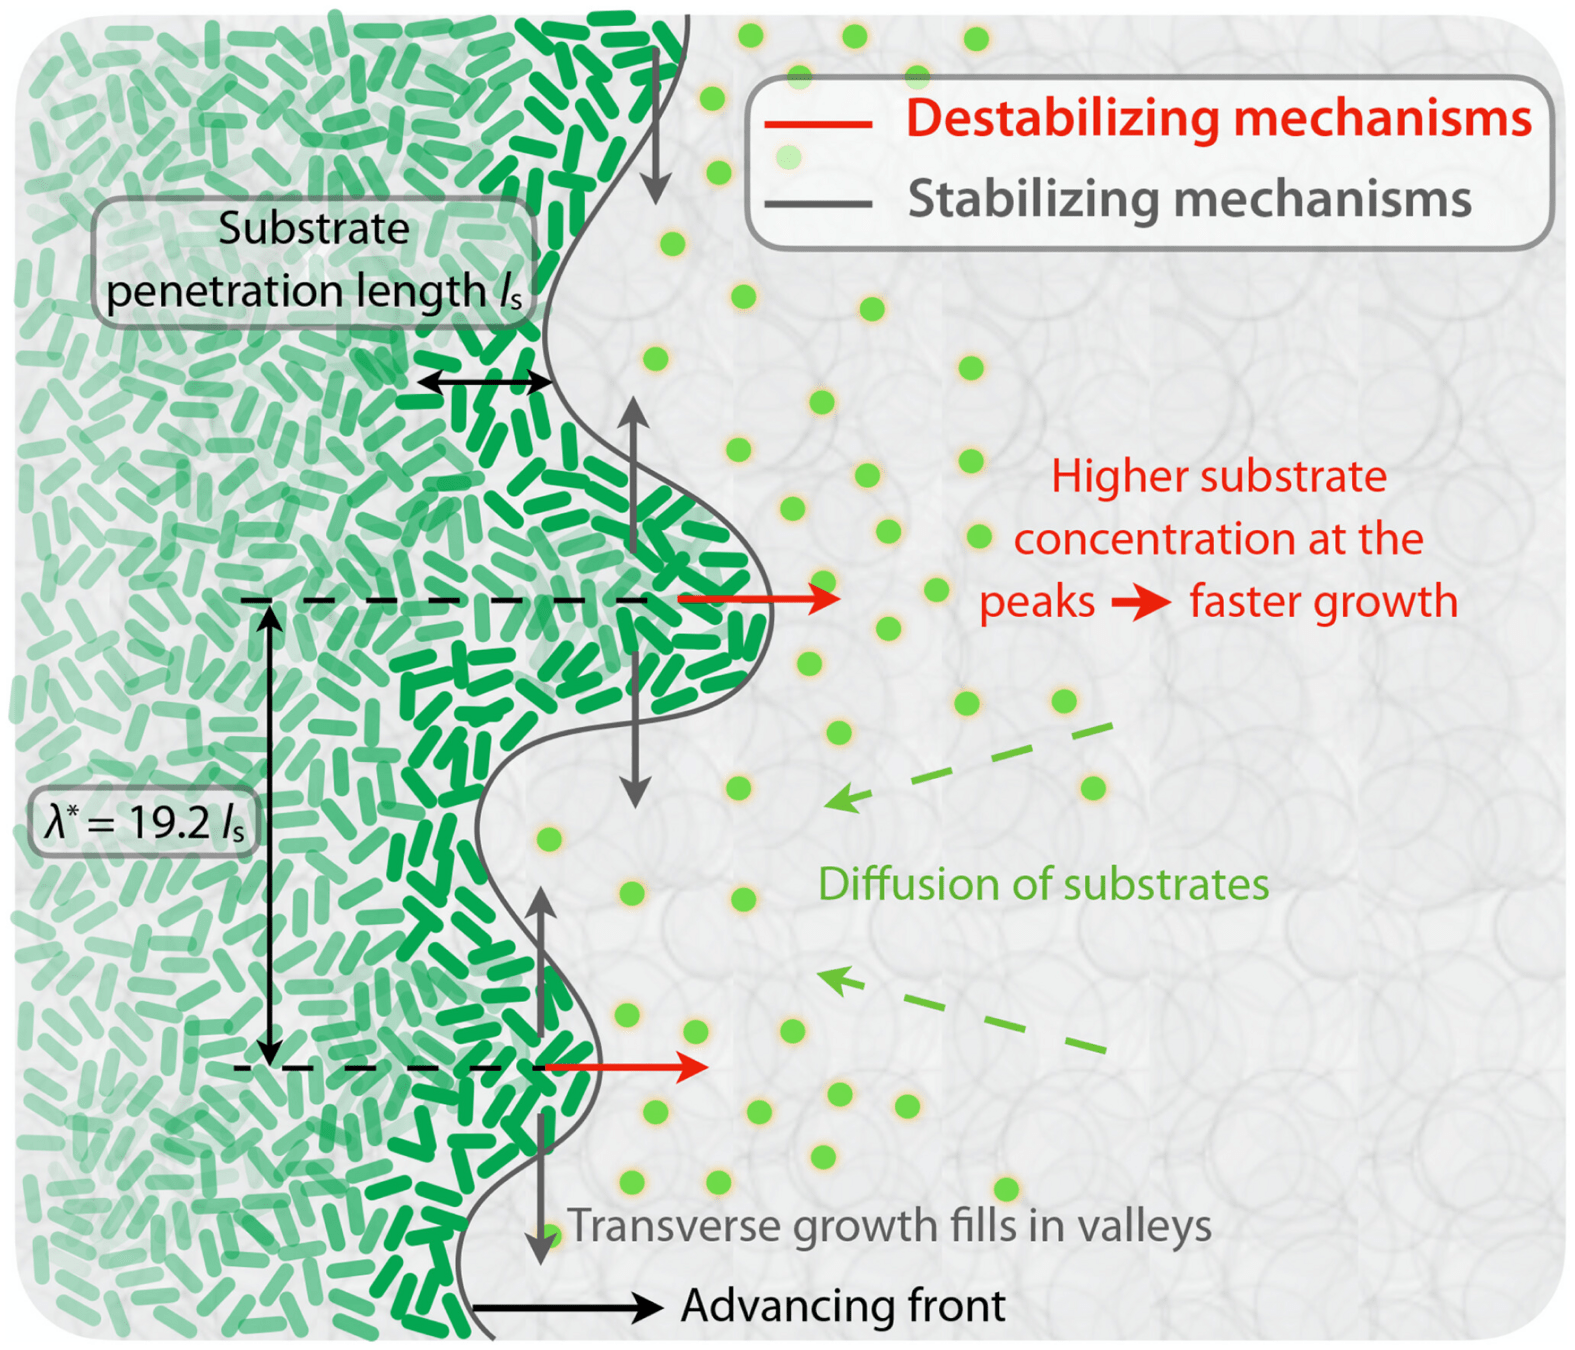
Two regimes in which vertical growth depends
linearly with the height of the colony
\(z\)
Concentration in the substrate
No flux in the top
Region where cells can grow is finite
Total growth of a colony saturates once they reach a critical length \(L\)
Diffusion constant
Consumption rate
Monod constant
\(z\)
Concentration in the substrate
No flux in the top
Region where cells can grow is finite
Total growth of a colony saturates once they reach a critical length \(L\)
Consumption rate
Diffusion constant
Monod constant
2560
Agar is not running out of nutrients!
Colonies must be slowing down for a different reason
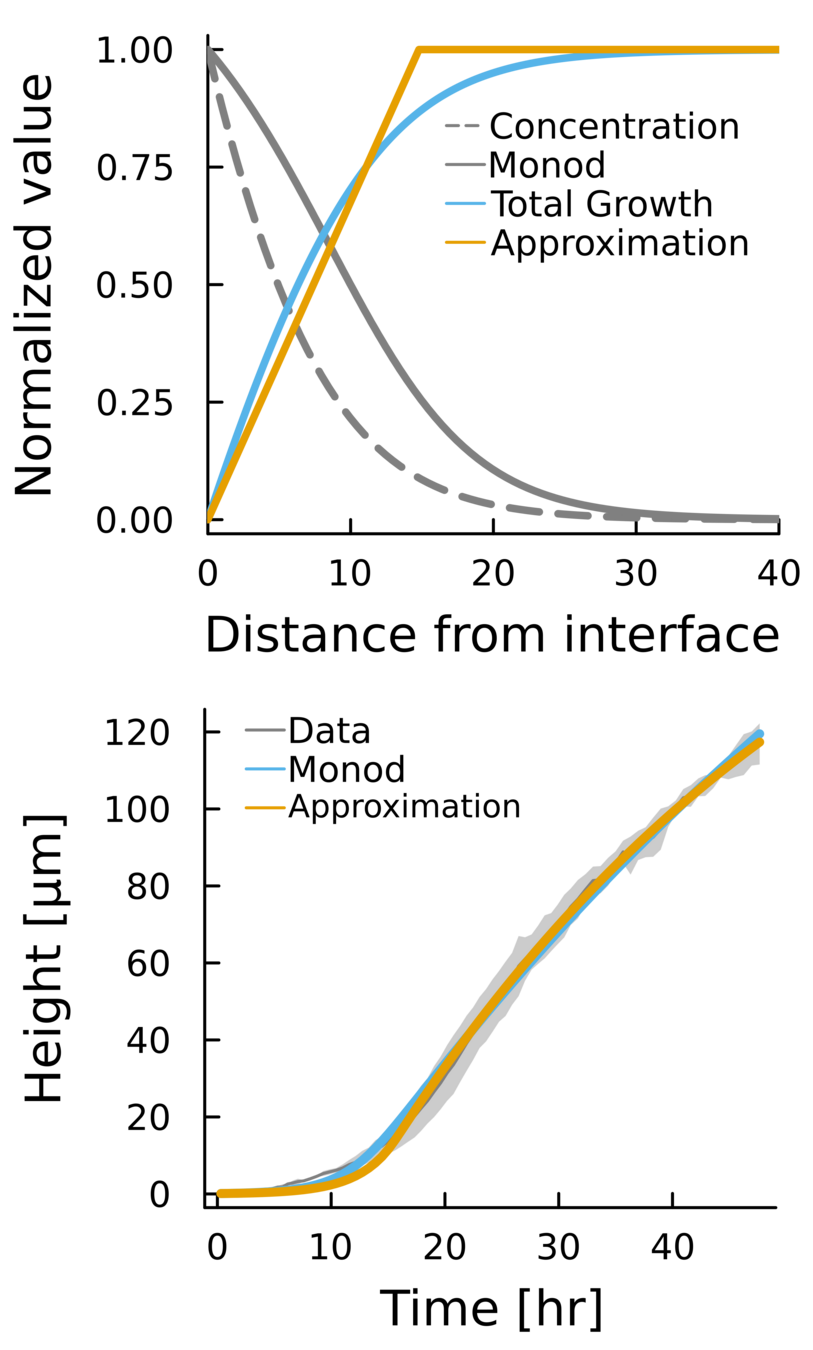
Empirical data + biophysical insight:
Diffusion length
Growth rate
Decay rate
Clean set
Not-so clean set
Clean set
Not so clean set
\(\alpha h \)
\(- \beta h \)
\( -\alpha \frac{h^2}{K_h} \)
\(- \beta h \)
\(\alpha h\)
\(\alpha G(h, h^*) \)
\(^{****}\)
Growth
Decay
Small overestimation of \(\beta\) can lead to underestimating \(h_{\text{max}}\)
Measuring for 48h is going to dry the plate a bit more, even if we try to minimize it
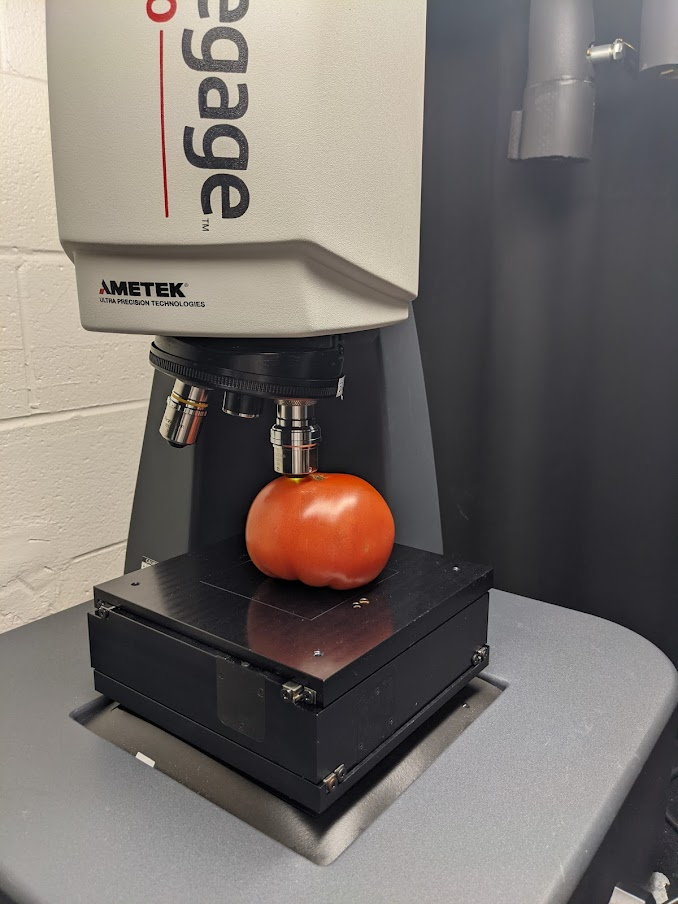
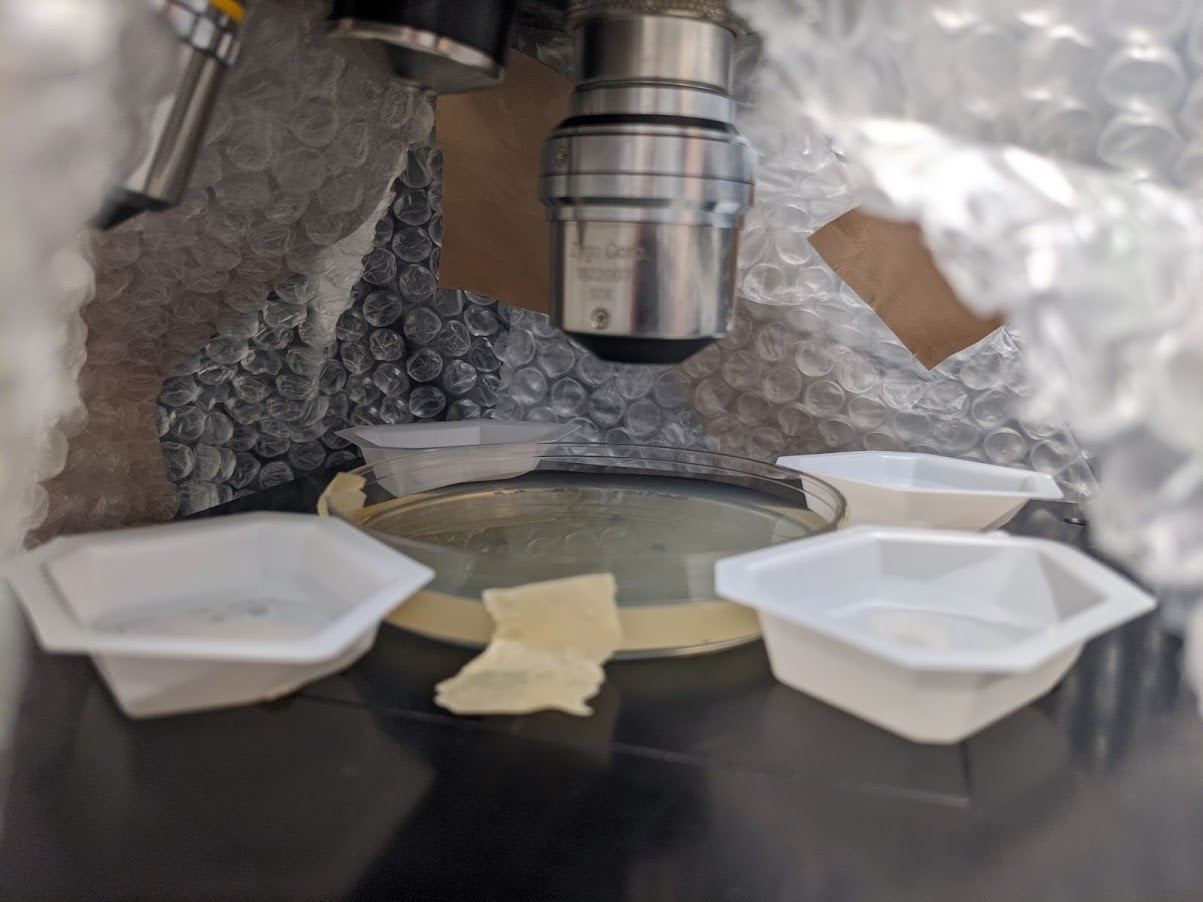
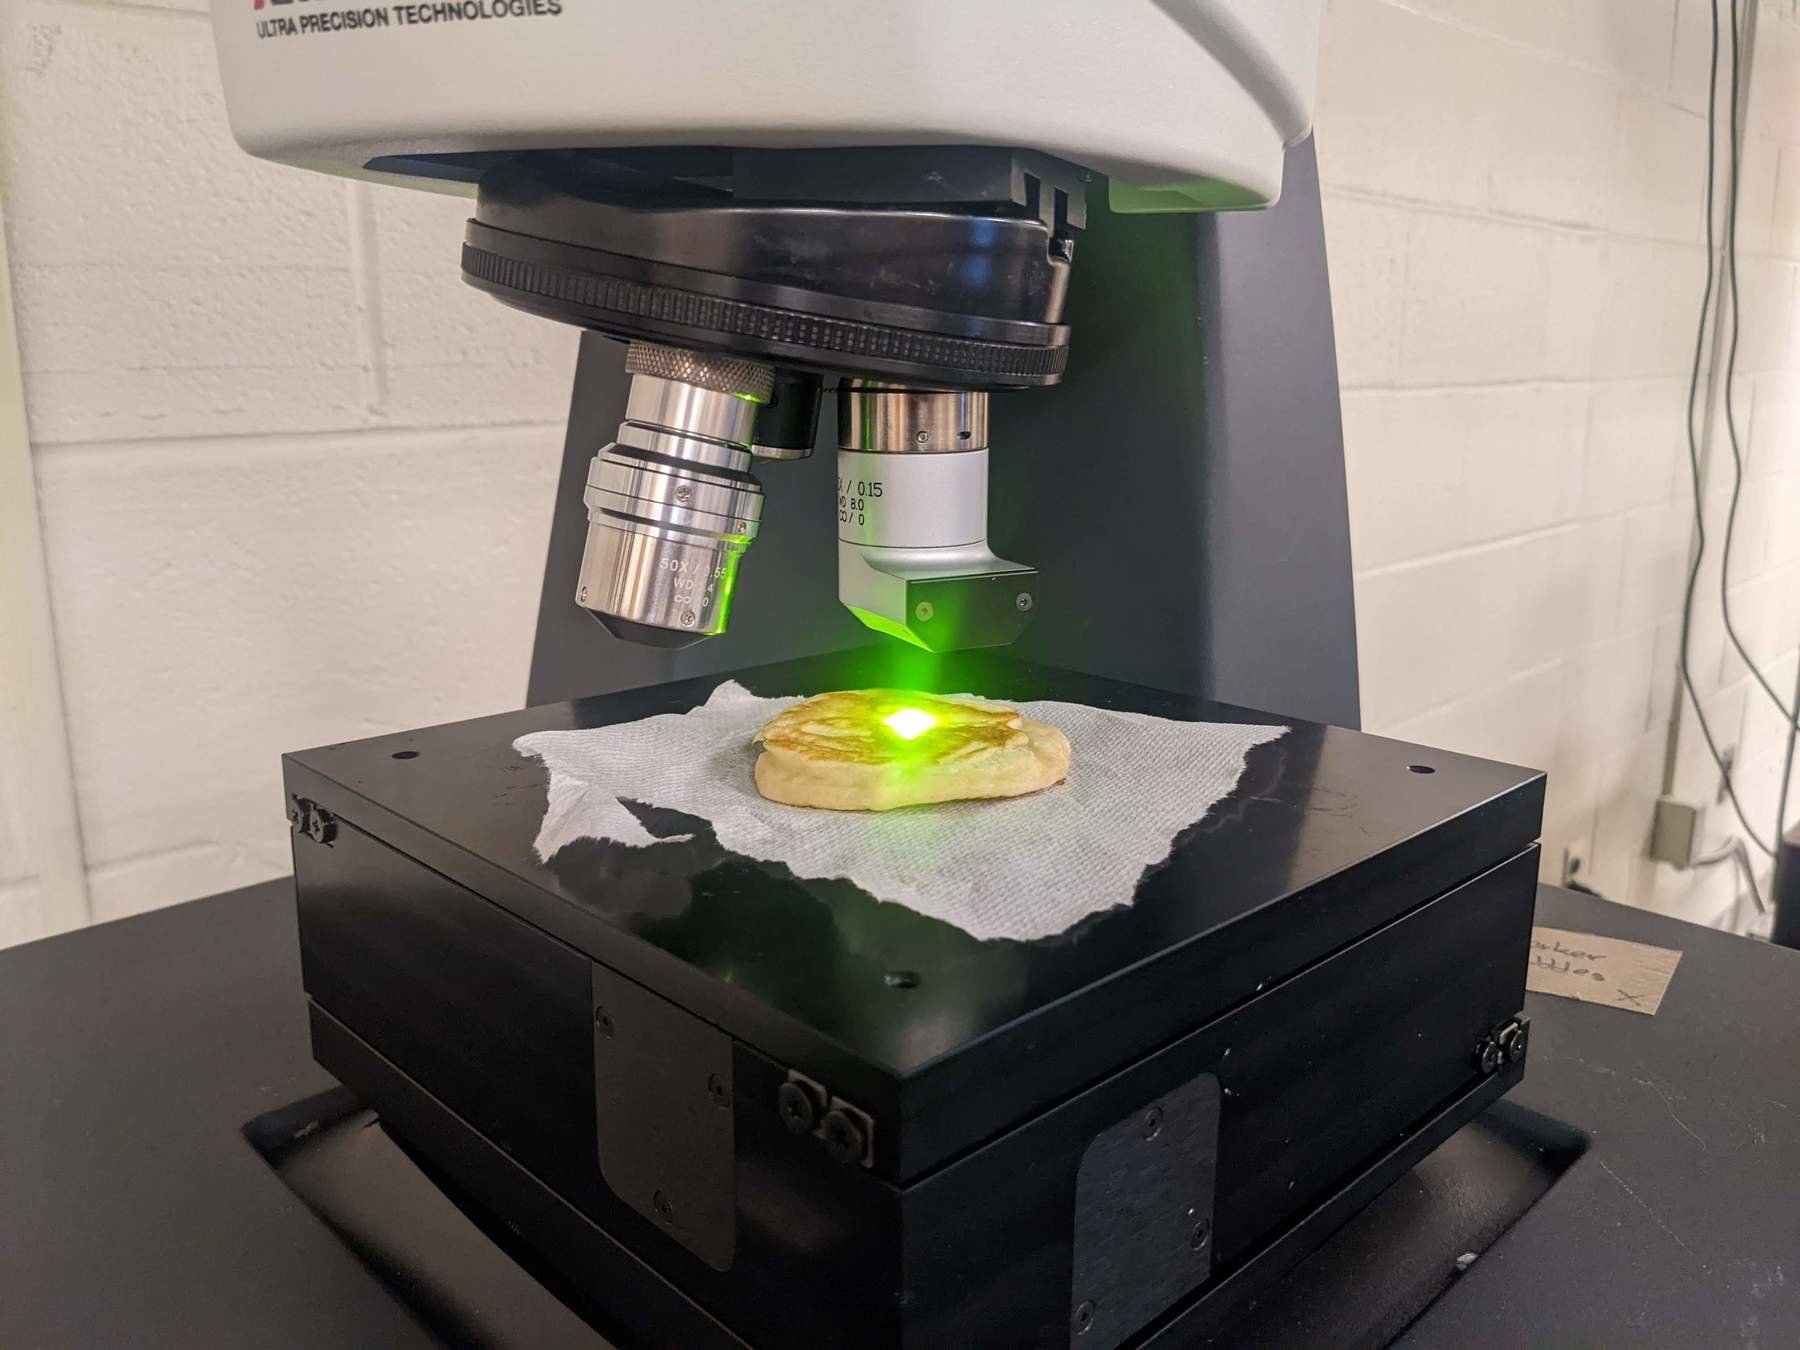
High-tech containment chamber for timelapse measurements.
Even if the prediction gets corrected with time, residual changes very little!
\(800 \mu m^2 \cdot s^{-1}\)
\(38 \mu M\)
\(1.3\cdot10^3 \mu M \cdot s ^{-1}\)
E. coli growing in agar -> limited by L-serine
Using literature parameters we obtain
\(L = 14.8 \mu m\)
And using the interface model
\(L = 14.3 \pm 1 \mu m\)
2560
\(800 \mu m^2 \cdot s^{-1}\)
\(38 \mu M\)
\(1.3\cdot10^3 \mu M \cdot s ^{-1}\)
E. coli growing in agar -> limited by L-serine
Using literature parameters we obtain
\(L = 14.8 \mu m\)
And using the interface model
\(L = 14.3 \pm 1 \mu m\)
1920
Get the best fit for each sampled dataset (1000x)
Original dataset
\(h_{\text{max}}\) \( [\mu m]\)
Bootstrapping on the 48h data we get distributions
\(\alpha\) \( [\mu m /hr]\)
\(\beta\) \( [\mu m /hr]\)
\(L\) \( [\mu m]\)
Aeromonas
Yeast (aa)
E. coli
48h fit
All fit
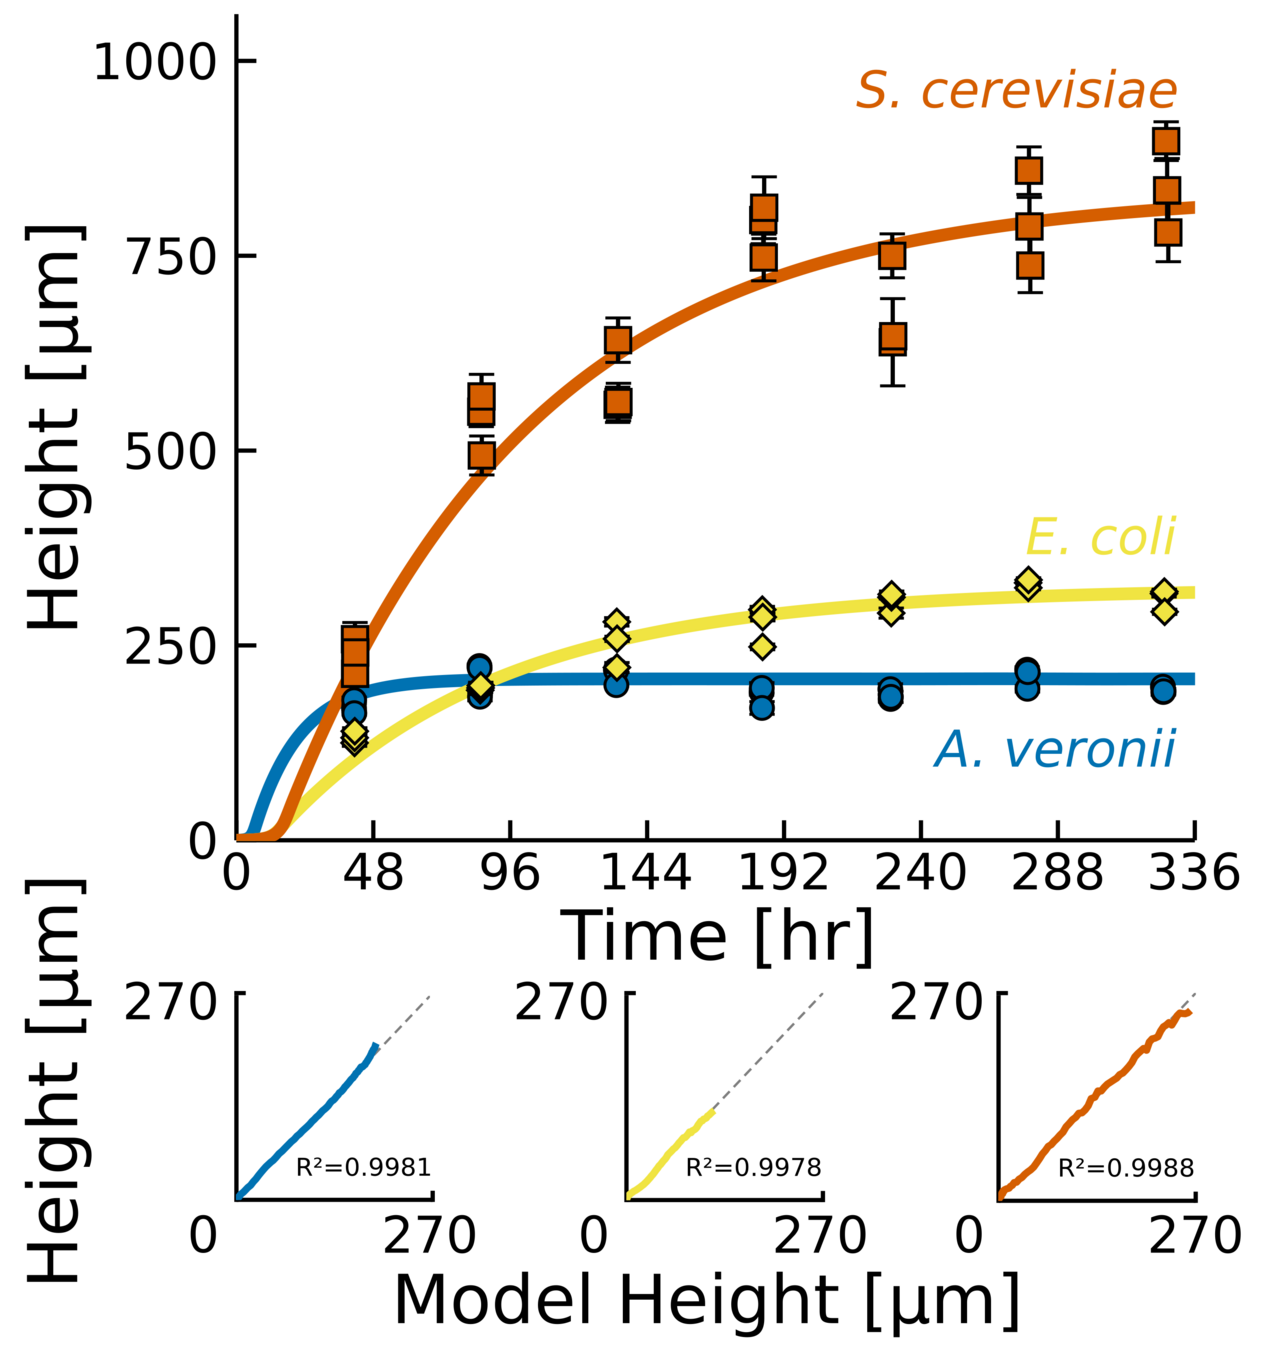
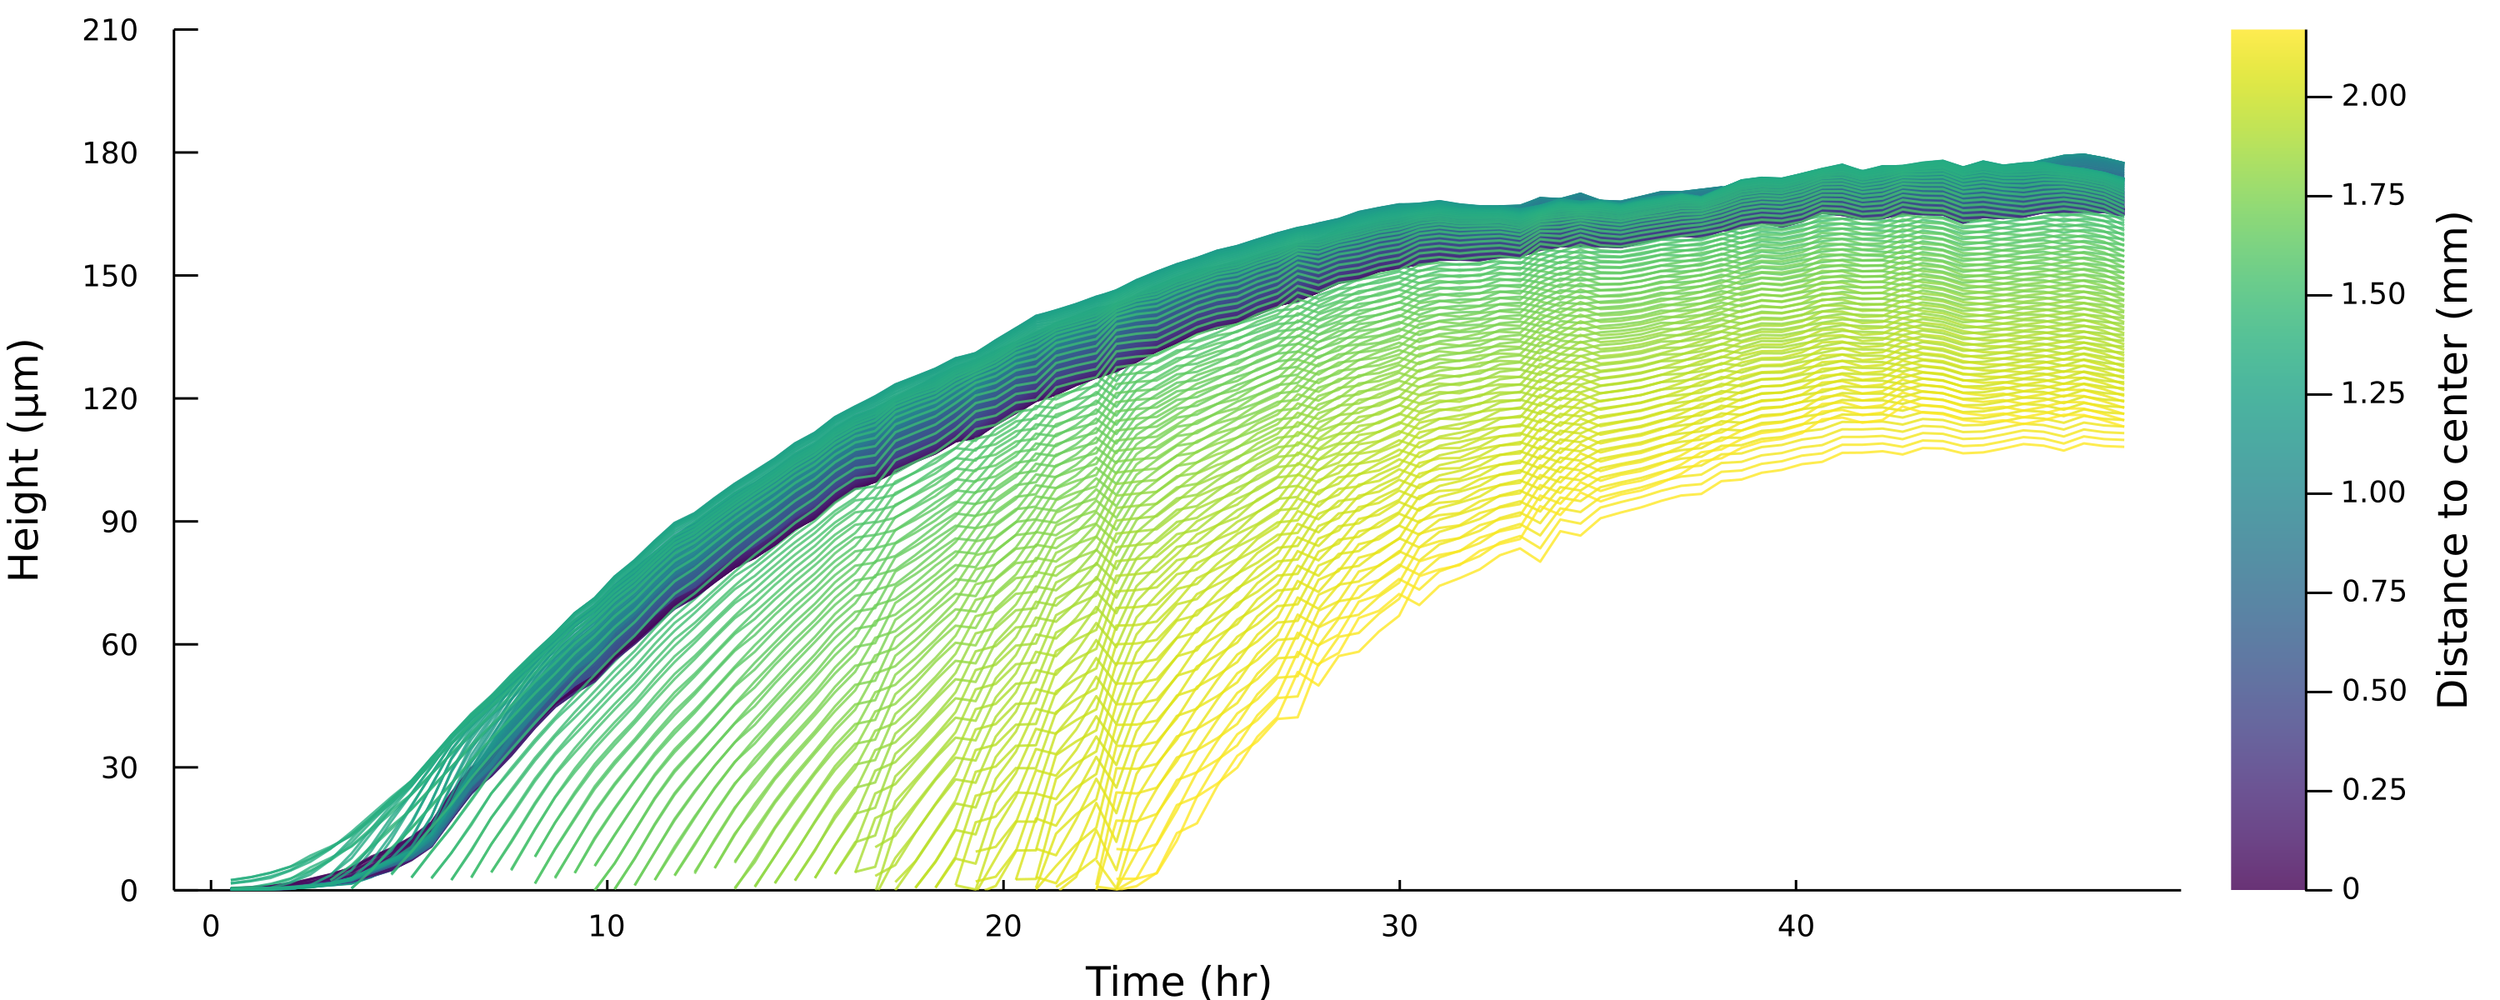
Model height prediction:
\(h_{\text{max}} = \frac{\alpha L}{\beta}\)
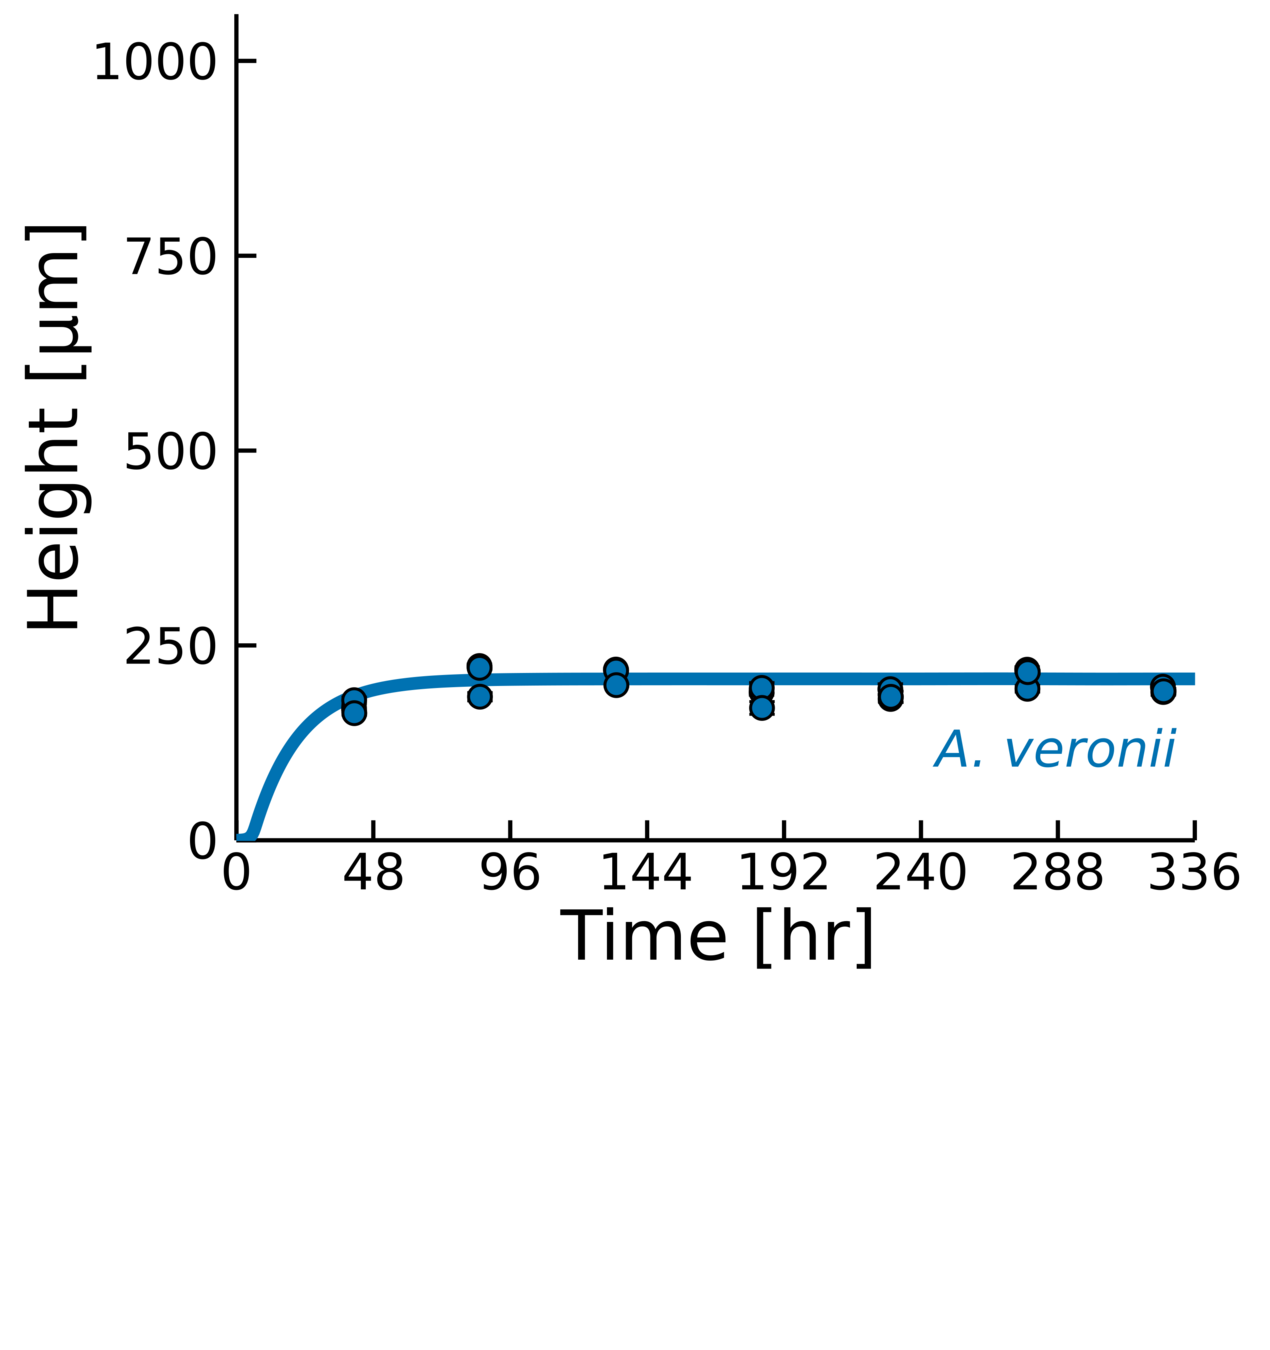
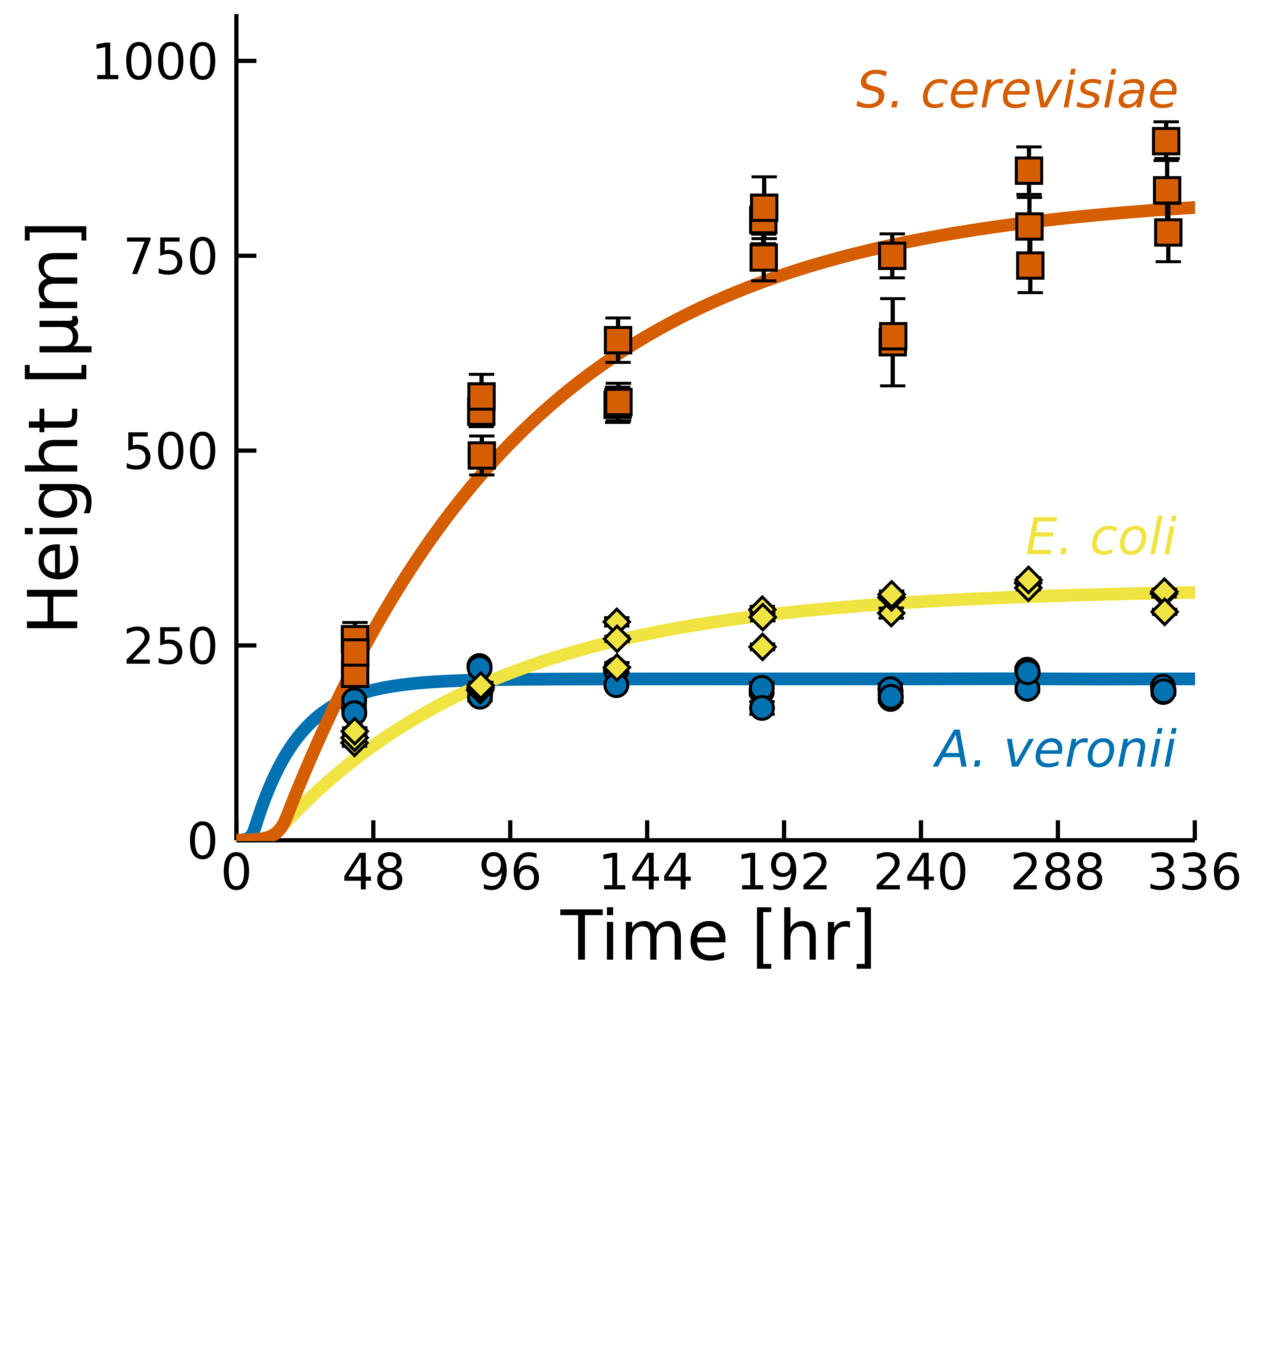
Same behavior, different parameters
Good agreement even early!
Fit parameters \(\alpha, \beta, h^*\) to each trajectory
\( h_{\text{max}} = \frac{\alpha h^*}{\beta} \)
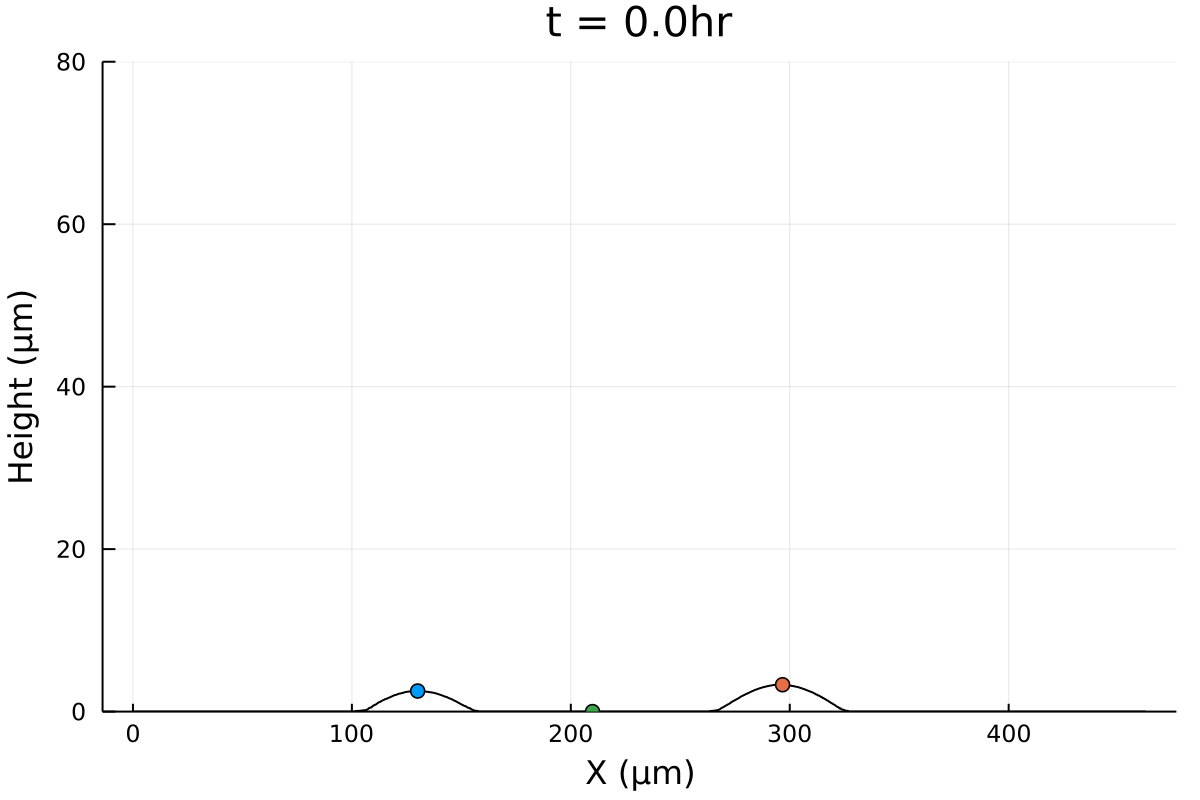
Initial configuration is experimental (Gabi), except tweaking 0's and negative numbers.
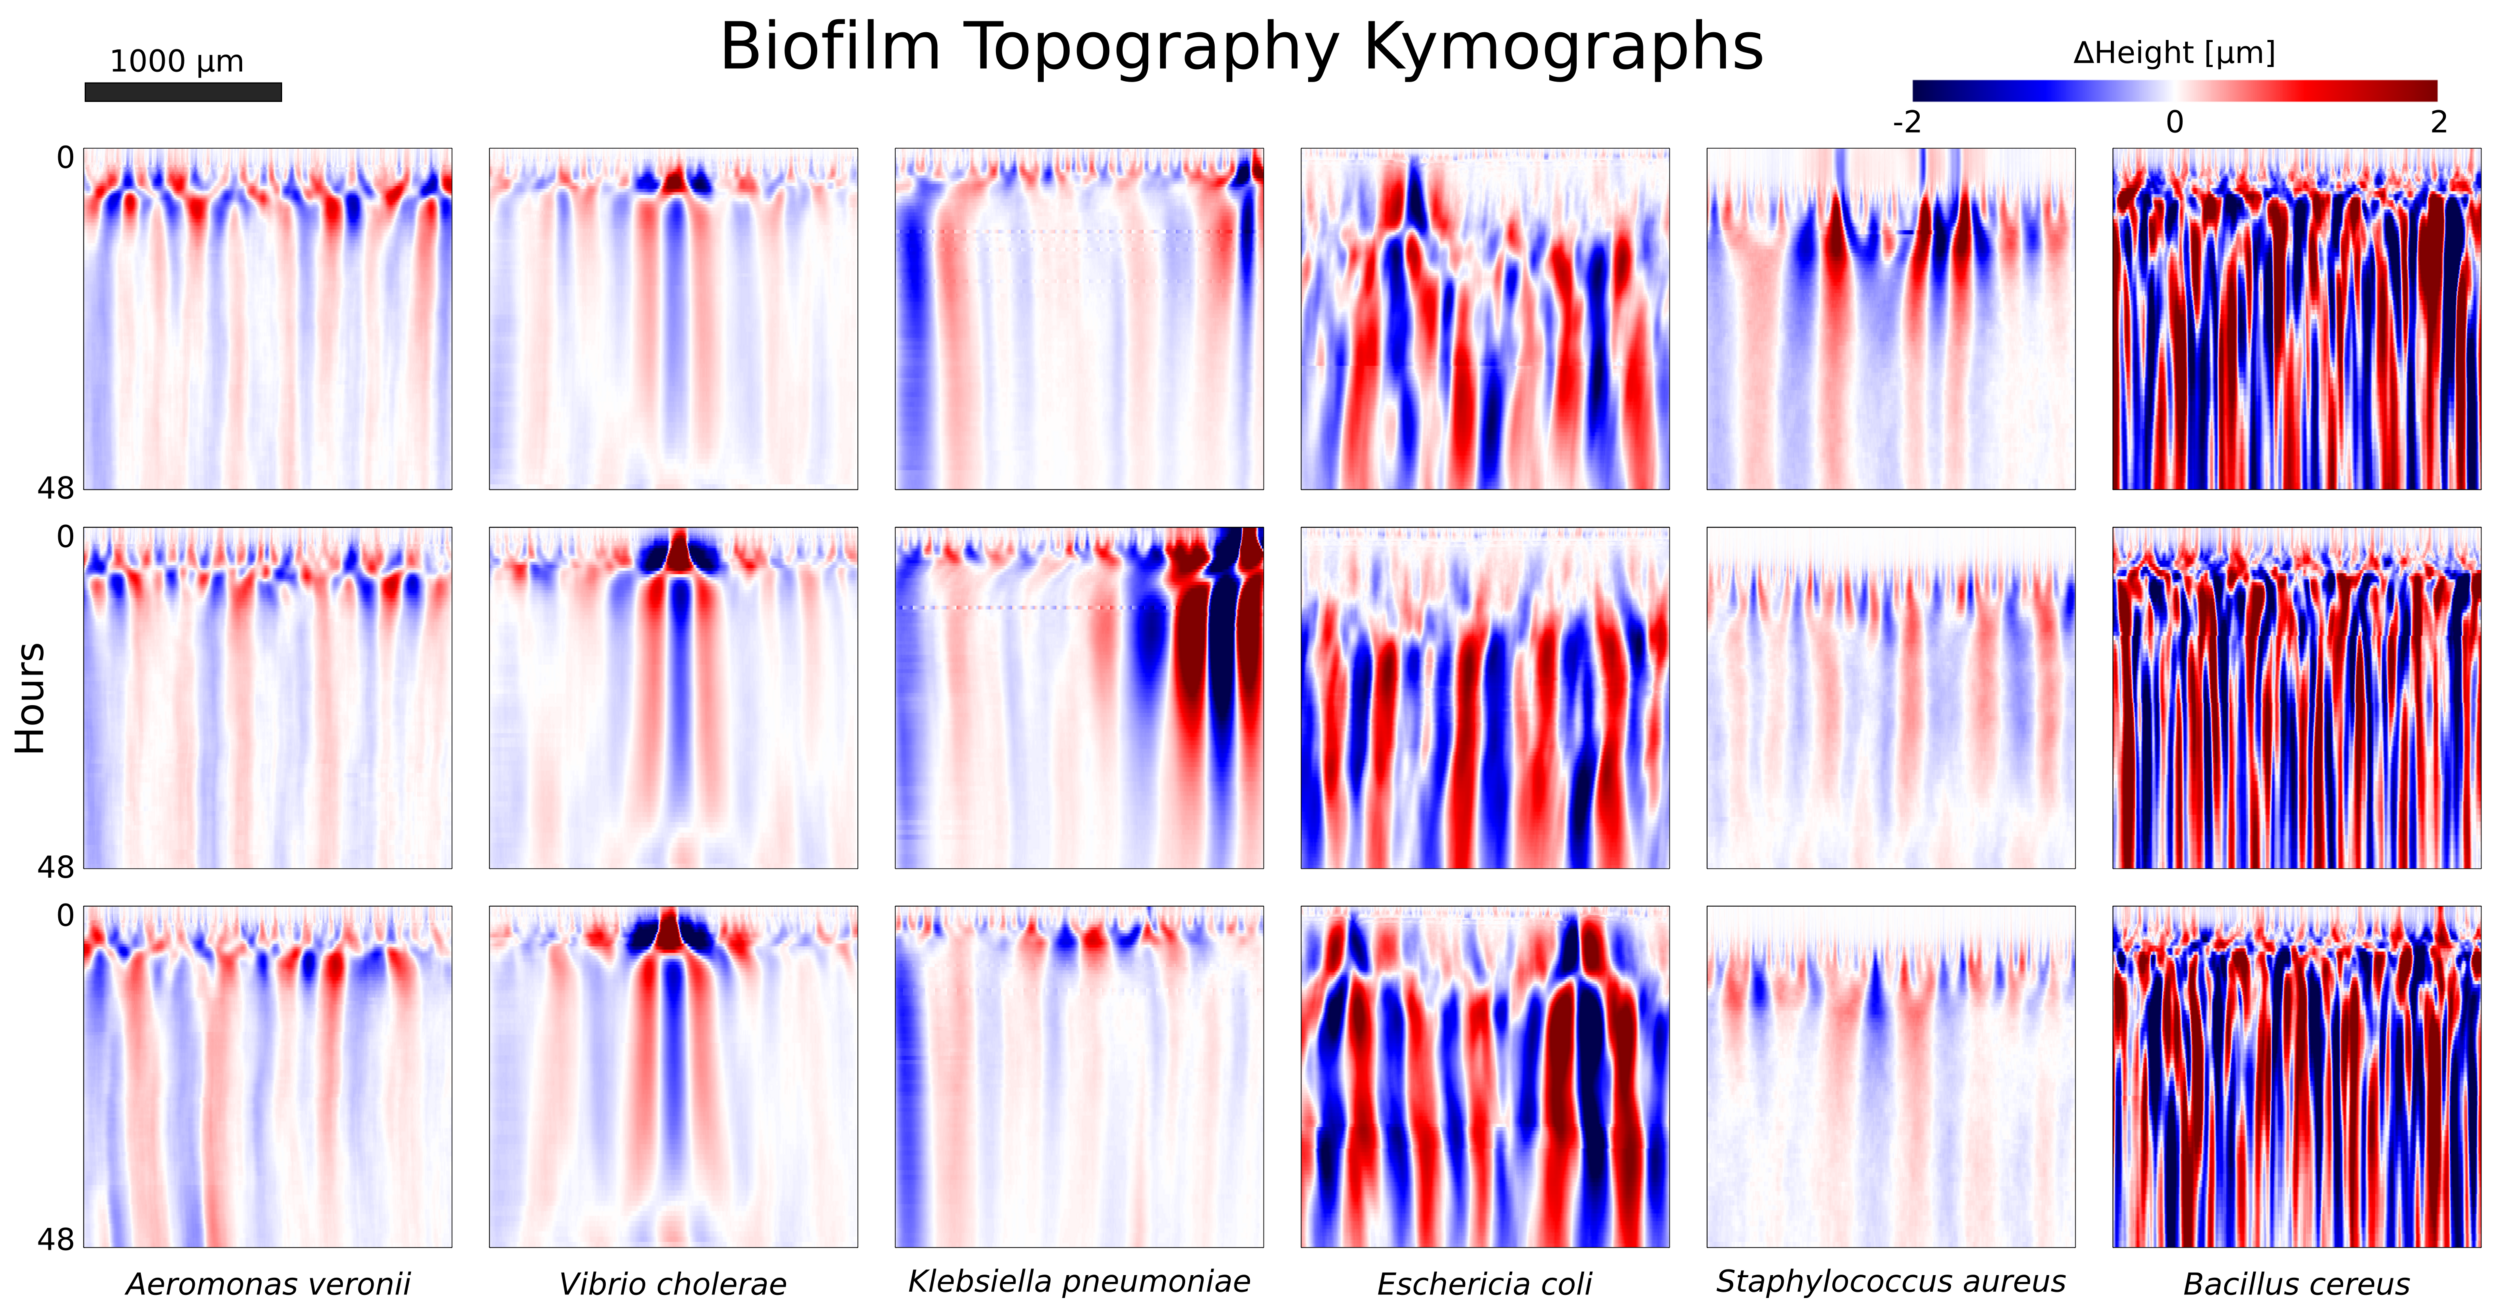
Experiments across a large cohort of microbes
Modeling in 3D Yeast clusters
Shape of biofilms, and biofilm edge
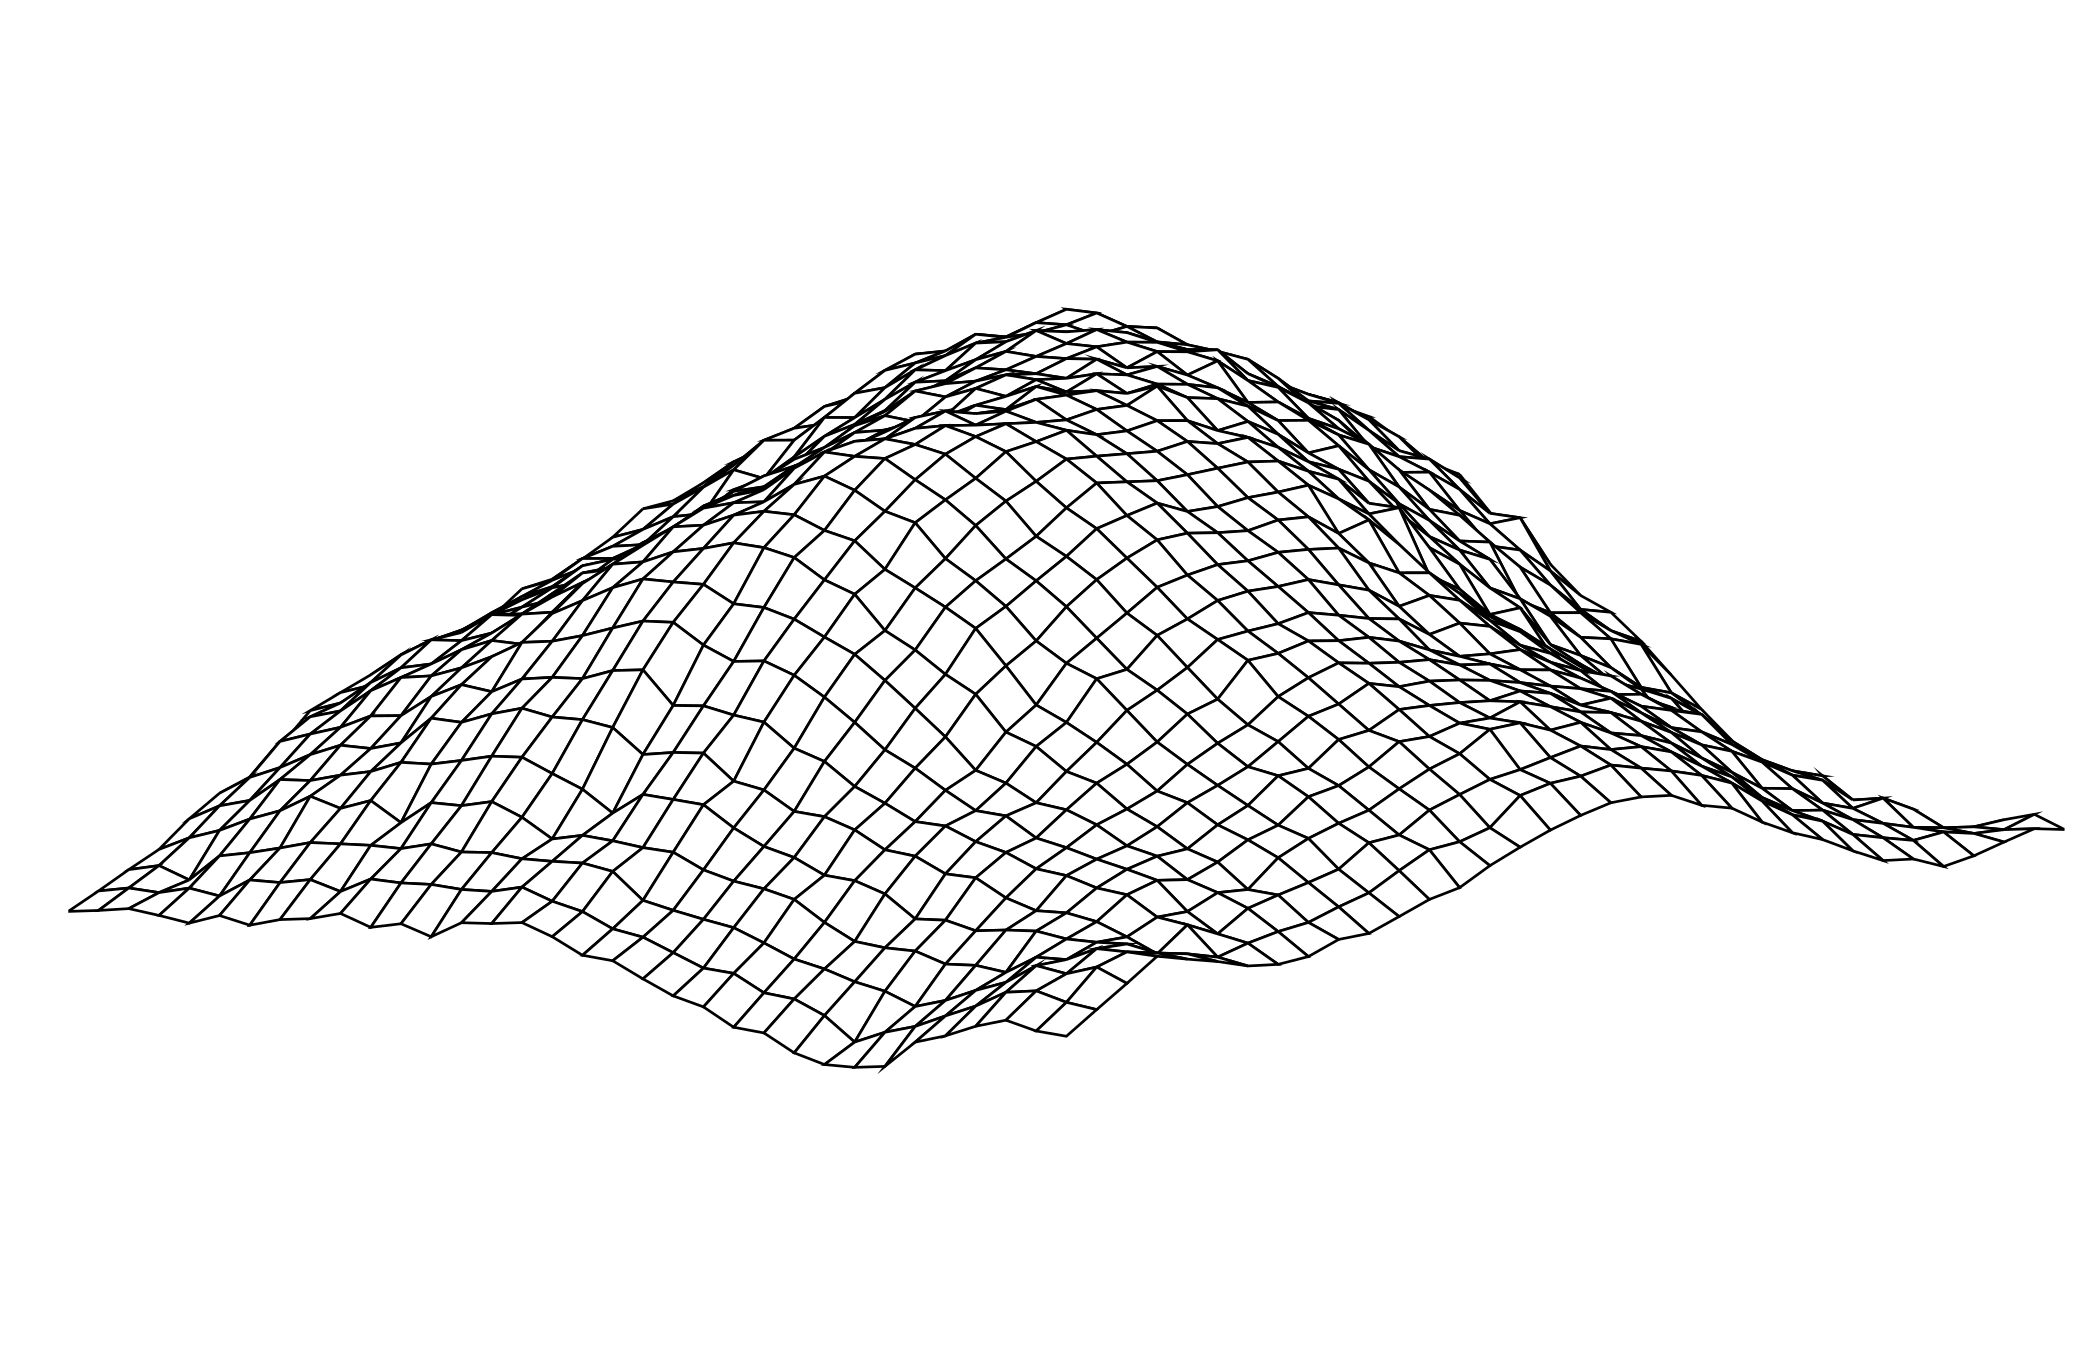
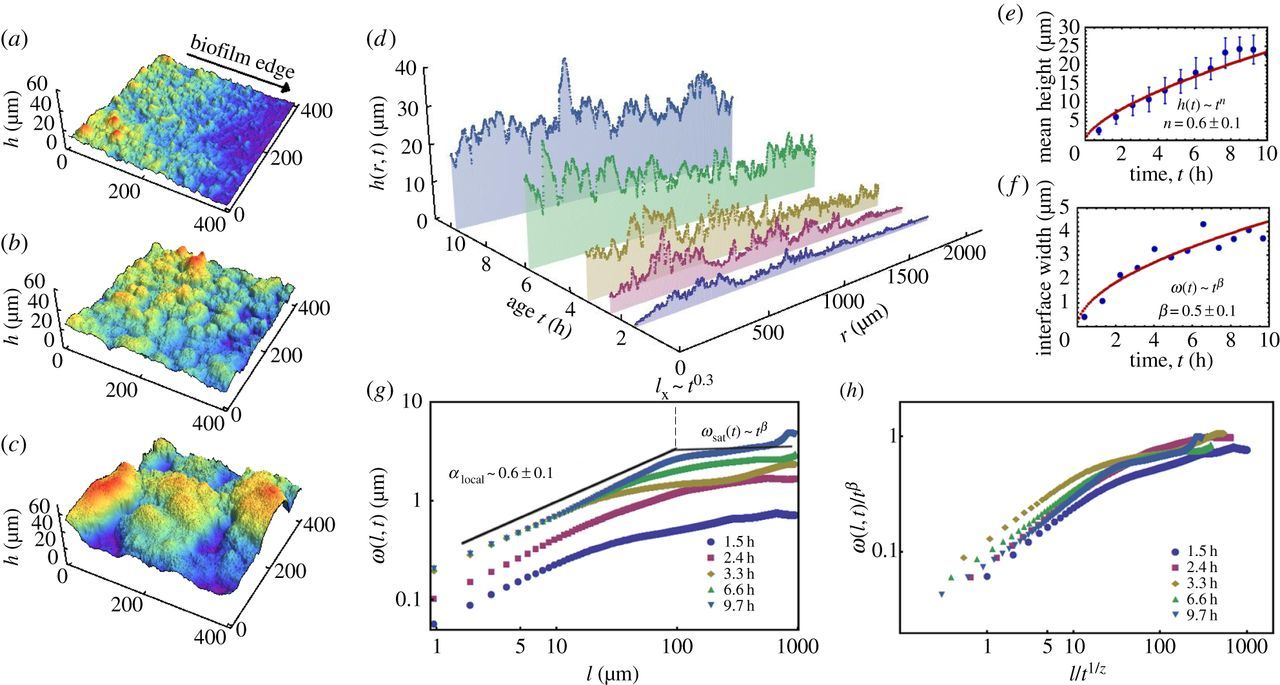
Biofilm Topography
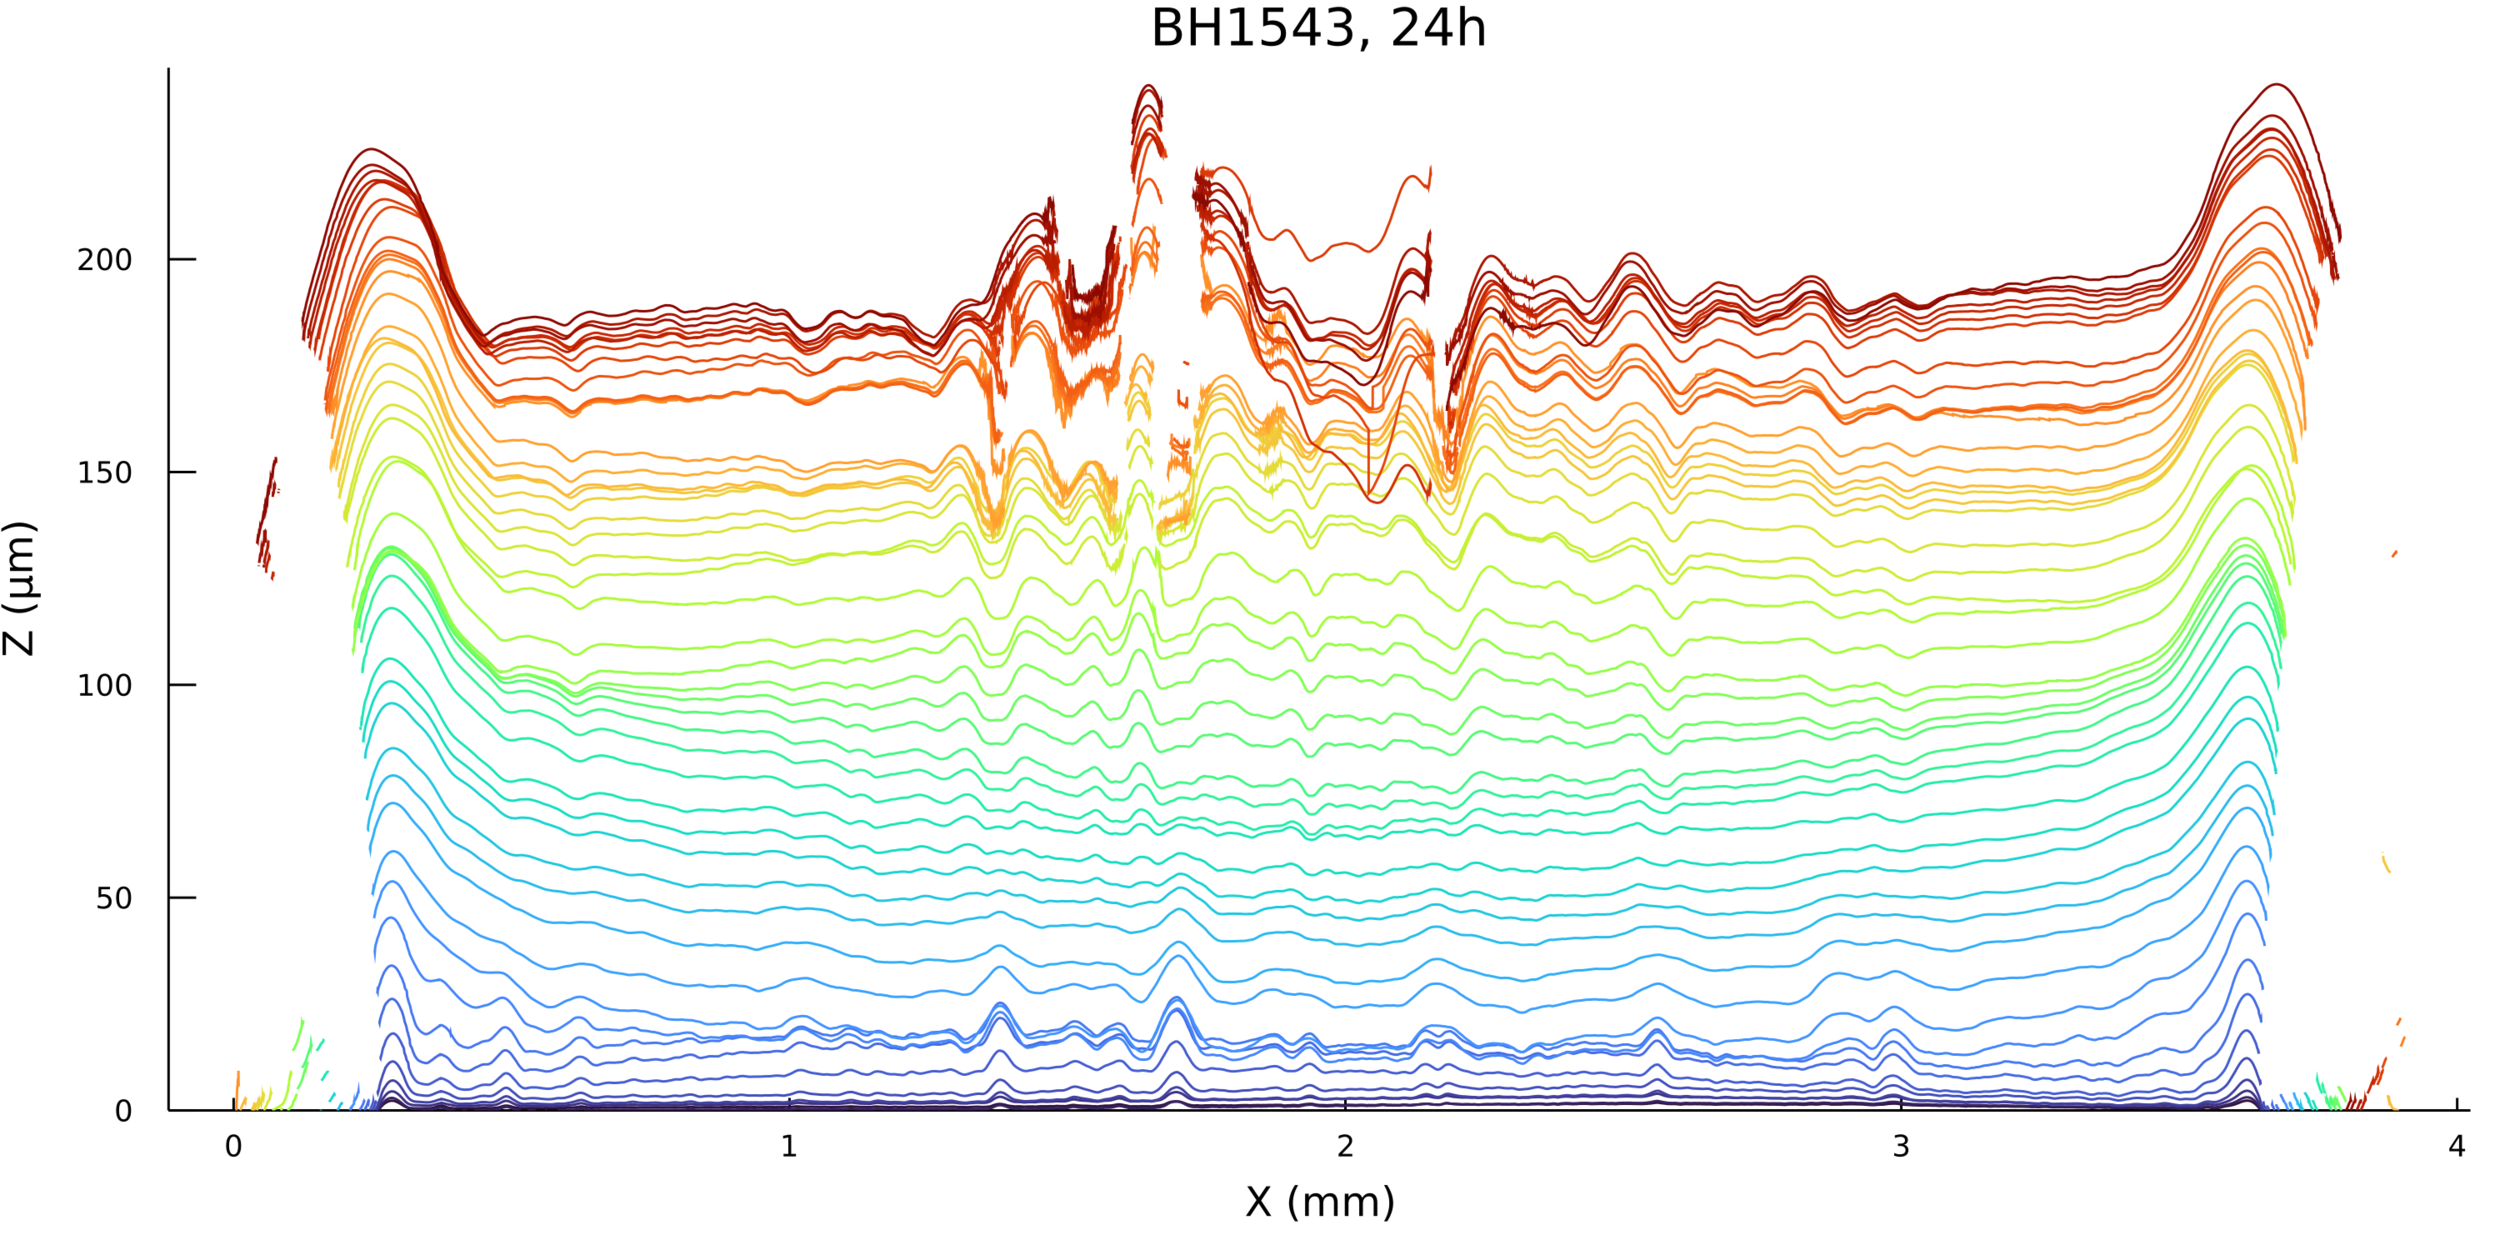
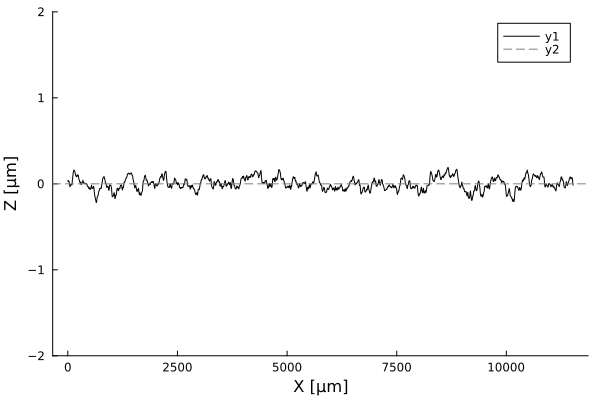
Profiles are flat. A few cells in amplitude, over thousands of micrometers!
\(500 \mu m\)
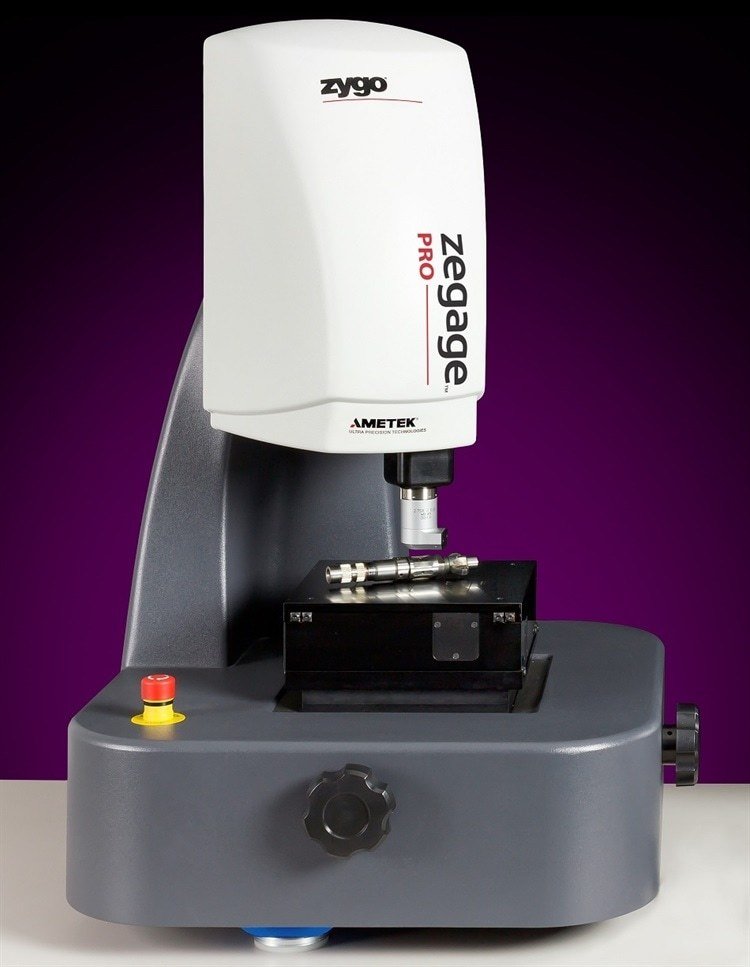
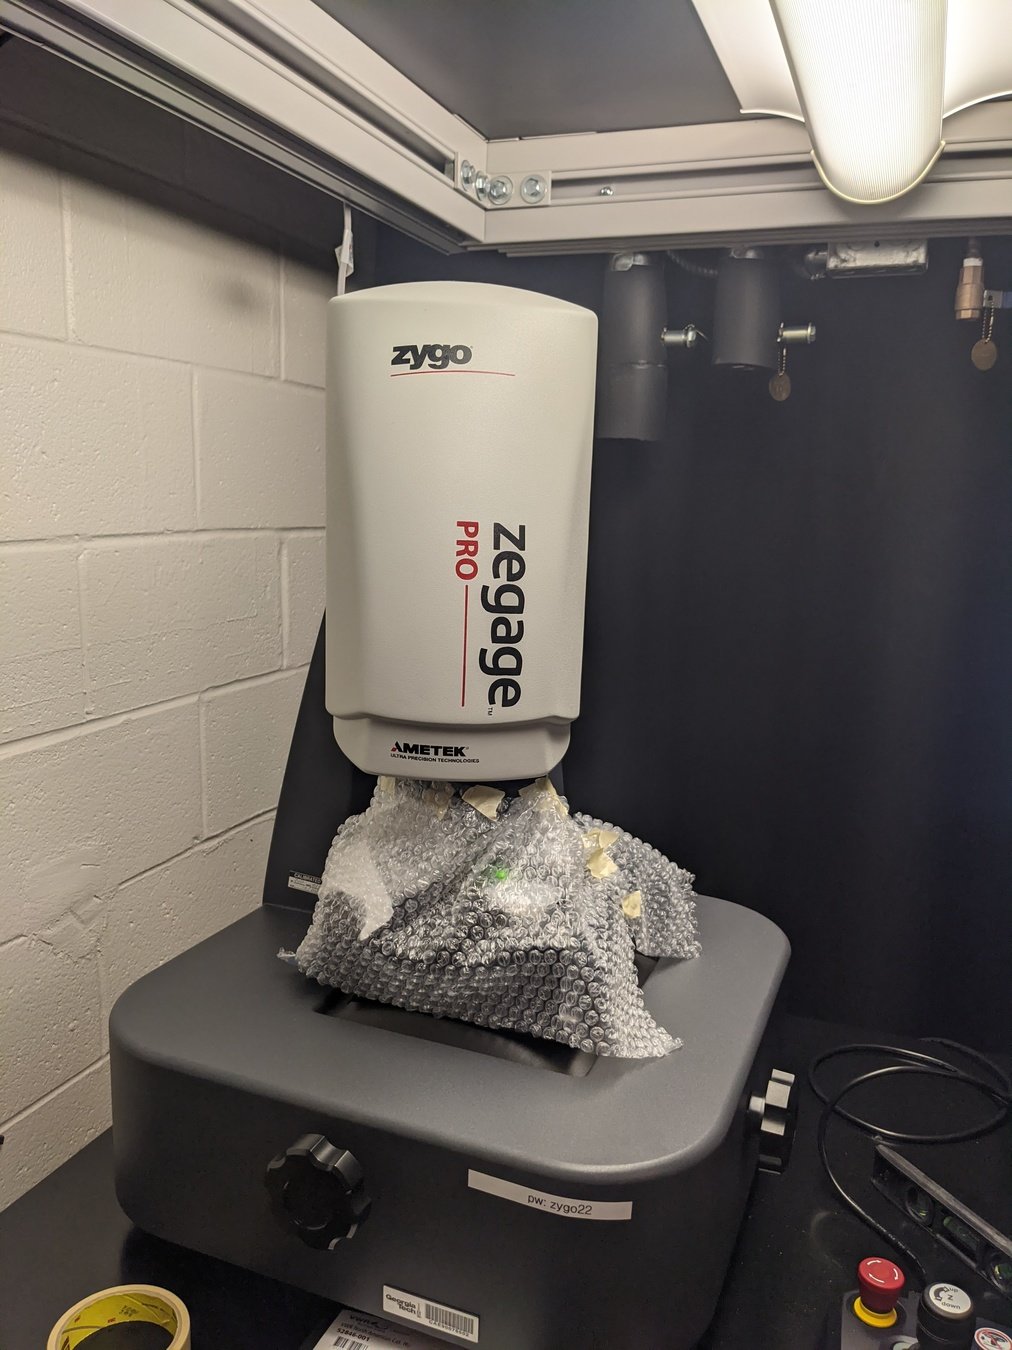
Using white-light interferometry, we can capture the profiles of a growing colonies for extended periods of time
\(\alpha\)
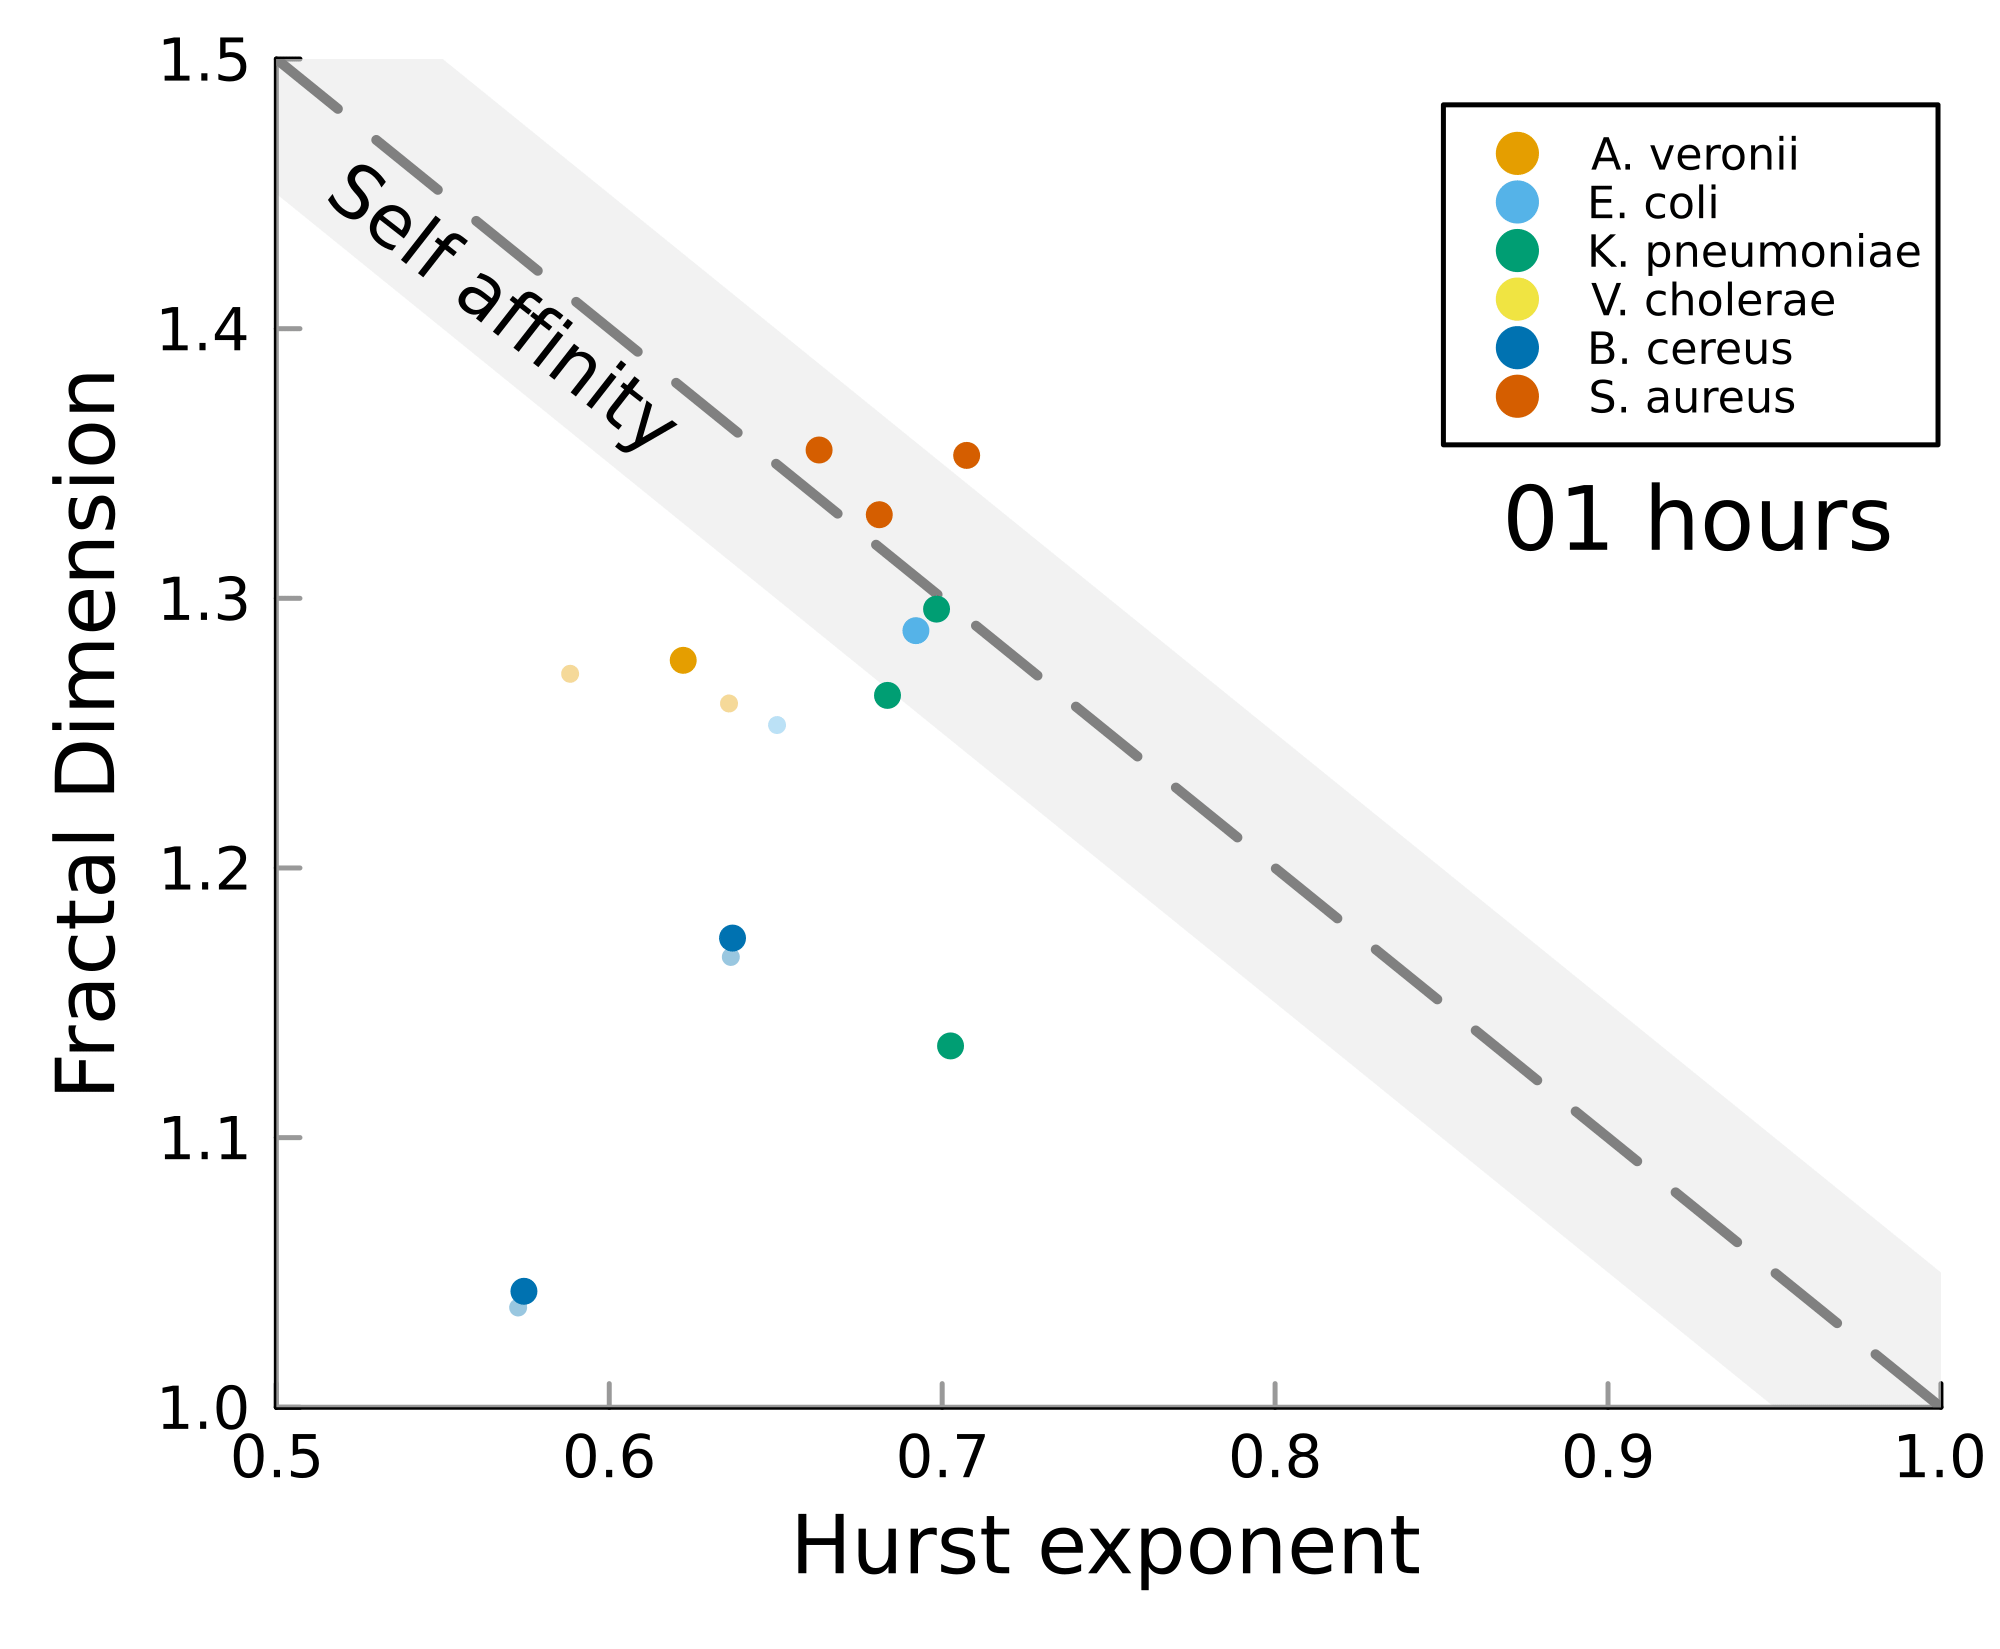
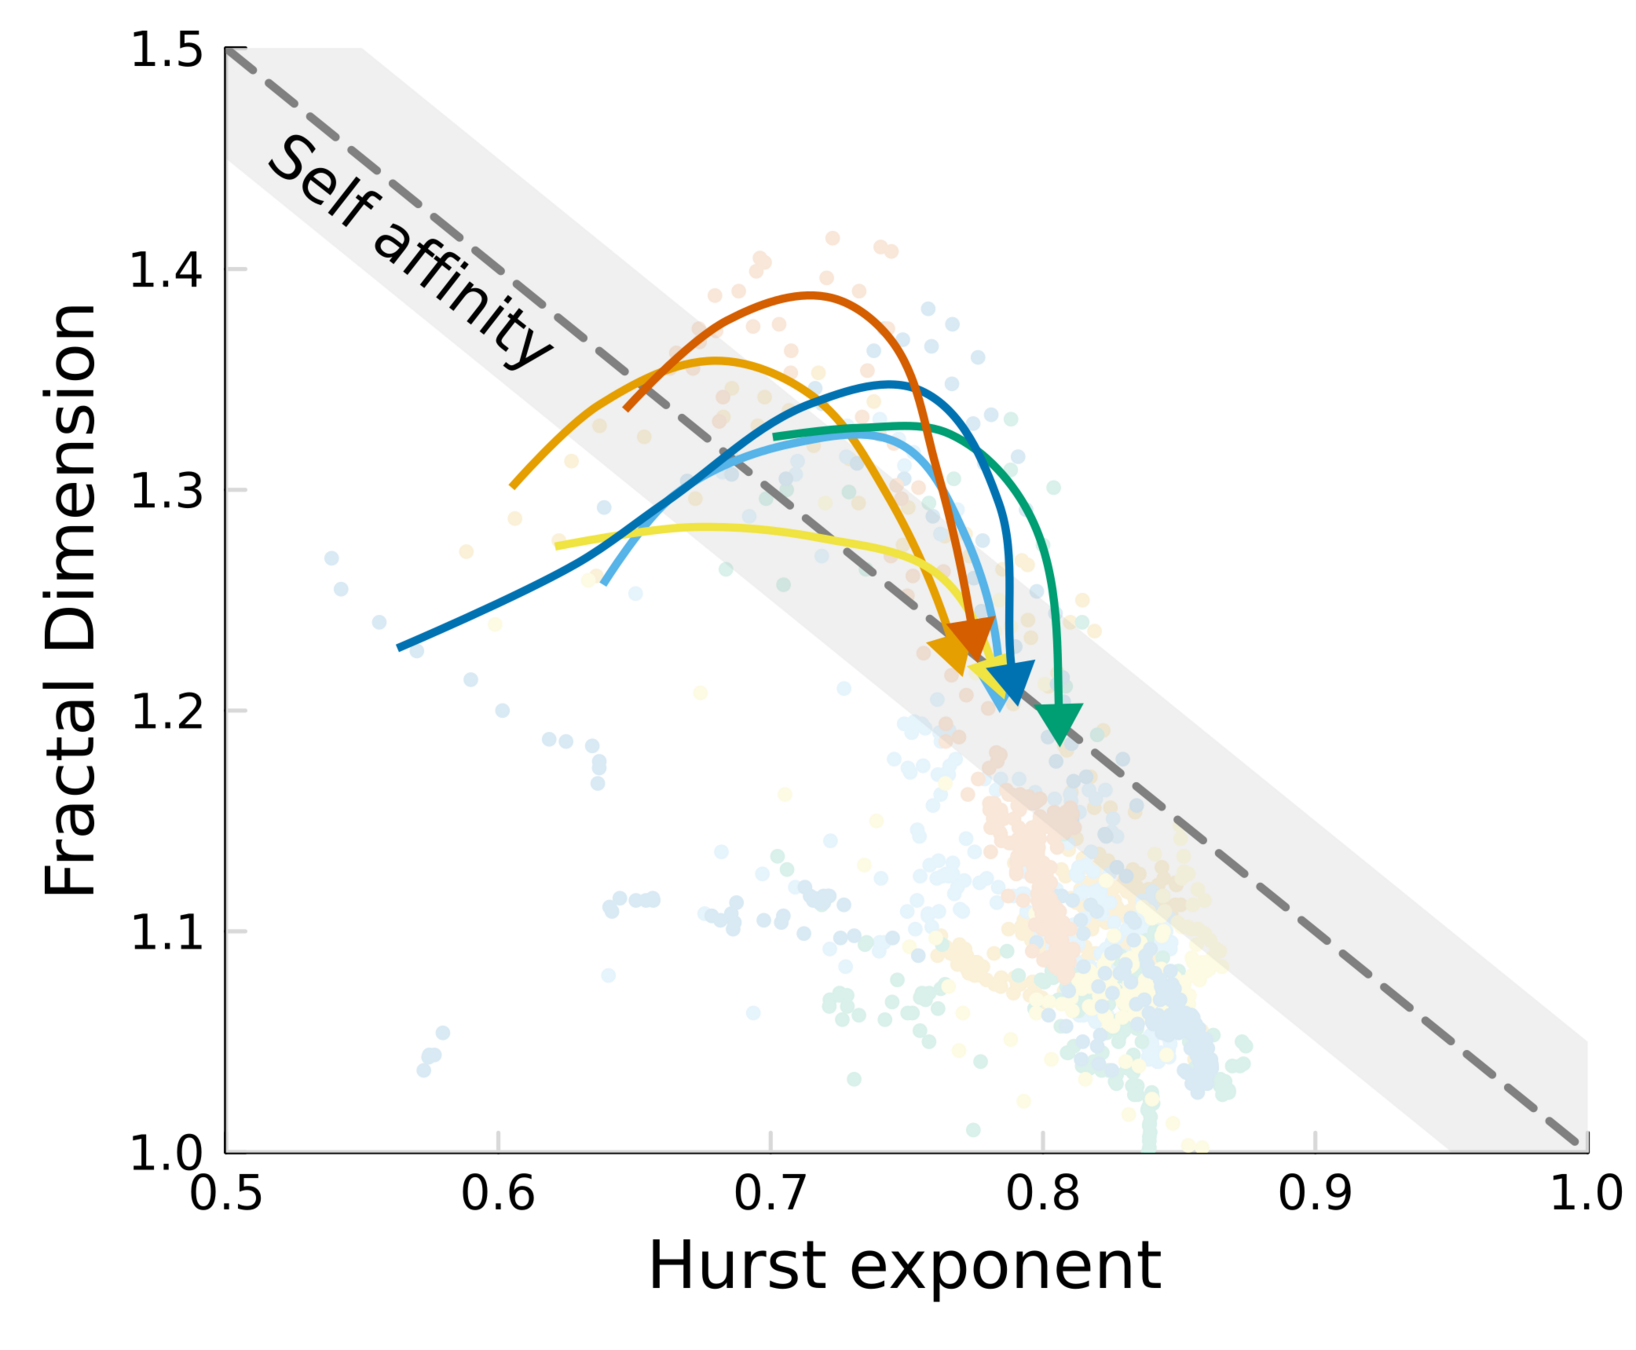
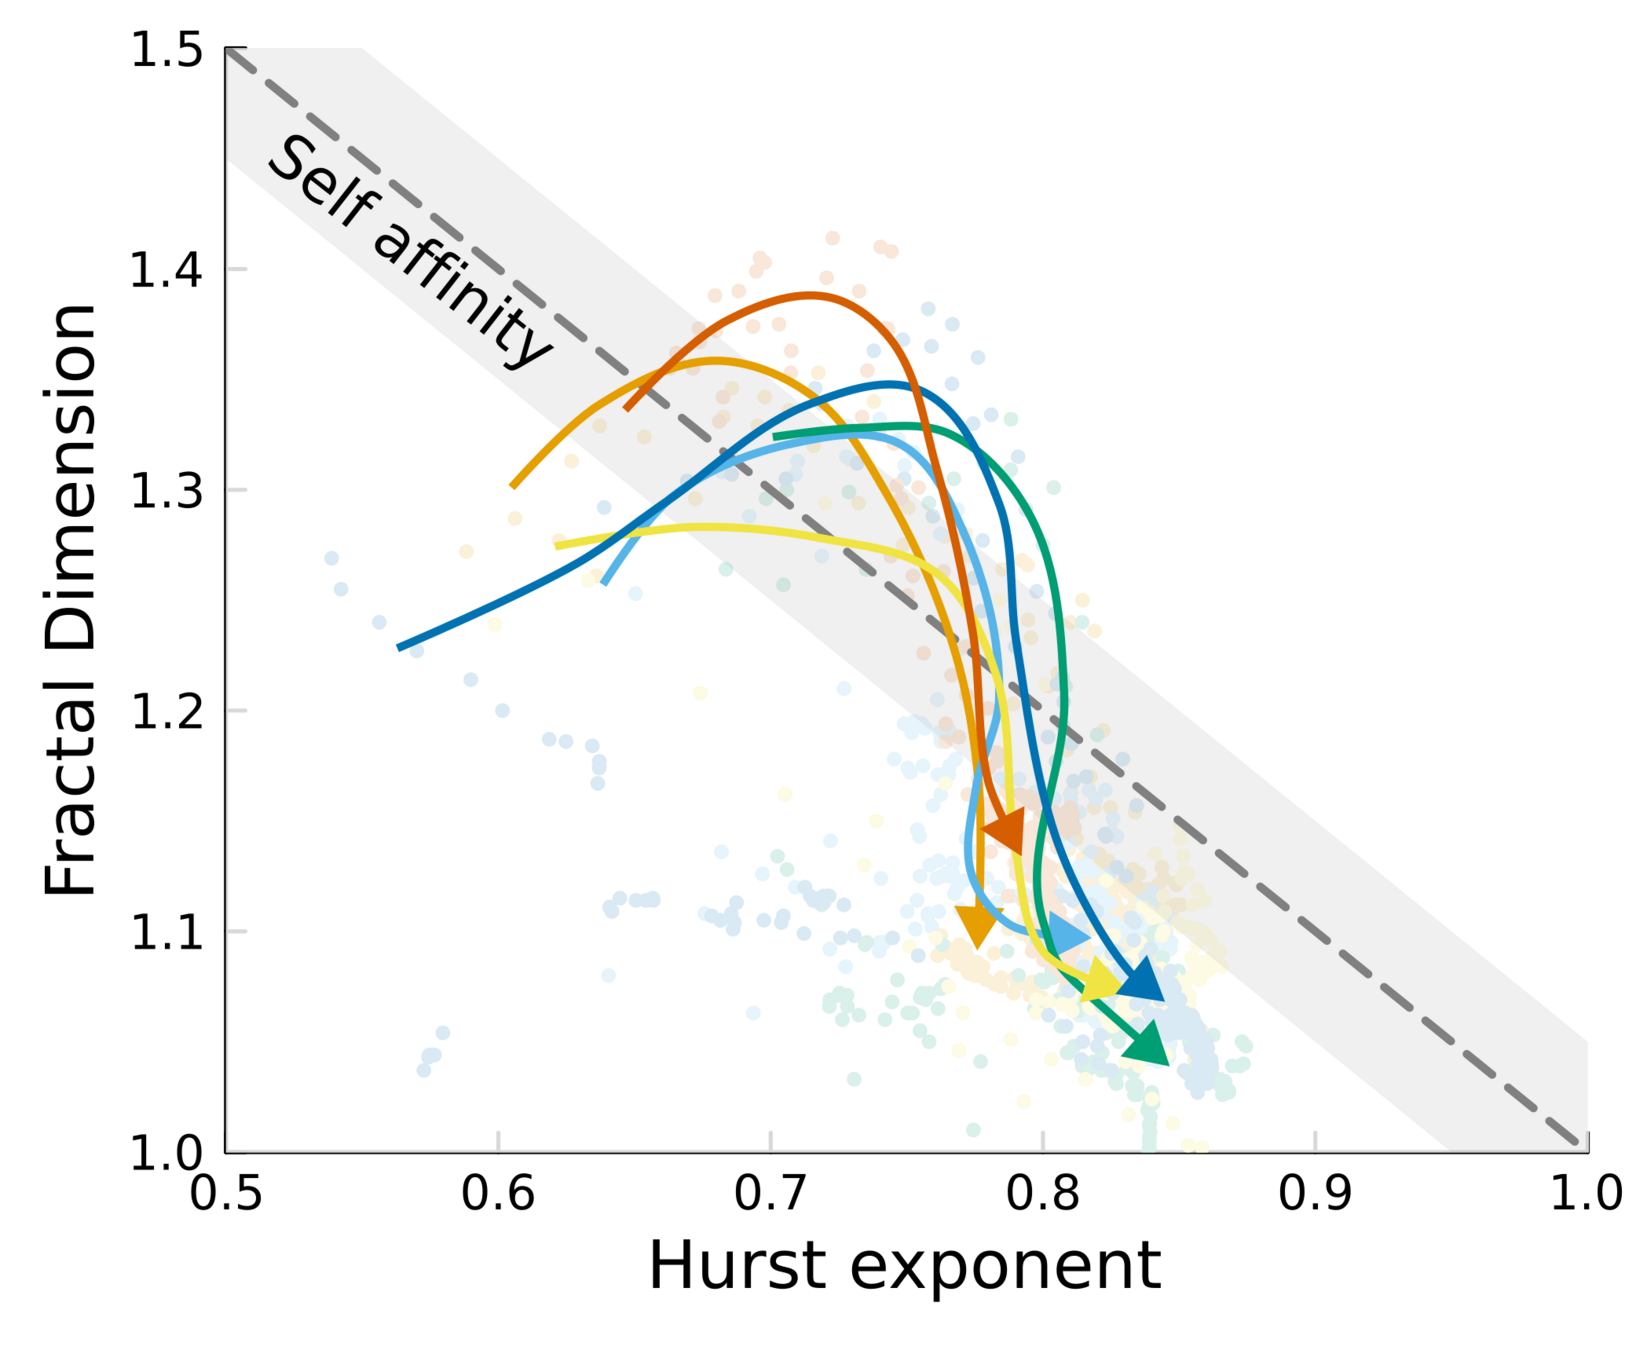
Self similar systems link the fractal dimension \(FD\) and roughness \(\alpha\) with:
Fractal Dimension FD
Measure of how complexity changes with scale
Surface roughness \(\alpha\)
Staphylococcus aureus
Bacillus cereus
Eschericia coli
\(2 mm\)
\(8 \mu m\)
Time since inoculation [hours]
\(0\)
\(24\)
\(48\)
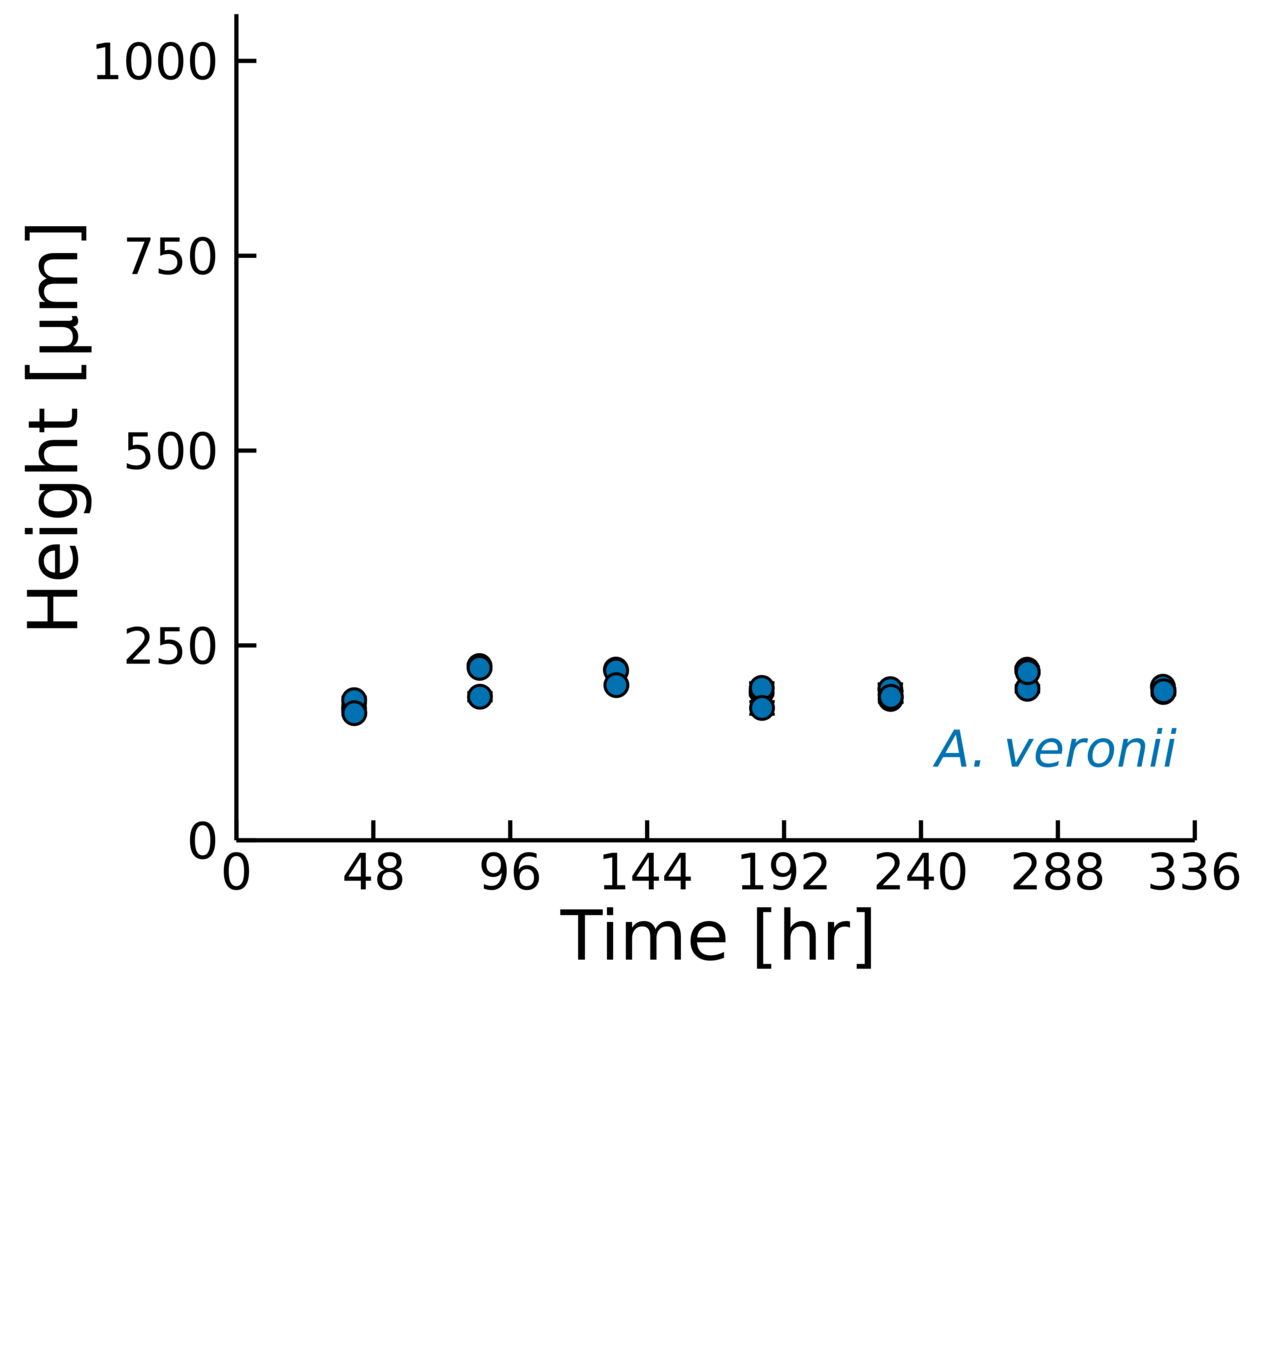
Aeromonas veronii
Eschericia coli
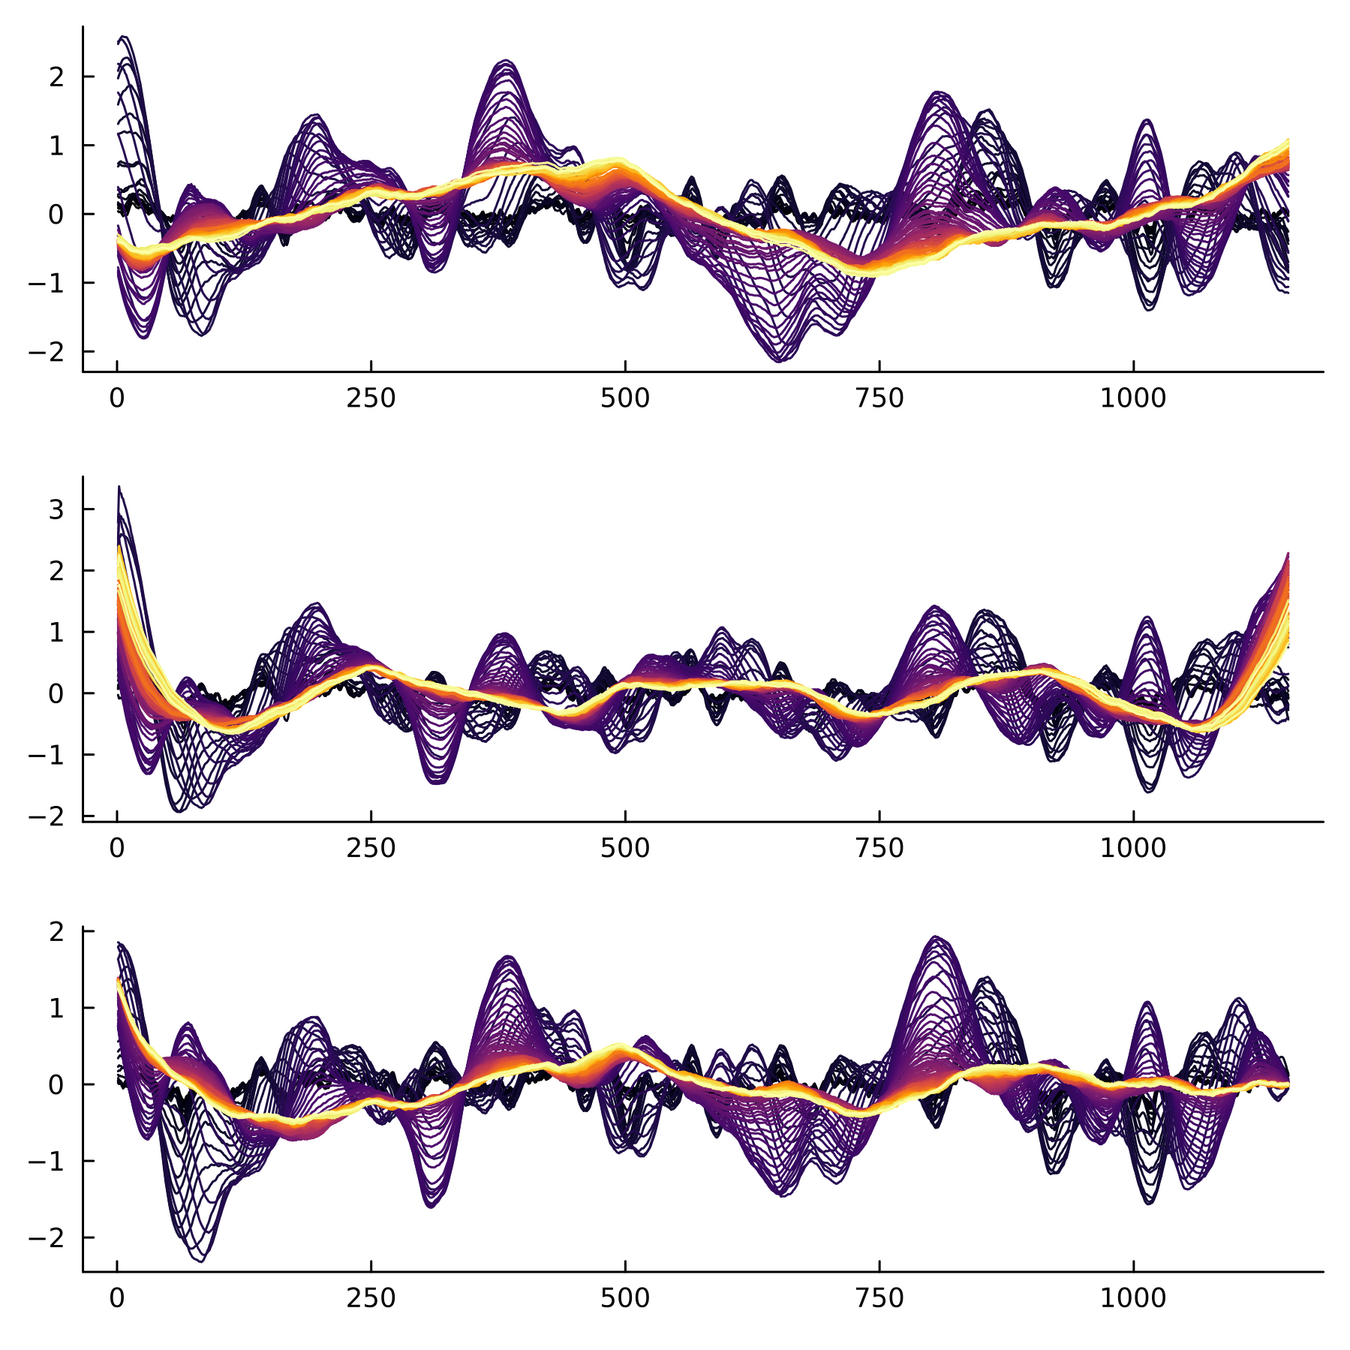
For visualization purposes, is it okay to interpolate?
Measurement time is not constant
Magnitude of fluctuations goes from 10%, to 0.1-1%!
Stainless steel (UL)
\(10^4\)
\(10^3\)
\(10^2\)
\(10^1\)
Wavelengths of \(\lambda = L/2\) were removed in each step
\(S(k, t) \sim k^{-\nu}\)
\(S(k) [\mu m^4]\)
\(k [\mu m^{-1}]\)
We can test self-affinity using the fractal dimension \(D\)
\(D + H = 2\)
\(D + H = n +1\), where \(n\) is the base dimension of the system
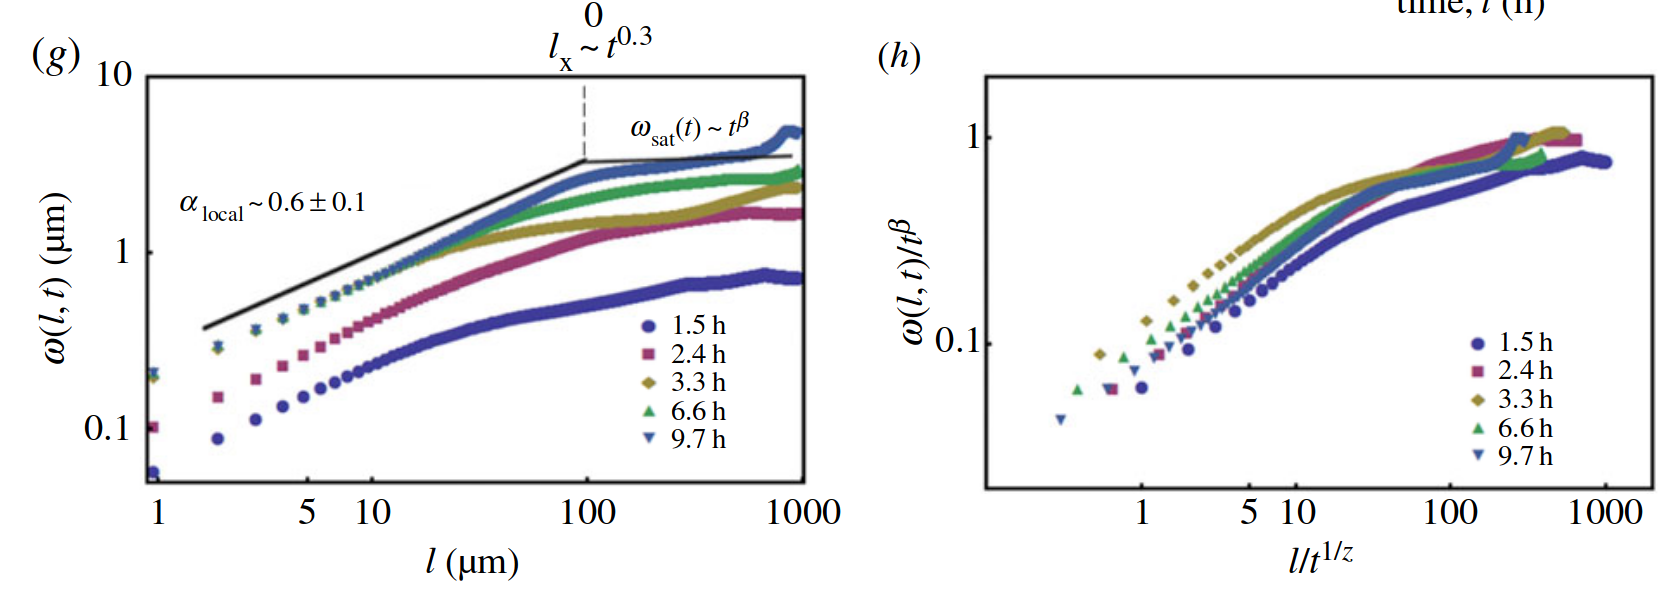
Topography dynamics as a consequence of growth through a viscoelastic material:
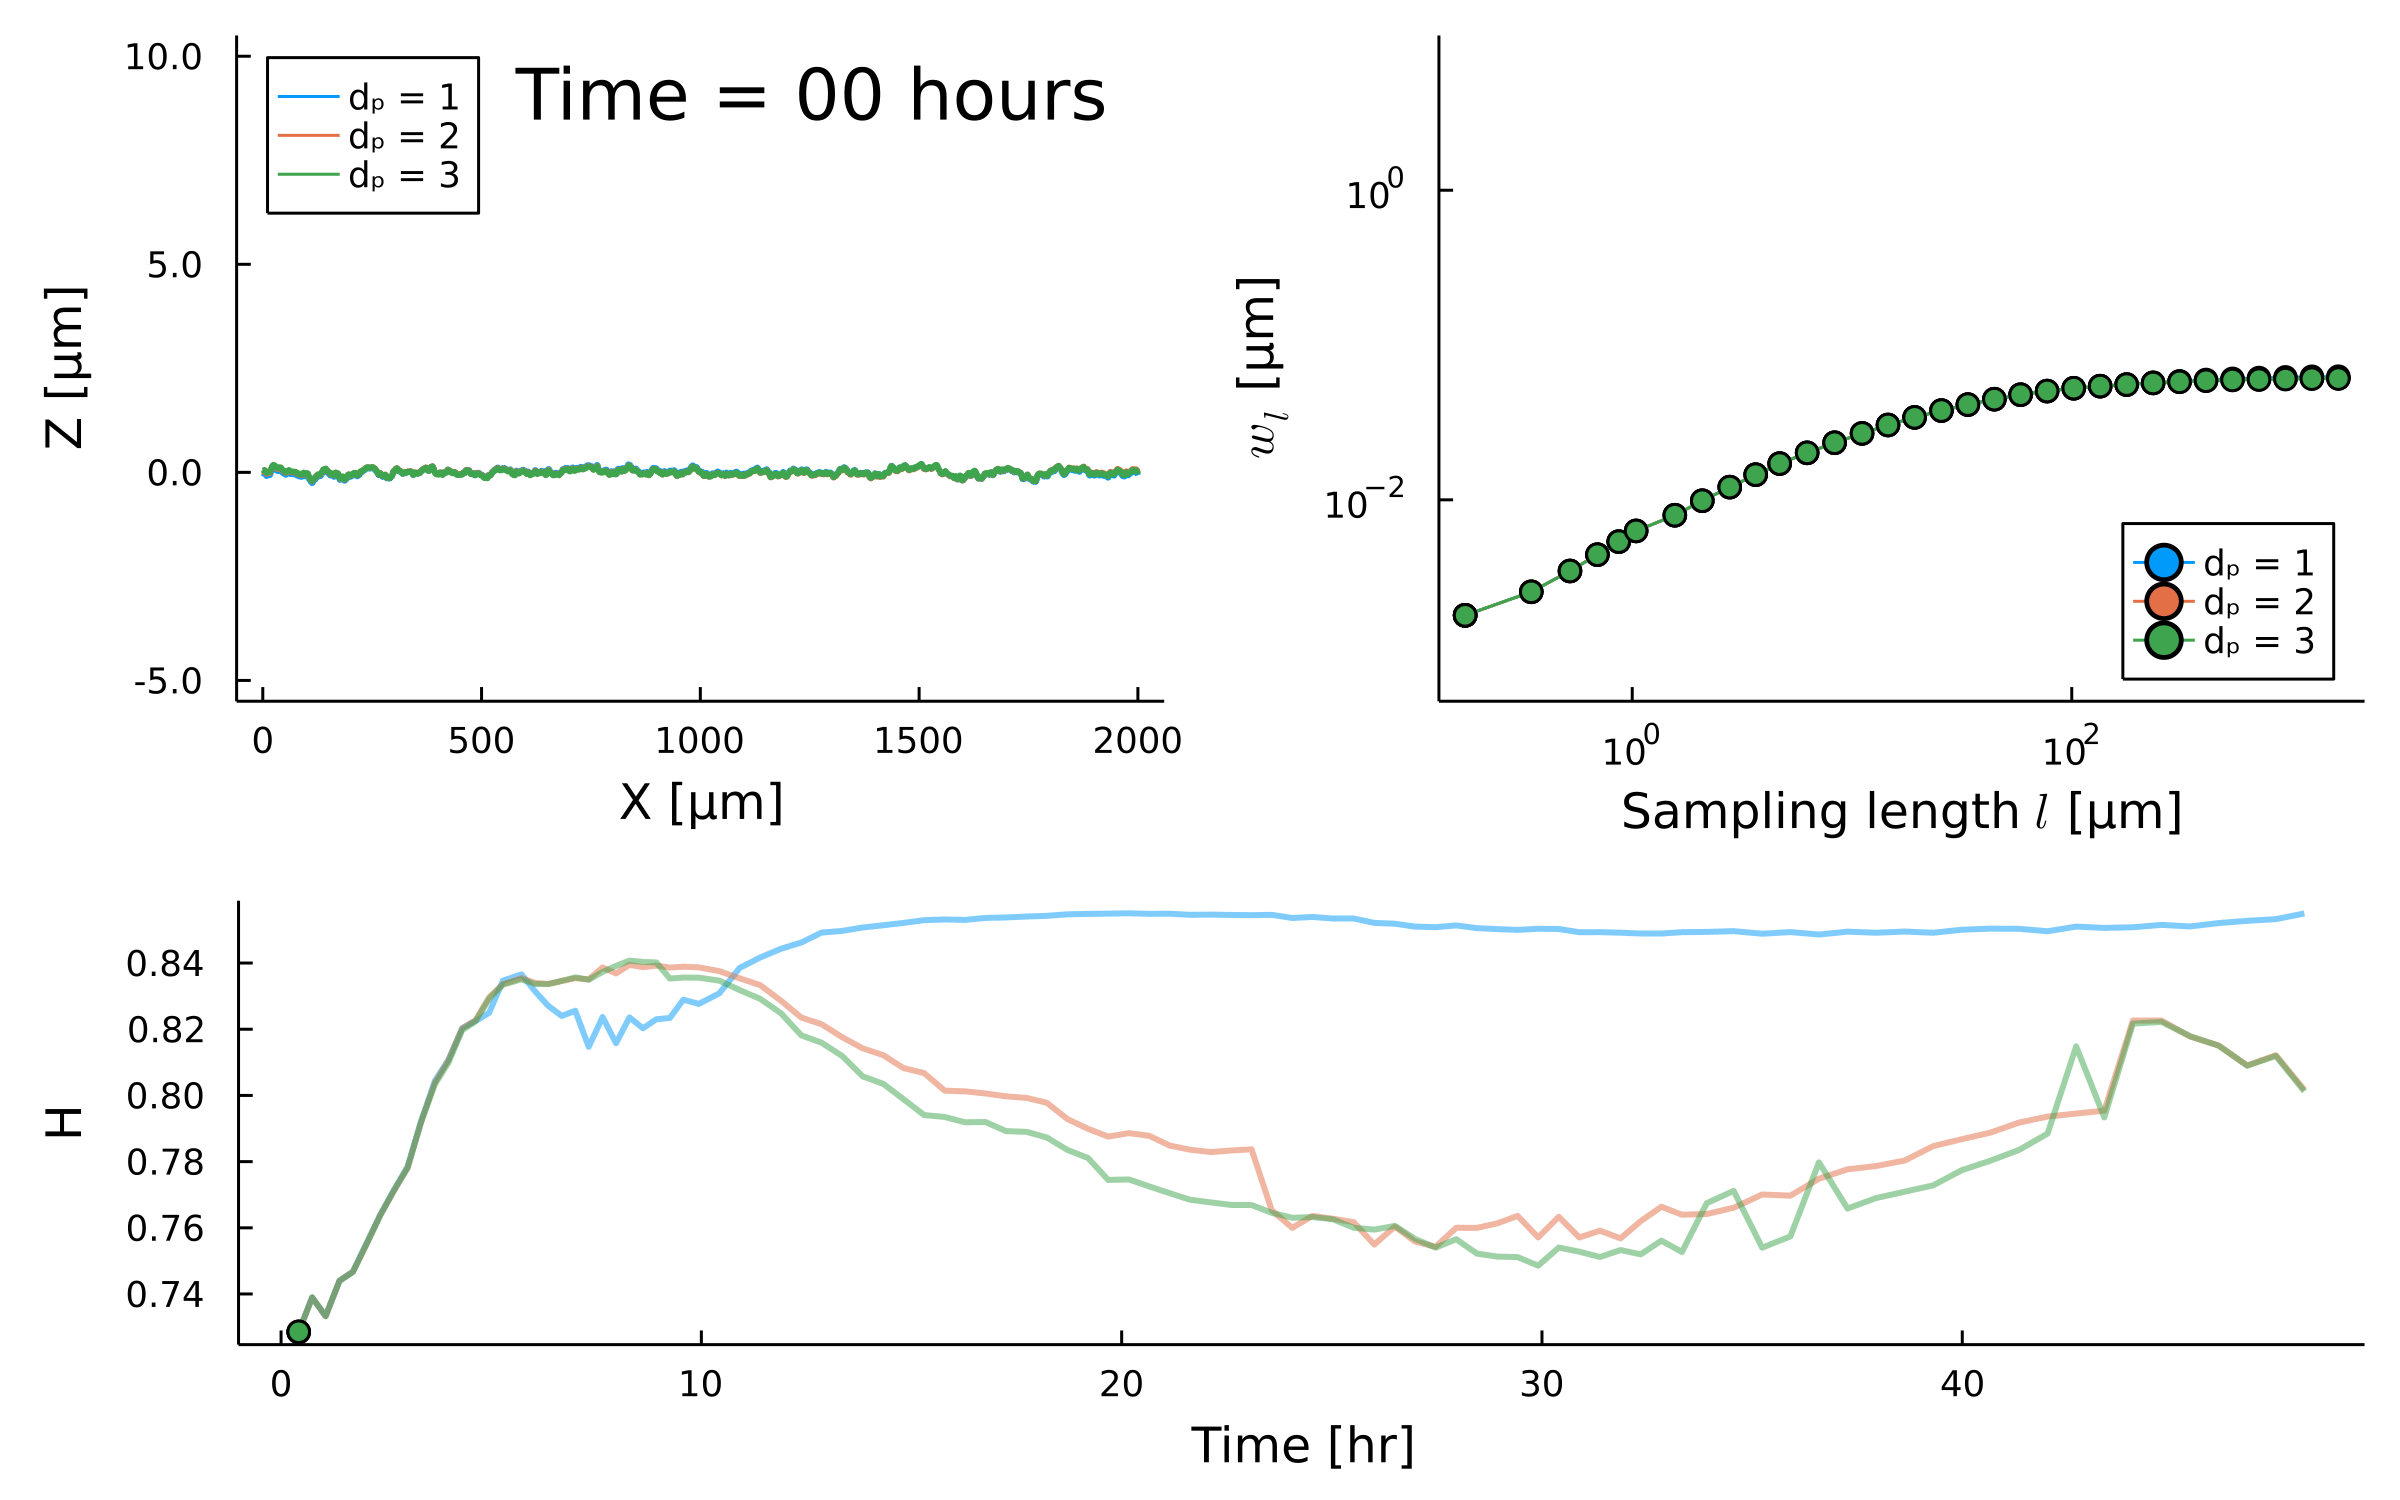
\(w_{\ell}(t) \propto \ell^{H} \)
Dervaux, et al. 2014
Martinez-Calvo and Bhattacharjee, et al. 2022
\(H\)
\({\ell}_{\text{sat}}\)
\(w_{\text{sat}}\)
\( {\ell}\)
\( {\ell}\)
Butterworth \(\lambda = 500 \mu m\)
This worries me a little!
Roughness stabilizes at \(H \sim 0.8\).
Biofilm interfaces, have been characterized at \(0.6-0.78\)
\(w_{\ell}(t) \propto \ell^{H} \)
\( {\ell}\)
\( {\ell}\)
| Paper | Roughness | ||
|---|---|---|---|
| On growth and form of Bacillus subtilis biofilms | ~2 | ~1.5 | 0.5-0.7 |
| Morphological instability and roughening of growing 3D bacterial colonies | ~1.5 | ~1 | 0.67 |
| Yunkerlab-Interferometry | ~3 | ~2.5 | 0.74-0.84 |
\(N_x\)
\(N_y\)
On growth and form of Bacillus subtilis biofilms
Dervaux, et al. 2014
Morphological instability and roughening of growing 3D bacterial colonies
Martinez-Calvo and Bhattacharjee, et al. 2022
Saturation width decreases!
Something different
is happening after \(t_{\times}\)
I
II
0
0.3
\(\Delta \vec{r}\) \([\mu m]\)
-4
-0.5
\(\log\Delta \vec{r}\) \([\mu m]\)
1 perturbation
10 perturbations
In small colonies, displacements can reach the interface
In large colonies, displacements get dissipated before reaching the interface
Local disruptions change the topography
Displacement is homogeneous
\(d_0 \sim 13 \mu m\)
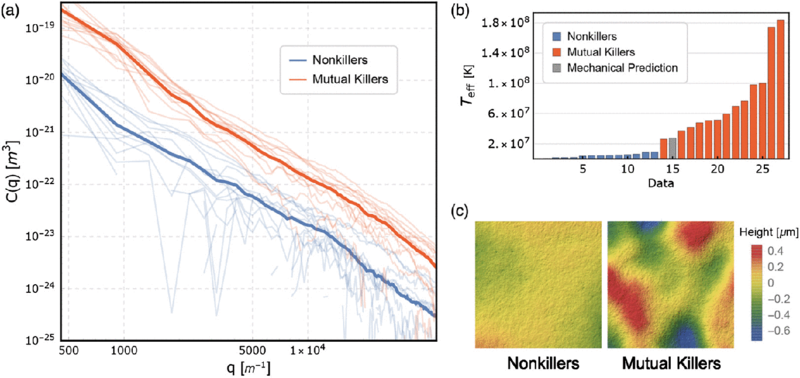
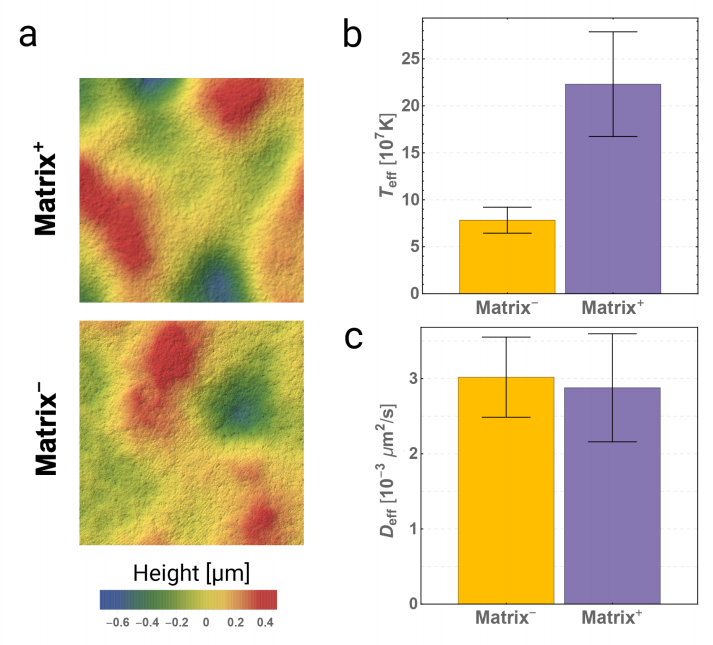
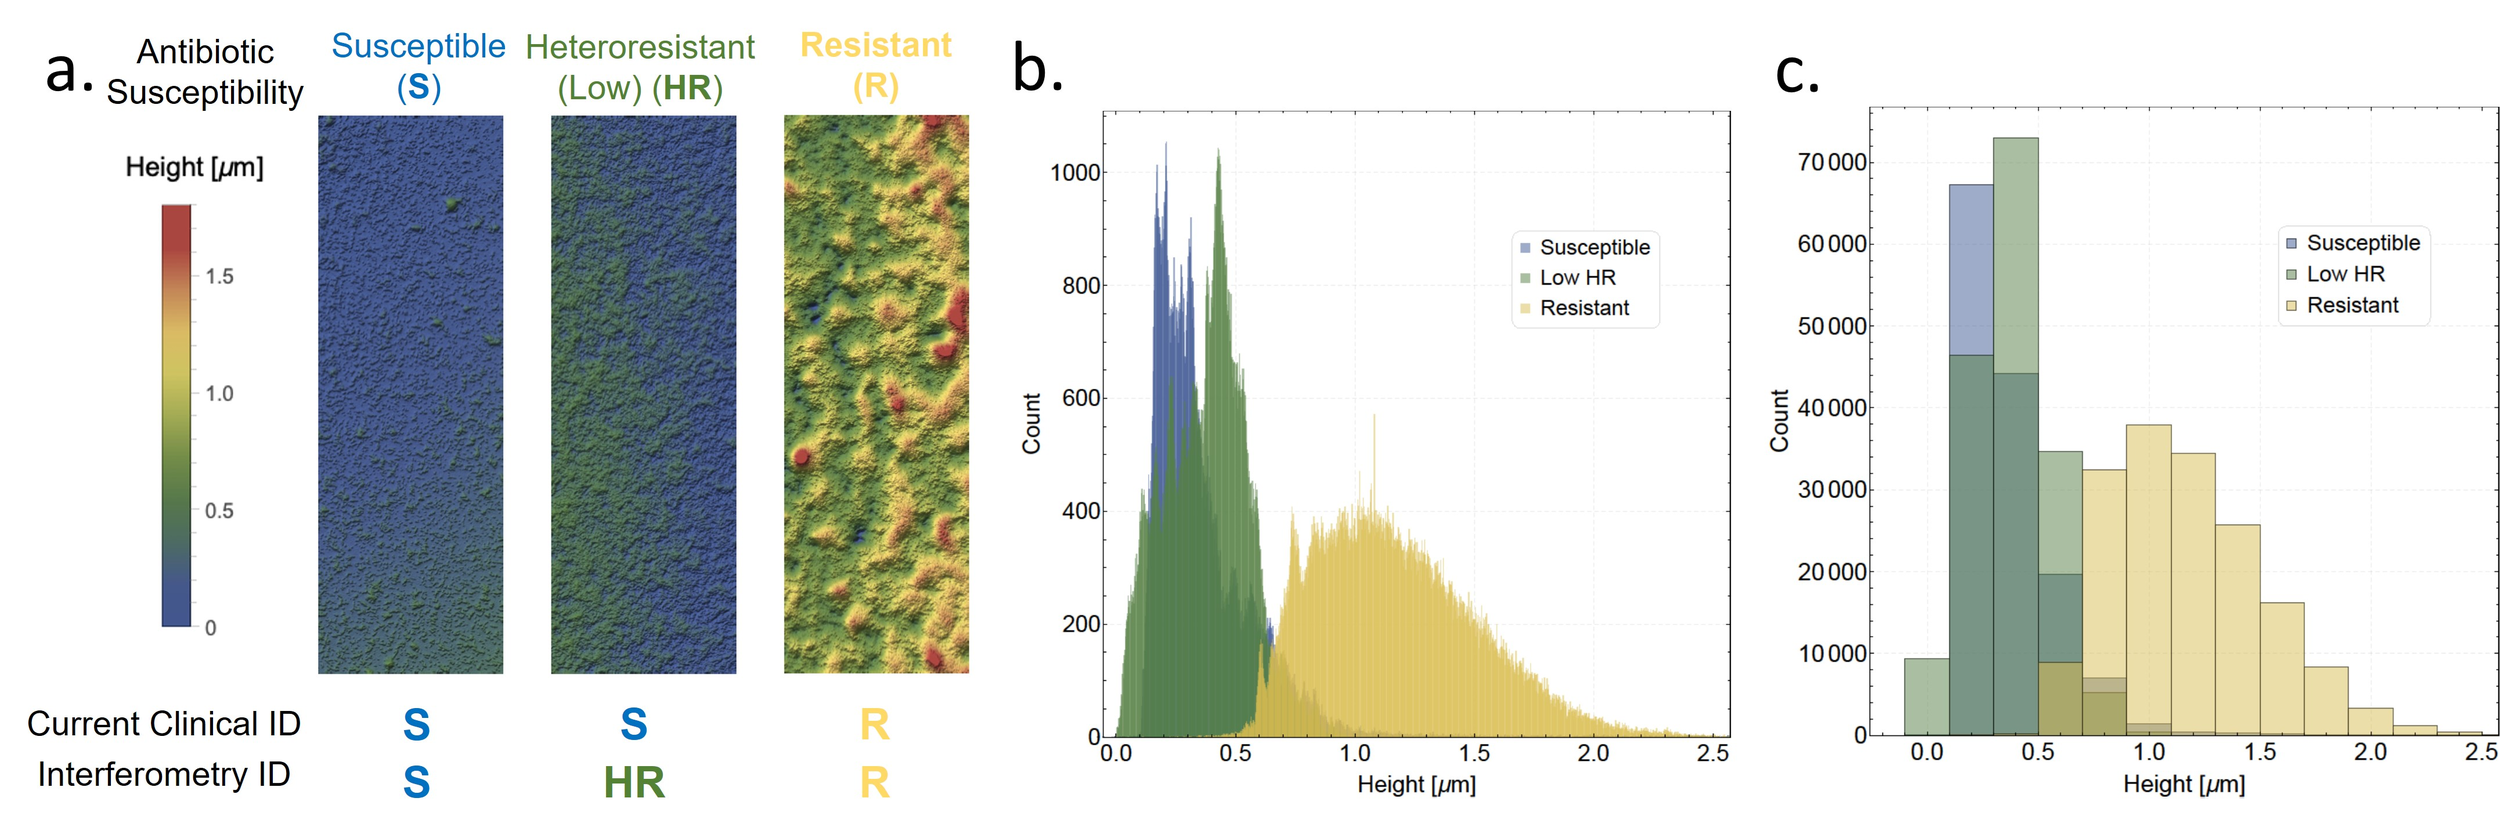
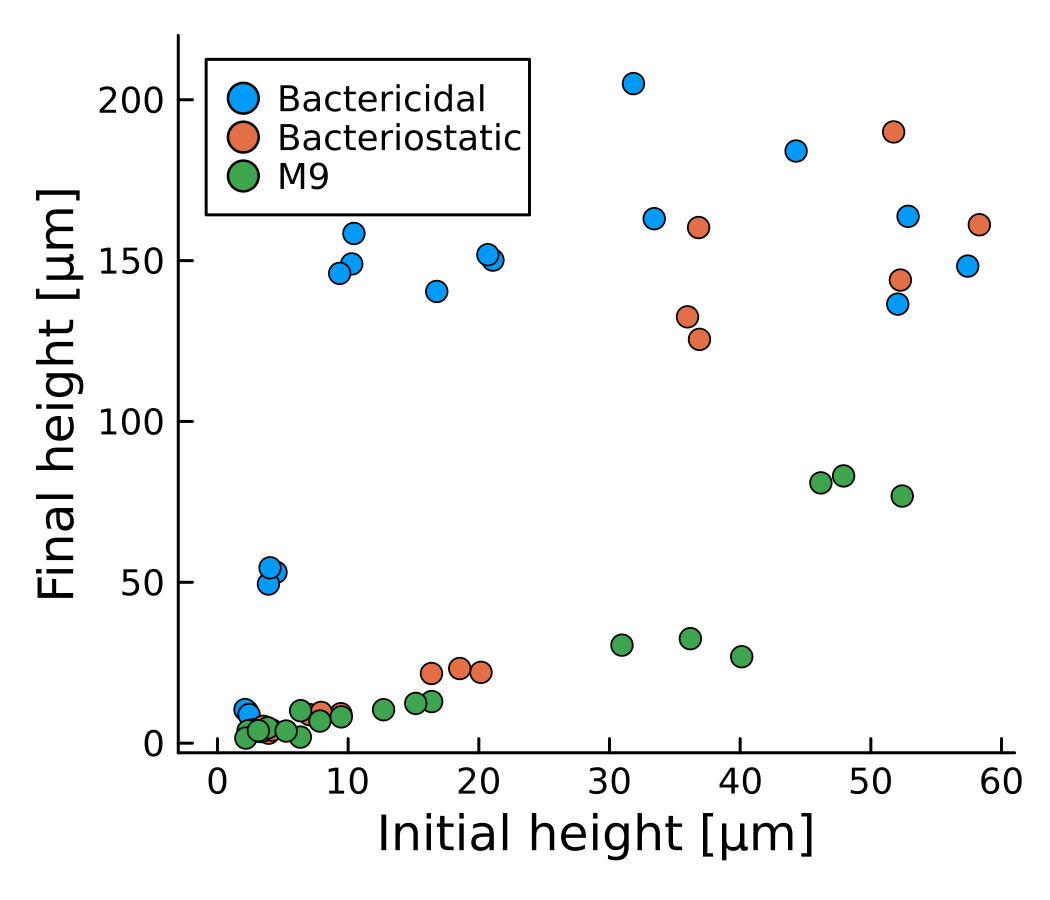
What determines the antibiotic susceptibility of a biofilm?
Before - 24h
Before - 36h
After - Growth
After - Carb
Yunker Lab
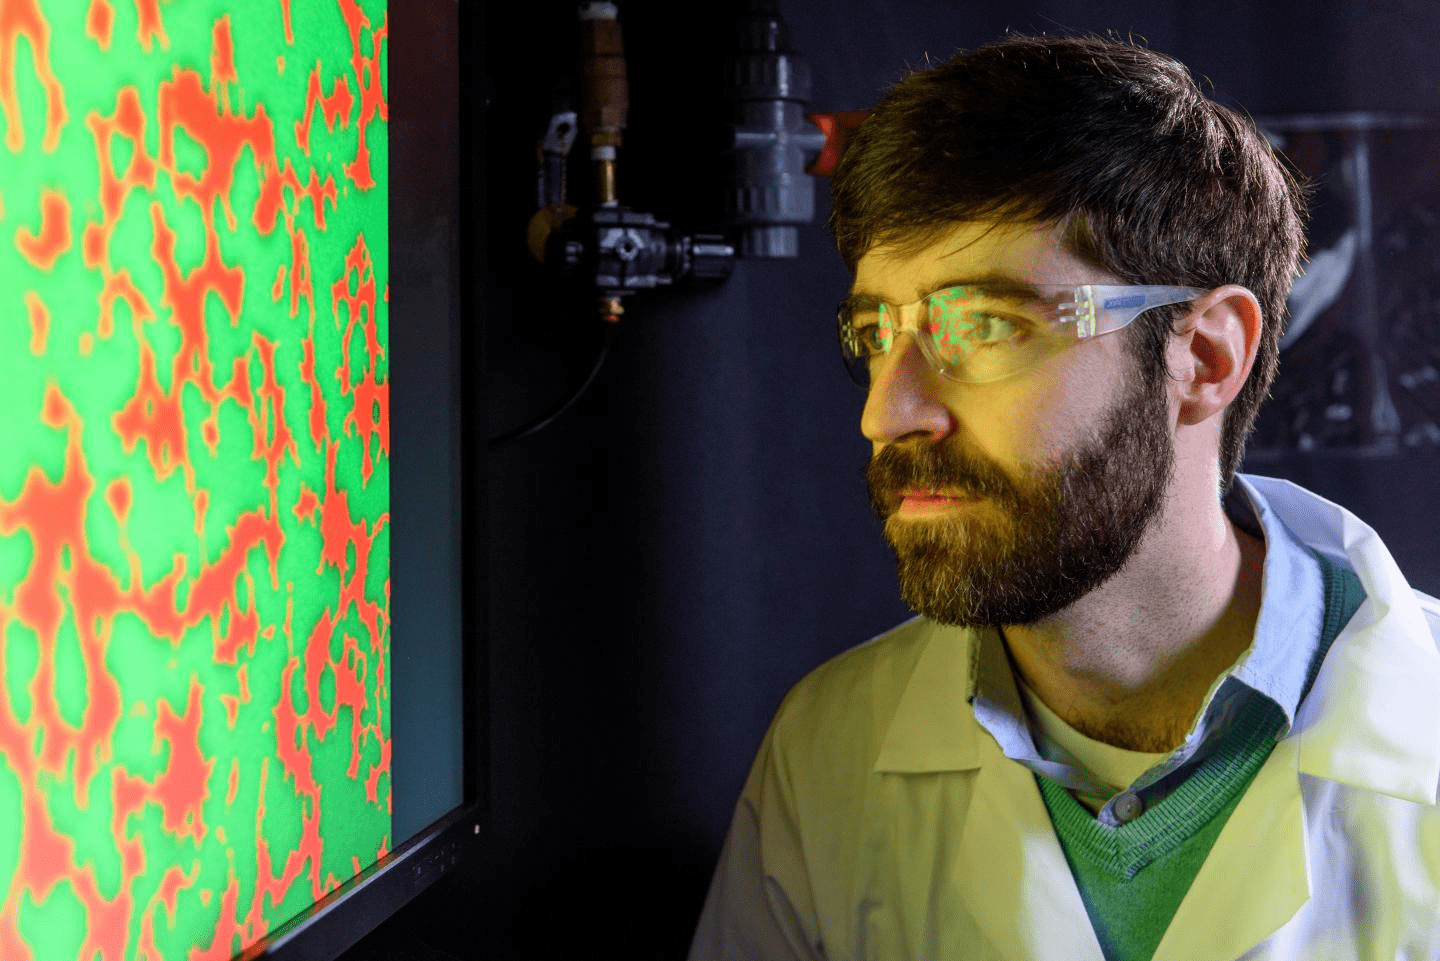
Dr. Peter Yunker
Dr. Gabi Steinbach
Dr. Alireza Zamani
Dr. Thomas Day
Dr. Miles Wetherington
Aawaz Pokhrel
Adam Krueger
Emma Bingham
Raymond Copeland
Maryam Hejri
Tremond Thomas
Lin Zhao
Committee Members
Dr. Brian Hammer
Dr. Sam Brown
Dr. Jennifer Curtis
Dr. Itamar Kolvin
Hammer Lab
Dr. Siu Lung Ng
Kathryn MacGillvray
Christopher Zhang
Ratcliff Lab
Dr. Will Ratcliff
Dr. Tony Burnetti
Dr. Rozenn Pineau
QBioS
Dr. Joshua Weitz
Dr. Andreea Magalie
Dr. Conan Zhao
CMDI
Dr. Ellinor Alseth
POLS
4x speed
10 \( \mu L \) inoculation
11 days
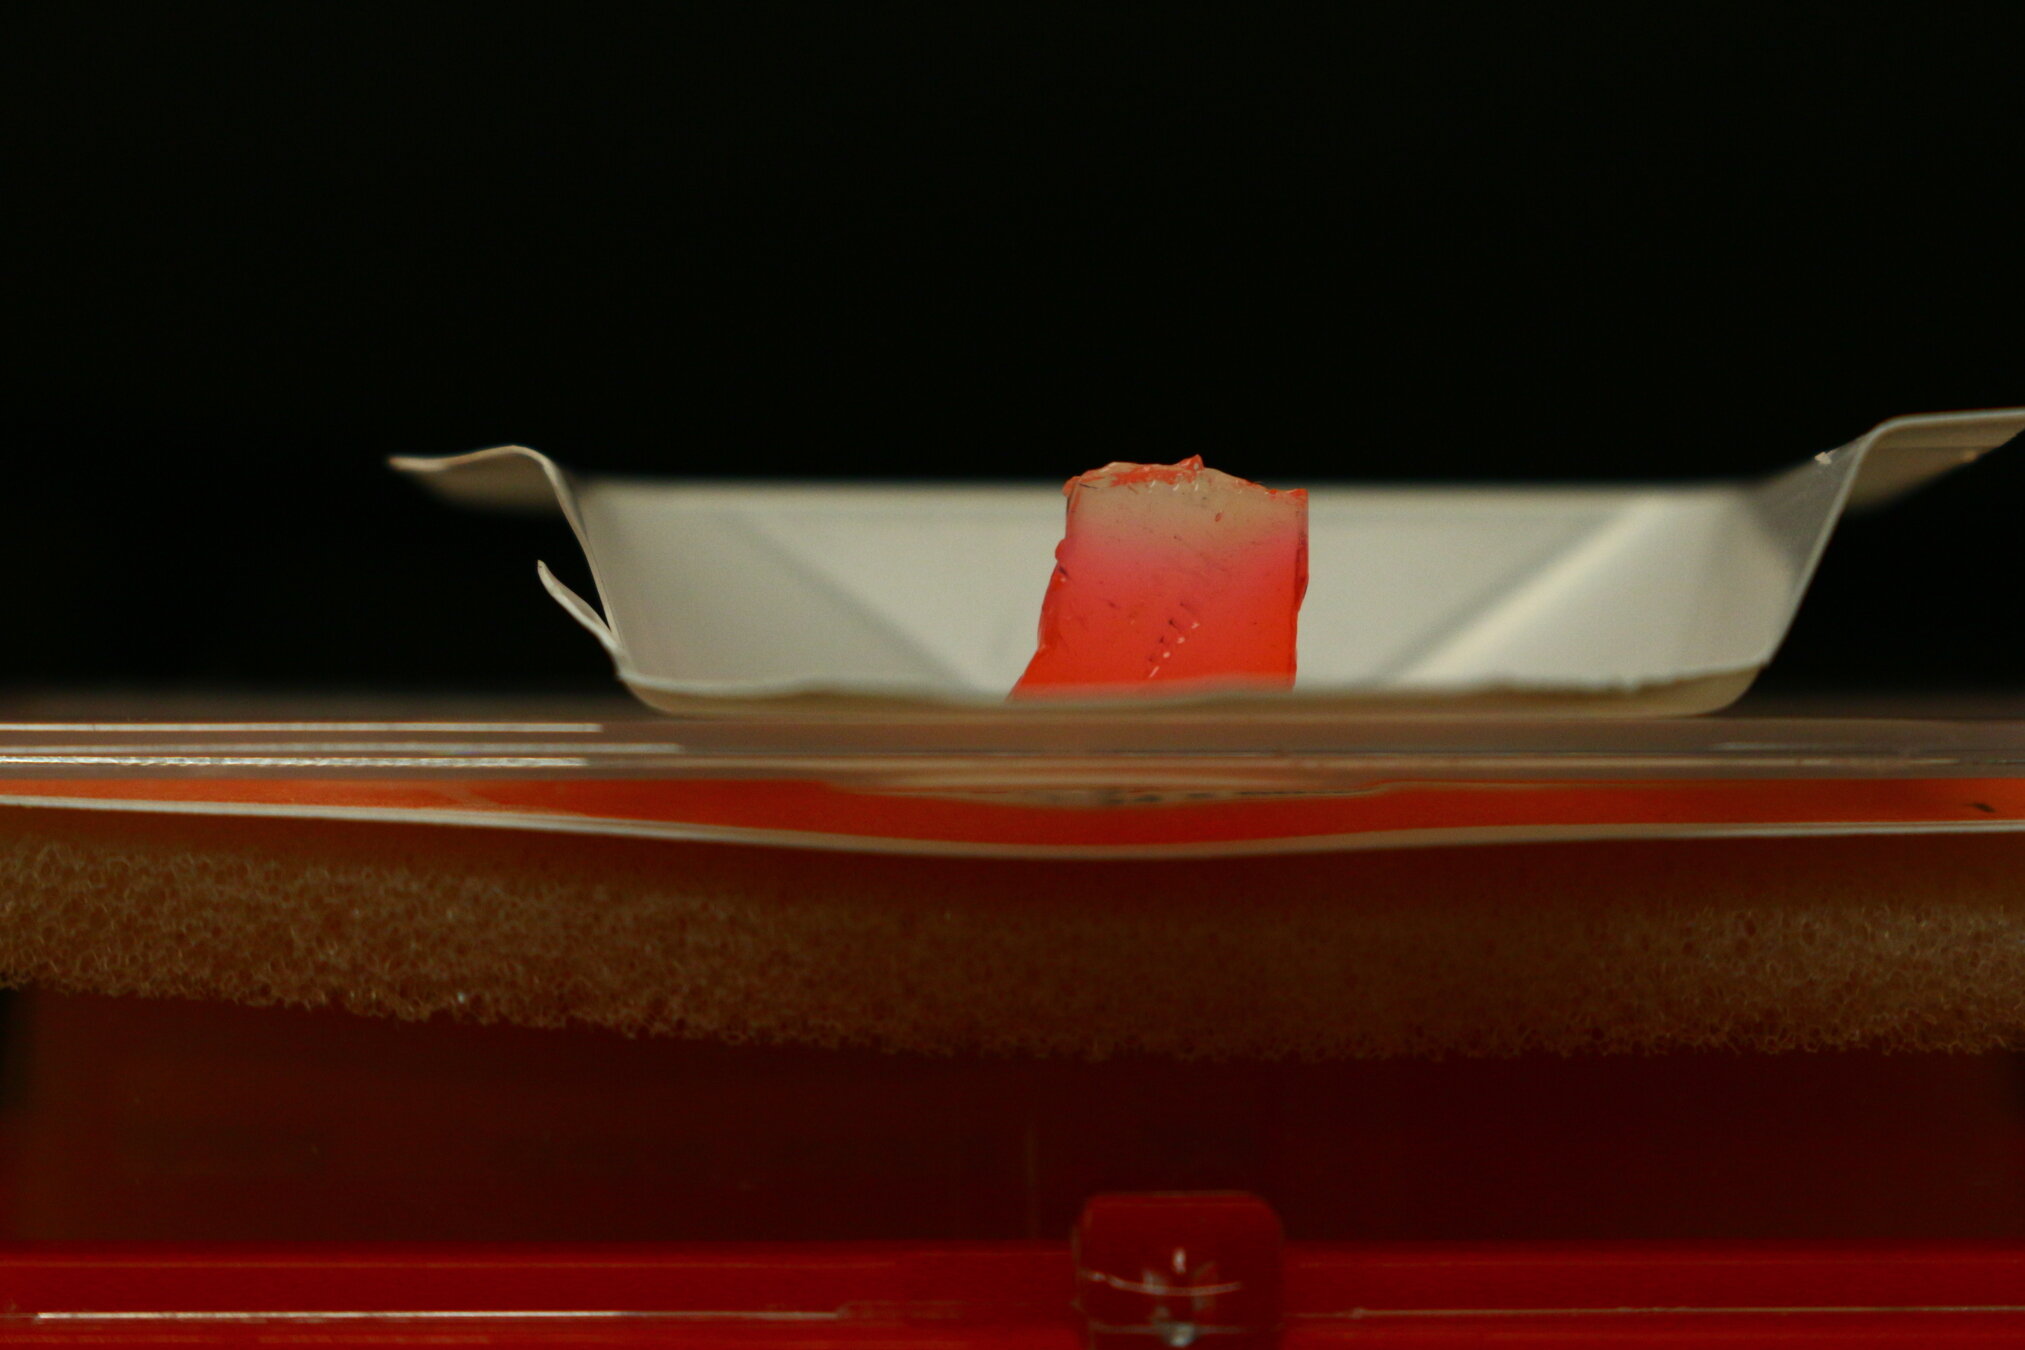
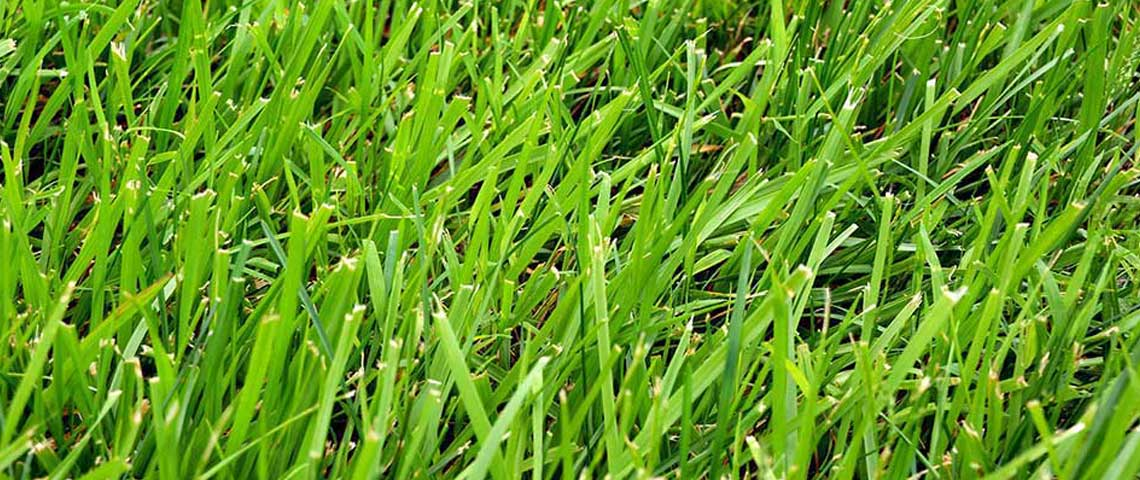
Would grass follow the height dynamics?
NO!
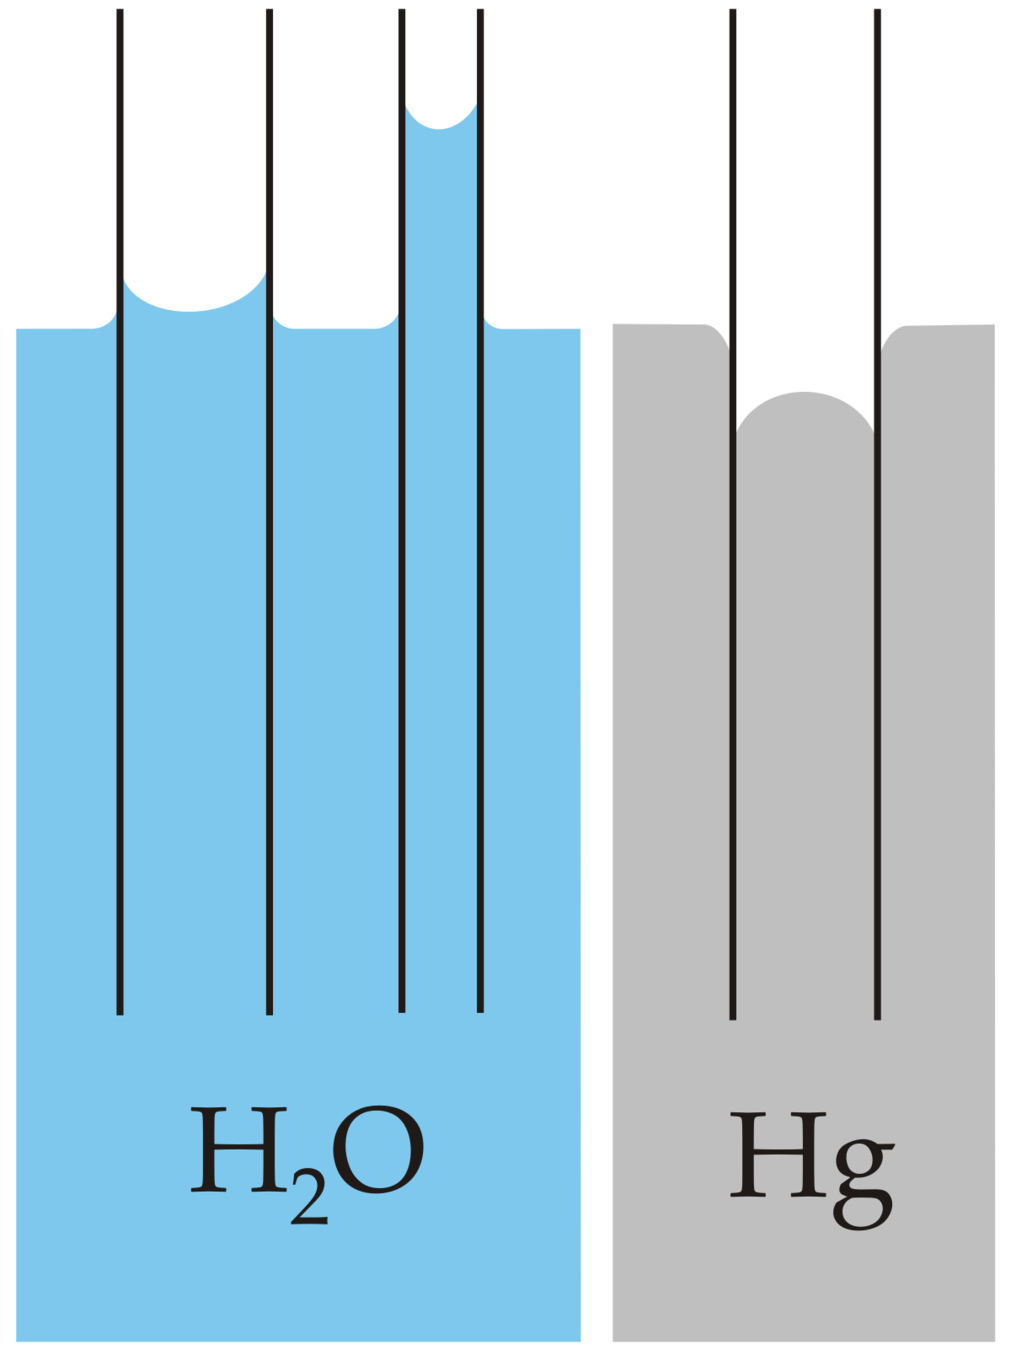
Capillary action is passive transport!
1. Biofilms are not homoegenous
2. Could we make artificial channels?
By Pablo Bravo
Discover how white-light interferometry can measure biofilm growth, their 3D structures, dynamics, and topographies. Presentation made for the QBioS 4th year Seminar at GeorgiaTech.


