


Pablo Bravo PRO
Postdoc at Caltech (Datta Lab). PhD at GT (Yunker Lab). Studying how the dynamics of microbial communities under wetting and drying cycles, mainly the feedback between biotic and abiotic processes at the pore scale.
YunkerLab, Georgia Institute of Technology
Extracellular matrix formed of polysaccharides, DNA, and proteins
Surface
Interface
Cells
Surface
Interface
Cells
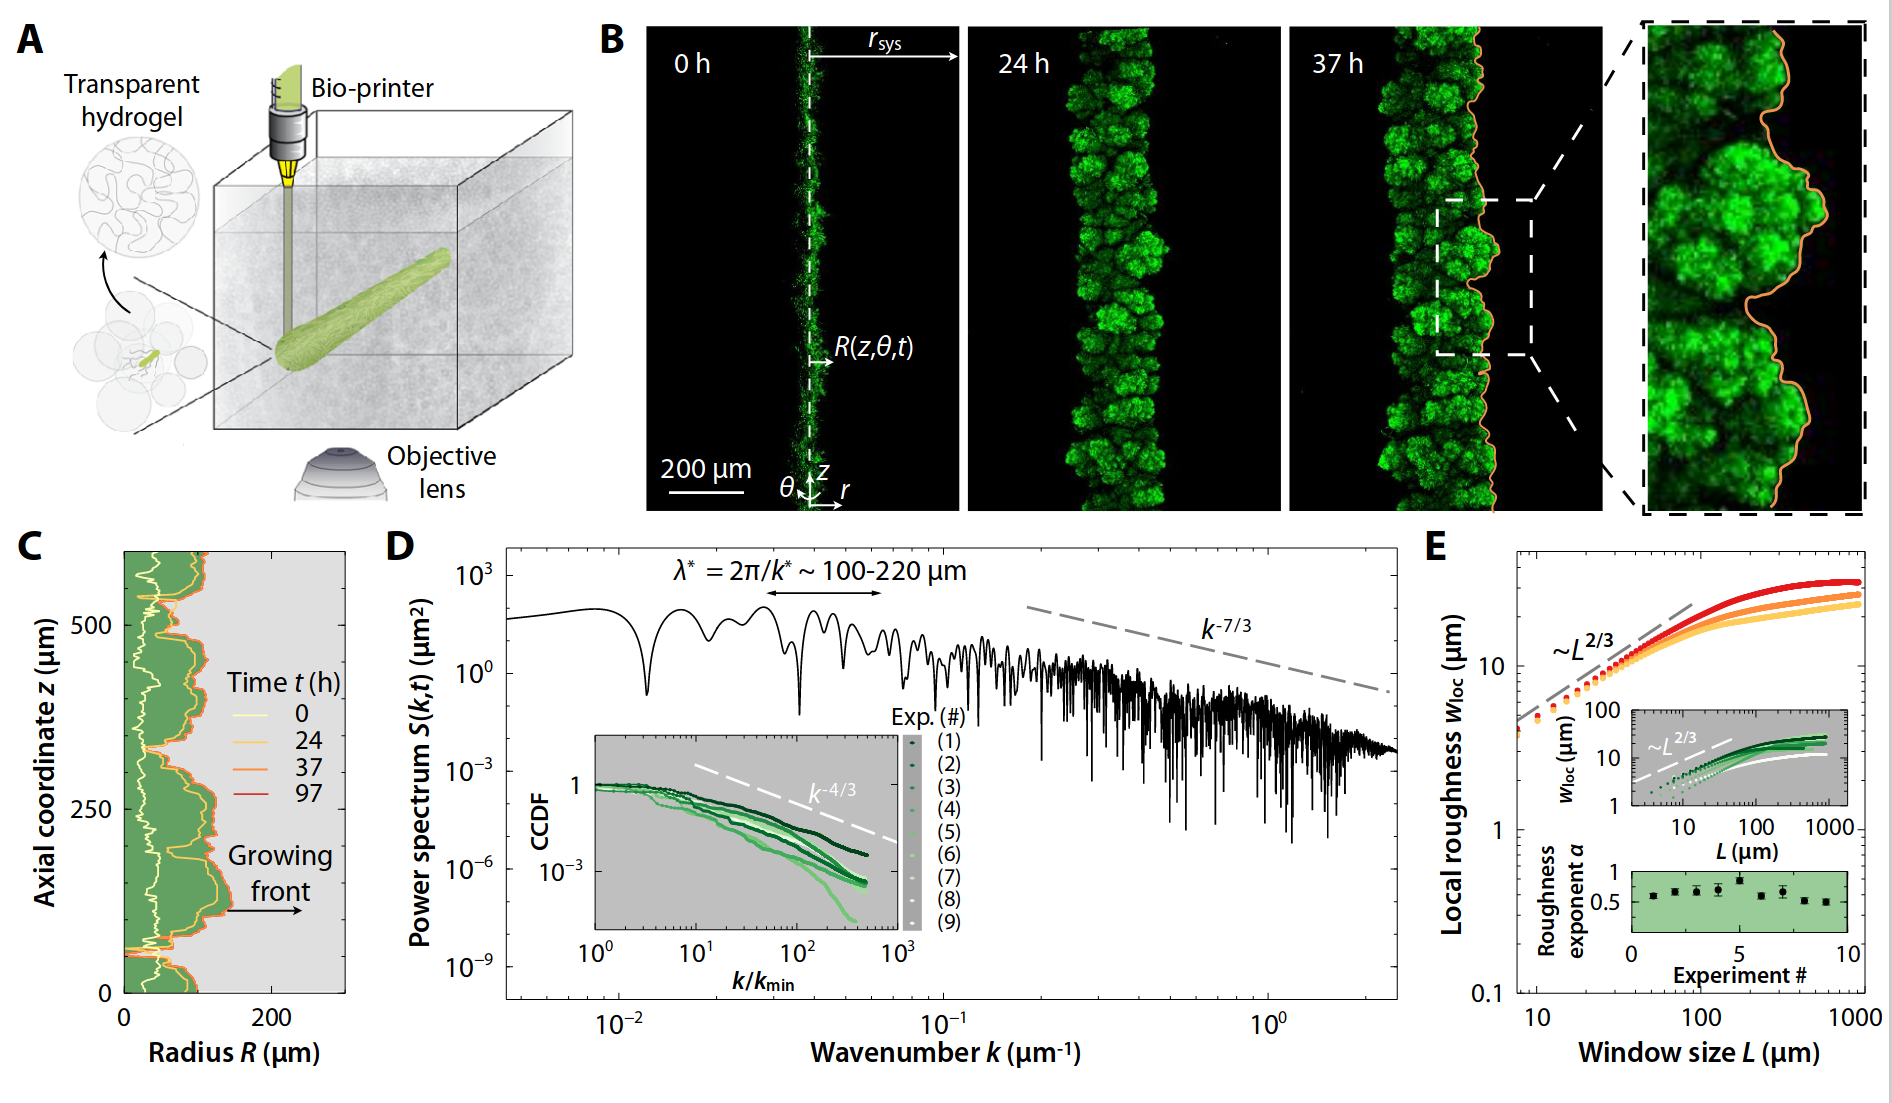
Can we learn about the biofilm development/composition by looking at its topography?
Profiles are flat. A few cells in amplitude, over thousands of micrometers!
\(500 \mu m\)
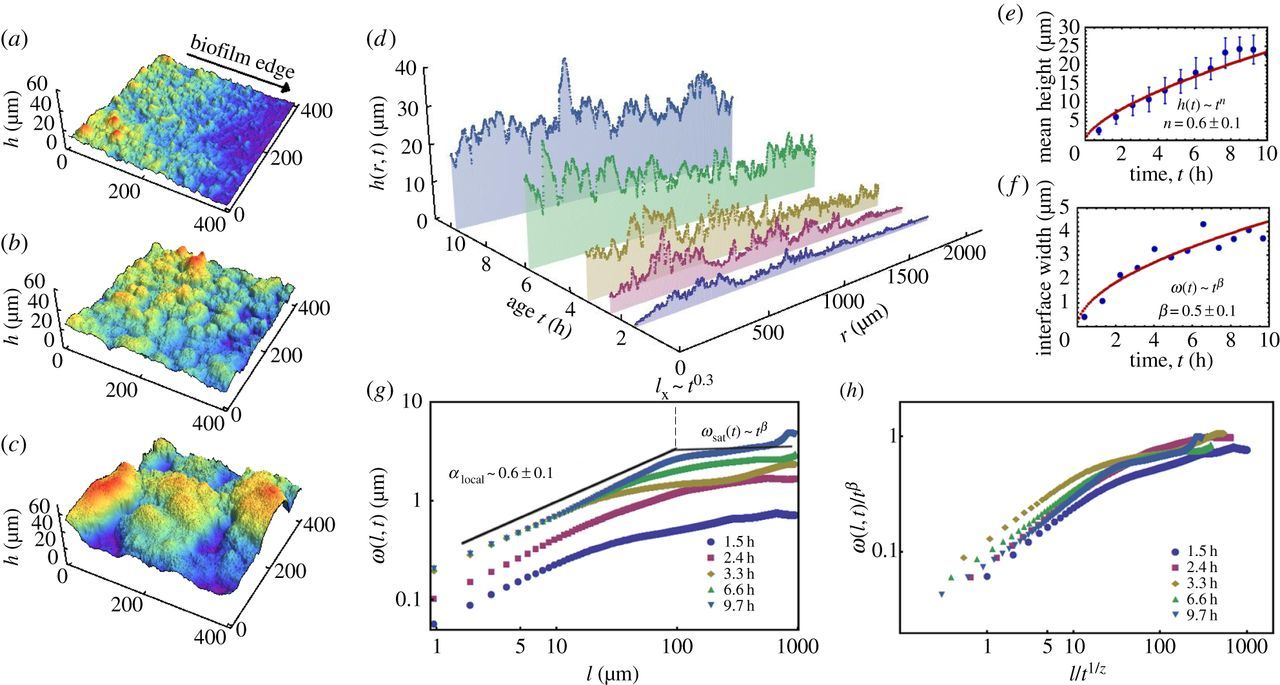
Using white-light interferometry, we can capture the profiles of a growing colonies for extended periods of time
Staphylococcus aureus
Bacillus cereus
Eschericia coli
\(2 mm\)
\(8 \mu m\)
Time since inoculation [hours]
\(0\)
\(24\)
\(48\)
Aeromonas veronii
Eschericia coli
\(w_l(t) \propto l^{H} \)
Dervaux, et al. 2014
Martinez-Calvo and Bhattacharjee, et al. 2022
\(H\)
\(l_{\text{sat}}\)
\(w_{\text{sat}}\)
Roughness \(H\), after a period of time, stabilizes at \(H_{\text{steady}} \sim 0.8\)
There is high variability between microbes
Growth rate
Decay rate
Diffusion length
In press at PNAS
There is high variability between microbes
And an apparent correlation between vertical growth dynamics and the topography!
Colonies reach nutrient depletion length \(L\)
Knowing the moment when the colony is growing the fastest, just by looking at
fluctuations
\(S(k) [\mu m^4]\)
\(k [\mu m^{-1}]\)
\(10^4\)
\(10^3\)
\(10^2\)
\(10^1\)
Dynamic scaling, a test for self-affinity requires:
\(\nu = 1+2H\)
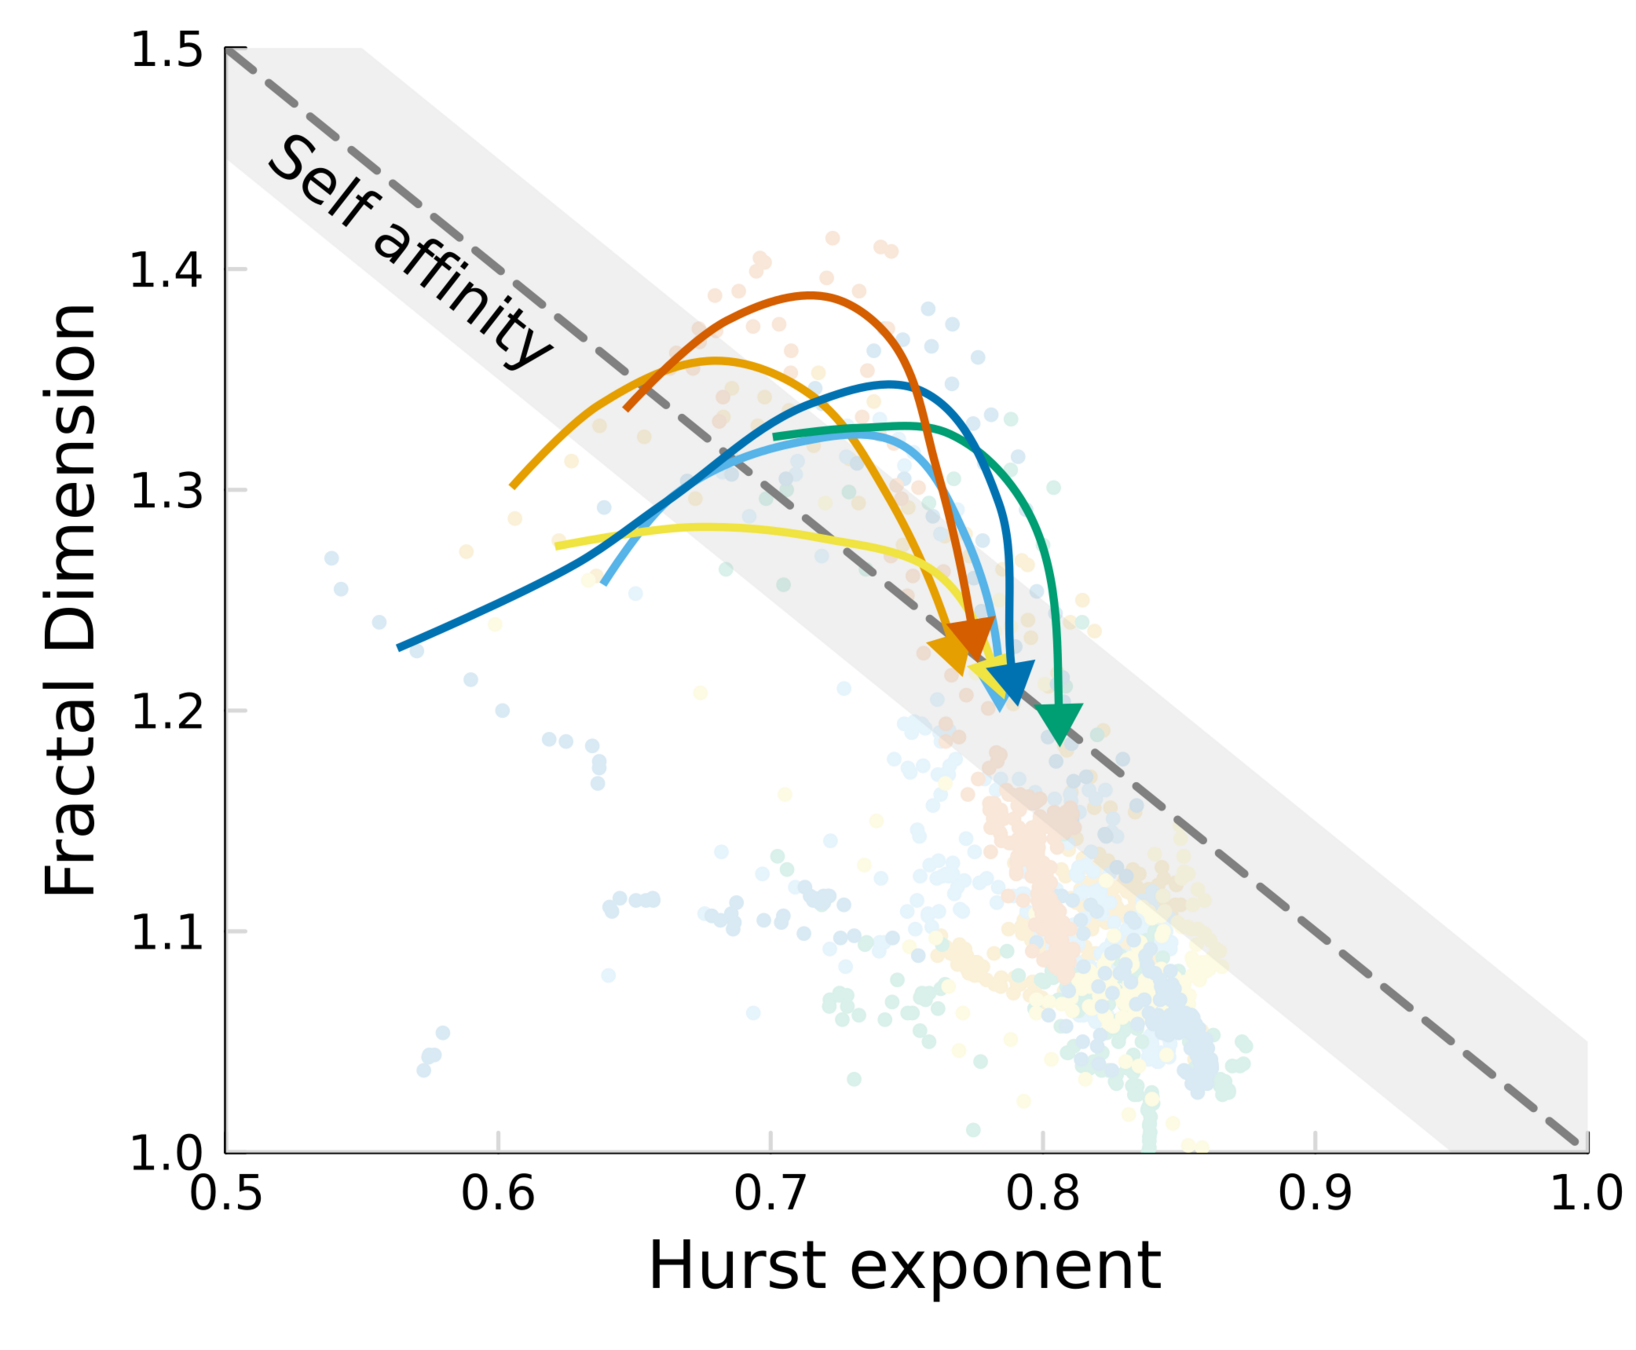
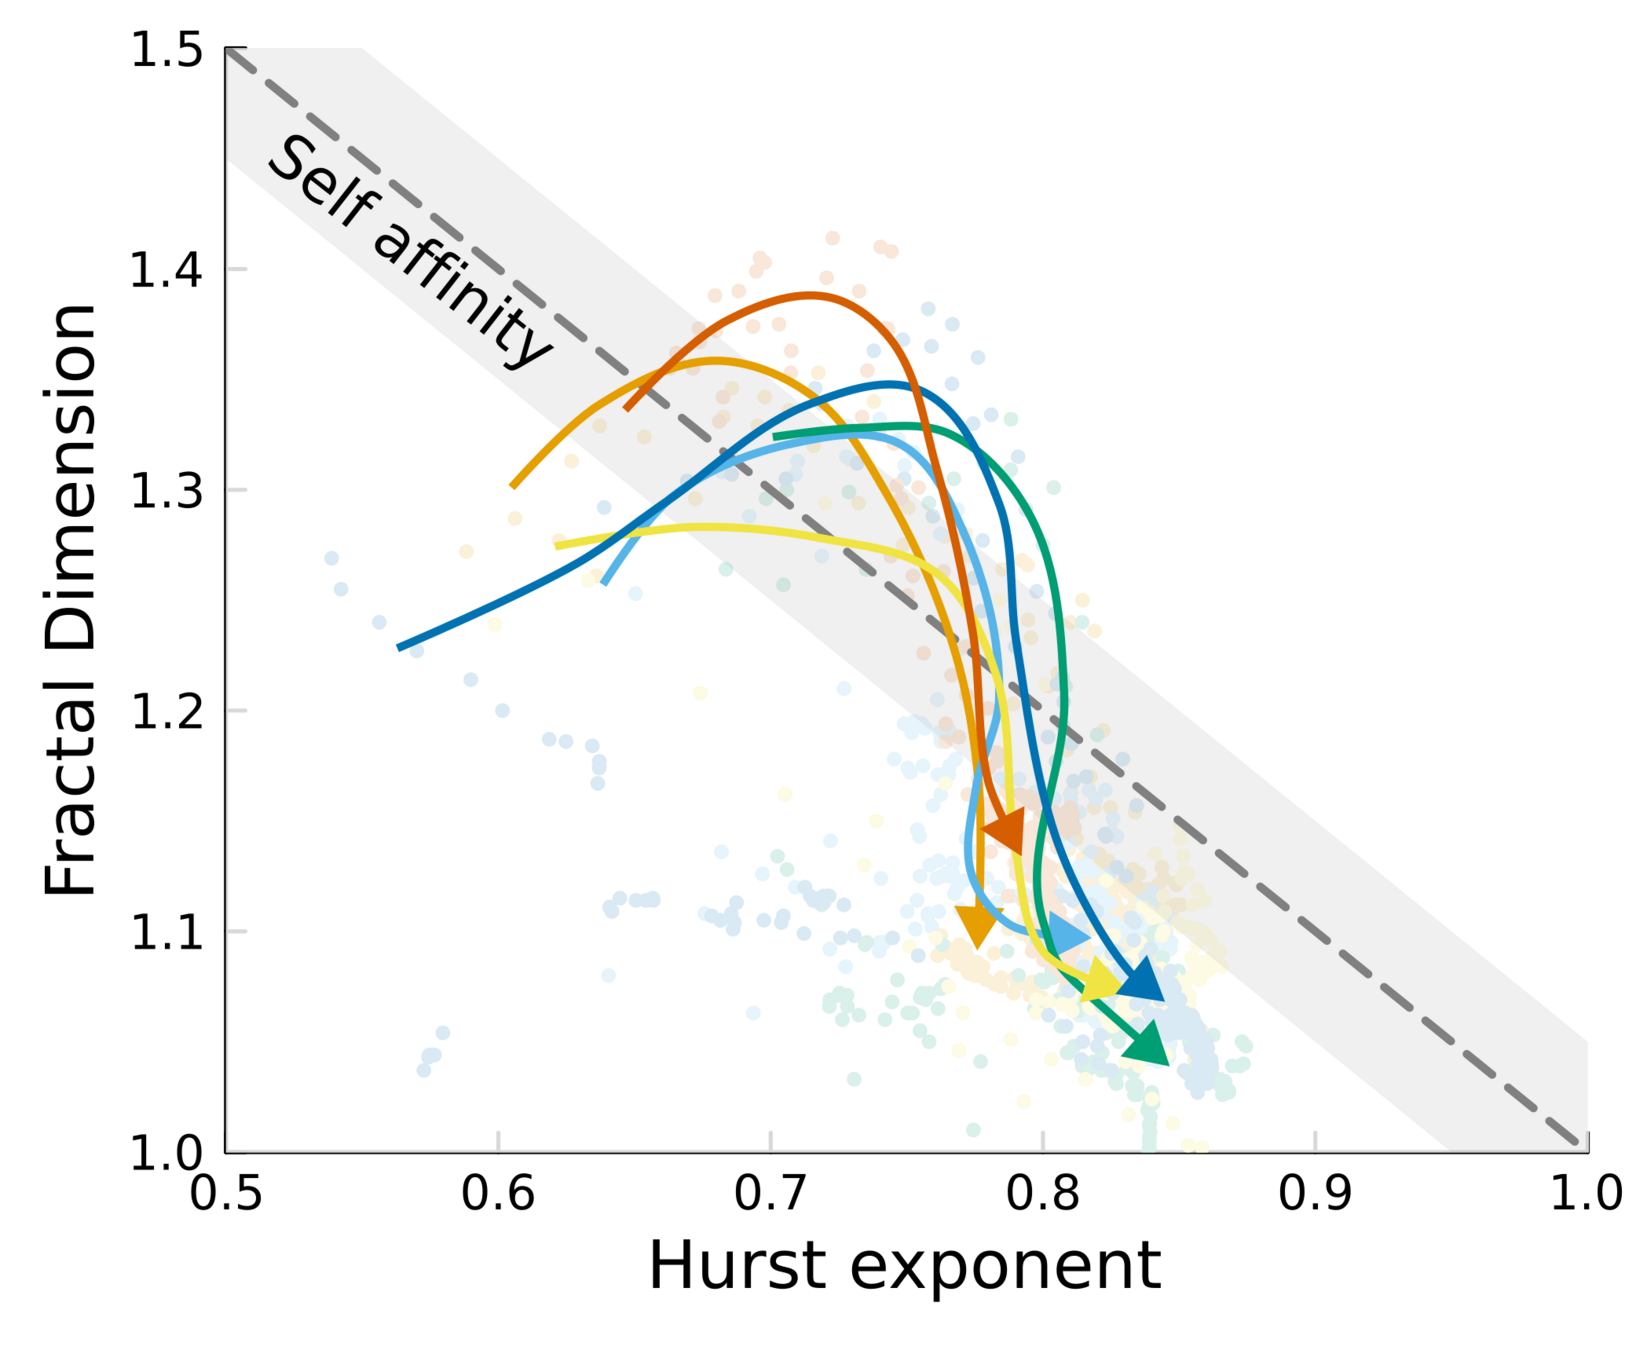
We do not see observe dynamic scaling.
It is close but not the same!
We can test self-affinity using the fractal dimension \(D\)
\(D + H = 2\)
\(D + H = n +1\), where \(n\) is the base dimension of the system
Topography dynamics as a consequence of growth through a viscoelastic material:
NIH-NIMS
NSF BMAT
Biolocity
Dr. Peter Yunker
Dr. Brian Hammer
Dr. Siu Ling Ng
Dr. Thomas Day
Aawaz Pokhrel
Emma Bingham
Adam Krueger
Raymond Copeland
Maryam Hejri
Lin Zhao
Chris Zhang
Can we establish a link between and ?
Hopefully!
topographies
biofilm development
By Pablo Bravo
Explore the fascinating world of biofilm topographies and their dynamic fluctuations! Discover how different strains exhibit unique growth patterns and the intriguing implications for understanding these complex 3D structures.


