

Panshul Khurana
Working as a Drupal Developer, strongly believe in learning and sharing. When I'm not coding, I'm busy finding new cafes and reading books. Follow me on youtube : https://bit.ly/3cx19sn , Resume : https://panshulk.github.io
Profiling with Xhprof
&
it's usage with Drupal
Hierarchical Profiler for PHP Applications that reports CPU Utilisation, memory consumption, Function level call counts, time consumed ...
- Call Graph : Displays executed code in a visual diagram where each node corresponds to a function or method and their relations show Code Flow.
- Exclusive Time : How long does it take to execute a function without time spent on other functions/methods.
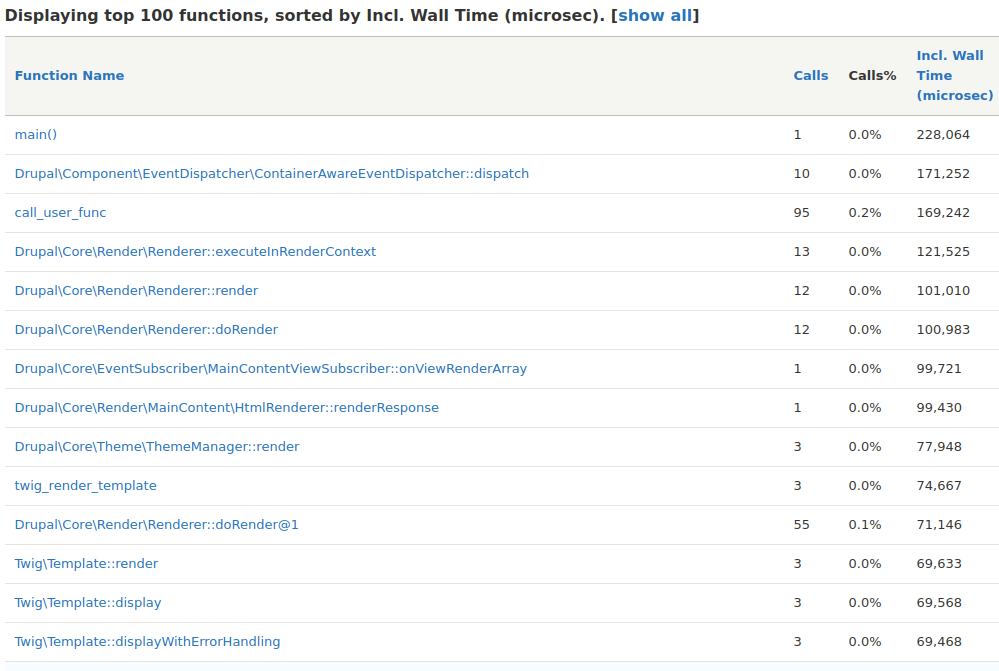
- Inclusive Time : Total time spent executing a function/method including any external call.
Some Basic Terminologies to understand xhprof reports better...
Provides function-level summary information such as number of calls, inclusive/exclusive wall time, memory usage, and CPU time.
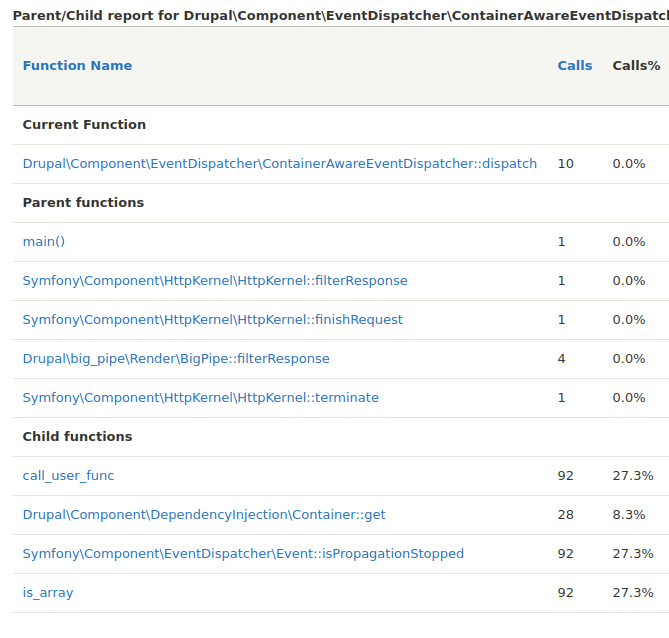
For each function, it provides a breakdown of calls and times per parent (caller) & child (callee)
Profiling with XHprof
Output
By Panshul Khurana
A brief introduction about xhprof and it's usage with Drupal 8


