Patrick Power
Economics PhD @ Boston University
Average Annual Effect for Lower Income Individuals
Per individual cost of the program
Population Probability Space
Sample
Probability Space
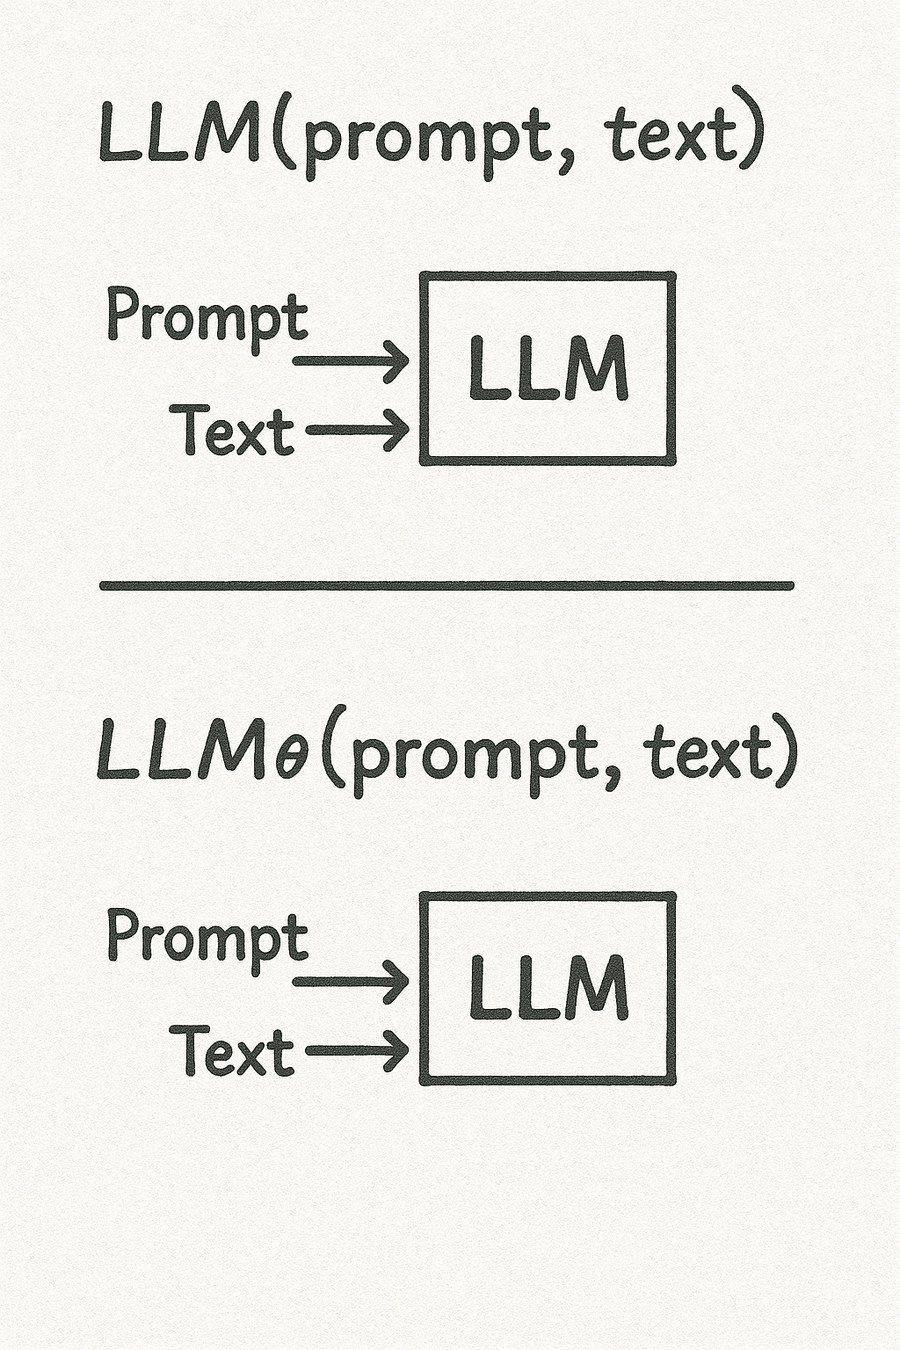
Learnable
Part 1
Part 2
Part 3
Denotes Set
Sample Space
Population
Samples
President
Impose Tariffs
Regulate Imports
President
Impose Tariffs
Regulate Imports
An Unusual & Extraordinary Threat to the U.S.
Filled in Subsets Denote "Attrition"
Tom Thibodeau Fired
Team Not Ready
Poor Strategy
Unpopular
Rick Carlisle
Fired
Team Not Ready
Poor Strategy
Unpopular
By Patrick Power


