Deep Profiling - Gene Expression
VAE Models for lower dim... embed... and survival pre...
Subhankar Mishra, Sachin Kumar
BL2403, School of Computer Sciences, NISER

Data Collection & Preprocessing
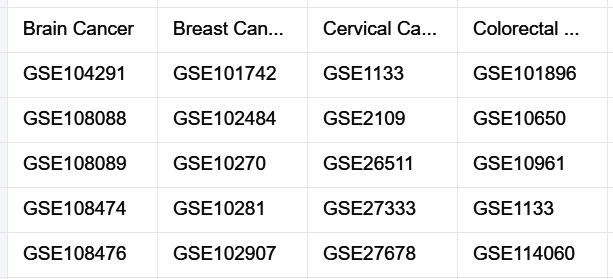
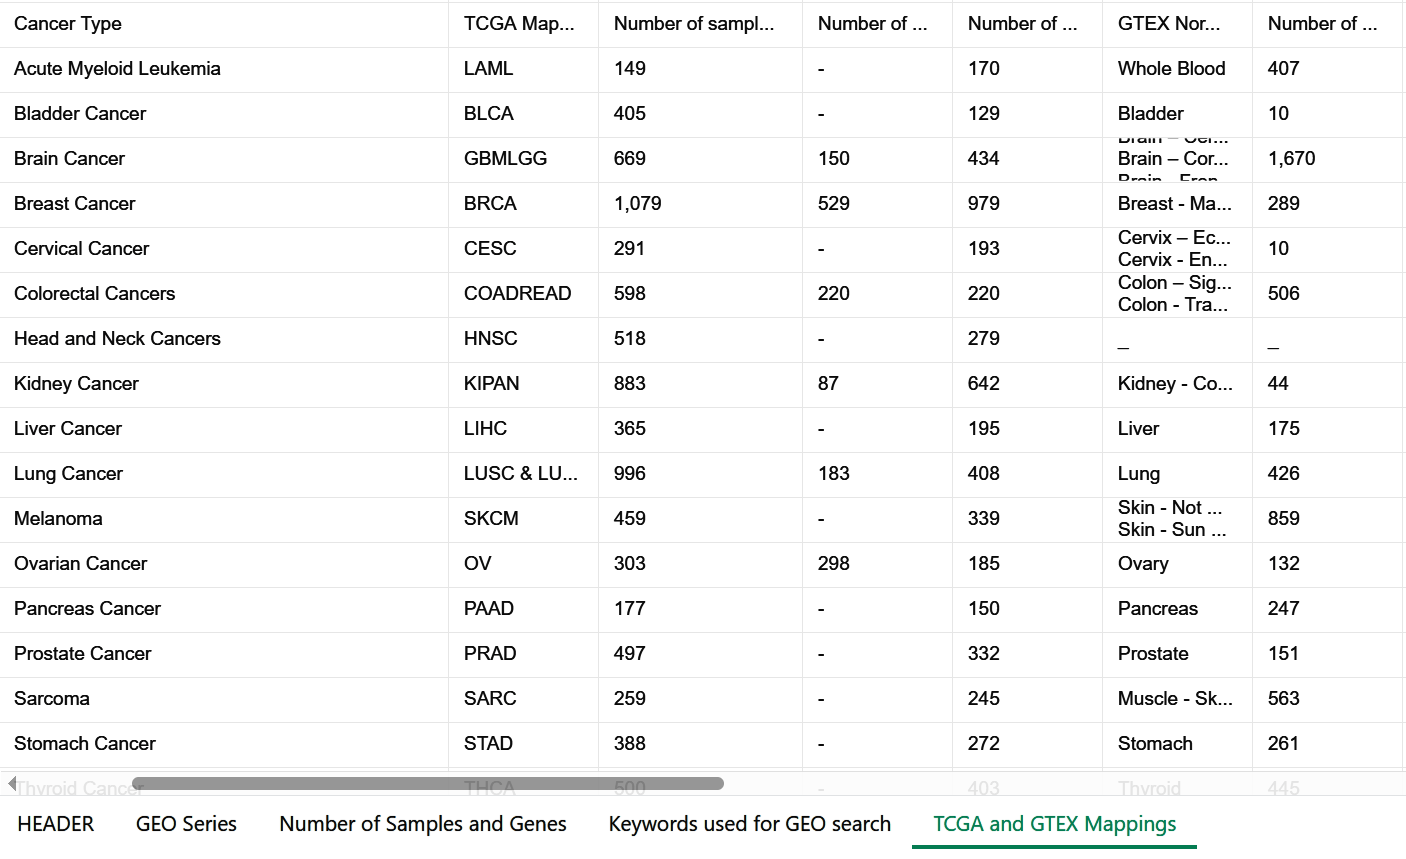
We downloaded publicly available gene-expression datasets generated by either of the two microarray platforms: Affymetrix GeneChip Human Genome U133 Plus 2.0 (Affy HG-U133 Plus 2.0) and Affymetrix GeneChip Human Genome U133A 2.0 (Affy HG-U133A 2.0).
we used the ‘GEOparse’ Python library (https://github.com/ guma44/GEOparse) for downloading the datasets.
Batch Correction & Standardization
Training variational autoencoder models
Finding PCA Components
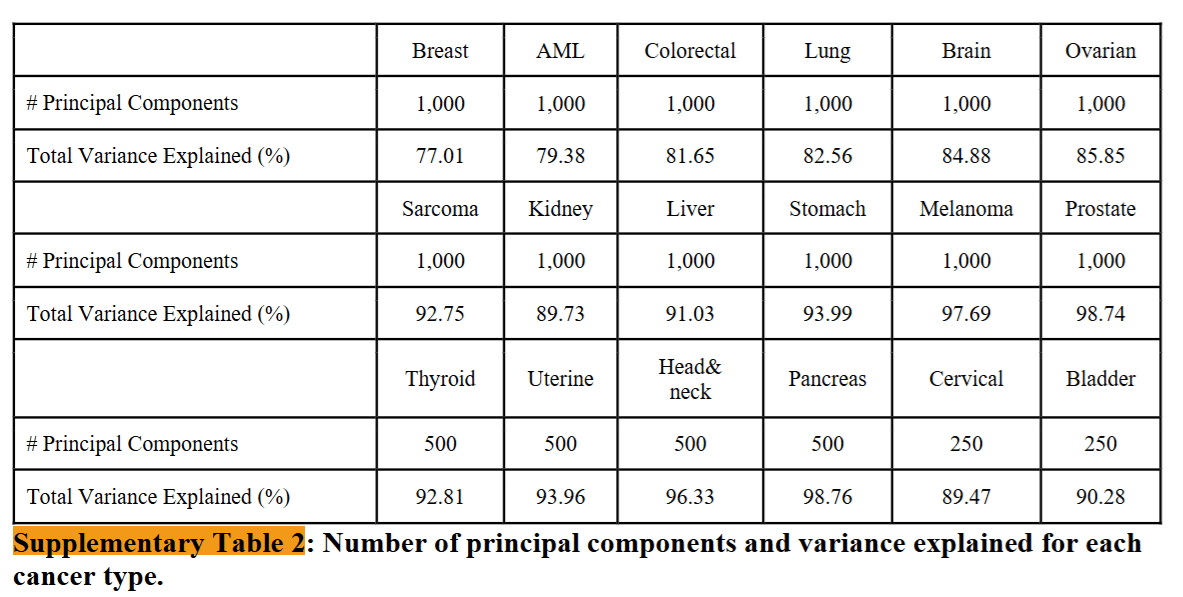
Specifically, we selected 1,000 components for cancer types with more than 1,000 samples, 500 components for those with 500 to 1,000 samples, and 250 components for those with fewer than 500 samples. Our criteria ensure that the selected components account for ~80% of the variance in almost all cancer types and 90% for most (Supplementary Table 2).
Training variational autoencoder models
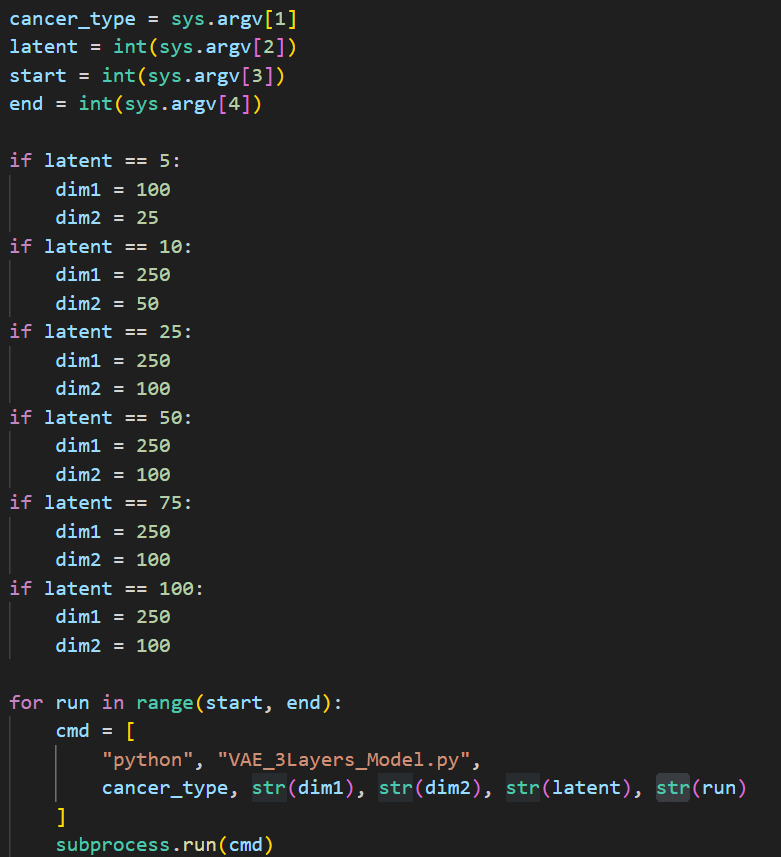
Manual Selection latent space VAE models sizes: 5, 10, 25, 50, 75 and 100.
All layers used rectified linear unit activation, except the last layers of both networks, where we applied linear activation and batch normalization on all encoder layers.
Calibration: Dropout & Intermediated dimensions
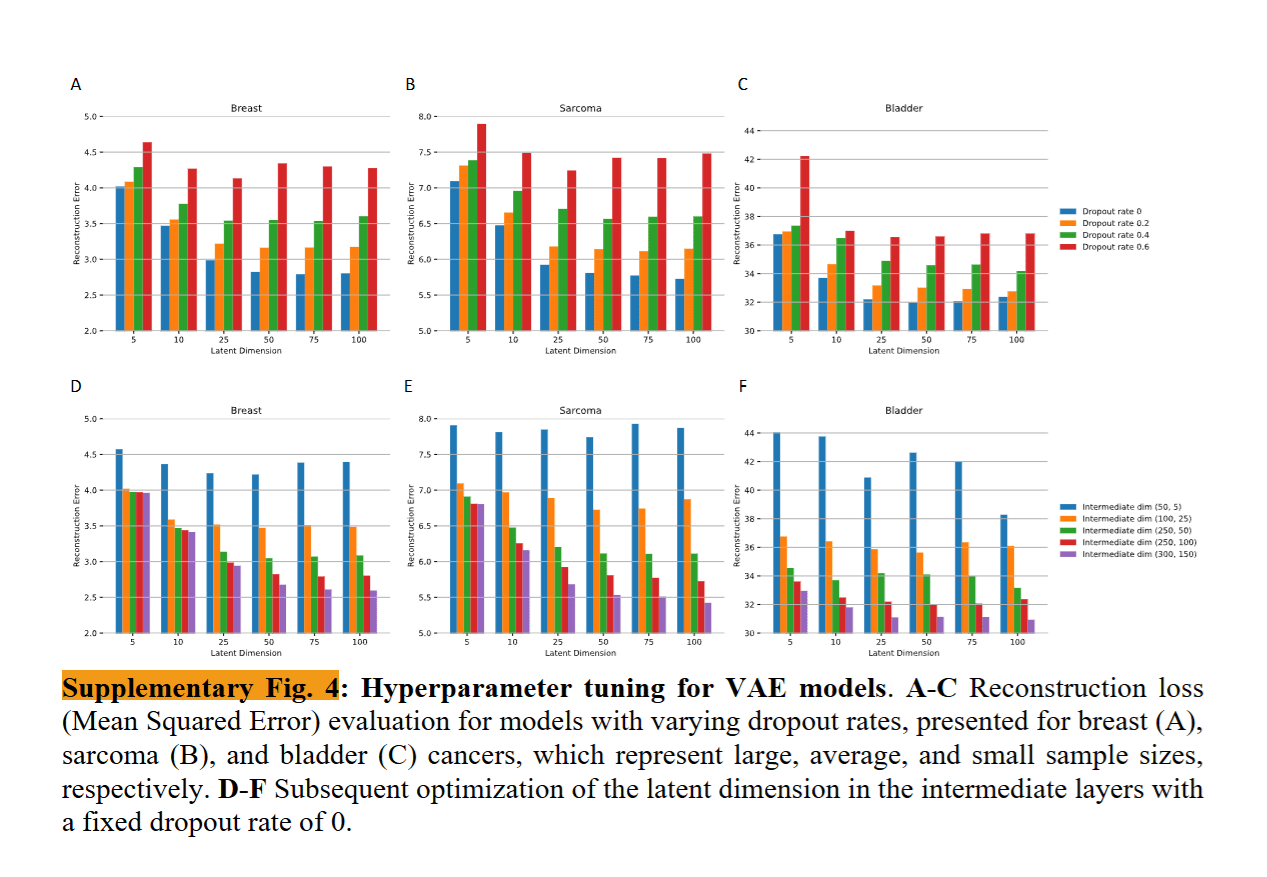
Final Dropout:0
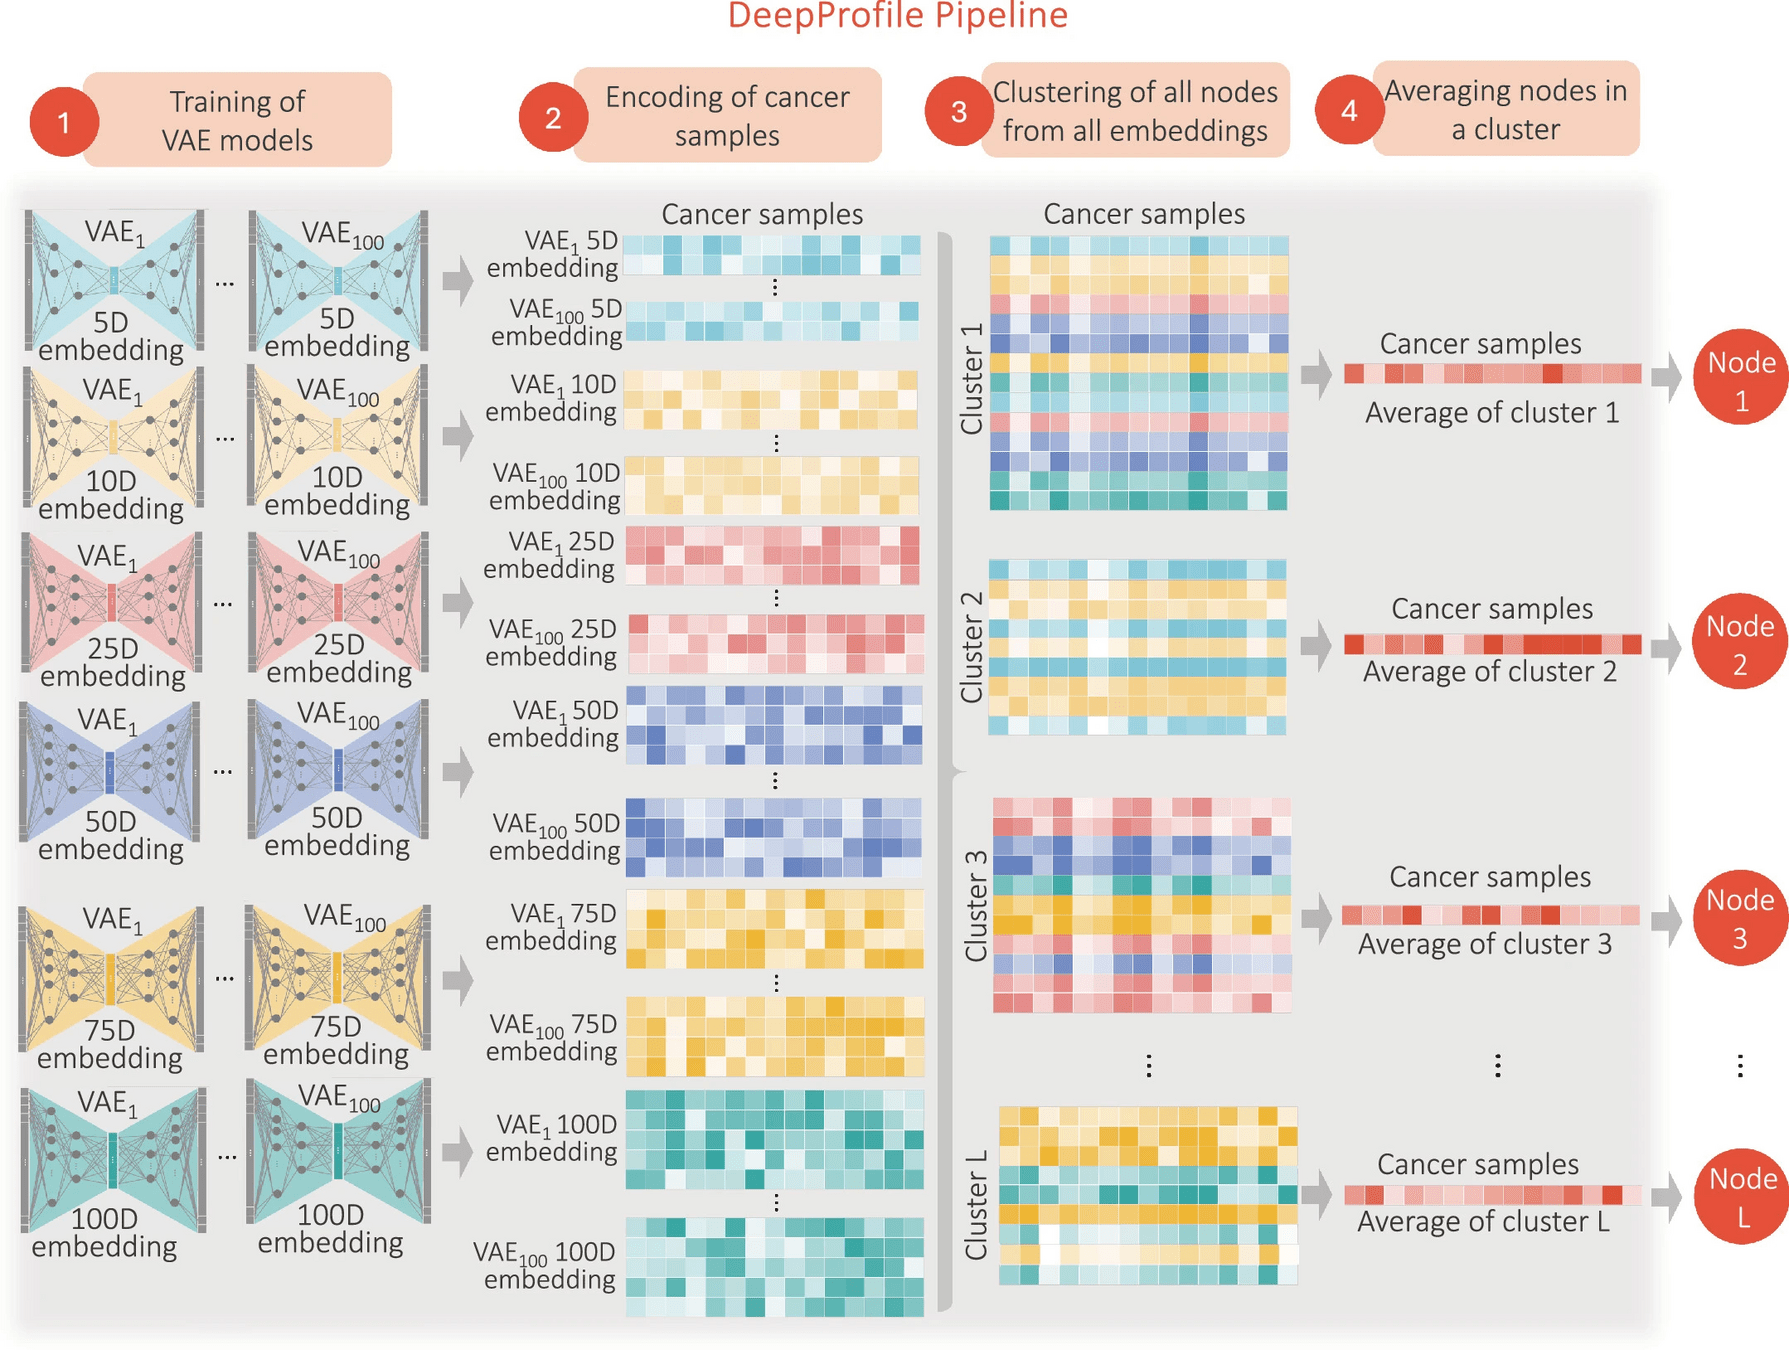
Learning DeepProfile latent variables
Across all |D||R| models, we have |D||R| embeddings and ∑d∈D d|R| latent variables in total (600 embeddings and 26,500 latent variables for our setting).
Note that we disregarded the information about which latent variable came from which model: we simply applied clustering to all latent variables by treating them as independent and identically distributed (i.i.d.). As a result, different latent variables of the same VAE model might be in different clusters as well as in the same cluster.
Finding ensemble embedding per cancer type and took the average number of clusters across 18 cancer types
Gmeans: To find optimal number of clusters before running kmean++
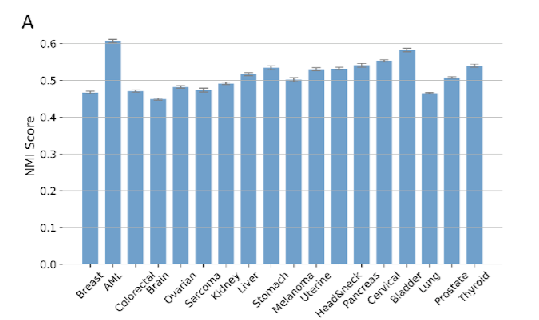
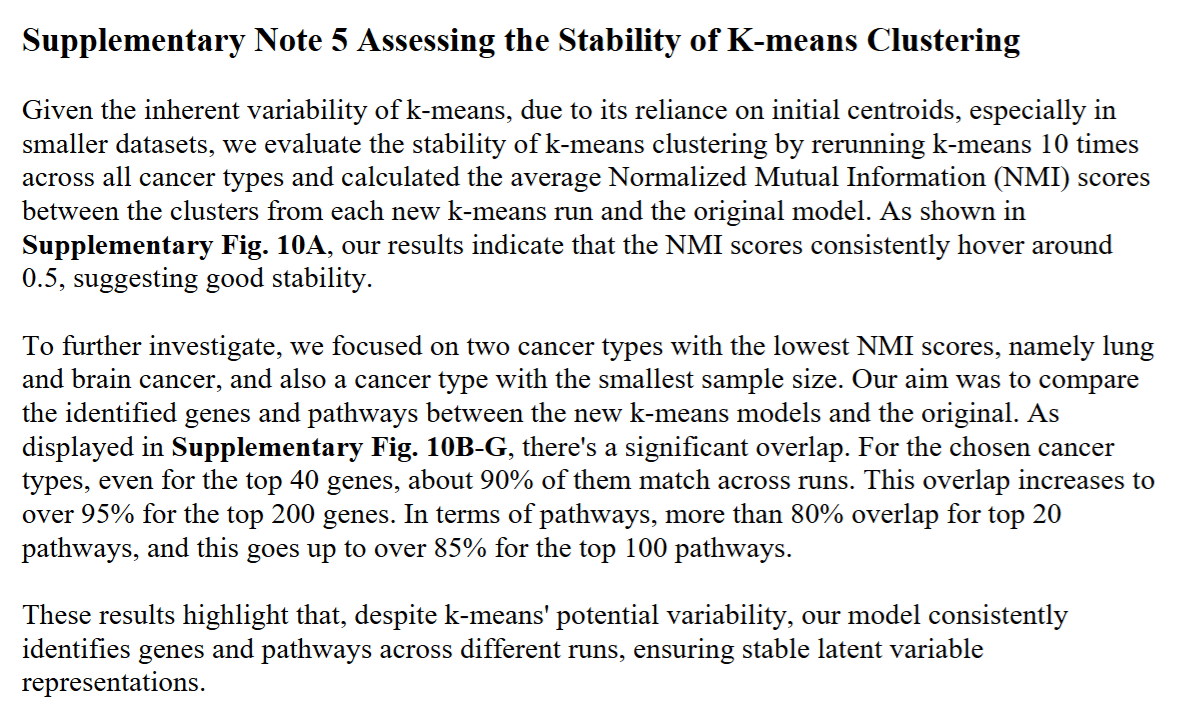
To address the inherent variability in k-means clustering, particularly in initial centroid selection, we performed stability analyses
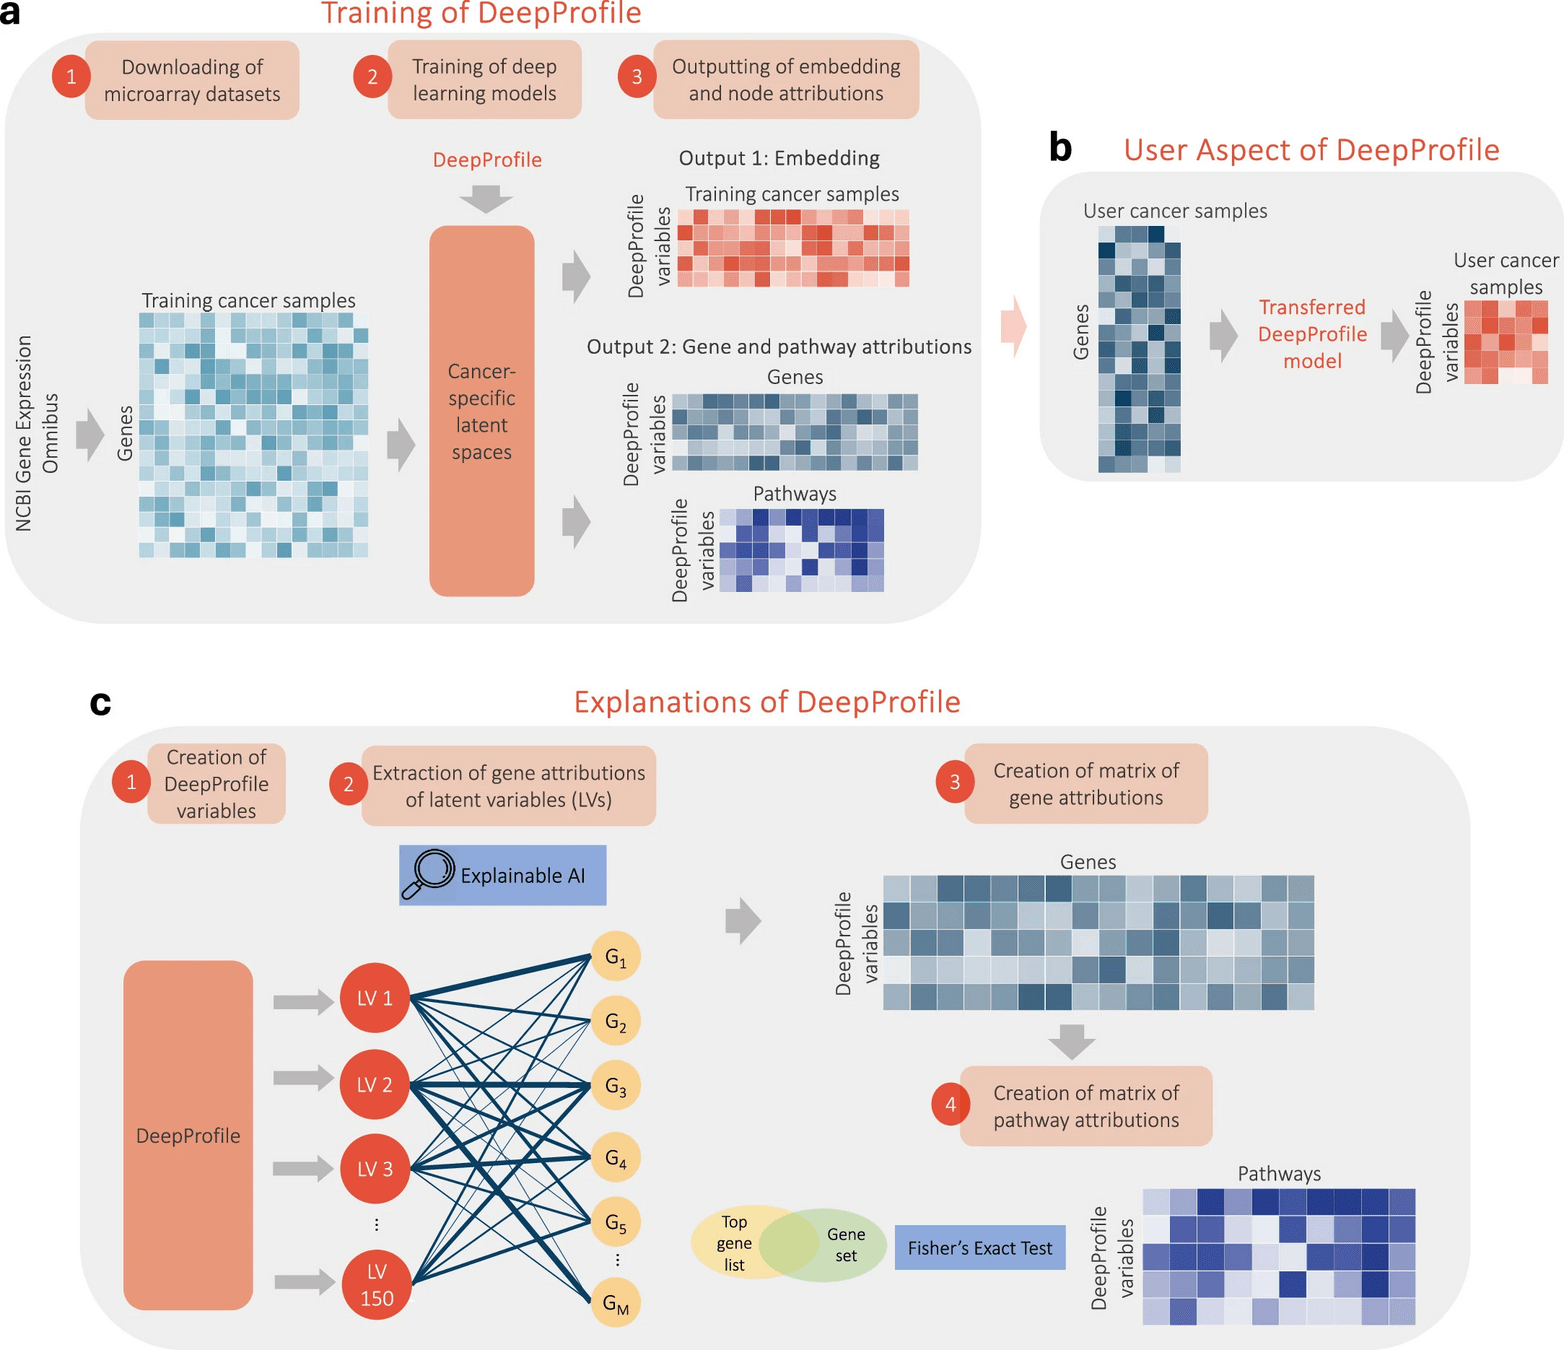
Gene- and pathway-level attributions of DeepProfile latent variables
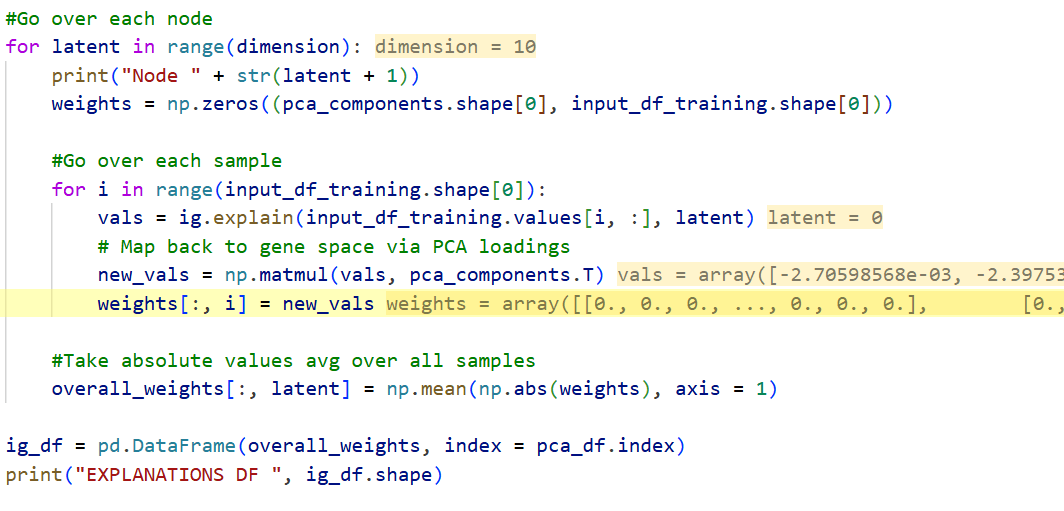
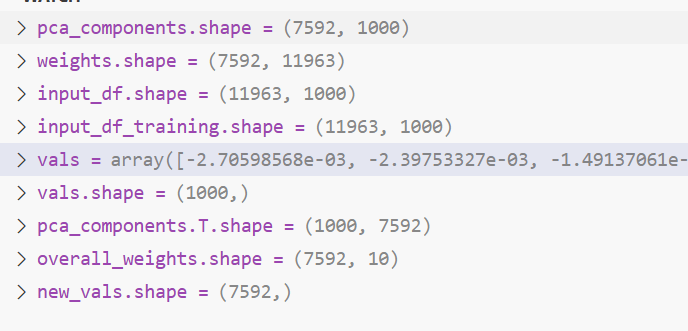
IntegratedGradients: a gradient-based feature attribution method for neural networks, Extended Data Fig. 2c, previous slide
1,077 functional pathways from Reactome93, BioCarta94 and KEGG95 Fisher’s Exact Test’s (FET)98 ‘fisher_exact’ From the gene list for each pathway, we removed the genes that are not present in our input expression matrix and passed the top G genes with the highest importance values for a DeepProfile latent variable to FET, where G is the average pathway length across all 1,077 functional pathways from Reactome, BioCarta and KEGG. For multiple hypothesis correction, we applied Benjamini–Hochberg FDR correction99 across all latent variables, using the ‘multipletests’ function in Python’s ‘statsmodels’ library.
Fisher's Exact Test is a statistical test used to determine if there's a significant association between two categorical variables when sample sizes are small. It's particularly useful when the assumptions for the chi-square test aren't met.
Gene- and pathway-level attributions of DeepProfile latent variables
Comparing DeepProfile to alternative dimensionality-reduction methods
Gaussian random projection: 10 different seeds, 10 different outputs, size 150
PCA: 10 different seeds, size 150
ICA: 10 different seeds, 100000 iterations, size 150
Autoencoder (AE): 10 different seeds, 10 different outputs, 750 latent variables, 1 hidden layer encoder, 1 hidden layer decoder, dropout 0.1, batch size 100, Adam optimizer (lr=0.0005), tuned with 5-fold CV on reconstruction error, inputs = top principal components of preprocessed gene-expression levels, implemented in Keras (TensorFlow backend).
Denoising Autoencoder (DAE): 10 different seeds, 10 different outputs, noise added to inputs, 750 latent variables, 1 hidden layer encoder, 1 hidden layer decoder, dropout 0.1, batch size 100, Adam optimizer (lr=0.0005), tuned with 5-fold CV on reconstruction error, inputs = preprocessed gene-expression levels, implemented in Keras (TensorFlow backend).
Creating TCGA RNA-seq embeddings
TCGA RSEM normalized log2-transformed RNA-seq expression matrices
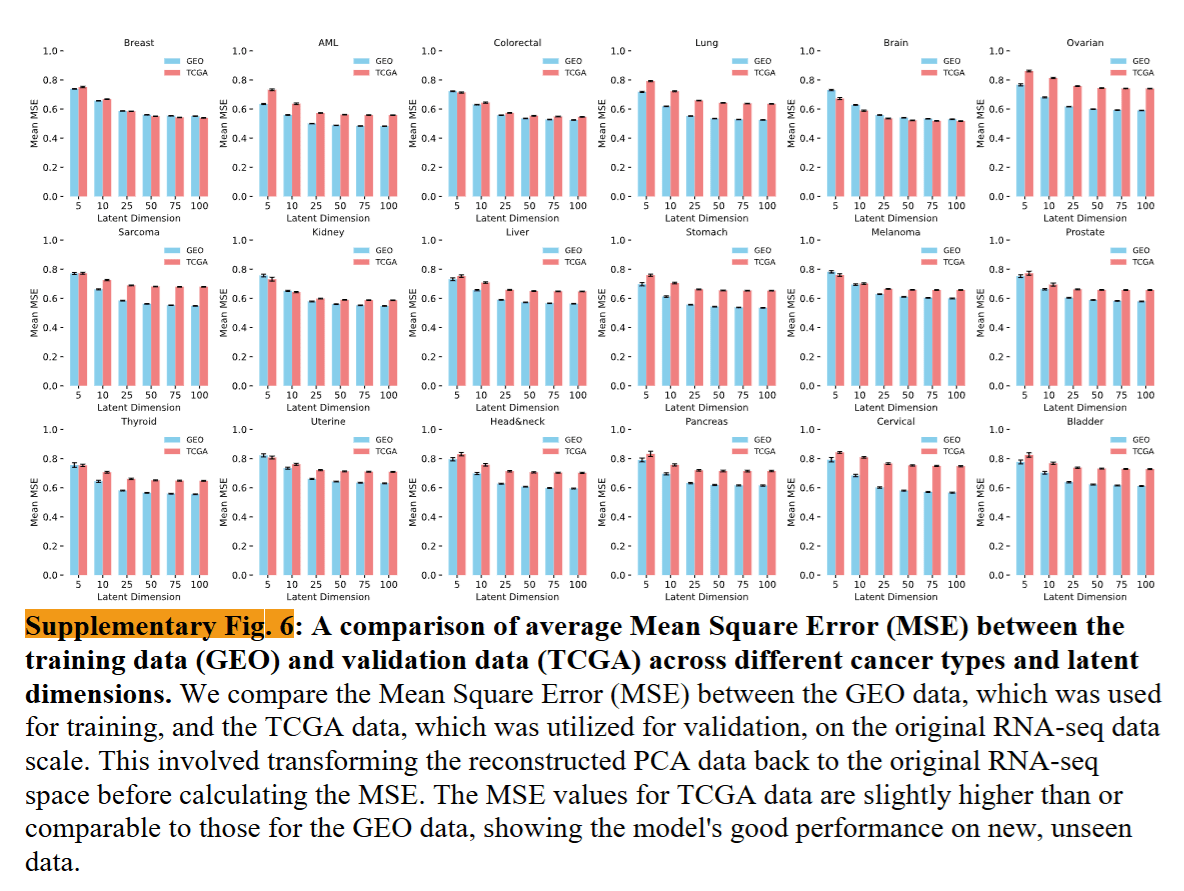
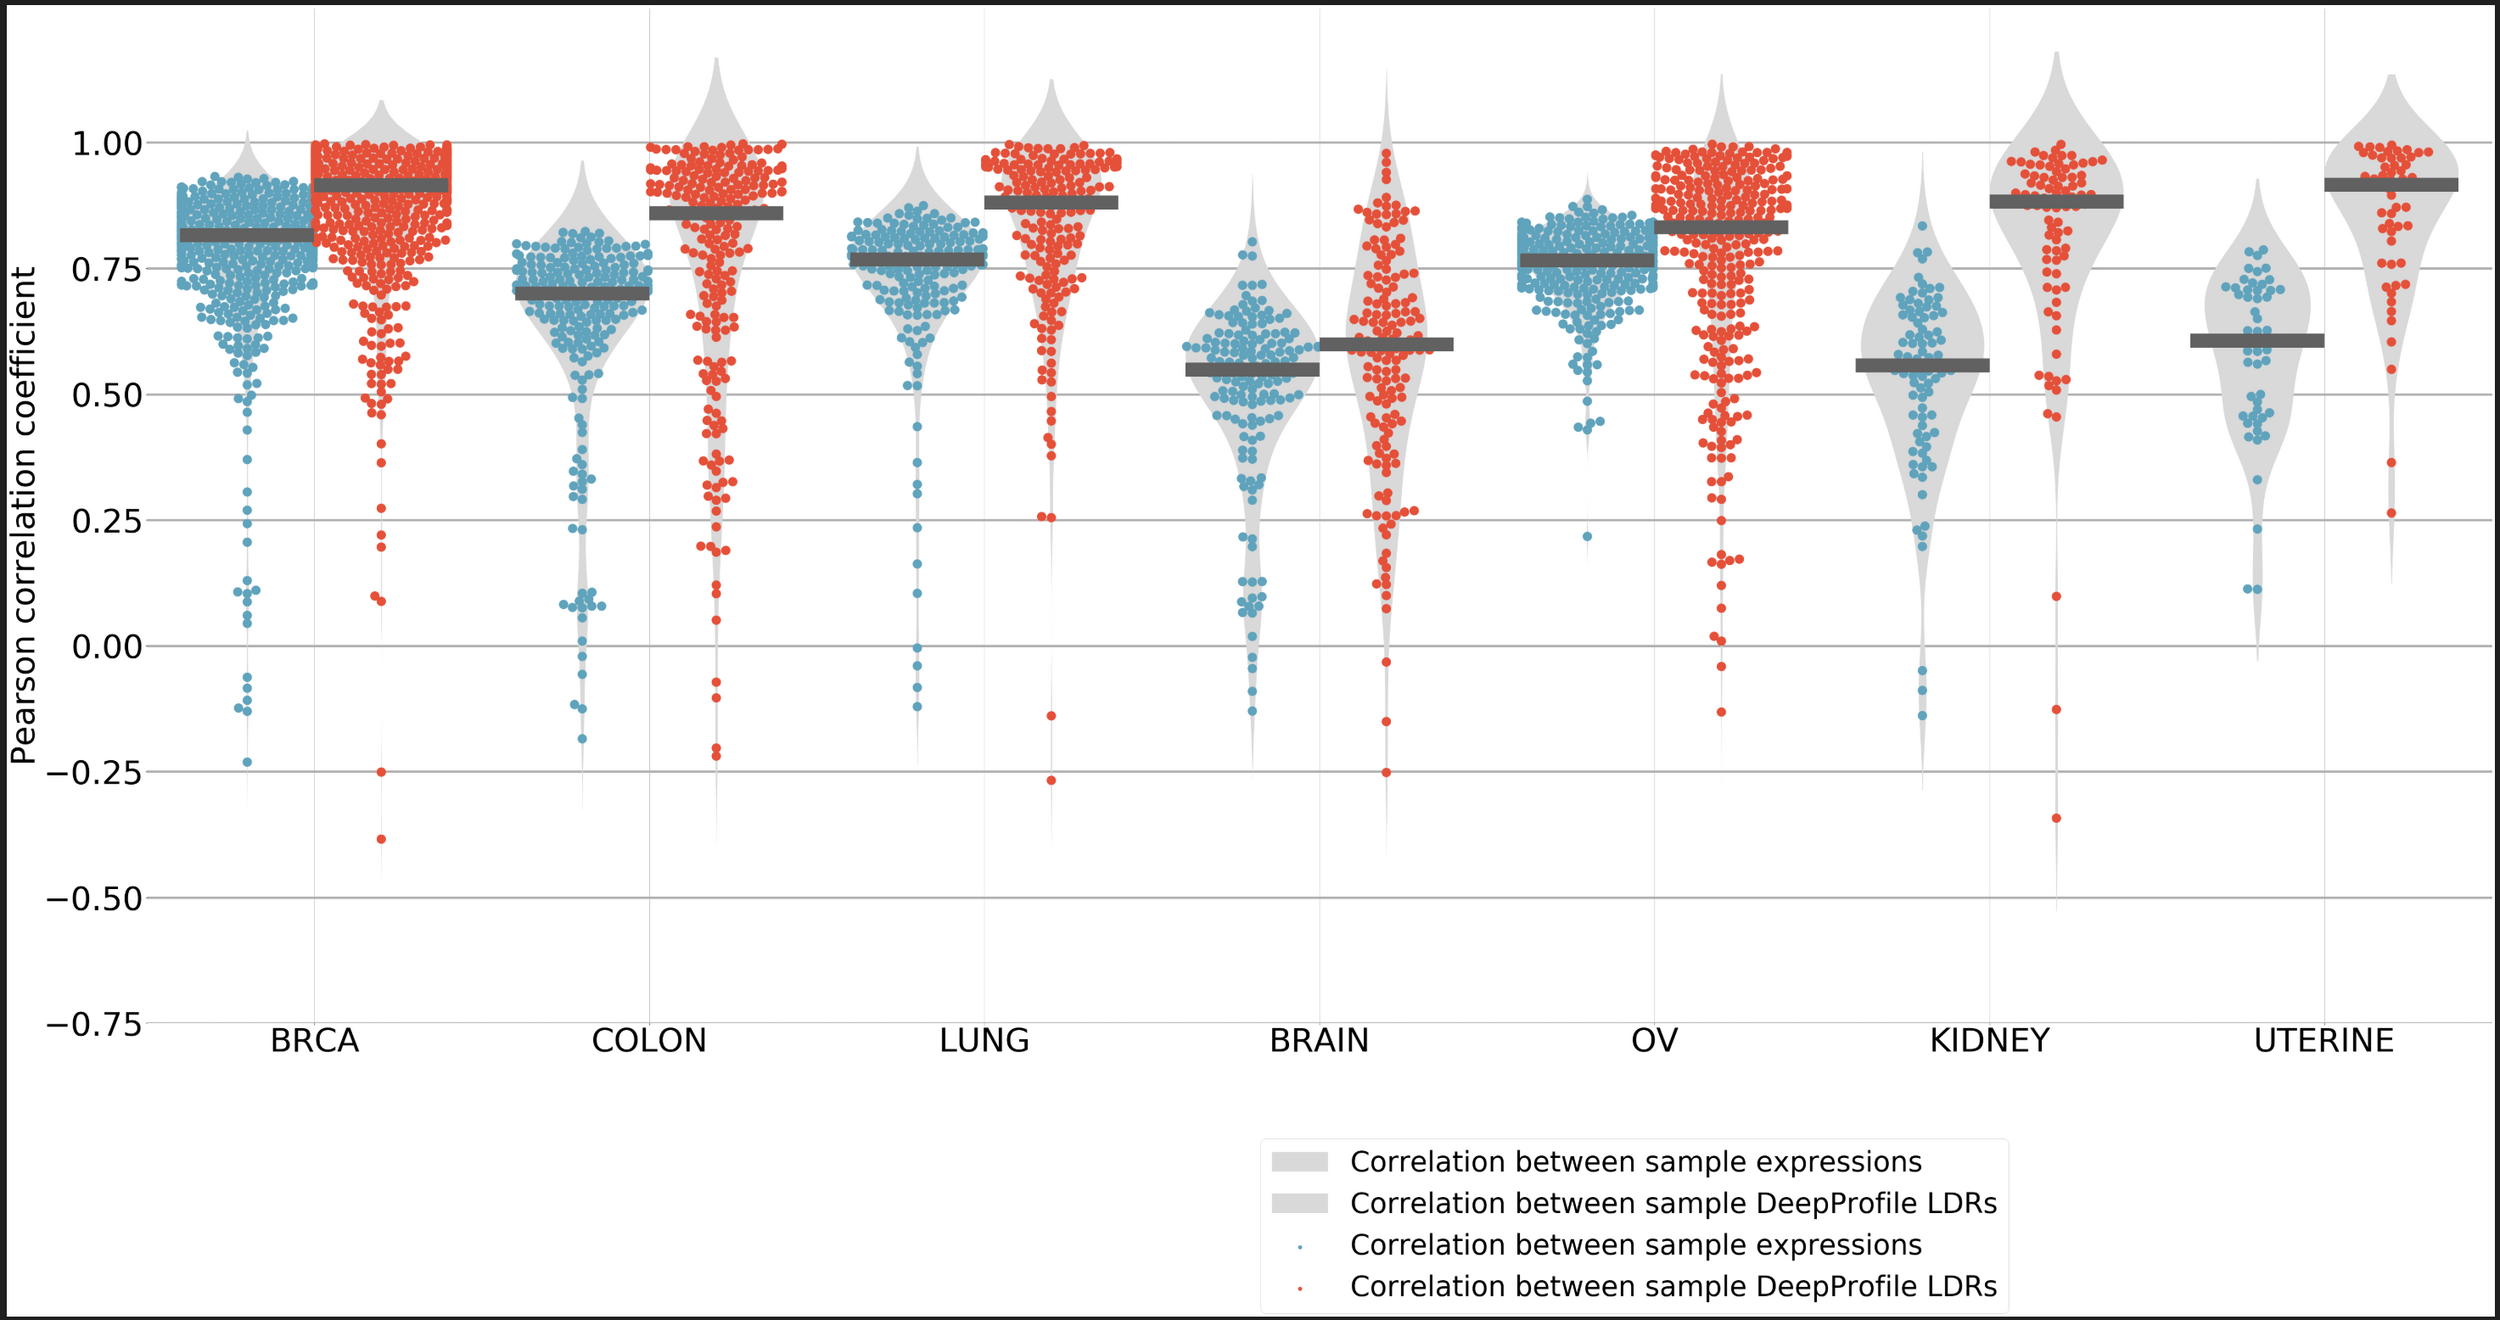
Comparison of DeepProfile microarray and RNA-seq embeddings
Took embedding for mrna seq and microarray and found the correlation between them.
Comparing DeepProfile pathway coverage to alternative dimensionality-reduction methods
Comparing DeepProfile pathway coverage to VAE models
FDR = False Discovery Rate
Pan-cancer survival and mutation analysis
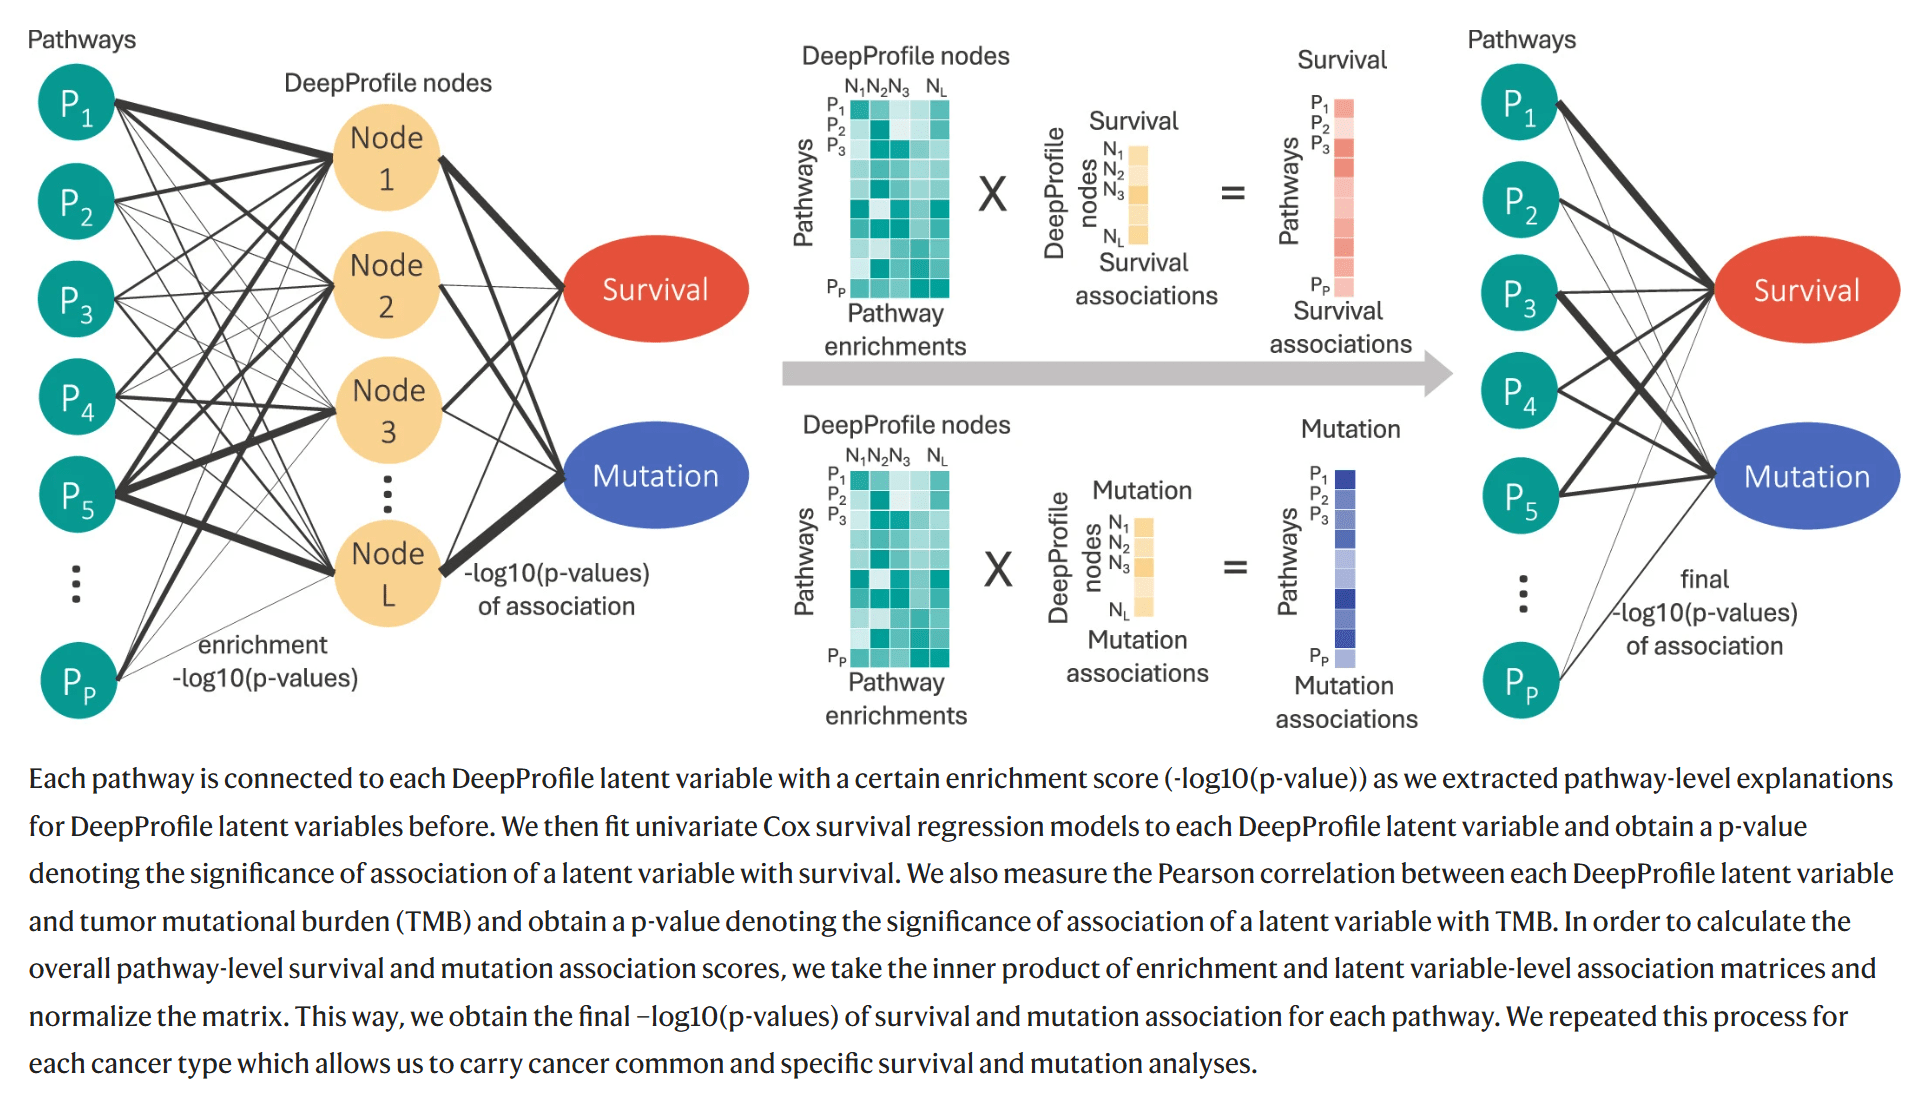
Downstream survival analysis
Downstream or follow-up analysis
Pathways play a role in patient prognosis
DeepProfile: Deep profiling of gene expression across 18 human cancers
By Sachin Kumar


