


Rositsa Zlateva
Full Stack Python Developer and lecturer
The speed at which a computer operates, either theoretically during a benchmart test. The benchmark test usually involves some combination of work that attempts to imitate the kinds of work the computer does during actual use. Sometimes performance is expressed for each of several different benchmarks.
The total effectiveness of a computer system, including throughput, individual response time , and availability.
Involves both developers and database administrators (DBAs) to determine current performance and make changes to improve the performances of the same.
Other applications should not be in active state other than the ones that are required for testing purposes.
The SW and HW components should be in-line with the specifications of the production environment.
ncalls - the number of calls
tottime - the total time spent in the given function ( excluding time made in calls to sub-functions)
percall - is the quotient of tottime divided by ncalls
cumtime - is the cumulative time spent in this and all subfunctions (from invocation till exit).
percall - is the quotient of cumtime divided by primitive calls
filename:lineno - provides the respective data of each function
Returned data
python -m cProfile [-o output_file] [-s sort_order] myscript.pyfrom cProfile import Profile
profiler = Profile()
profiler.runcall(self._handle, *args, **options)
# profiler.run(self._handle, 'output')
profiler.print_stats() from memory_profiler import profile
@profile(precision=4)
def my_func():
a = [1] * (10 ** 6)
b = [2] * (2 * 10 ** 7)
del b
def _inner(a):
a *= 5
_inner(a)
return a
if __name__ == '__main__':
my_func()
Line #    Mem usage    Increment   Line Contents
================================================
     3  30.9102 MiB   0.0000 MiB   @profile(precision=4)
     4                             def my_func():
     5  38.5508 MiB   7.6406 MiB       a = [1] * (10 ** 6)
     6 191.1445 MiB 152.5938 MiB       b = [2] * (2 * 10 ** 7)
     7  38.5547 MiB -152.5898 MiB       del b
     8  38.5547 MiB   0.0000 MiB       def _inner(a):
     9  69.6445 MiB  31.0898 MiB           a *= 5
    10  69.6445 MiB   0.0000 MiB       _inner(a)
    11  69.6445 MiB   0.0000 MiB       return a
python -m memory_profiler profile_example.py
from memory_profiler import profile

@profile
def my_func():
    a = 'Roza'
    a = a * 55
    b = [2] * (2 * 10 ** 7)
    del b
    return a

if __name__ == '__main__':
    my_func()
python profile_example.py
Line #    Mem usage    Increment   Line Contents
================================================
     3     30.8 MiB      0.0 MiB   @profile
     4                             def my_func():
     5     30.8 MiB      0.0 MiB       a = 'Roza'
     6     30.9 MiB      0.0 MiB       a = a * 55
     7    183.4 MiB    152.6 MiB       b = [2] * (2 * 10 ** 7)
     8     30.9 MiB   -152.6 MiB       del b
     9     30.9 MiB      0.0 MiB       return a
import time
from memory_profiler import memory_usage

def f(a, n=101):
    time.sleep(2)
    b = [a] * n
    time.sleep(1)
    return b

print(memory_usage((f, (1,), {'n' : int(1e6)}))) # f - what we call, 1 - interval, n - the whole time
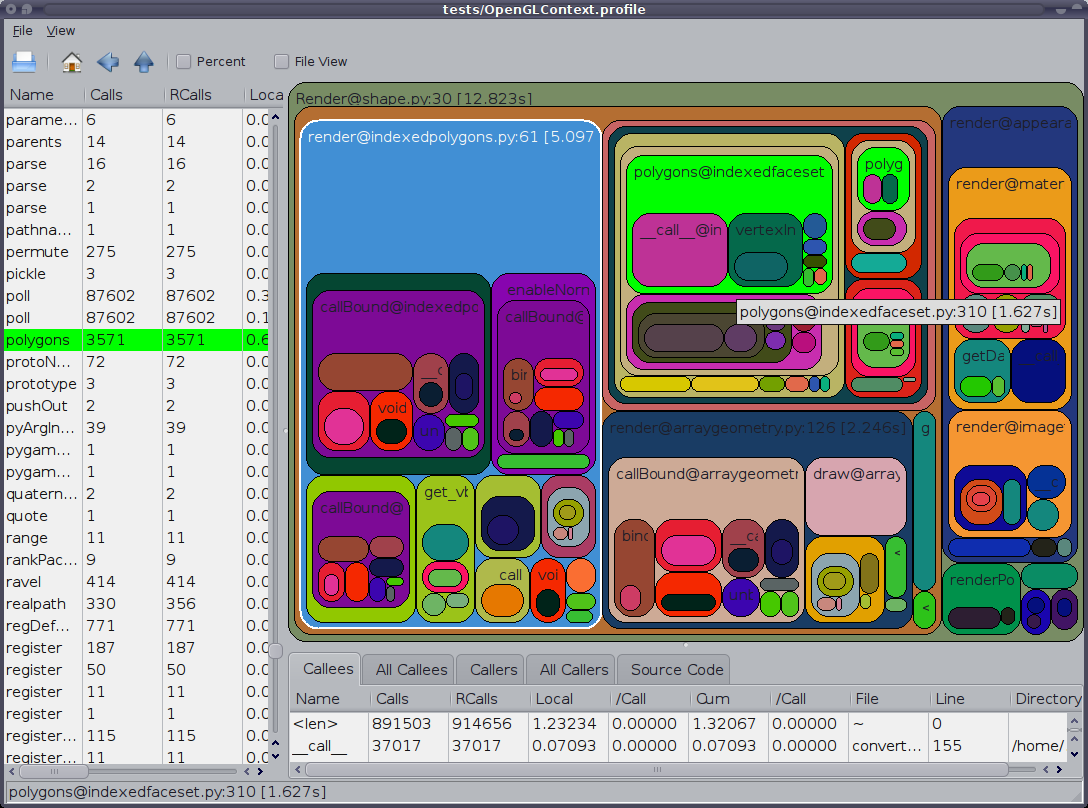
SnakeViz
RunSnakeRun
"First make it work,
then make it right,
then make it fast & small."
Kent Beck
Thank you for the attention!
By Rositsa Zlateva


