


Rob Purser
Development Manager for IoT and Hardware Interfacing for MATLAB at MathWorks. Leads the creation of software that connects MATLAB with the real world
Tutorial Worksheet
Tutorial Worksheet
Tutorial Worksheet
The open IoT Platform with MATLAB® Analytics
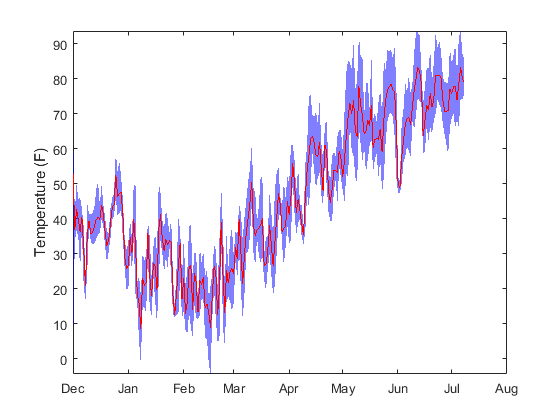
Analyze
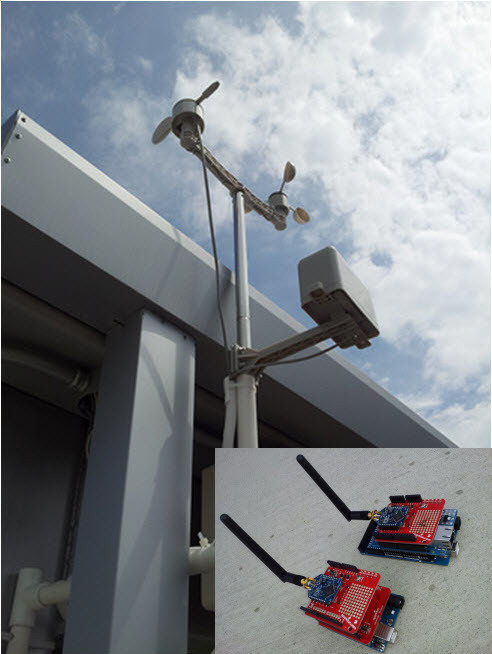
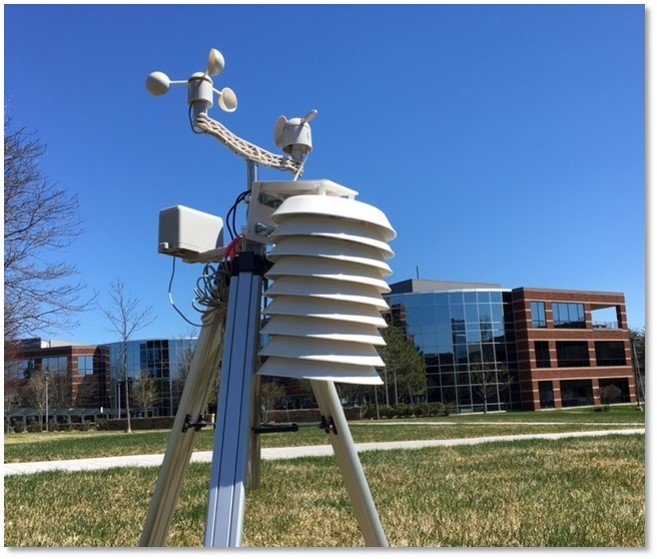
Collect
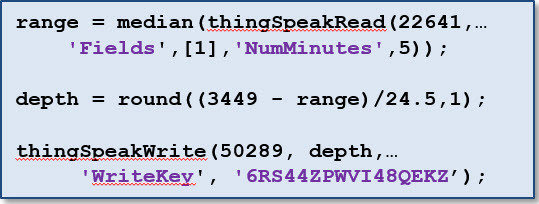
Act
Tutorial Worksheet
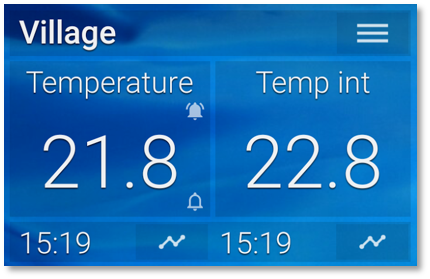
Live environmental data from the room
https://thingspeak.com/channels/132207
Gallery of live weather analysis
https://thingspeak.com/channels/52682
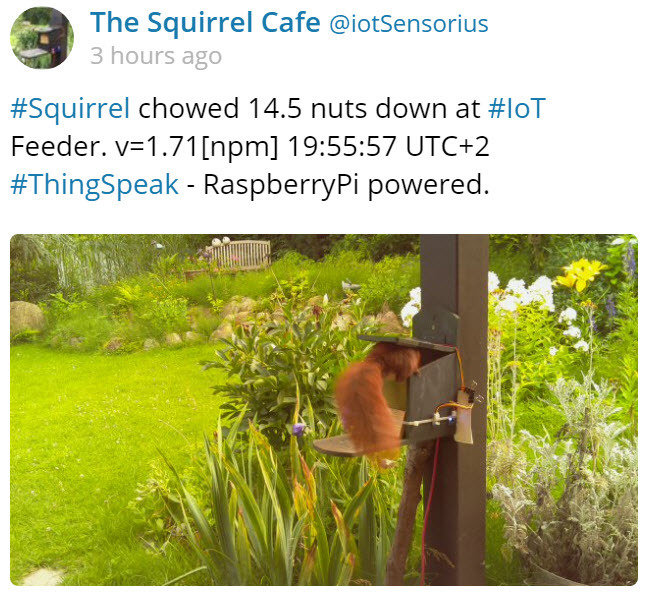
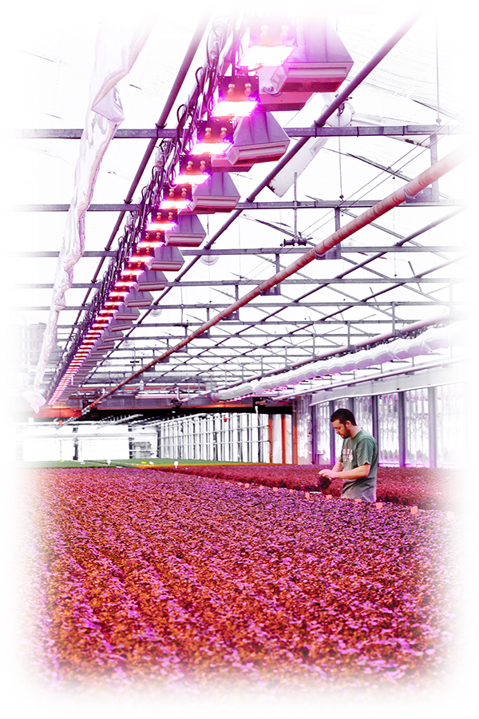
Live agricultural analysis data
https://thingspeak.com/channels/30040
Custom Live Data Dashboard
http://community.thingspeak.com/demo
Tutorial Worksheet
Tutorial Worksheet
Tutorial Worksheet
Set up your ThingSpeak account
Tutorial Worksheet
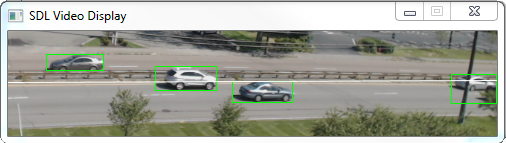
Summarize one day of data from the car counter
In the "MATLAB Code" section, enter the code below:
% Get the latest readings from the car counter
disp('Latest readings from the car counter')
thingSpeakRead(38629)
Tutorial Worksheet
Summarize one day of data the car counter
Erase your old code and enter the following:
% Get data from the last 24 hours
rte9Data = thingSpeakRead(38629,'NumDays',1,'OutputFormat','table');
% Calculate the median number of east bound cars in the past day
disp('Median number of east bound cars in the past day') median(rte9Data.NumberOfEastboundCars)
Tutorial Worksheet
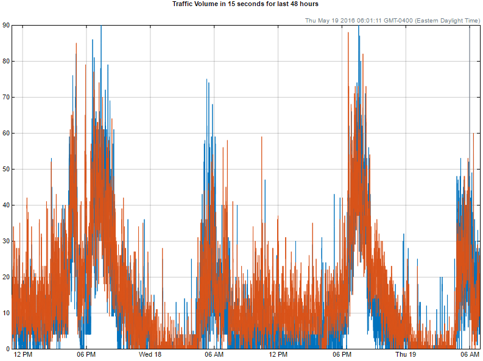
Plot hourly rates over the course of a day
% Get data from the last 24 hours
rte9Data = thingSpeakRead(38629,'NumDays',1,'OutputFormat','table');
% Group the data by hour of day, and sum readings within each hour
hourOfDay = floor(hours(timeofday(rte9Data.Timestamps)));
[G, hourOfDay] = findgroups(hourOfDay);
eastBound = splitapply(@sum, rte9Data.NumberOfEastboundCars, G);
% Plot the east bound volume by hour
plot(hourOfDay, eastBound)
% Feel free to customize the title
title('East bound hourly traffic volume')
Tutorial Worksheet
Tutorial Worksheet
By Rob Purser
The Internet of Things typically involves a discussion of smart devices and the cloud, with much less attention paid to the data collection, pre-processing of acquired data, and development of real-time analytics algorithms. A successful data analytics strategy involves embedded sensor analytics, historical data analysis, and online analytics. In this hands-on session, each participant will work with devices and try out the various types of analytics in action.


