DATAVISUALISATIE
The human mind processes visual information 60,000 times faster than text and 83% of human learning is visual, as opposed to auditory or verbal.
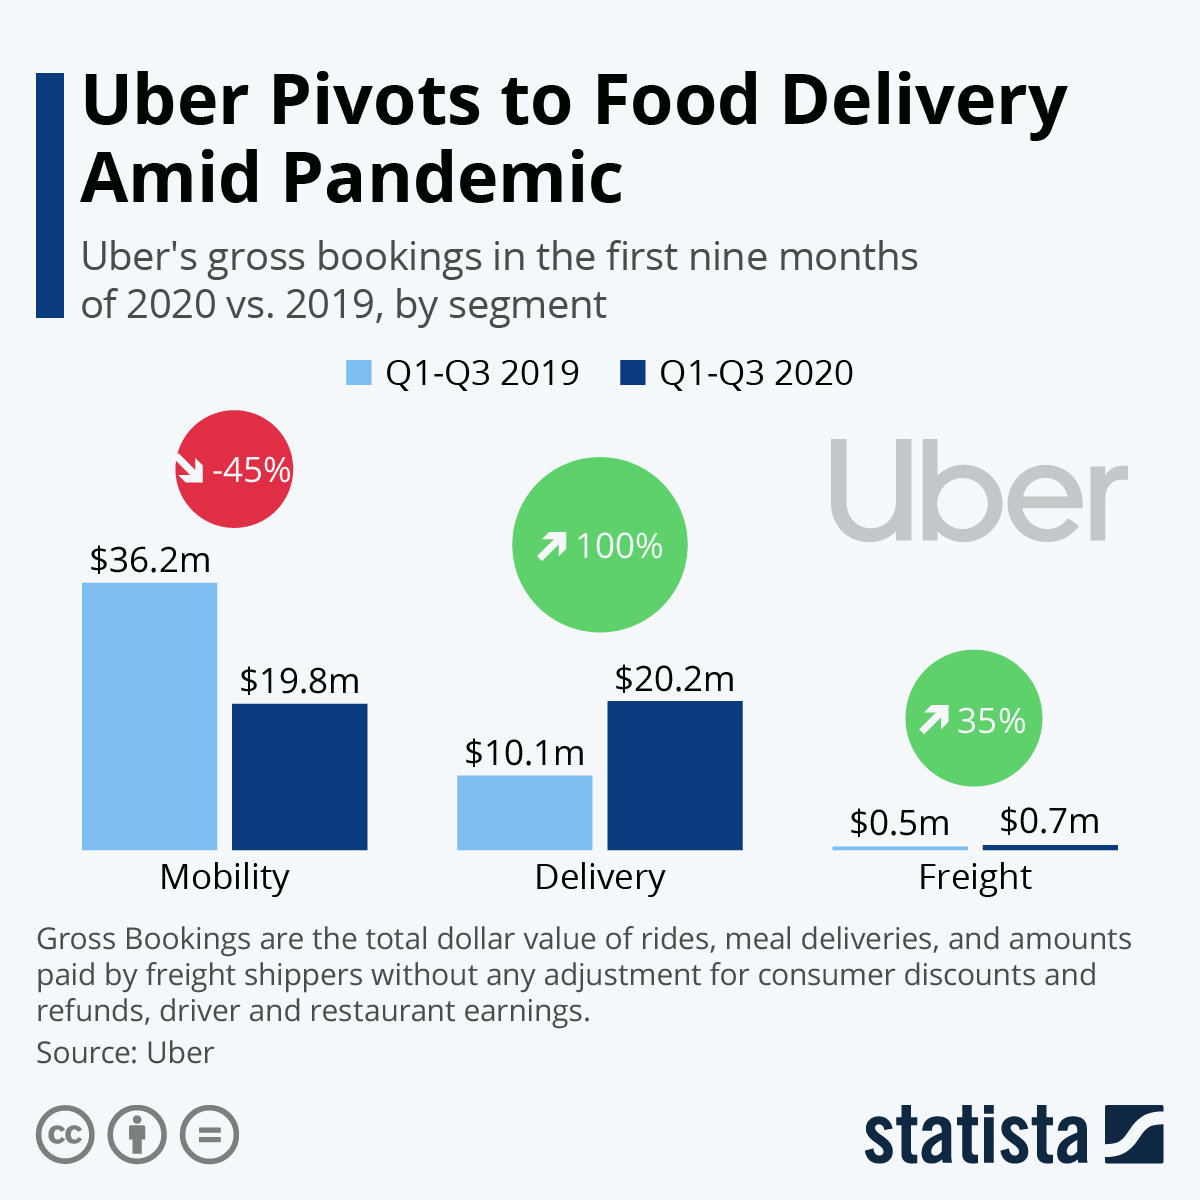
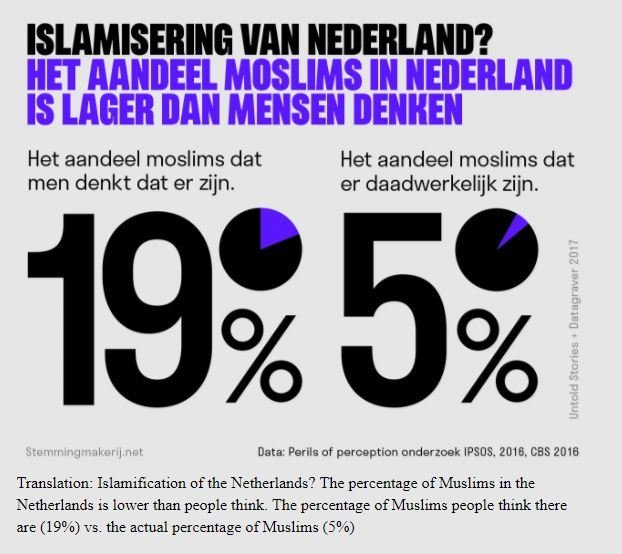
COLOUR
does matter
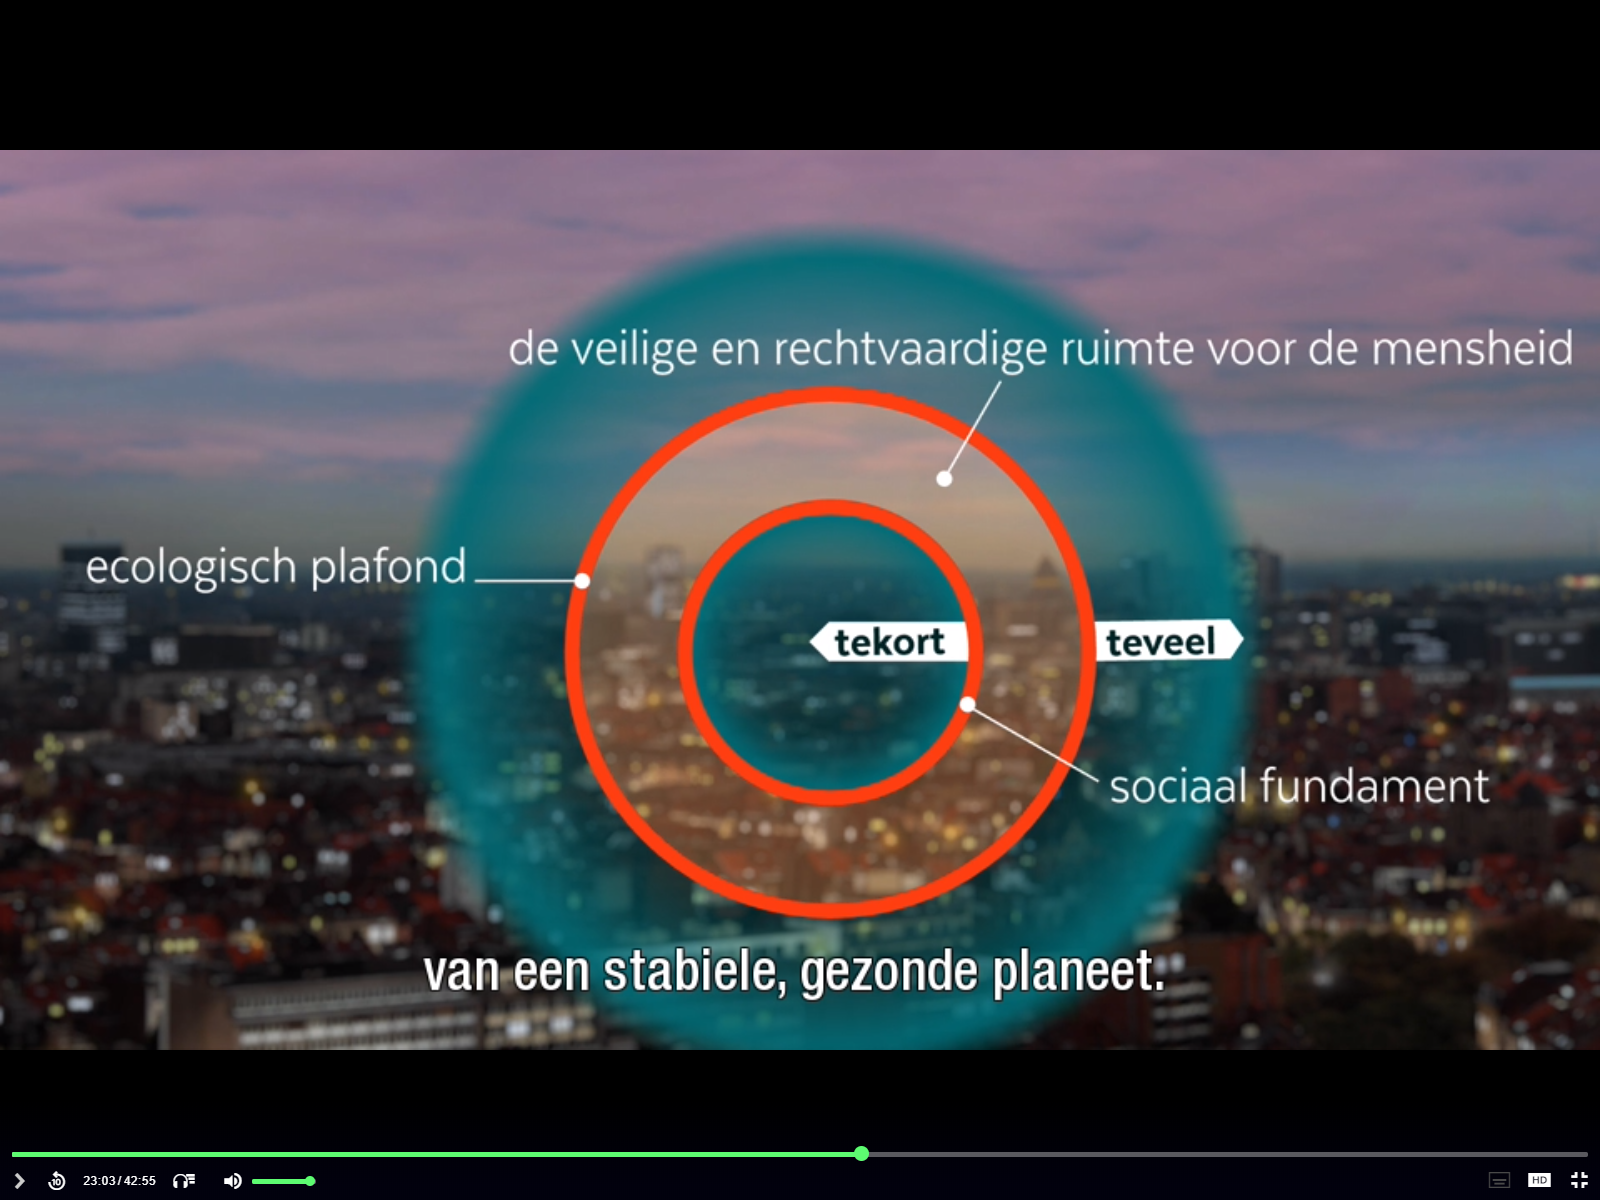
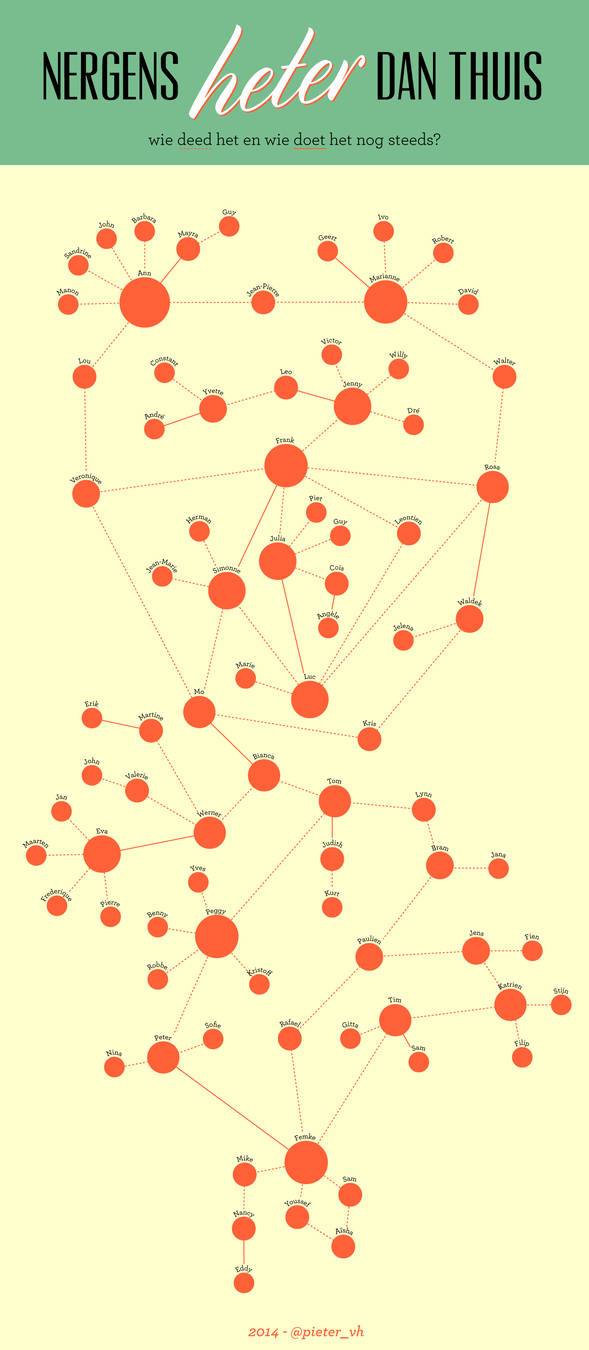
SIZE
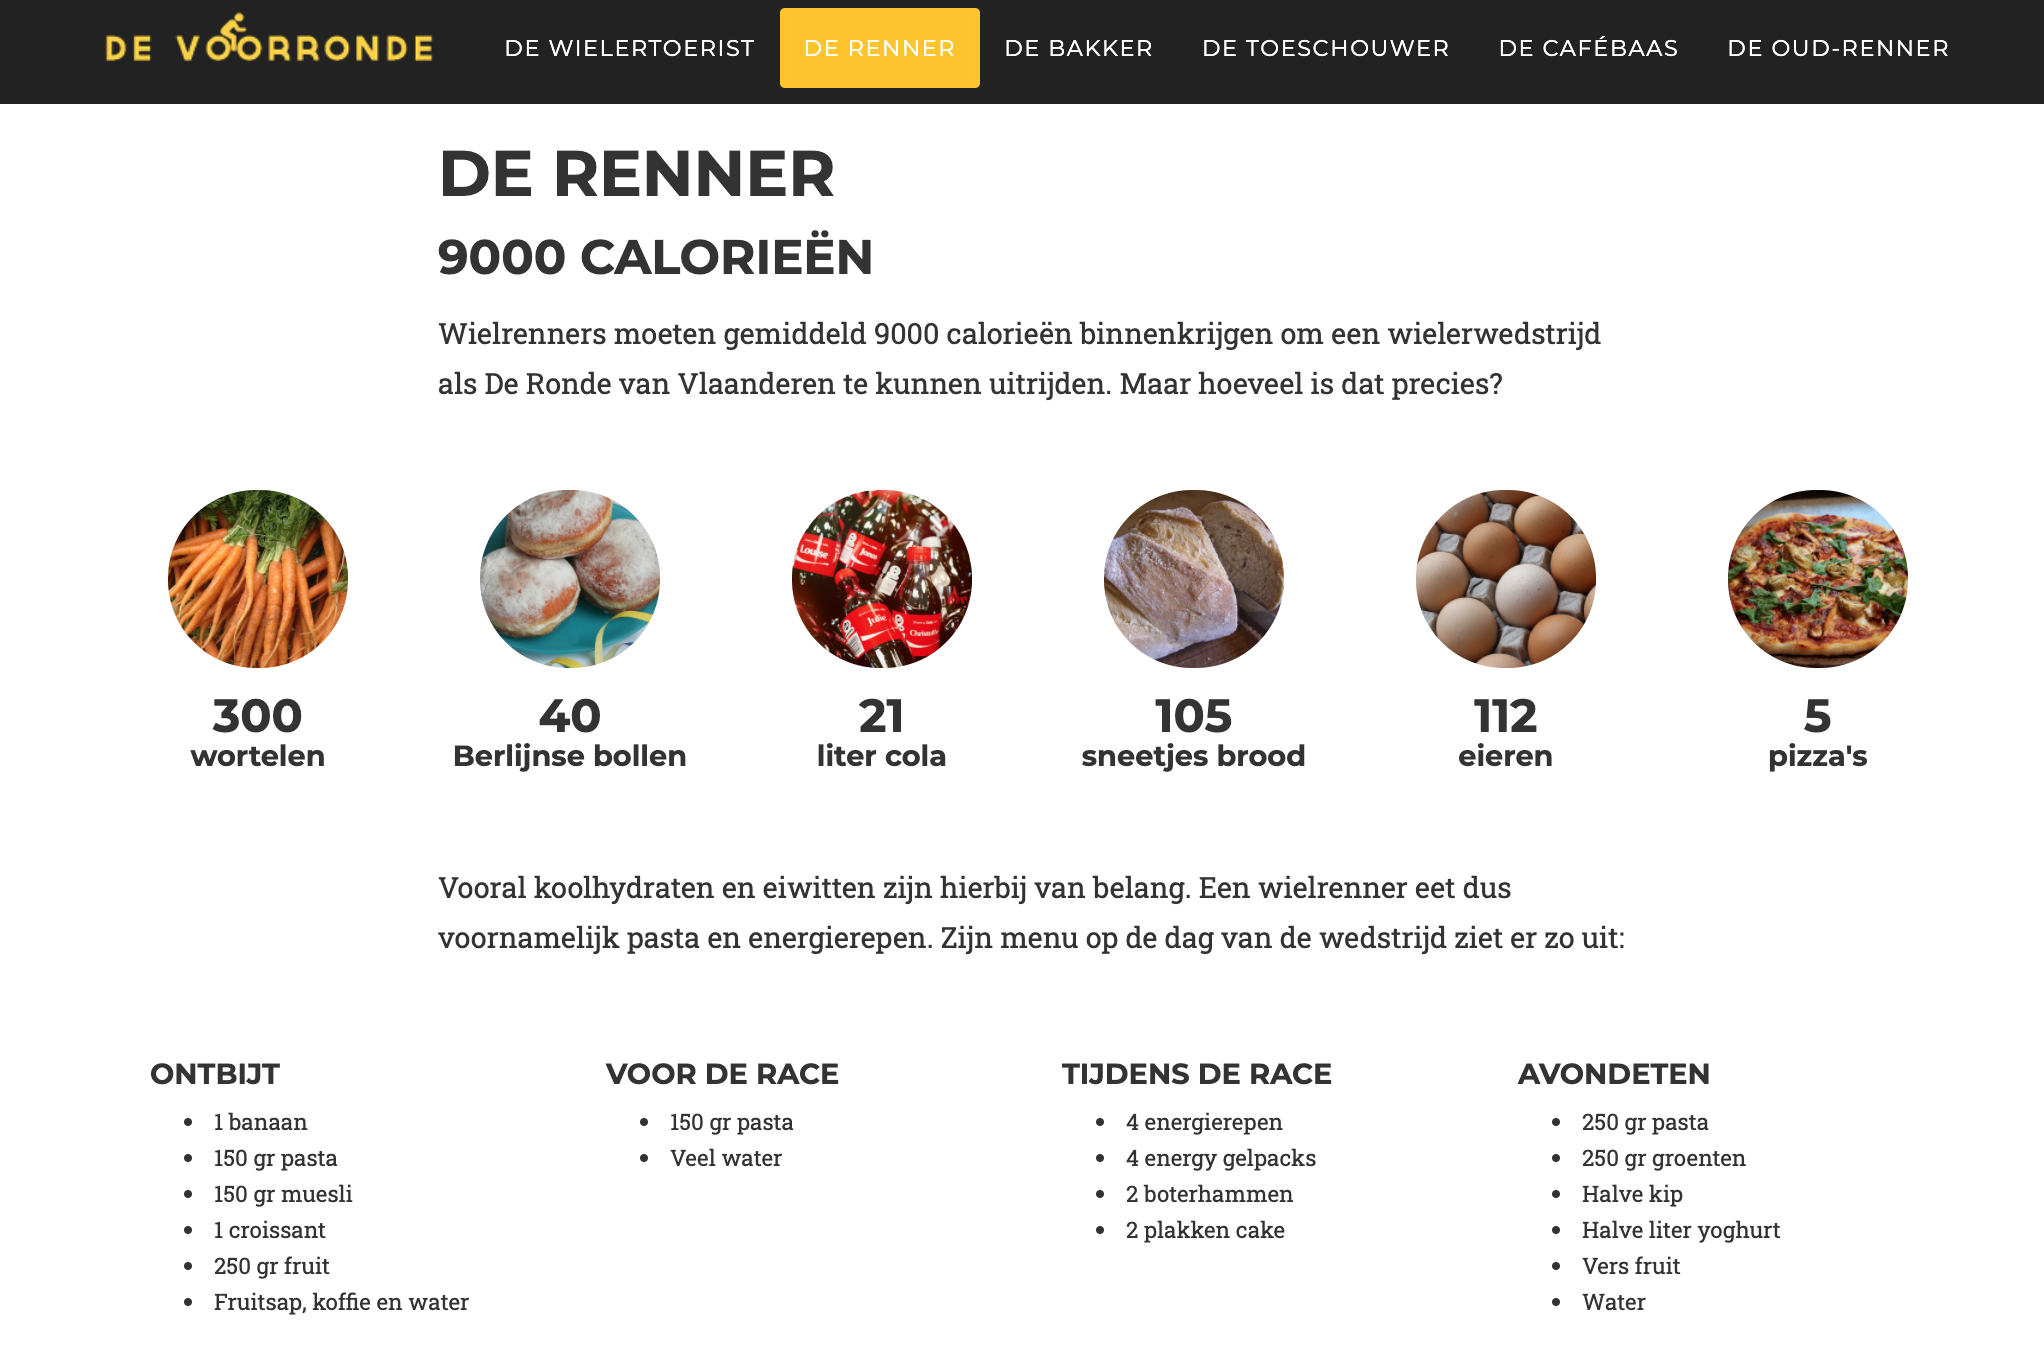
people don't like numbers
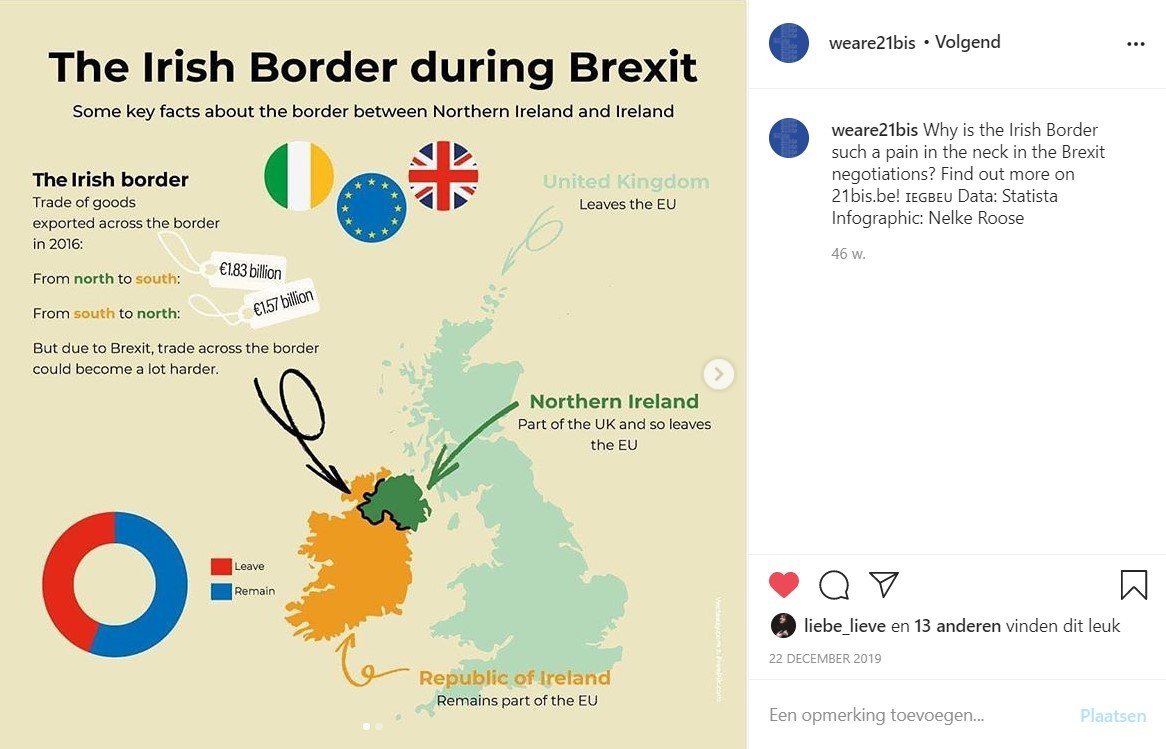
STORYTELLING
the logic of a headline
Validiteit van gebruikelijke medische procedures (gebaseerd op Meyer, Finn 2001)
of
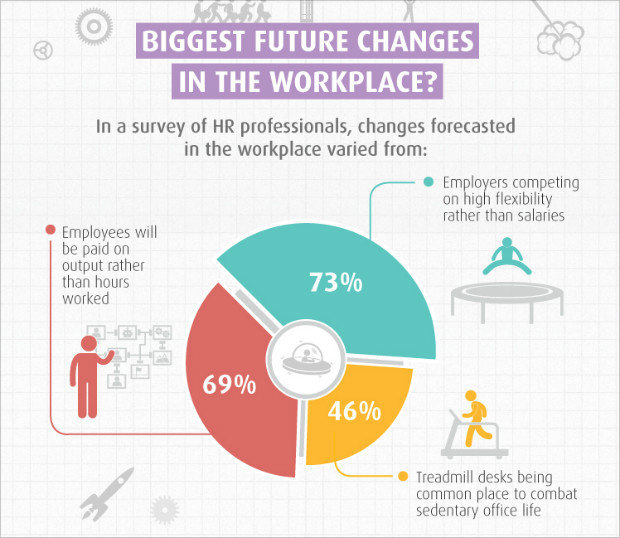
Waar werknemers en werkgevers willen aan werken
of
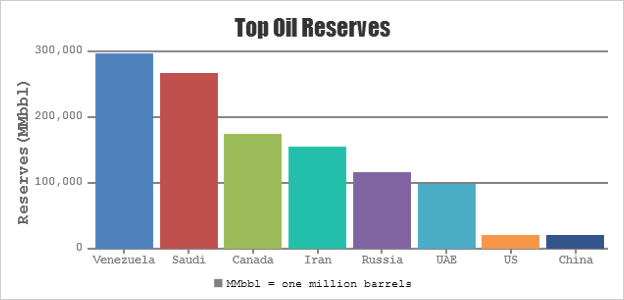
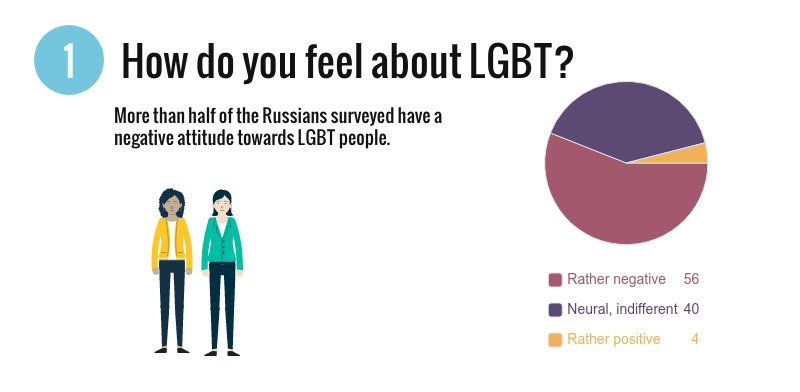
Top 5 health concerns
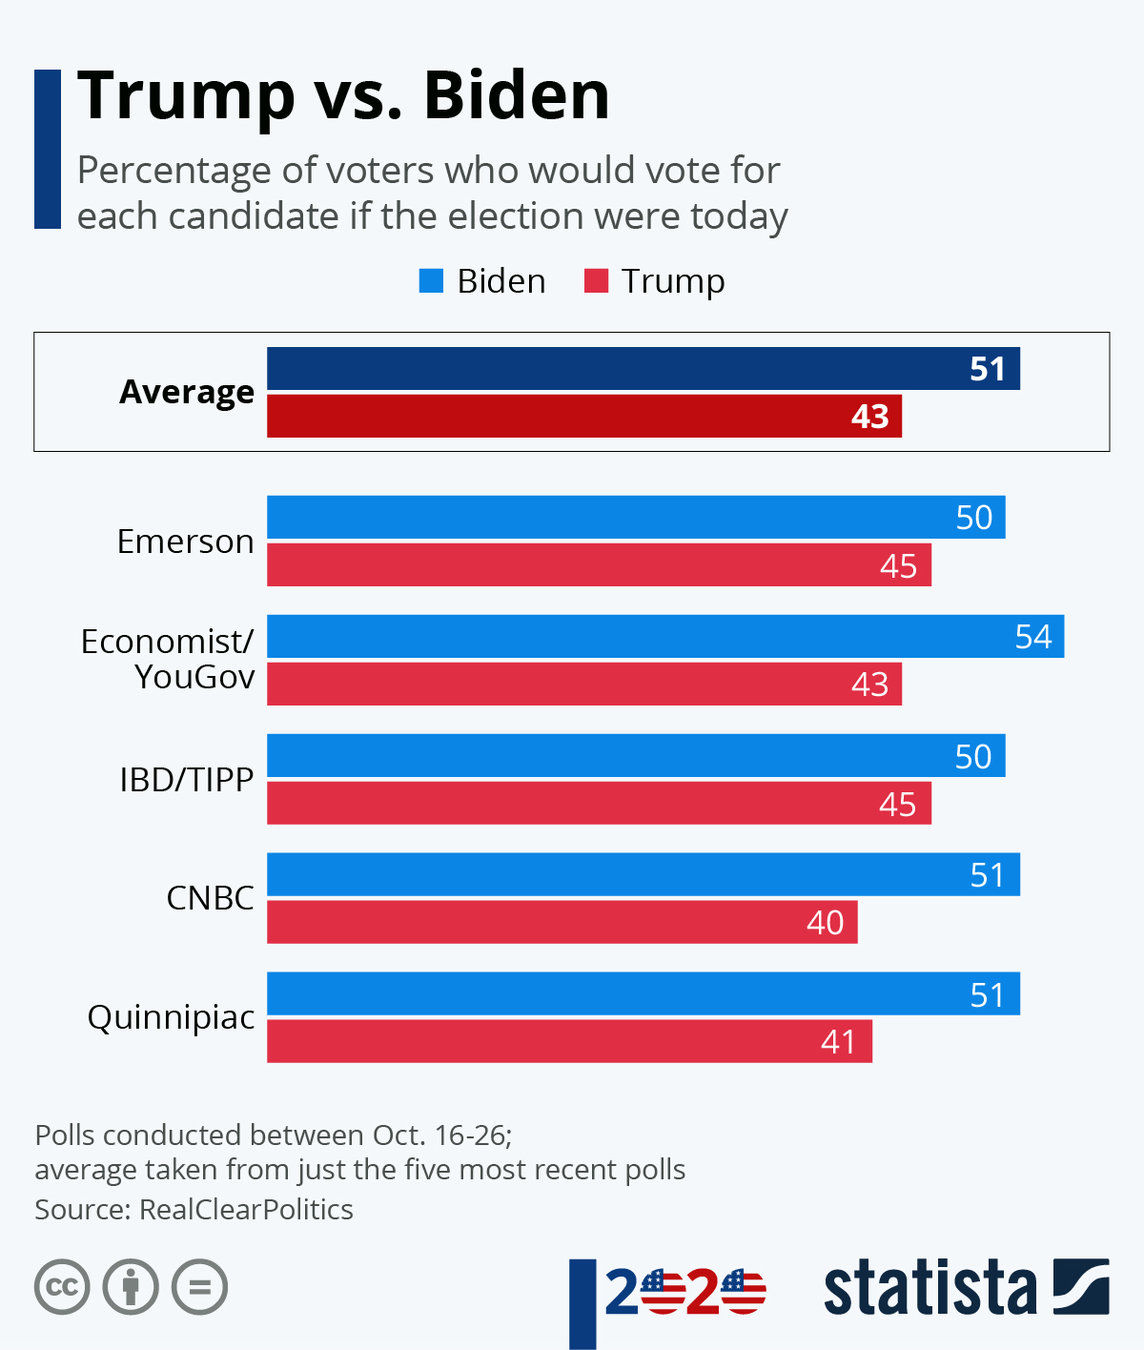
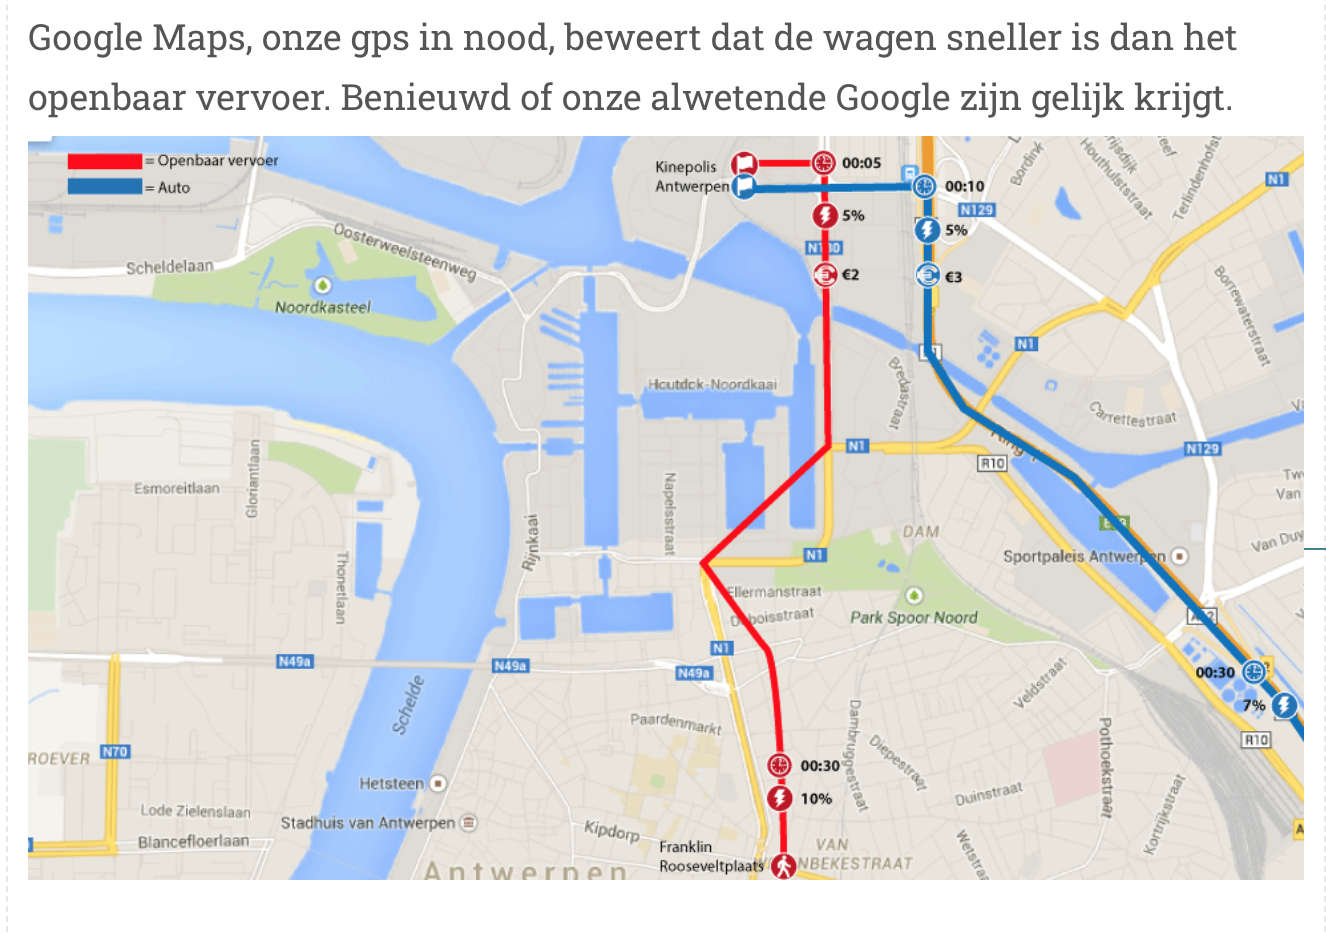
MISTAKES
2. het foute type
To choose the right type of chart, just ask yourself if you want to:
-
Compare values:
- Bar chart
- Line chart
-
Show the individual parts that make up a whole:
- Pie chart
- Stacked bar
- Stacked column
-
Understand how the data is distributed:
- Scatter plot
- Line chart
- Bar chart
-
Analyze trends:
- Line chart
- Bar chart
-
Comprehend the relationship between data sets:
- Line chart
- Scatter plot
- Bubble chart
2. te veel data
copy paste data <> orden info

3. visueel niet consistent
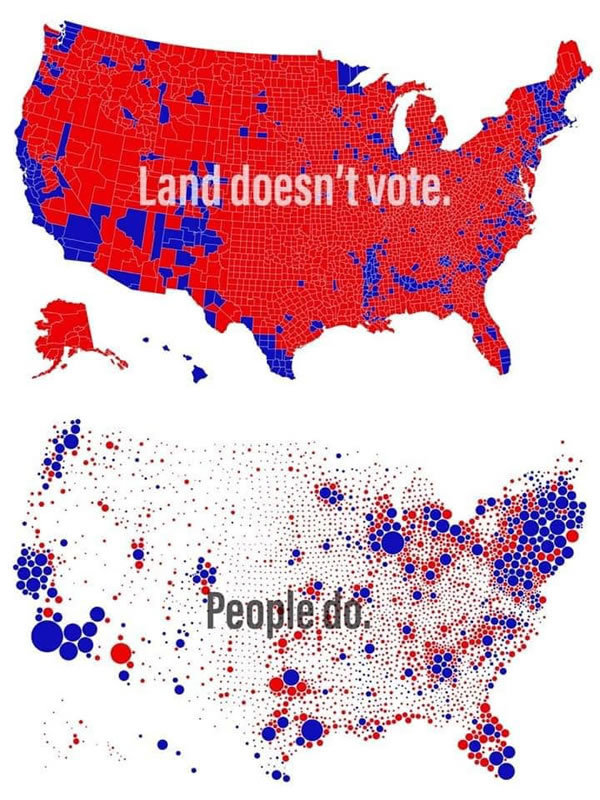
4. context
Bronvermelding!
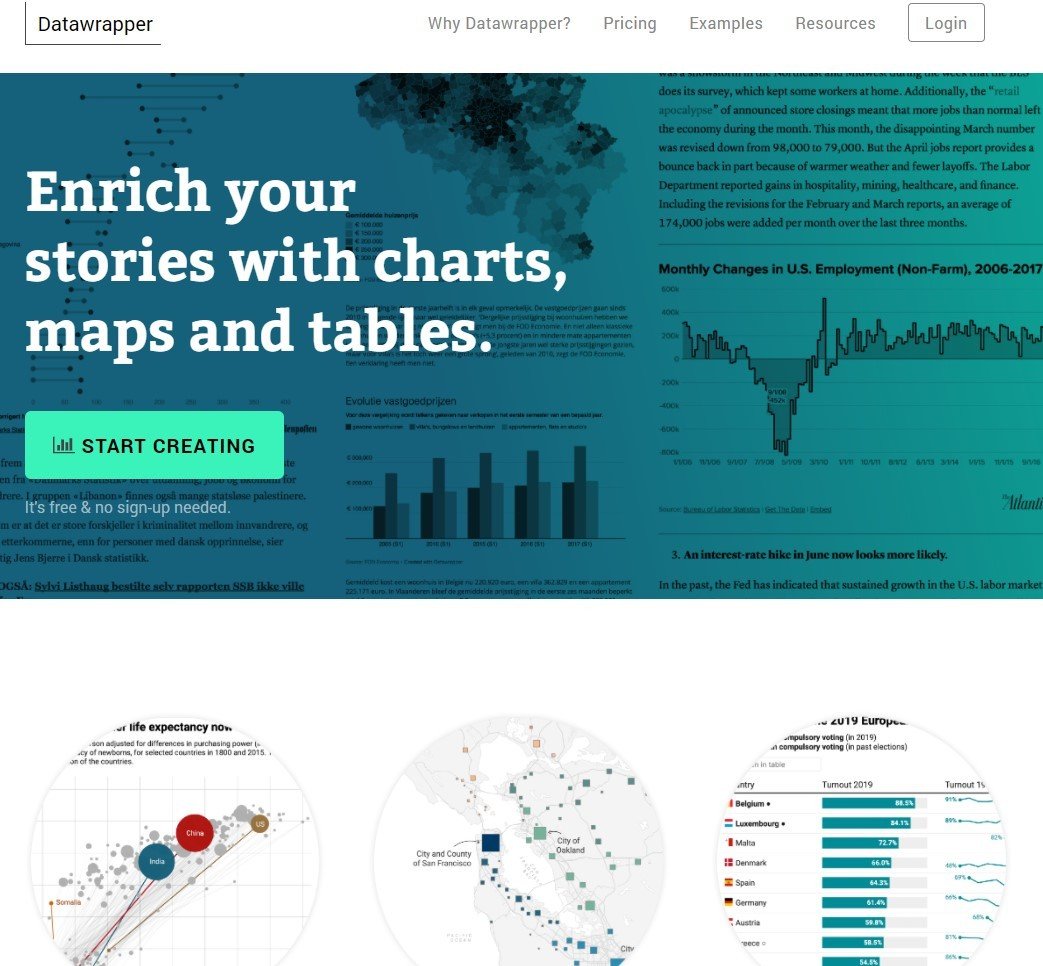
TOOLS

De student en zijn portefeuille
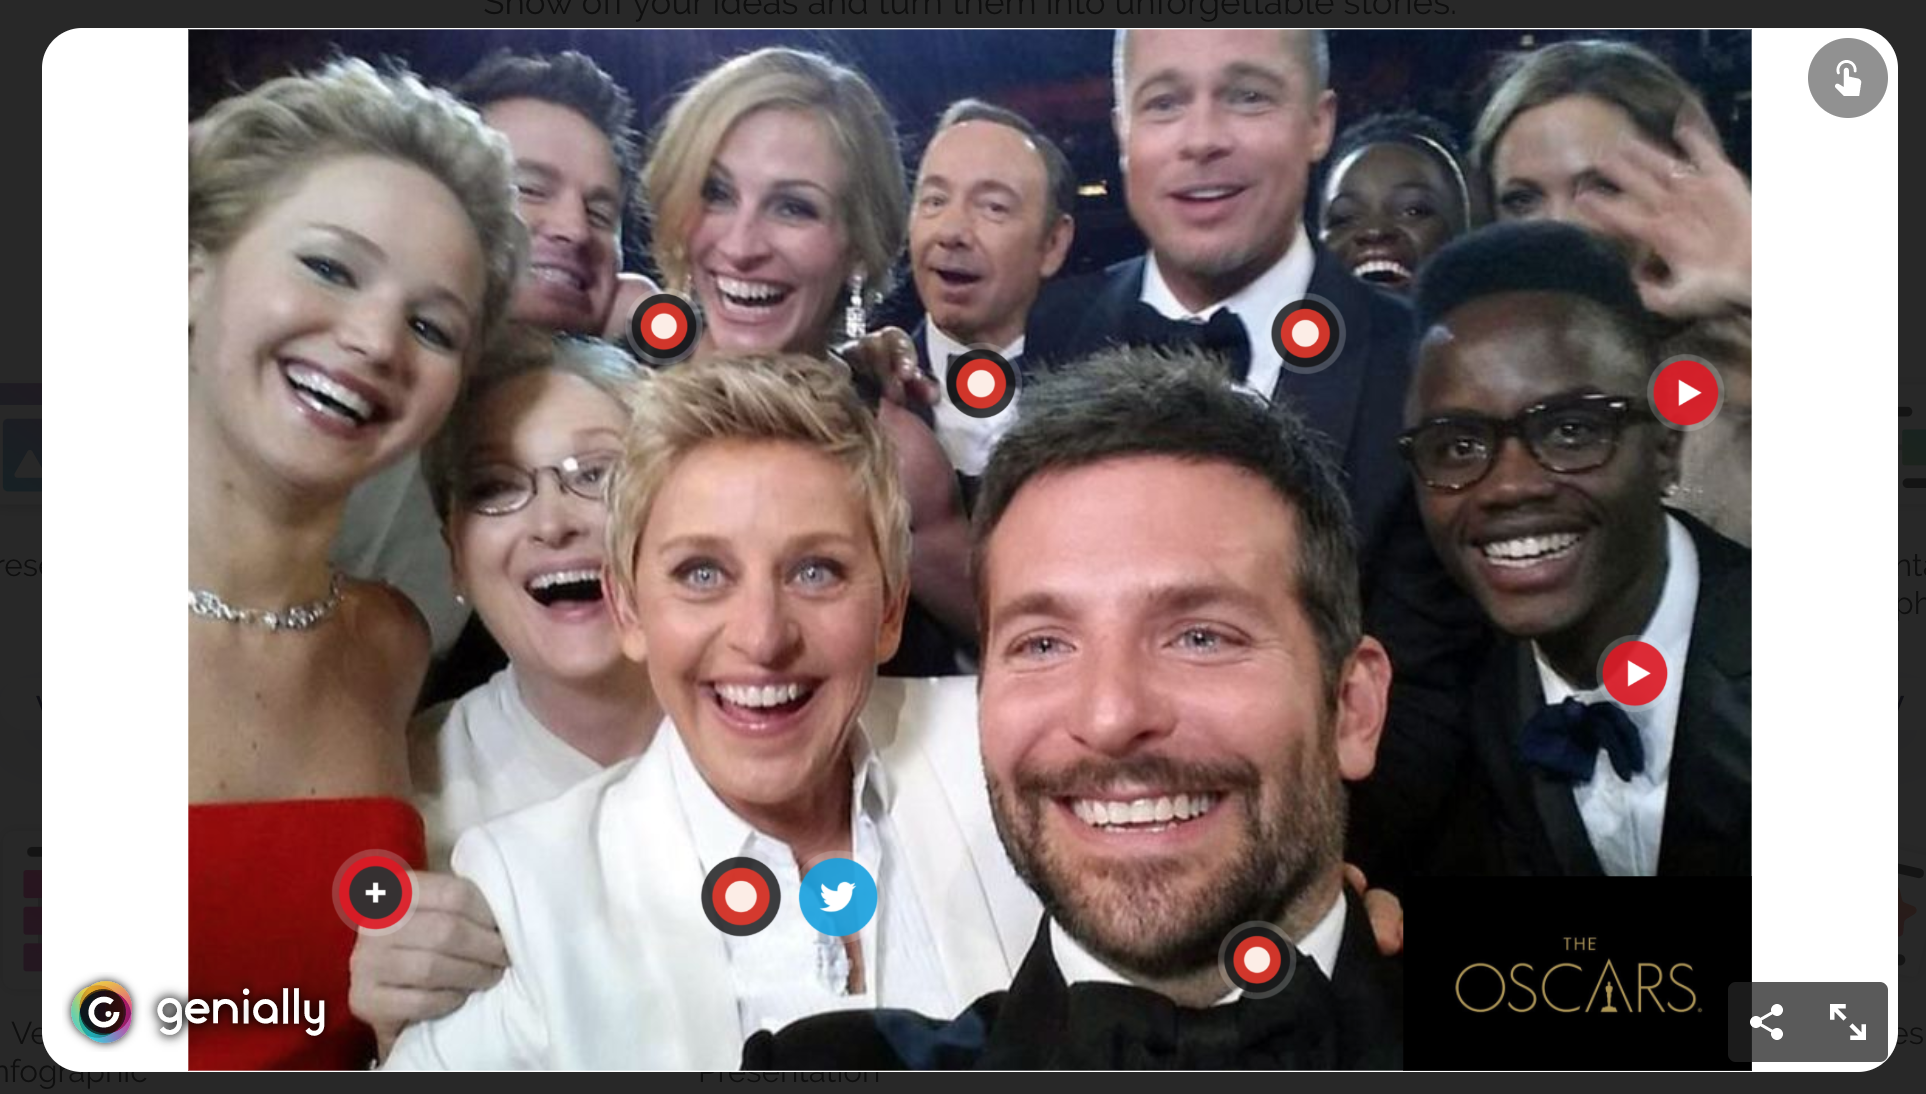
3. Interactieve beelden
via Genially of Interactive image
*basis is eigen infografiek bijvoorbeeld uit Illustrator
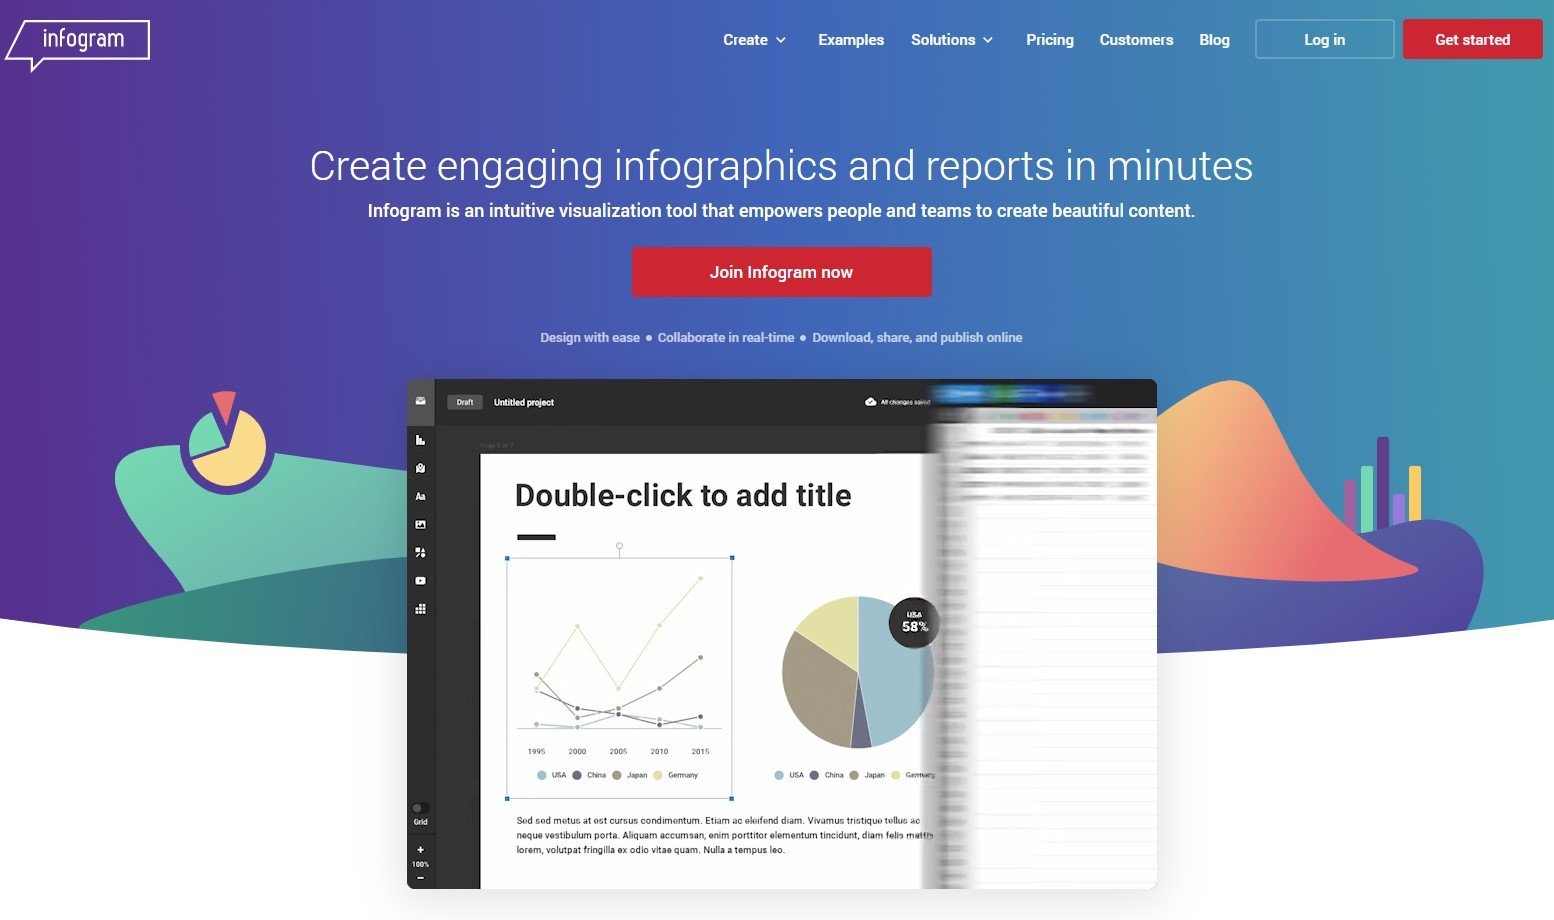
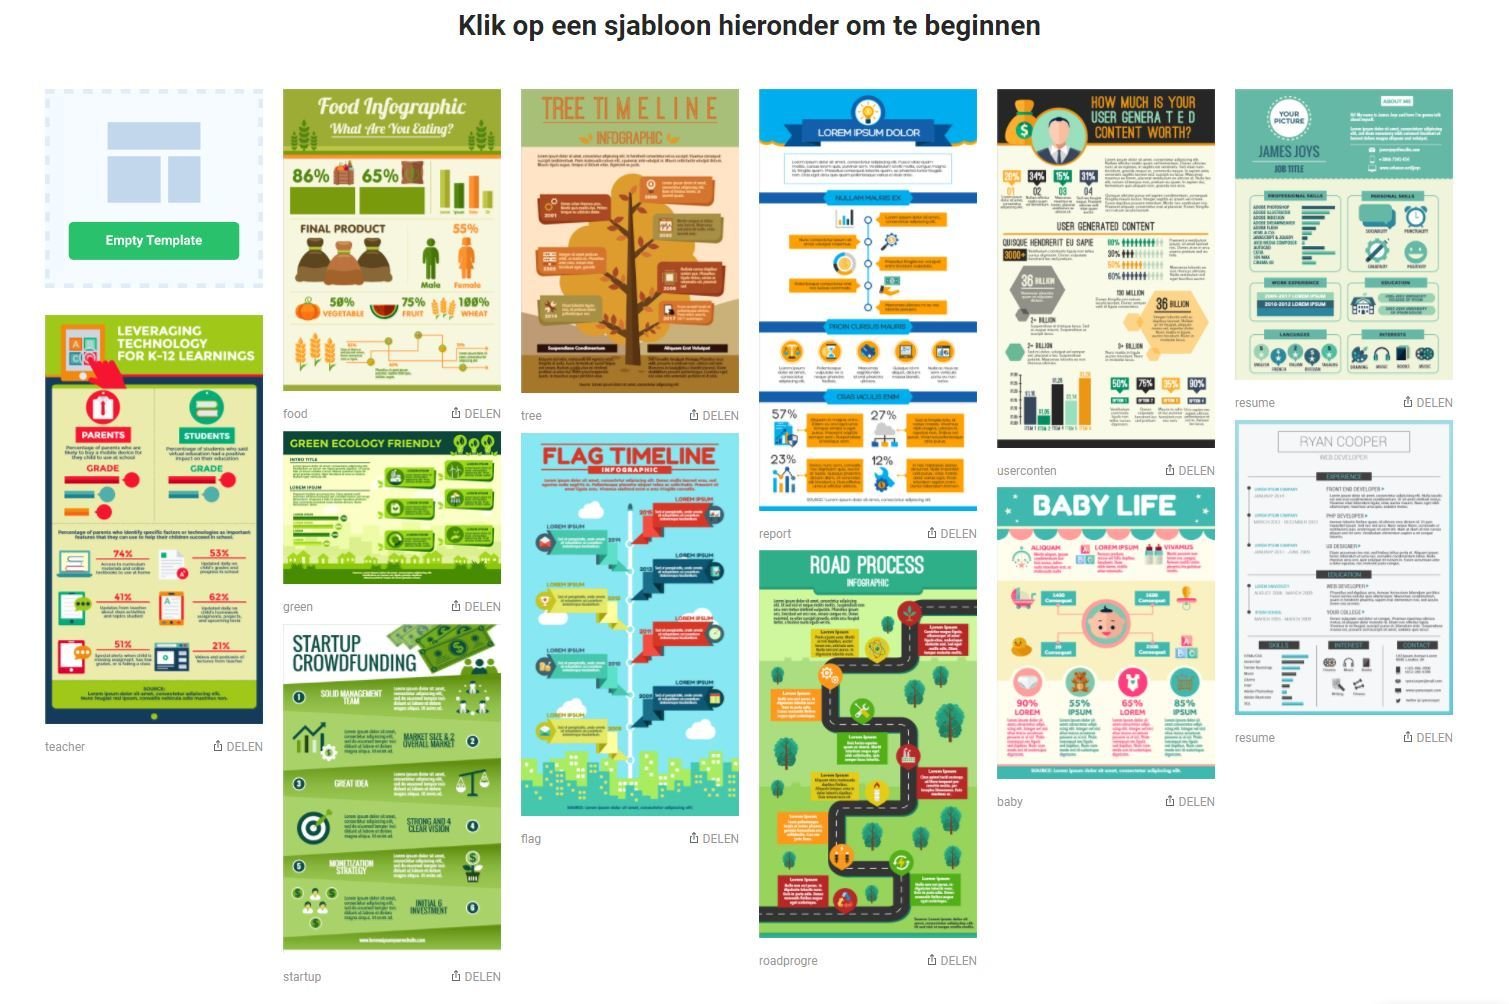
4. eenvoudige infografiek(en)
via Infogram of easel.ly

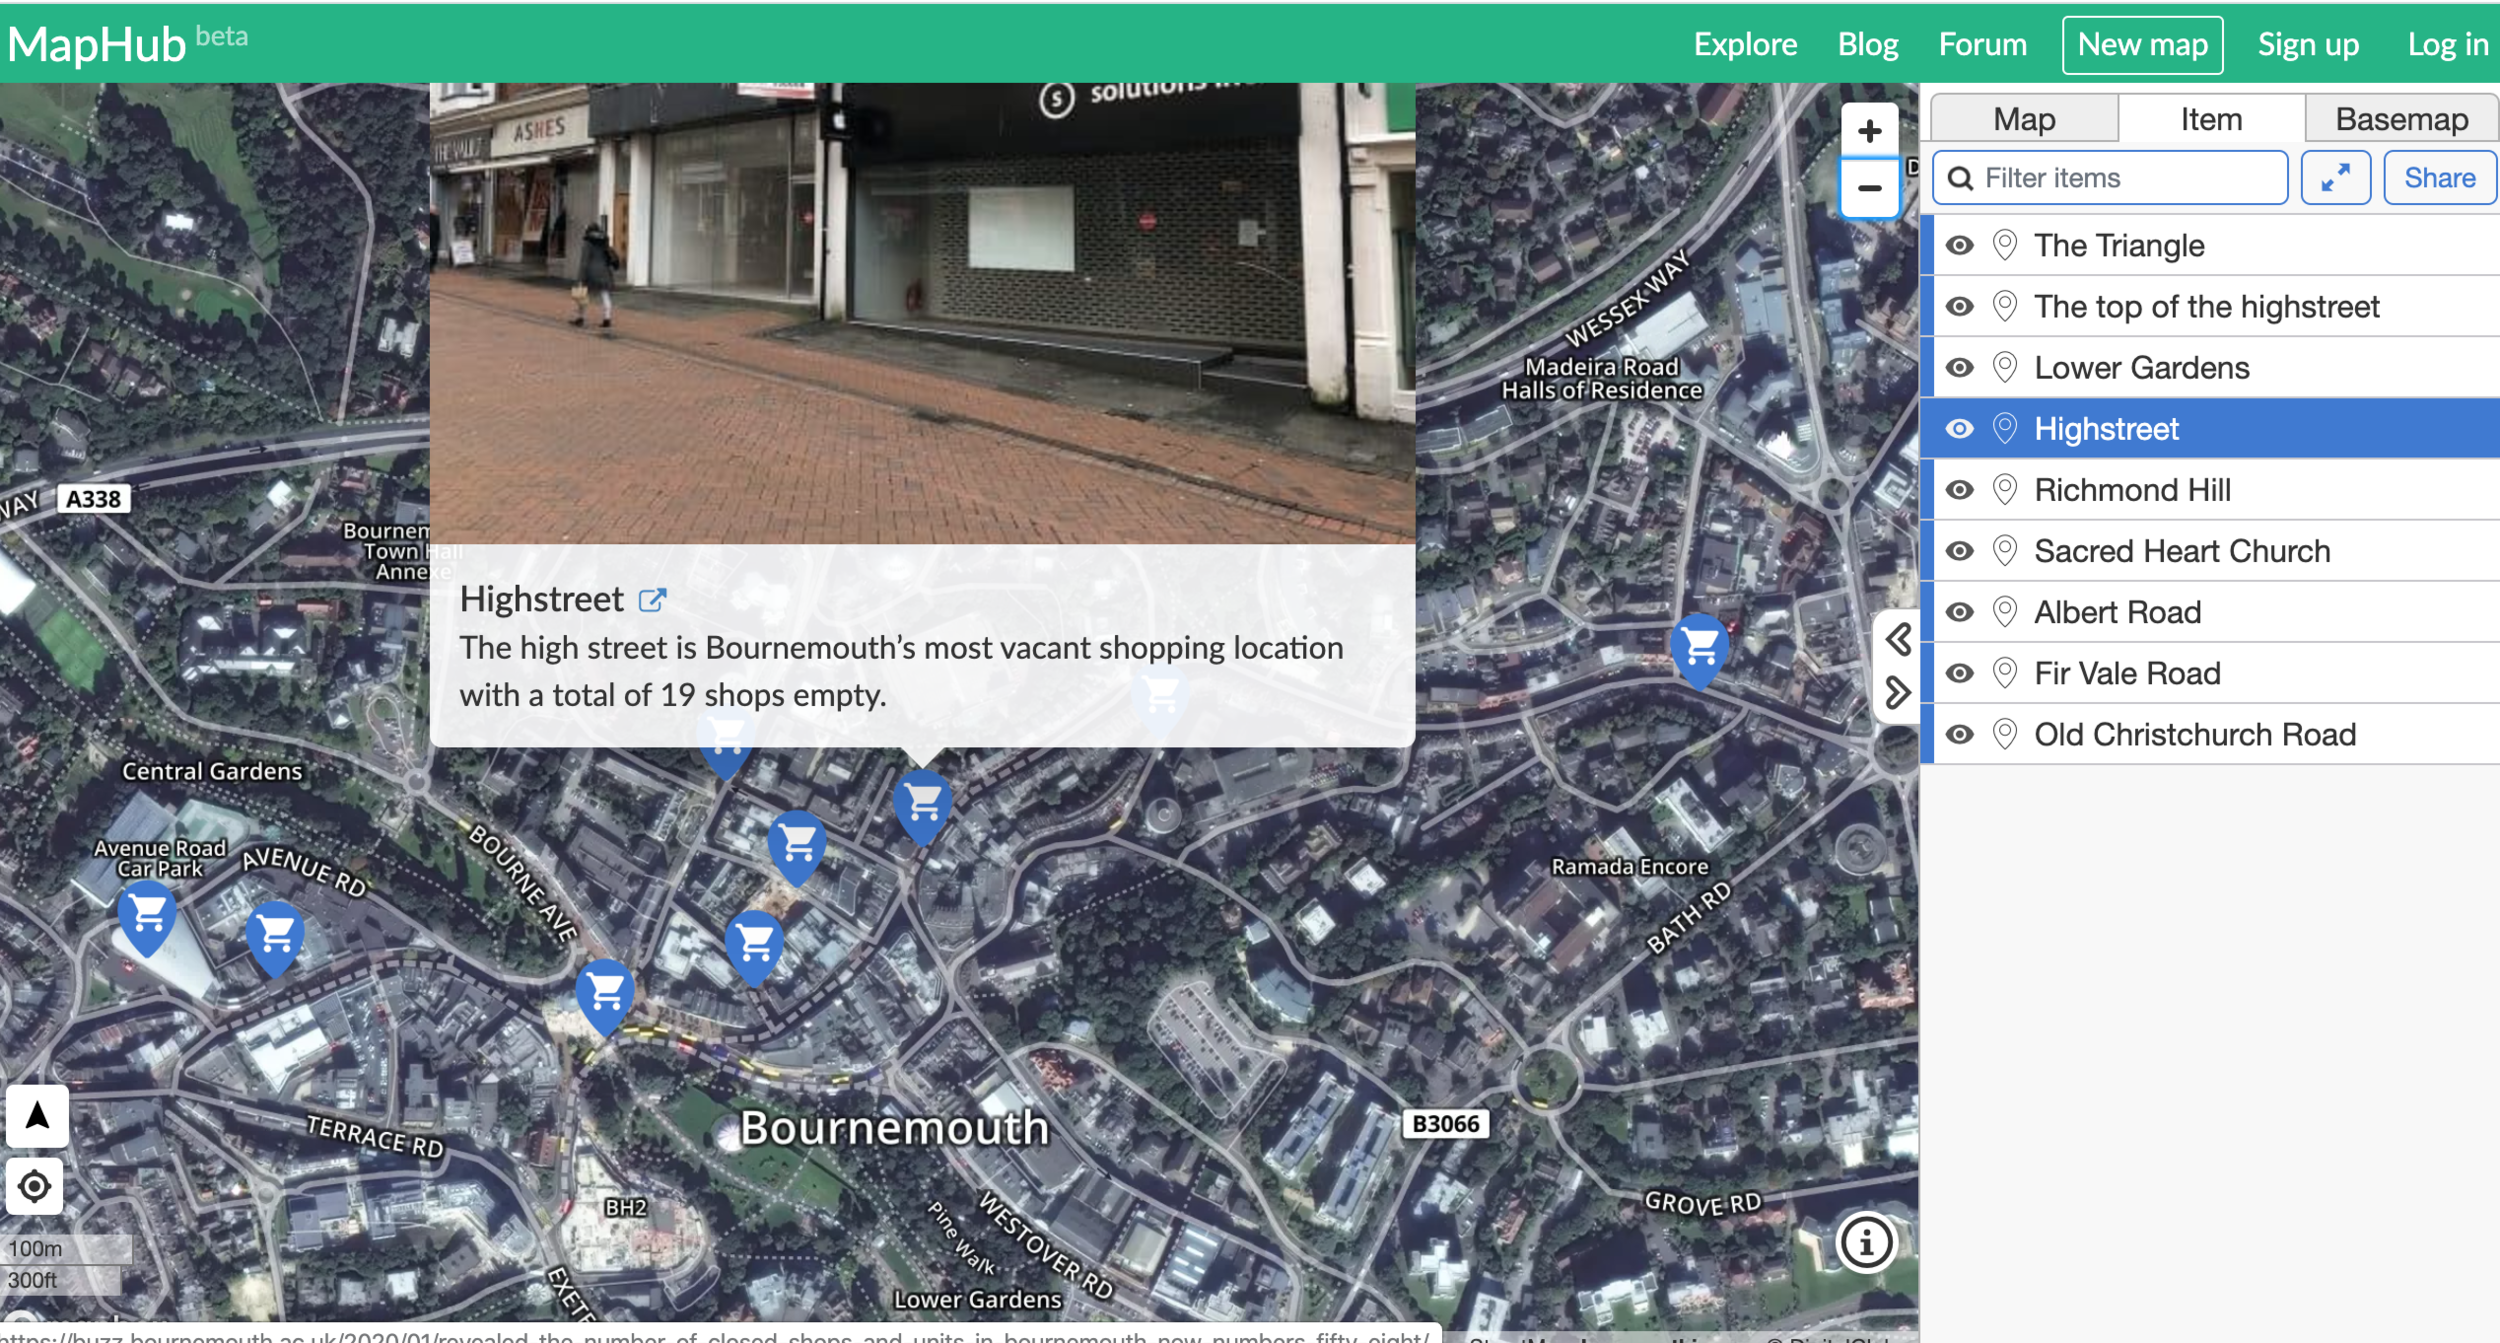
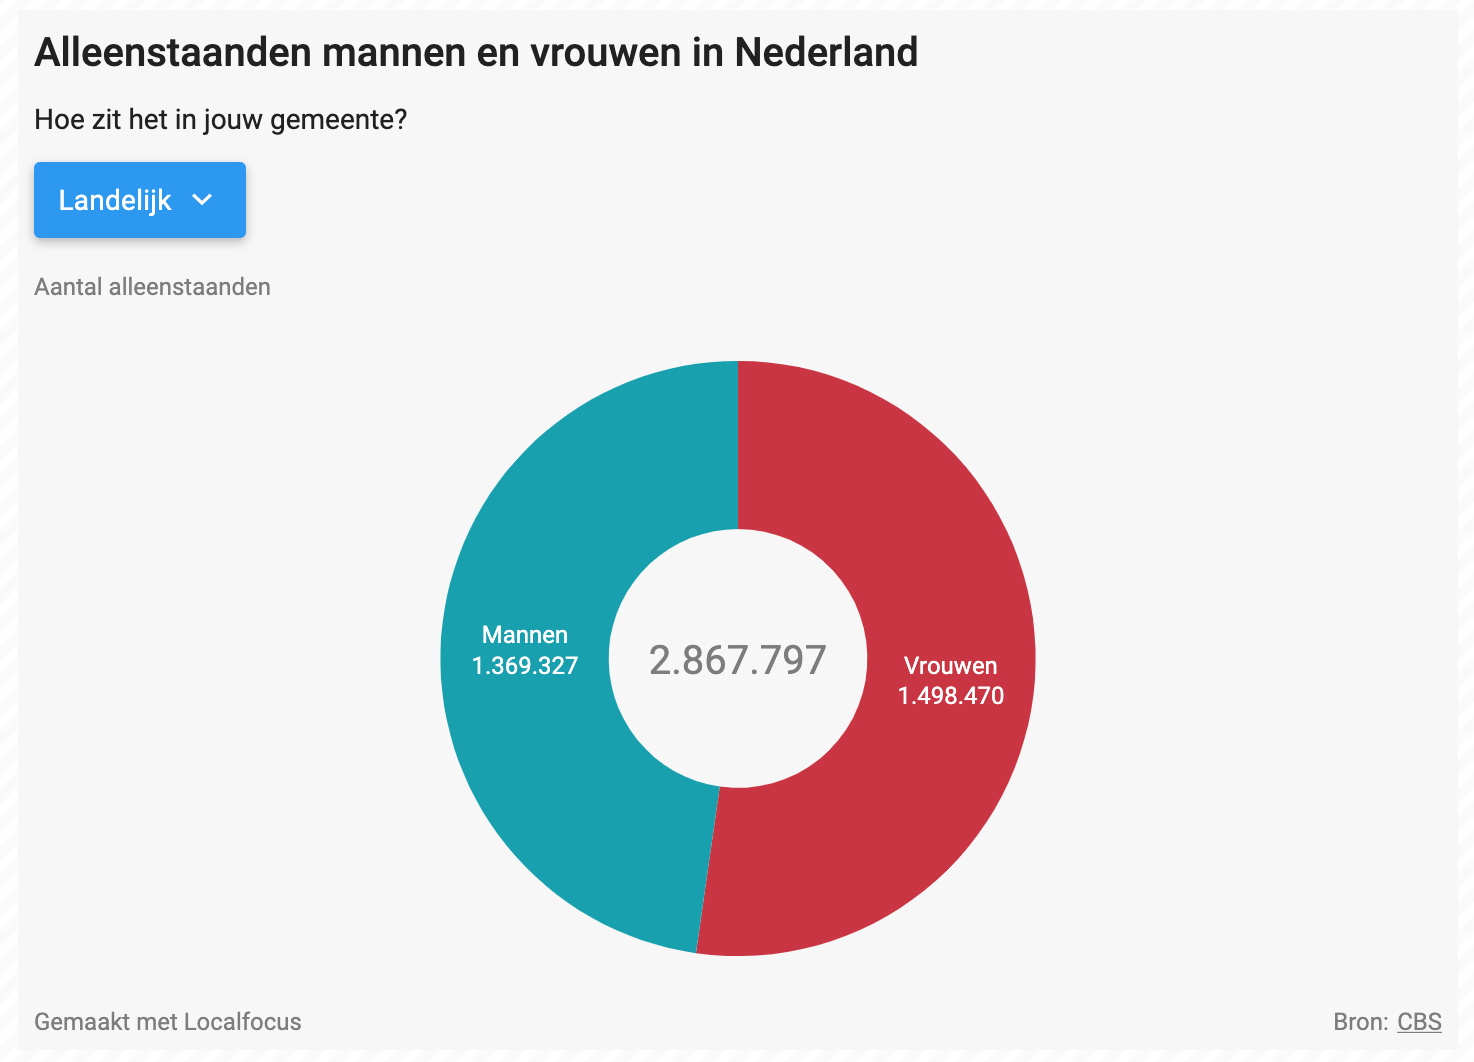
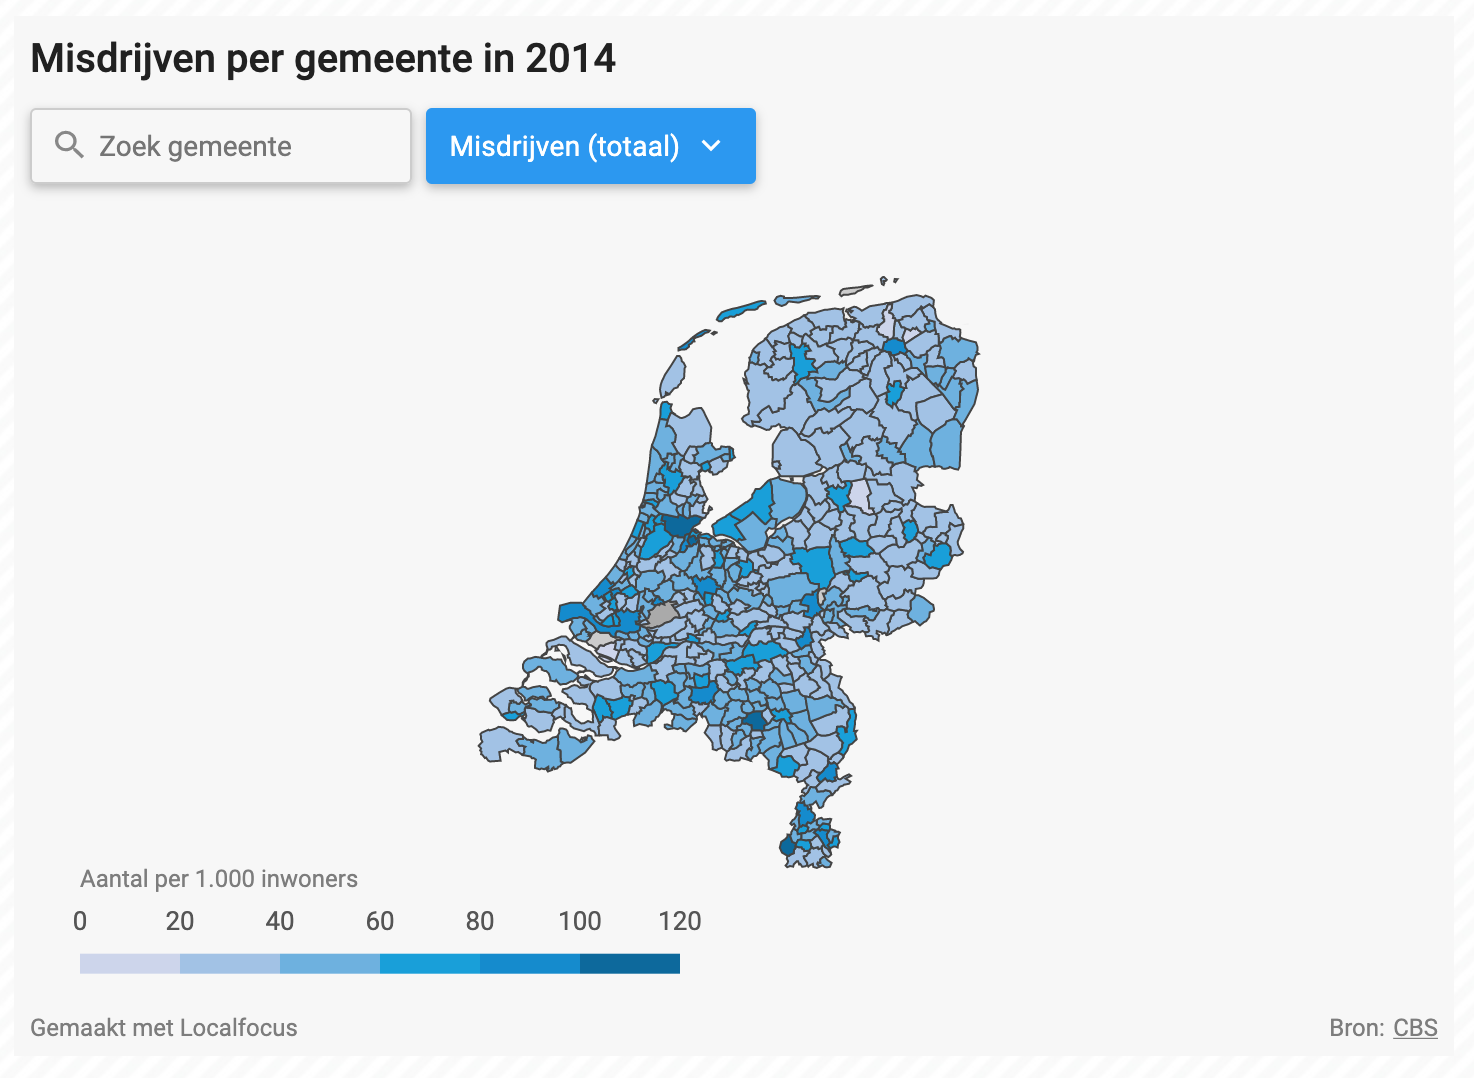
5. Interactieve kaarten en infografieken
via LocalFocus of datawrapper of Flourish

Nog meer tools?
-
SPJ Journalist's Toolbox
-
Journalism Tools door @ezraeeman (OpenVRT)
-
Storylab (info is niet meer recent)
-
Koninklijk Instituut voor de Tech&Tools (Fontys)
- Explainer video via Powtoon
- Tips van de New York Times om te starten met je databrainstorm
OPDRACHT
Werk in Illustrator een datavisualisatie uit EN/OF Experimenteer met een plug & play tool
* kies zelf je moeilijkheidsgraad
* test de tool uit (op Wordpress) voor je
daadwerkelijk er mee aan de slag gaat
Bestaand stuk
of nieuw stuk
* aan jou de keuze
één idee
DATAVISUALISATIE
By Sandra Busselot
DATAVISUALISATIE
3JOU


