Sebastian Ordoñez
jsordonezs@unal.edu.co
LA-CoNGA International Network School
6th of December 2021


Selection of the \(D^{+}\longrightarrow K^{-}K^{+}K^{+}\) candidates at the LHCb experiment
Validation Regions for non-prompt background estimation in same charged \(W^{\pm}W^{\pm}\) scattering
and
Outline
-
Selection of the \(D^{+}\longrightarrow K^{-}K^{+}K^{+}\) candidates at the LHCb experiment
-
Introduction
-
Data Analysis
- Pre selection
-
Multivariate Analysis
-
Results
-
Summary
-
-
Validation Regions for non-prompt background estimation in same charged \(W^{\pm}W^{\pm}\) scattering
-
Motivation
-
Introduction
-
Trilepton validation regions
-
Evaluation
-
Closure tests
-
-
Conclusion and Outlook
-
Introduction
- My work: Selection of \(D^{+}\longrightarrow K^{-}K^{+}K^{+}\) candidates using a multivariate analysis (MVA). The study is based on a sample of \(pp\)-collision data, collected at a centre-of-mass energy of 13 TeV with the LHCb detector during the run 2.
- Decays of \(D\) mesons into three mesons exhibit a rich resonance structure at low energies, involving heavy-quark weak transitions, hadron formation and final-state interactions.
The \(D\) meson is the lightest known particle containing charm quarks, its mass is known to be 1869.62\(\pm\)0.20 MeV
- An additional motivation for researching three-body hadronic decays of heavy-flavoured mesons is the large and pure datasets available nowadays coming from the B-factories, LHCb, ...
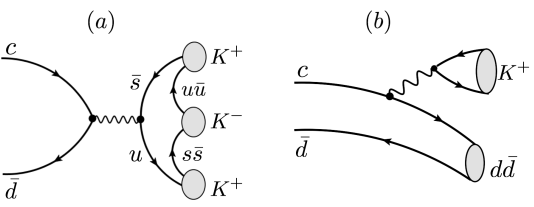
Tree-level diagram for the \(D^{+}\longrightarrow K^{-}K^{+}K^{+}\) decay
Data Analysis
Pre-selection: Clone Tracks

\boxed{1.}
\boxed{2.}
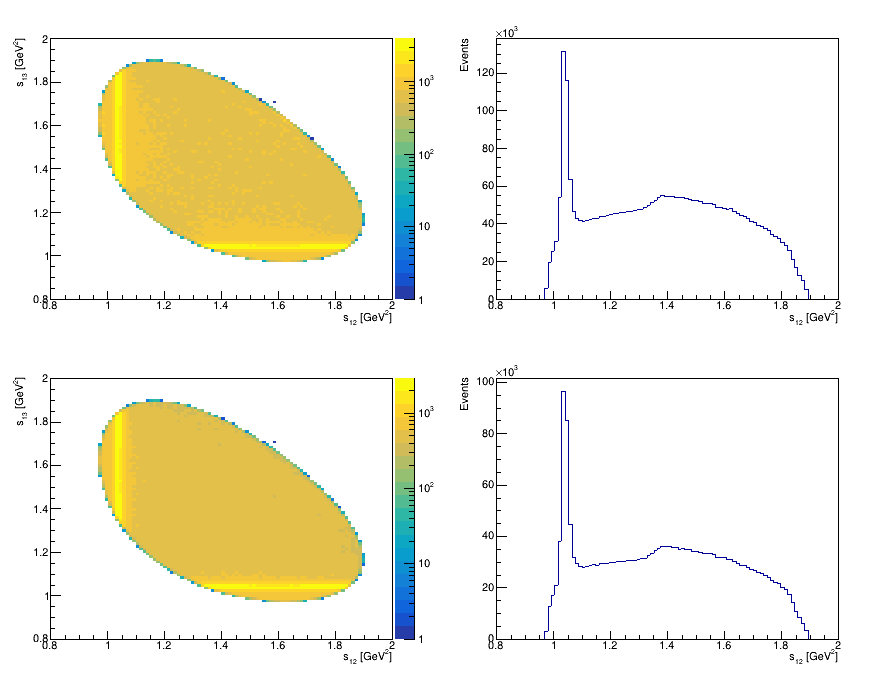
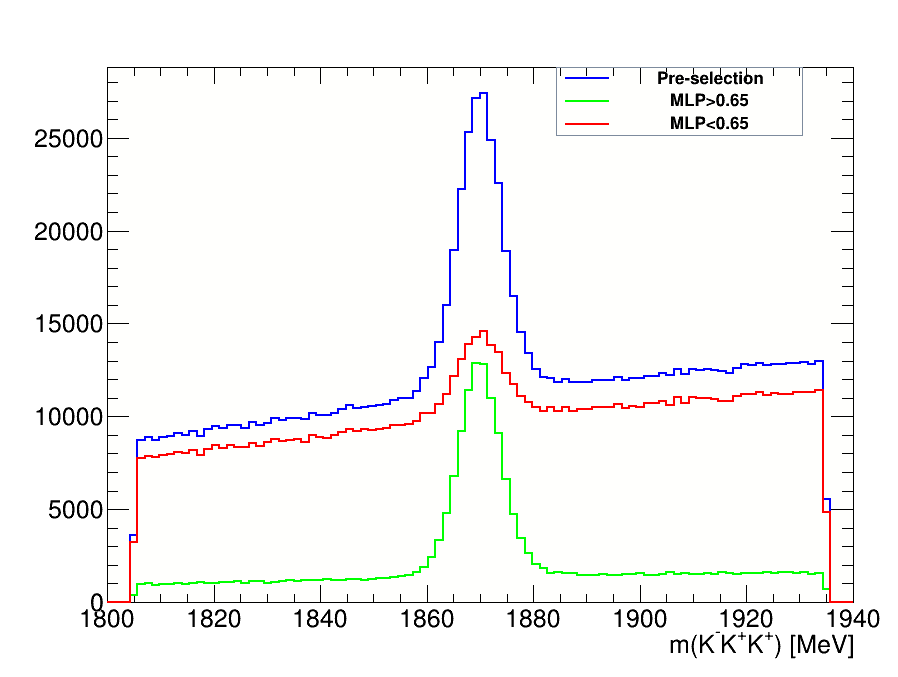
Dalitz Plot before and after cuts on the SDV
\text{difTX}_{ij}=\left|\frac{p_{x_{i}}}{p_{z_{i}}}-\frac{p_{x_{j}}}{p_{z_{j}}}\right|
\text{difTY}_{ij}=\left|\frac{p_{y_{i}}}{p_{z_{i}}}-\frac{p_{y_{j}}}{p_{z_{j}}}\right|
- Before using MVA it is necesasry to reduce the high levels of background: clone tracks and combinatorial.
- We use the slope difference variables (SDV):
- Clone tracks originate when two tracks share more than 70% of their hits in the tracking system.
Data Analysis
Pre-selection: Clone Tracks
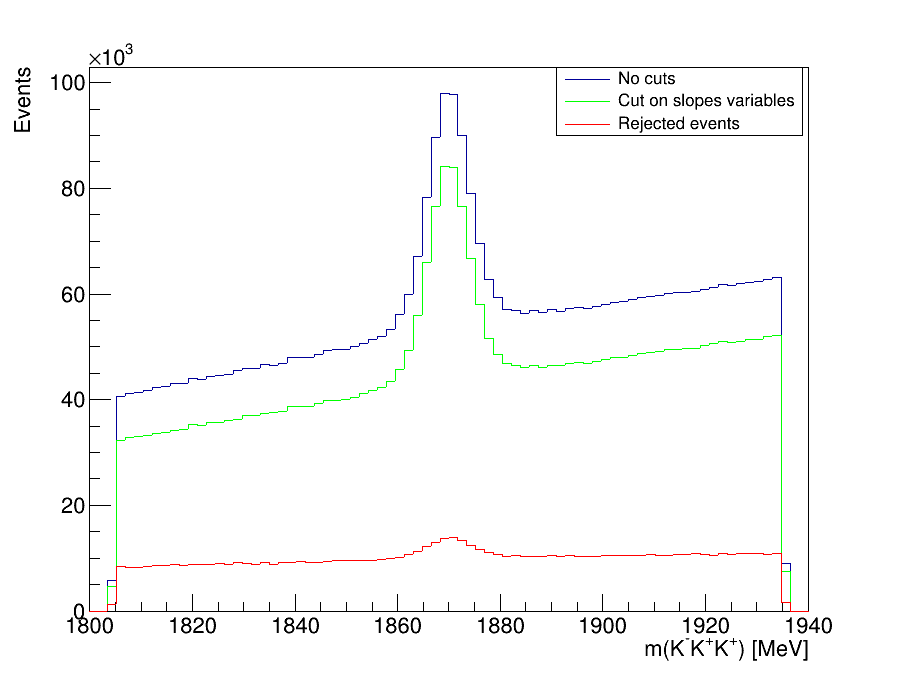
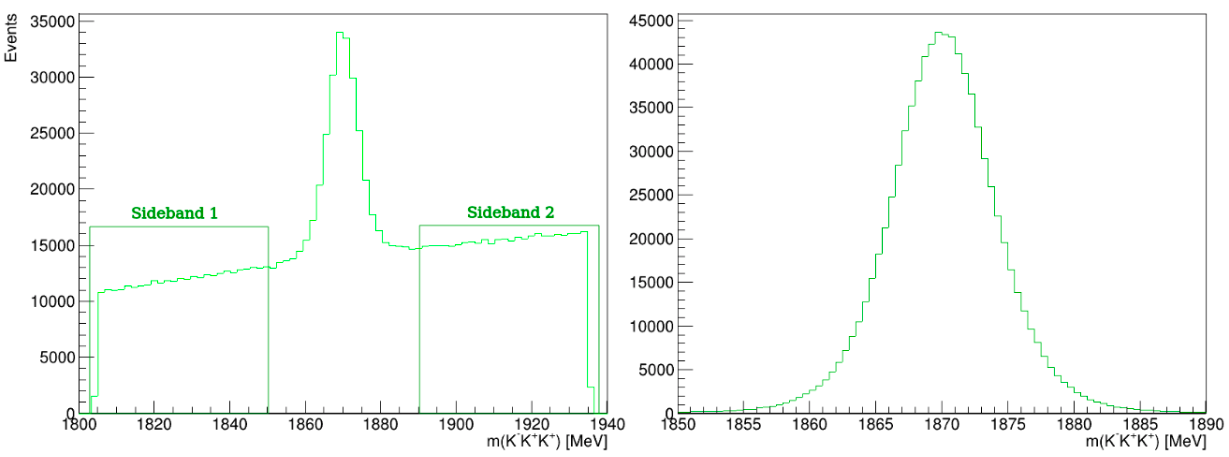
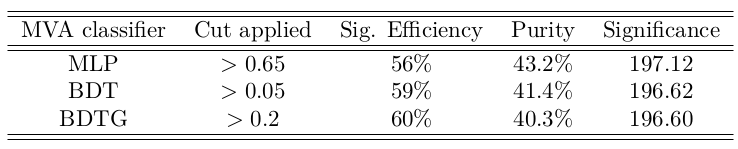
Invariant-mass spectrum of the \(K^{-}K^{+}K^{+}\) candidates
Data Analysis
Pre-selection: PID
\boxed{3.}
\boxed{2.}
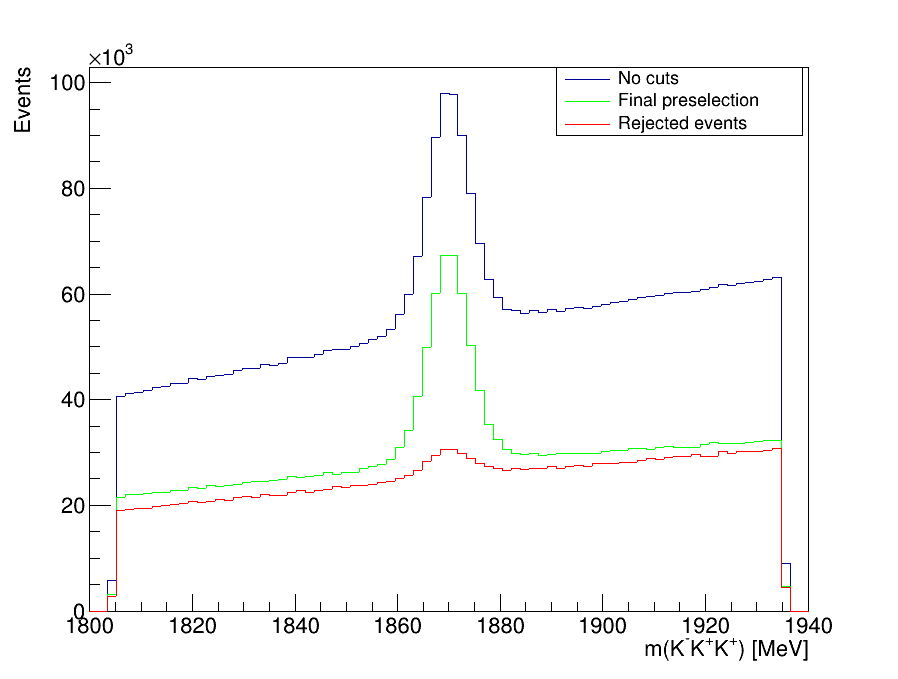
Invariant-mass spectrum of the \(K^{-}K^{+}K^{+}\) candidates
Dalitz Plot before and after cuts on the PID variables
- We impose requirements on PID variables in order to remove combinatorial background
- The two main sources in this channel are \(\Lambda^{+}_{c}\) decays into \(K^{-}K^{+}p\) and \(K^{-}p\pi\) final states.
Data Analysis
Multi-variate Analysis (MVA): Training-Input variables
Background from data
Signal from Monte Carlo
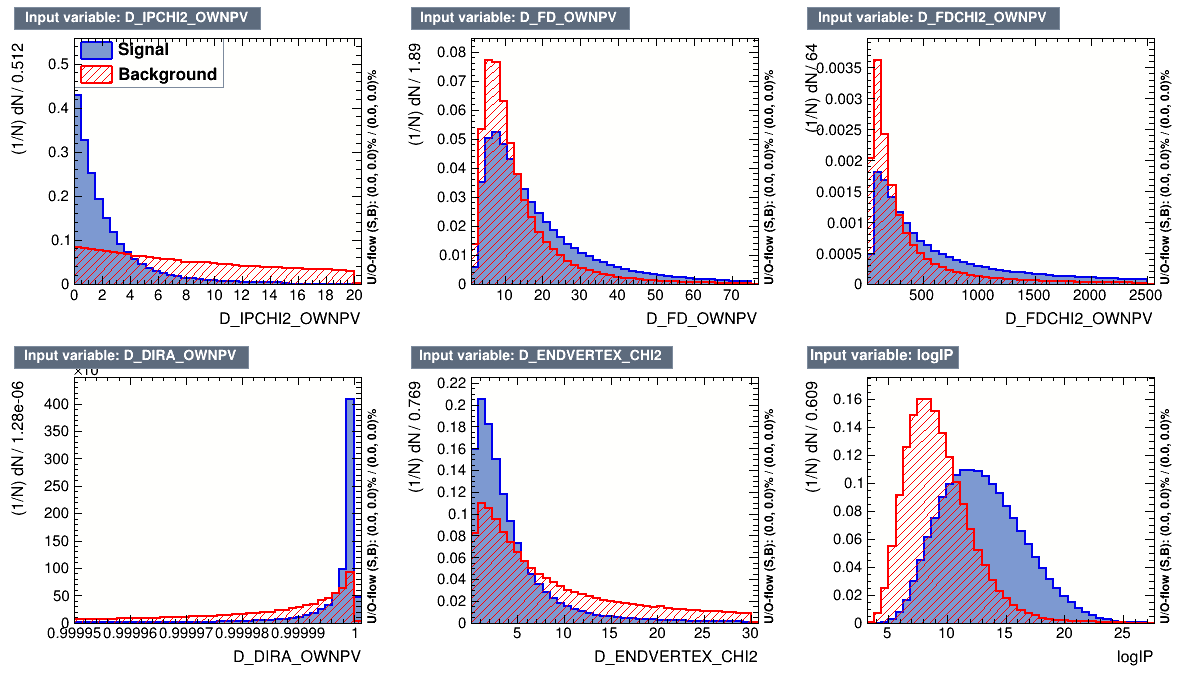
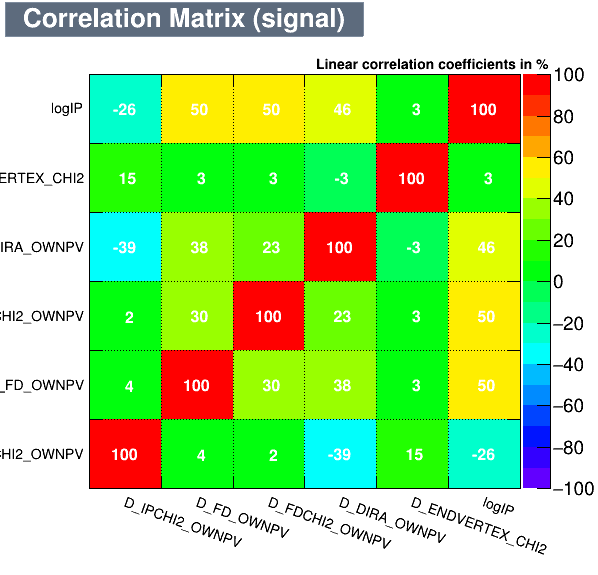
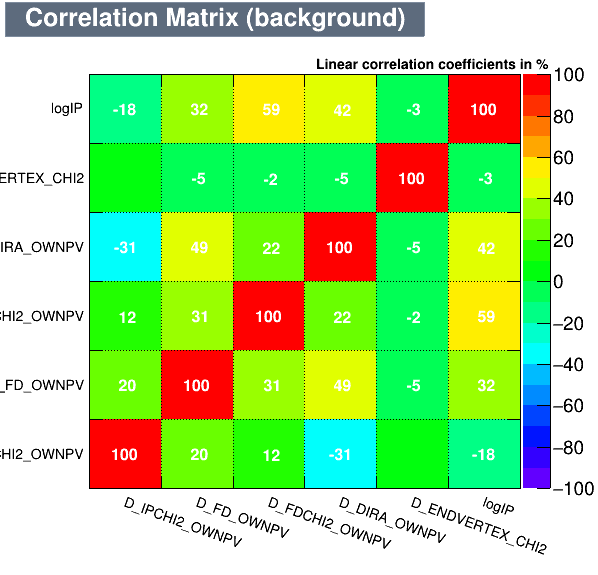
Input variables for the MVA Algorithms
- The discriminating variables chosen for the MVA methods are only related to the \(D^{+}\) candidate.
- MVA algorithm uses a set of discriminating variables for known background and signal events, with the purpose of building a new variable which provides an optimal signal-background discrimination.
Data Analysis
Multi-variate Analysis (MVA): Training-Input variables
Data Analysis
Multi-variate Analysis (MVA): Training-Booking and testing
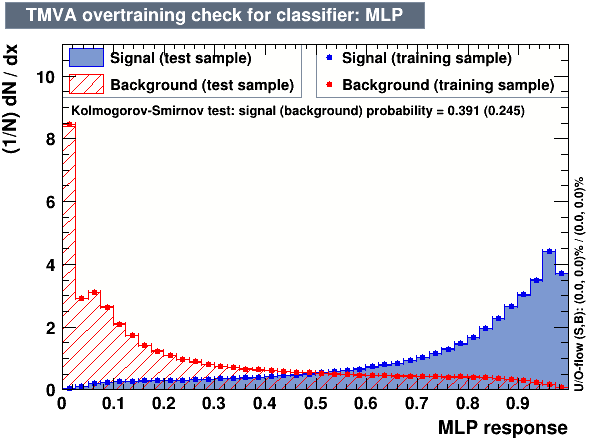
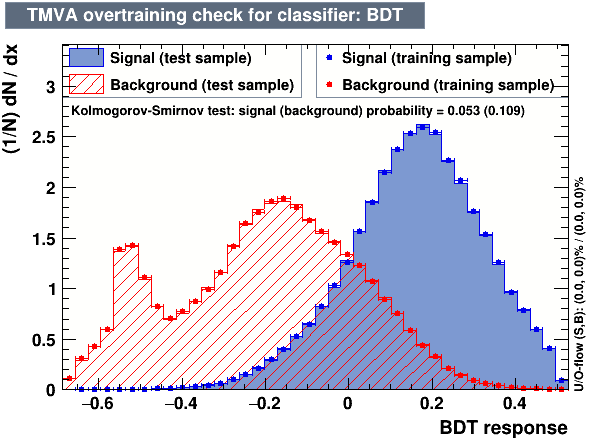
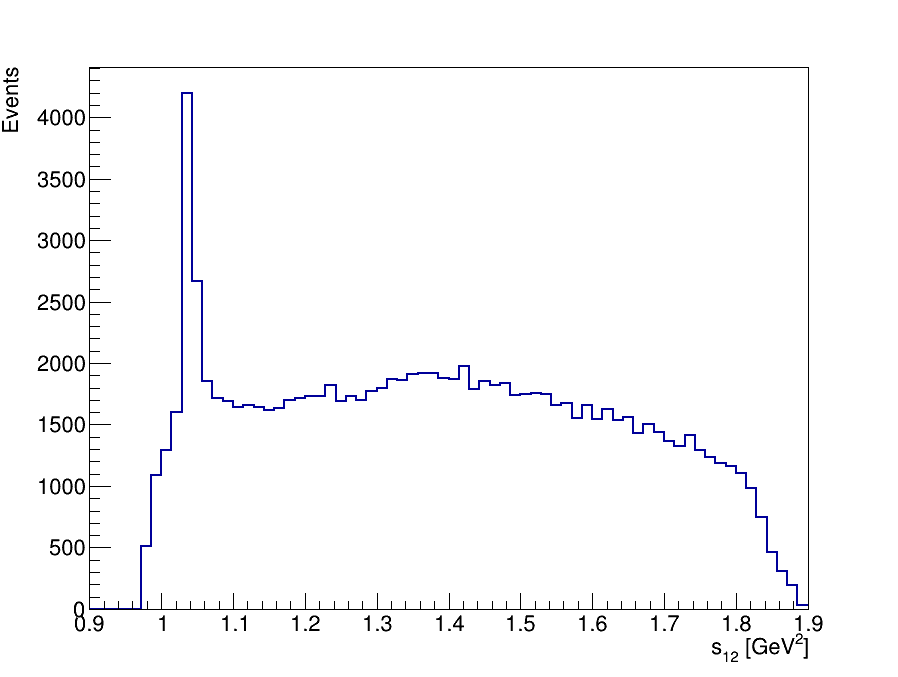
- The following algorithms were considered: Multi Layer Perceptron (MLP), Gaussian Boosted Decision Tree (BDTG), BDT, Decorrelated BDT (BDTD).
Classifier output distributions
Data Analysis
Multi-variate Analysis (MVA): Training-Booking and testing
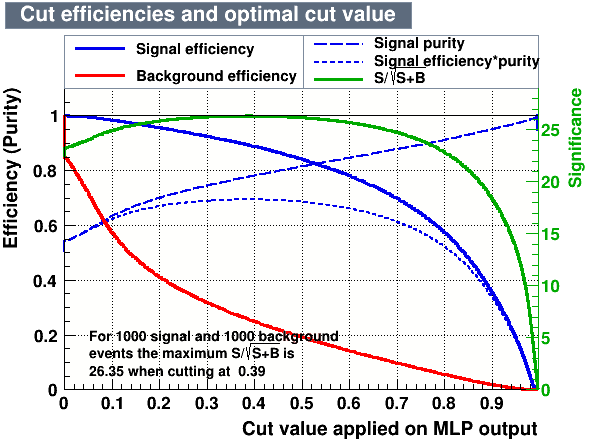
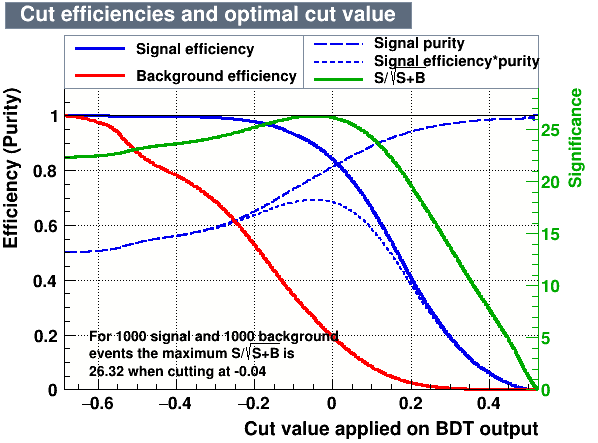
- Cutting on the value of the MVA variables, it is possible to find the one which maximises a given figure of merit, providing high signal efficiency and at the same time a significant background rejection.
Data Analysis
Multi-variate Analysis (MVA): Training-Evaluation

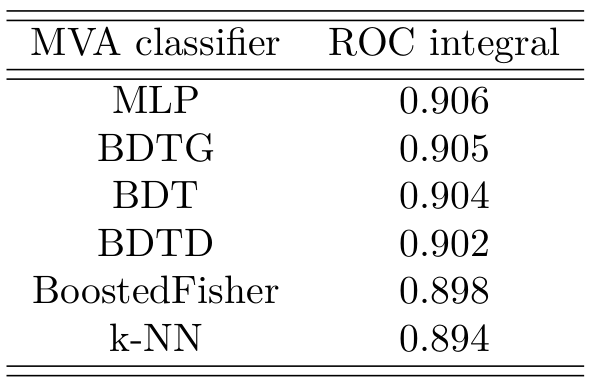
ROC curve for all the classifiers
Area under the ROC curve
- ROC curve gives a suitable performance evaluation for each classifier
Data Analysis
Multi-variate Analysis (MVA): Application
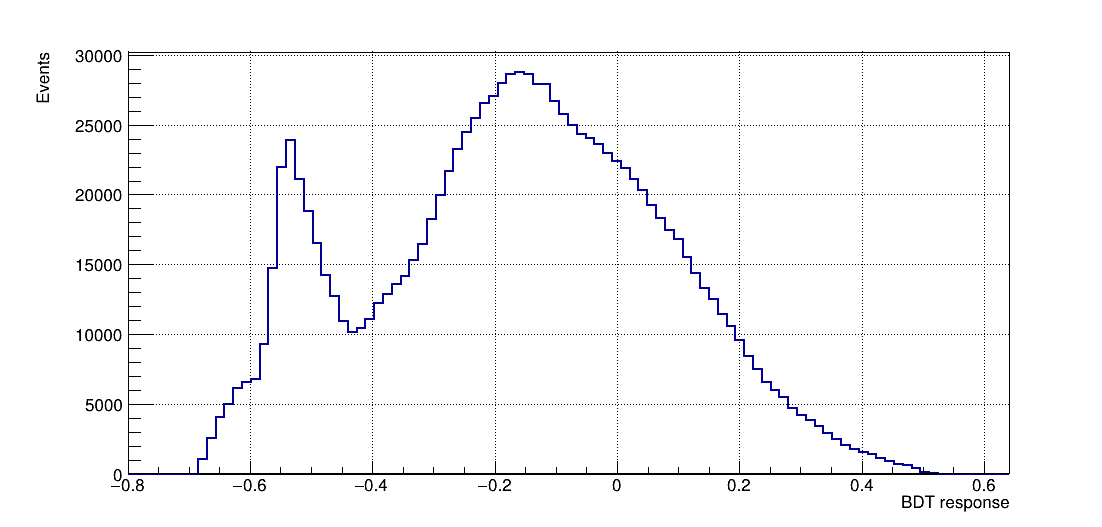
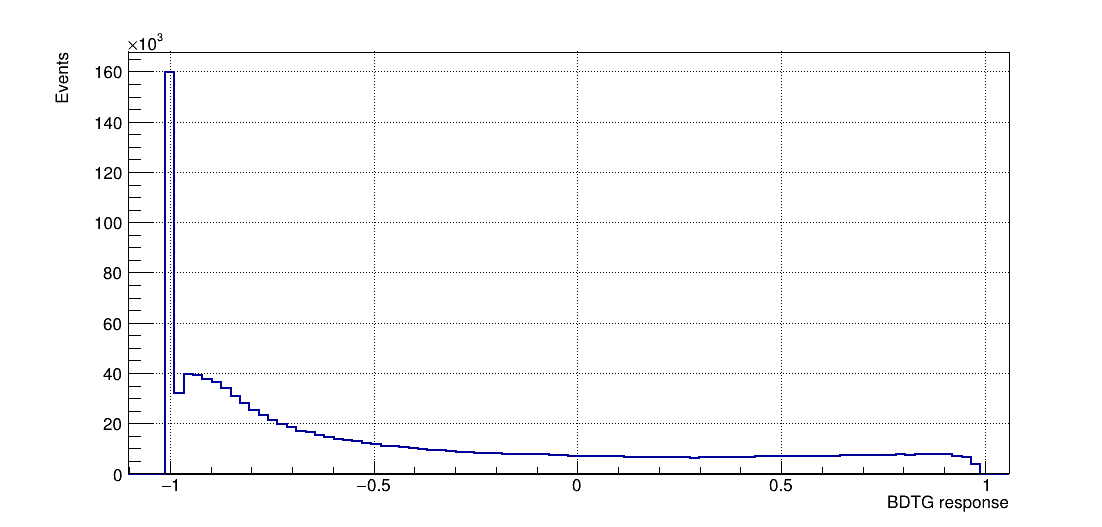
- Once the training is completed, the next phase is the application of these results to an independent data set with unknown signal and background composition.
BDTG response
BDT response
Results
Significance curves
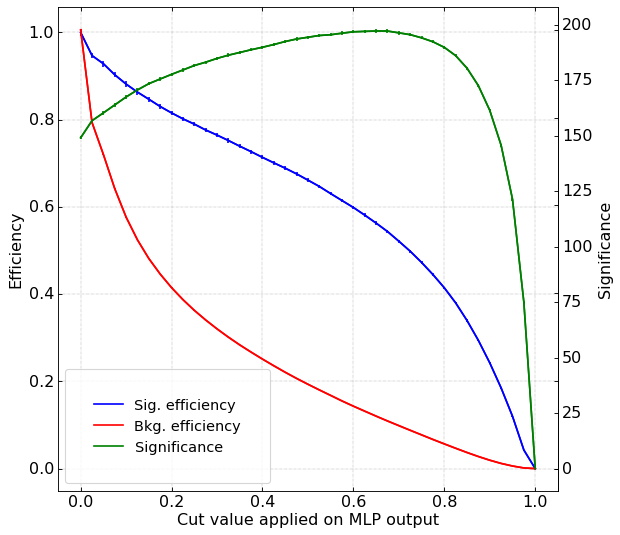
Result of applying cuts in the classifiers that showed the best signal-background discrimination performance
- Cut values which give the maximum signal significance
Results
\(D^{+}\longrightarrow K^{-}K^{+}K^{+}\) invariant-mass spectrum
This is the final invariant-mass distribution of the \(K^{-}K^{+}K^{+}\) candidates after applying the cut on the MLP classifier, the one with the best performance.
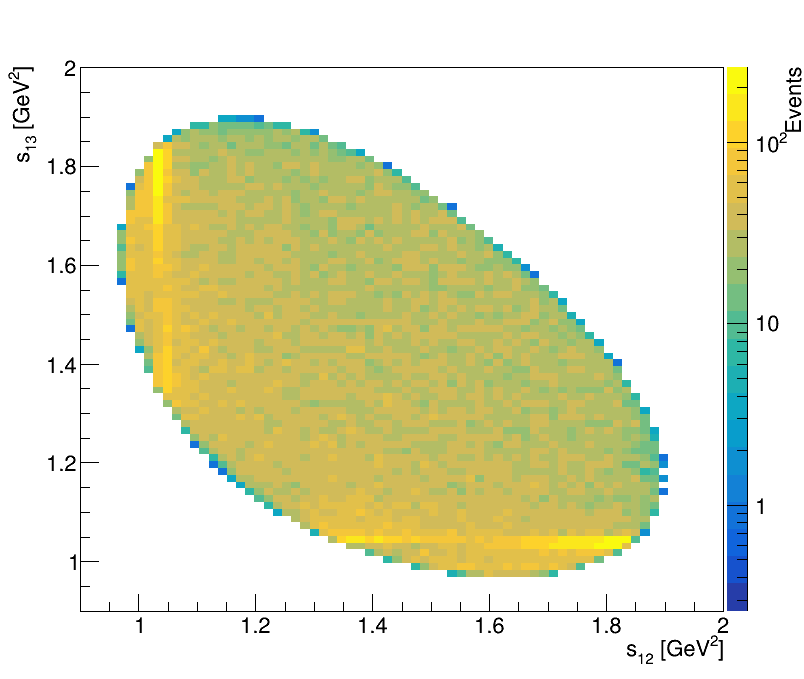
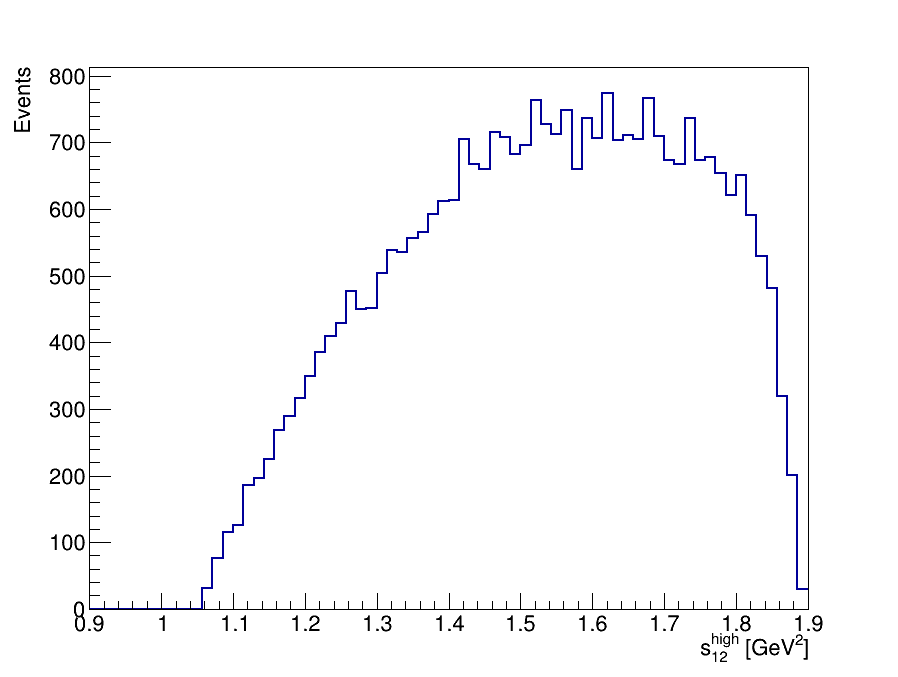
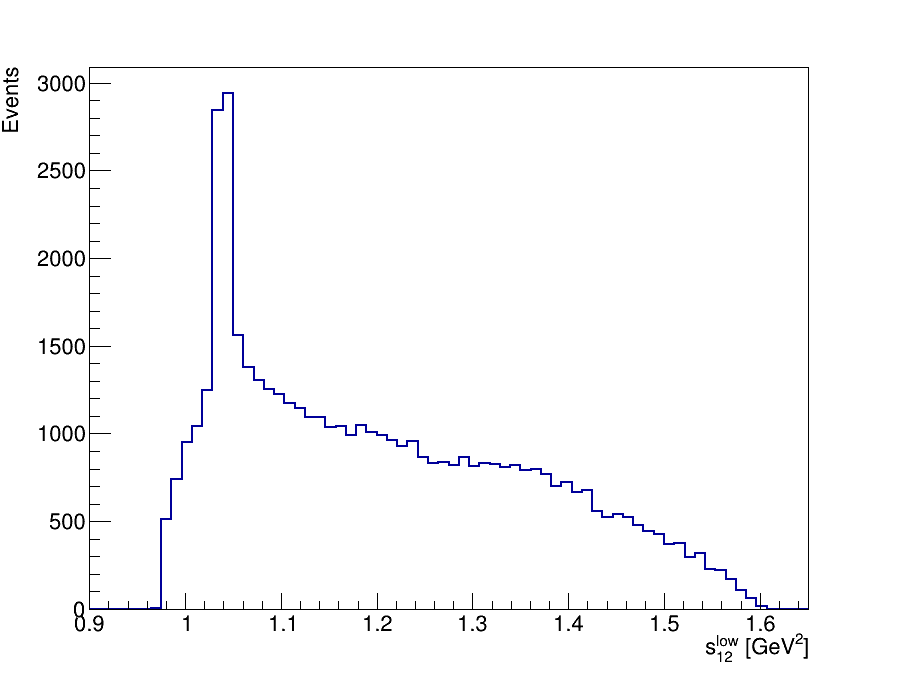
Final Dalitz Plot and Projections
Thank you!
Details and references can be found in CDS: https://cds.cern.ch/record/2781351
Motivation
- Misidentified leptons are the second largest background in the \(W^{\pm}W^{\pm} jj-\) EW signal region.
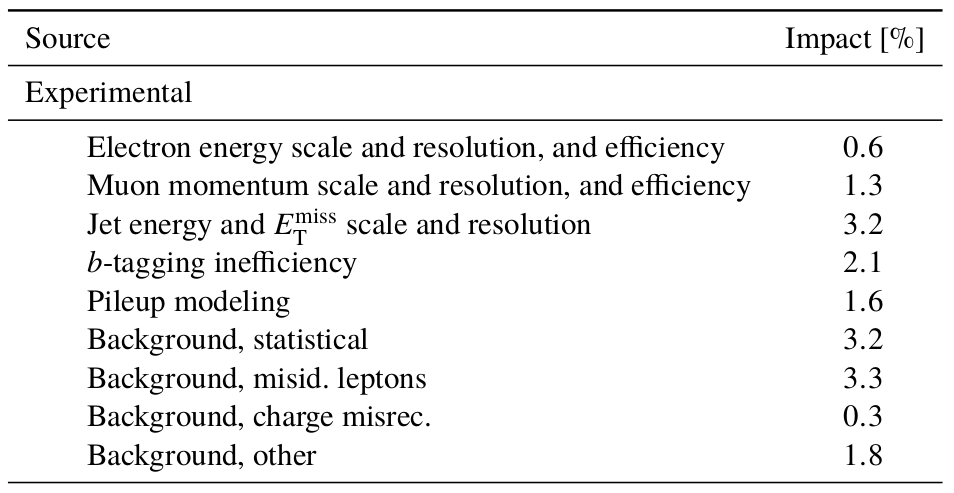
- The largest experimental uncertainty comes from the data-driven estimation of the non-prompt background.
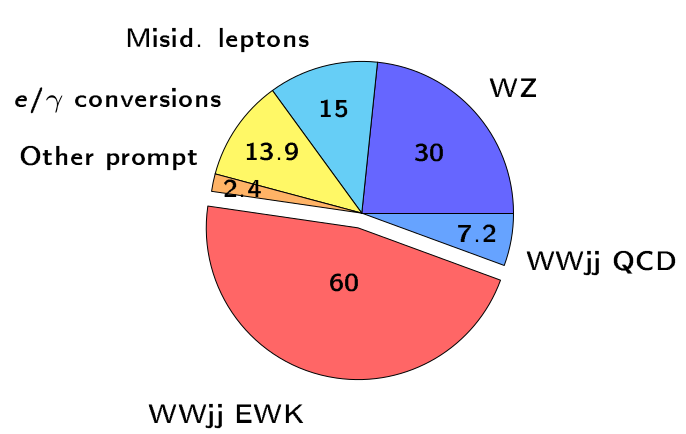
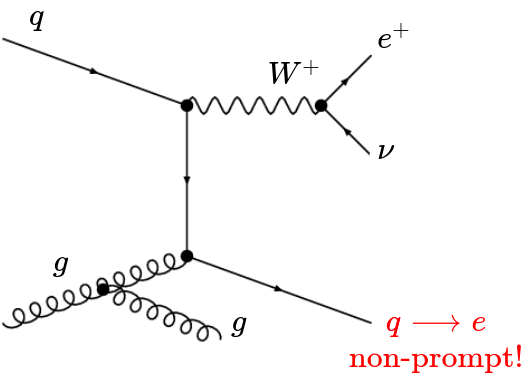
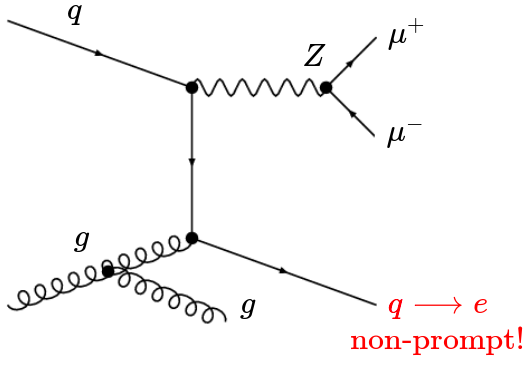
Non-prompt background in the \(W^{\pm}W^{\pm} jj\)-EW analysis
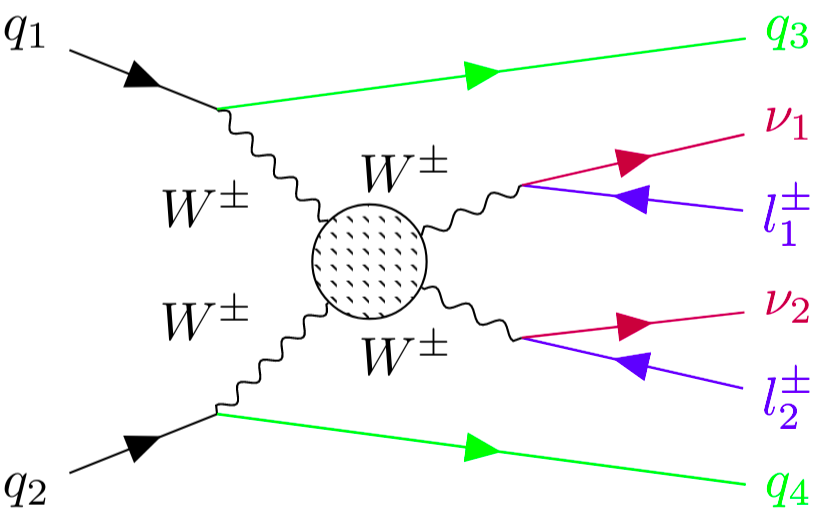
Final state: two leptons, \(E_{T}^{miss}\), two jets.
Data-driven Matrix Method
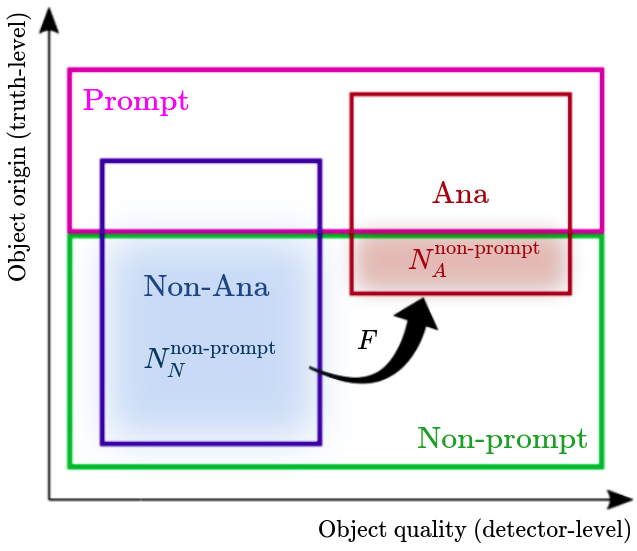
In order to calculate the non-prompt background, four lepton categories are used.
\boxed{N_{A}^{\text{non-prompt}}=(N_{N}^{\text{data CR}}-N_{N}^{\text{prompt MC}})F^{\text{data CR}}}
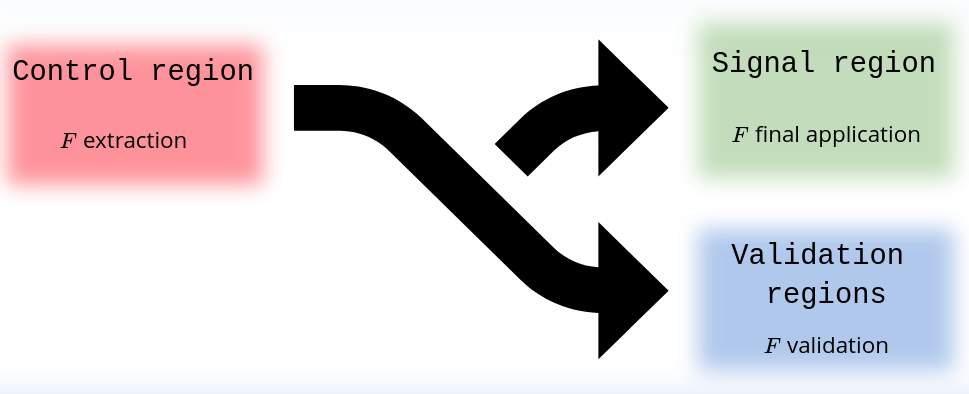
- In this study the fake factor \(F\) is extracted from the dilepton control region.
The reducible background is calculated by using:

My work!
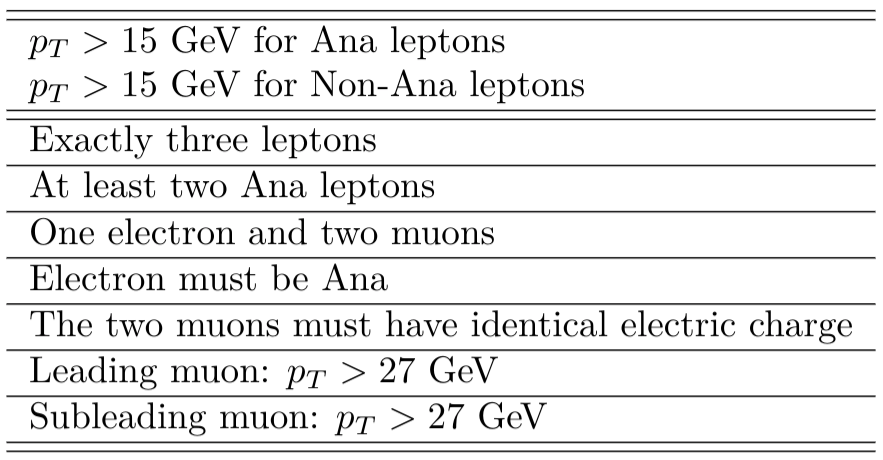
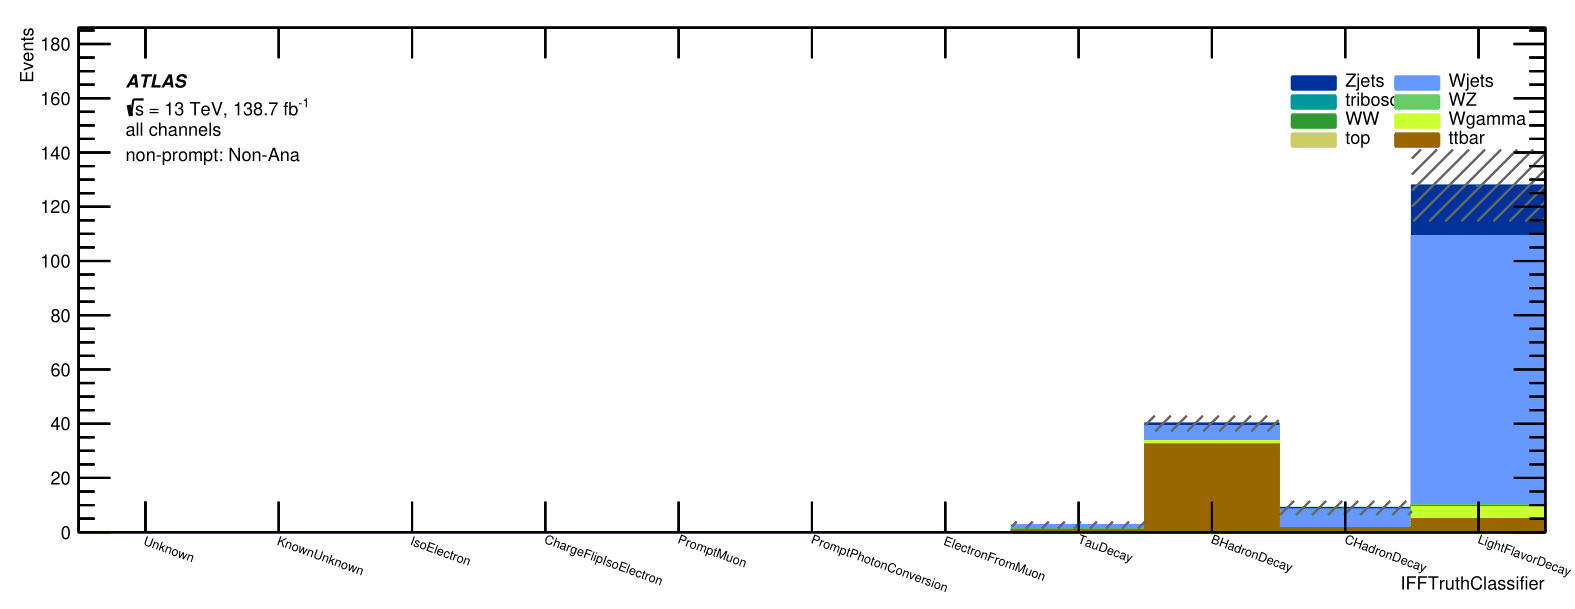
Trilepton Muon Region
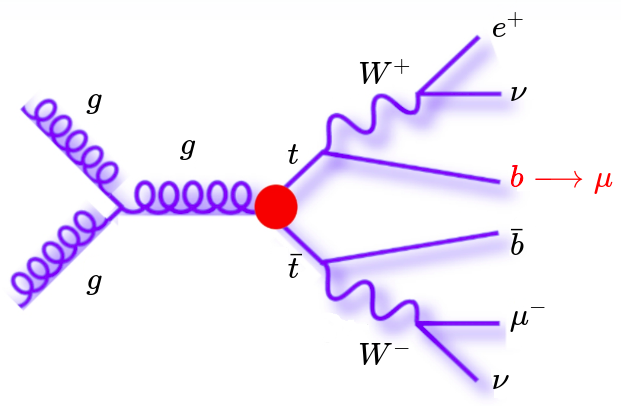
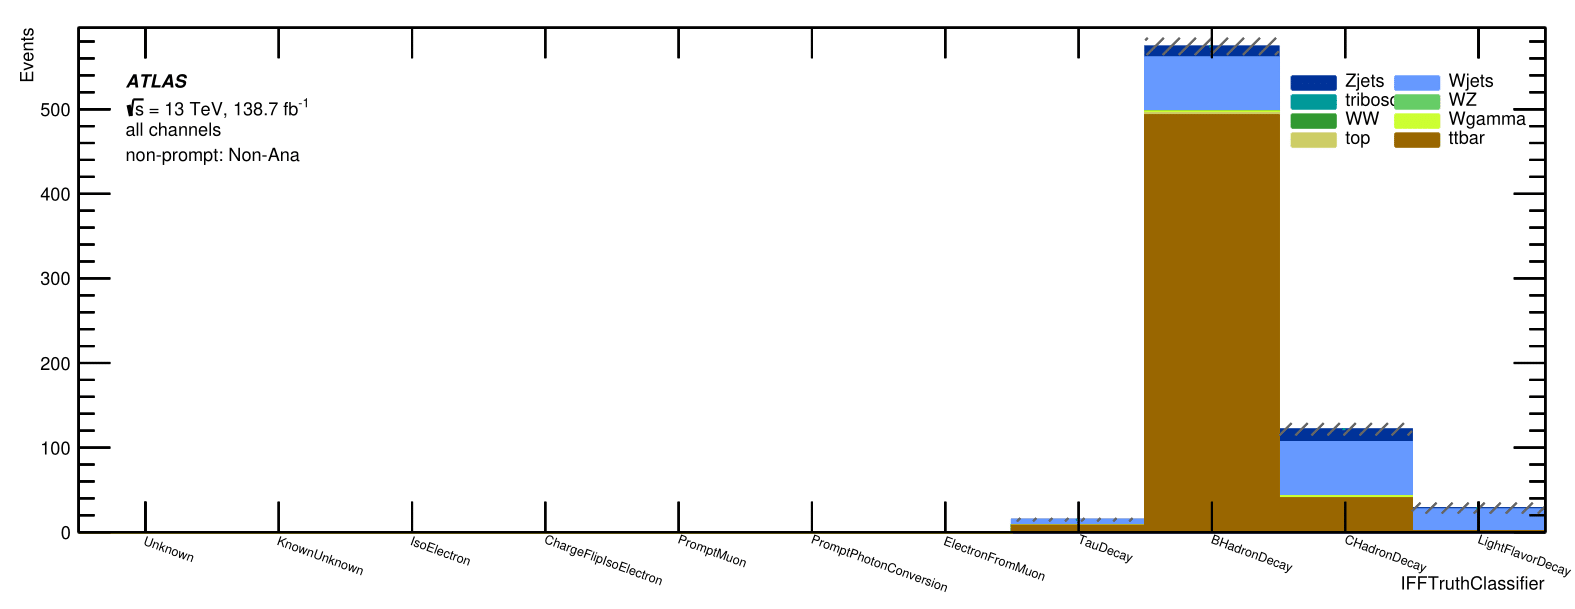
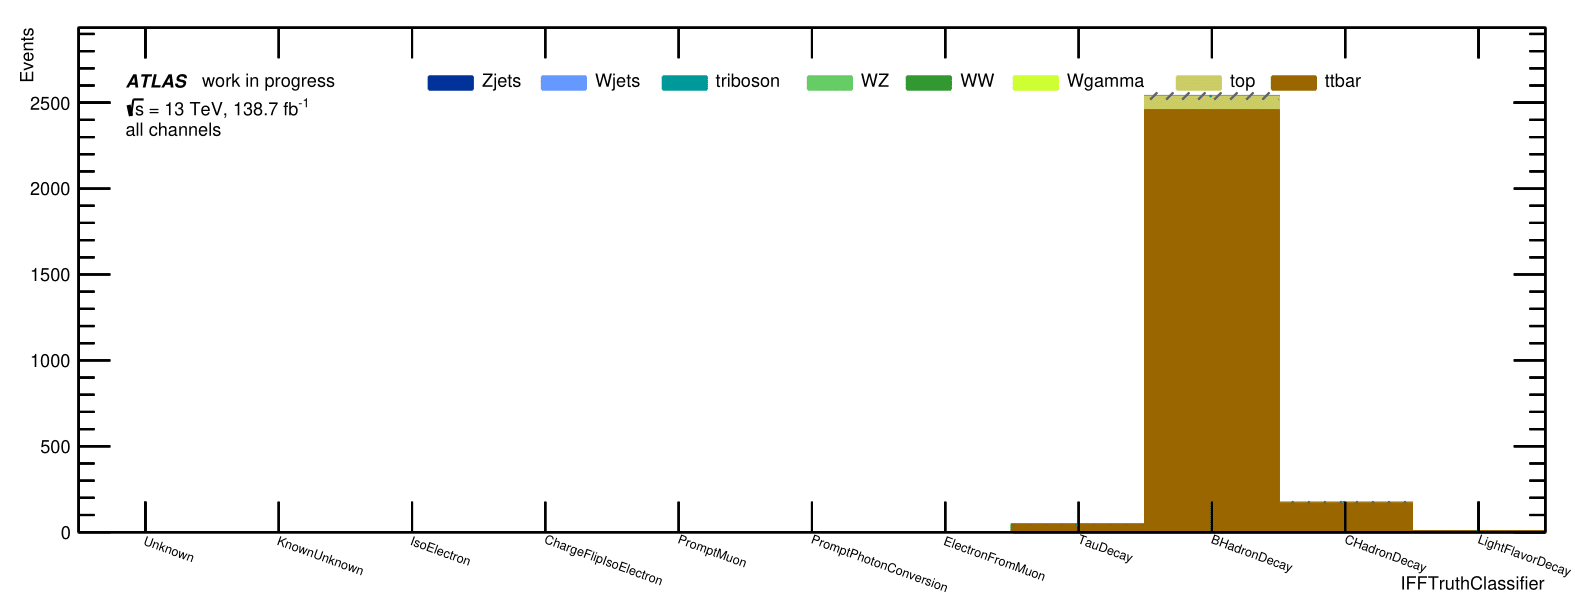
Non-prompt muons in the signal region originate almost exclusively from \(b\) quarks coming from \(t\bar{t}\) events.
\text{non-prompt!}
- By requiring both muons to have an identical electric charge we reject a lot of events coming from \(Z+jets\) and \(WZ\) samples.
- Most events will originate from \(t\bar{t}\) and we get a similar composition to that of the signal region.
Motivation
Final selection
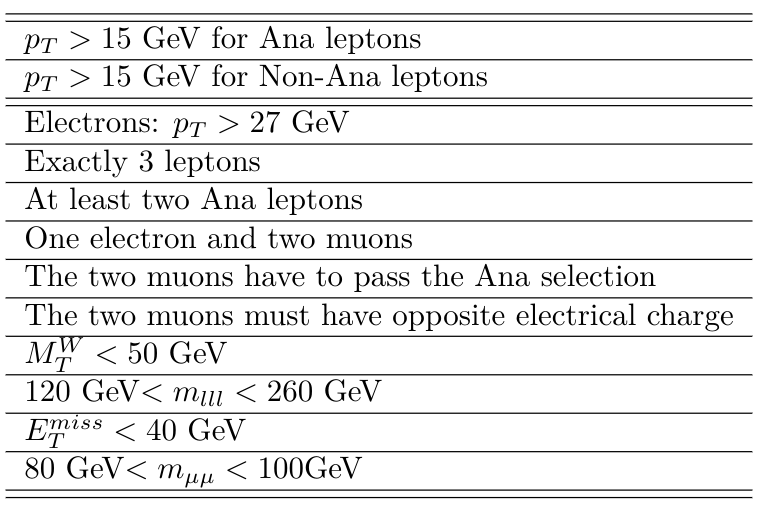
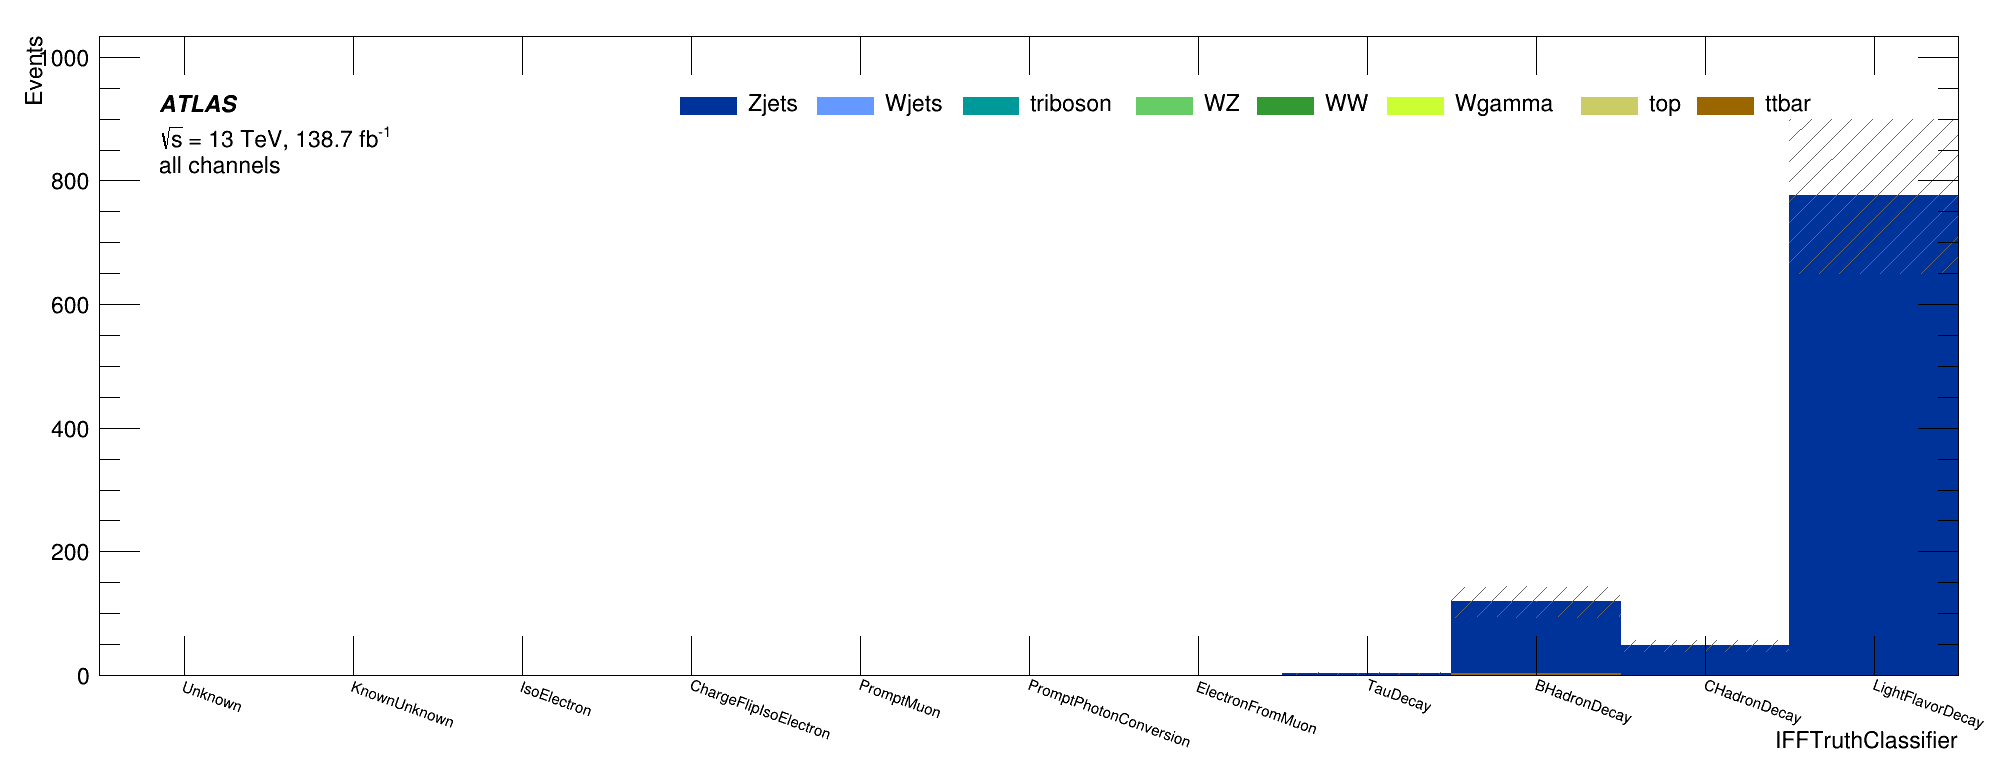
Trilepton Electron Region
Non-prompt electrons in the signal region originate primarily from light flavour jets of \(W+jets\) events. However, it is not possible to achieve that composition using a trilepton region.
That is why we look for a similar composition coming from \(Z+jets\) events.
Final selection
Motivation
Evaluation of the Trilepton muon Region
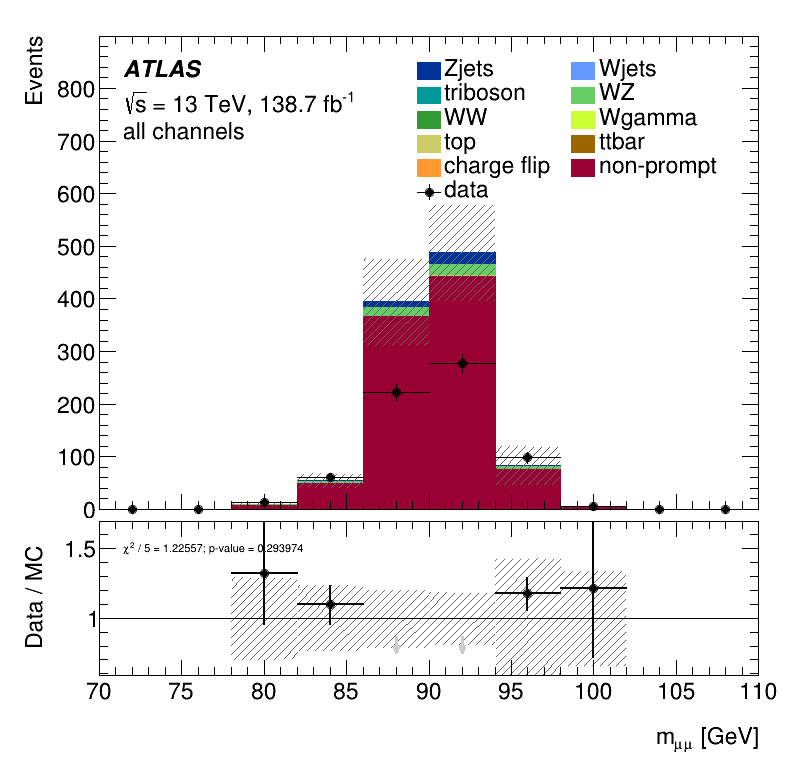
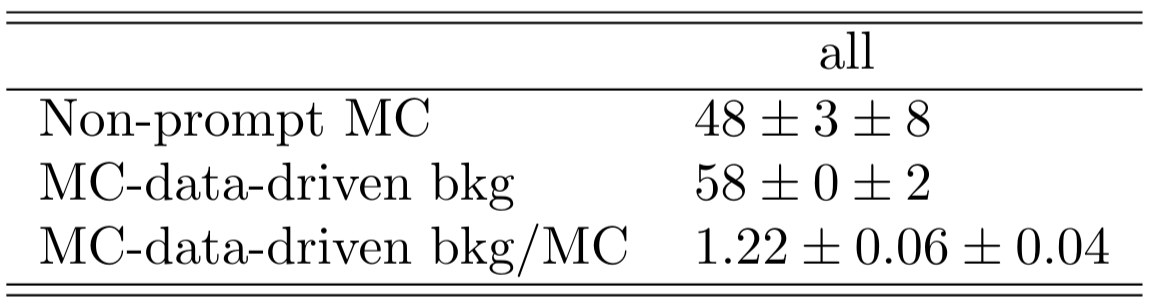
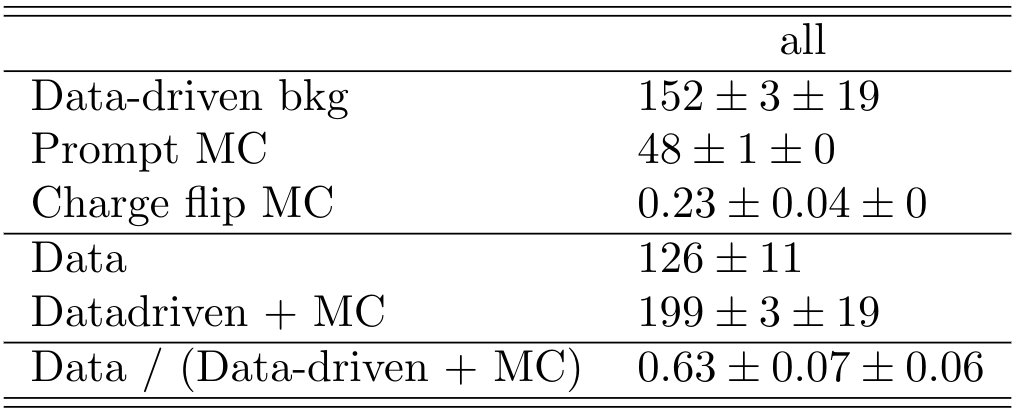
Statistic of the non-prompt muons
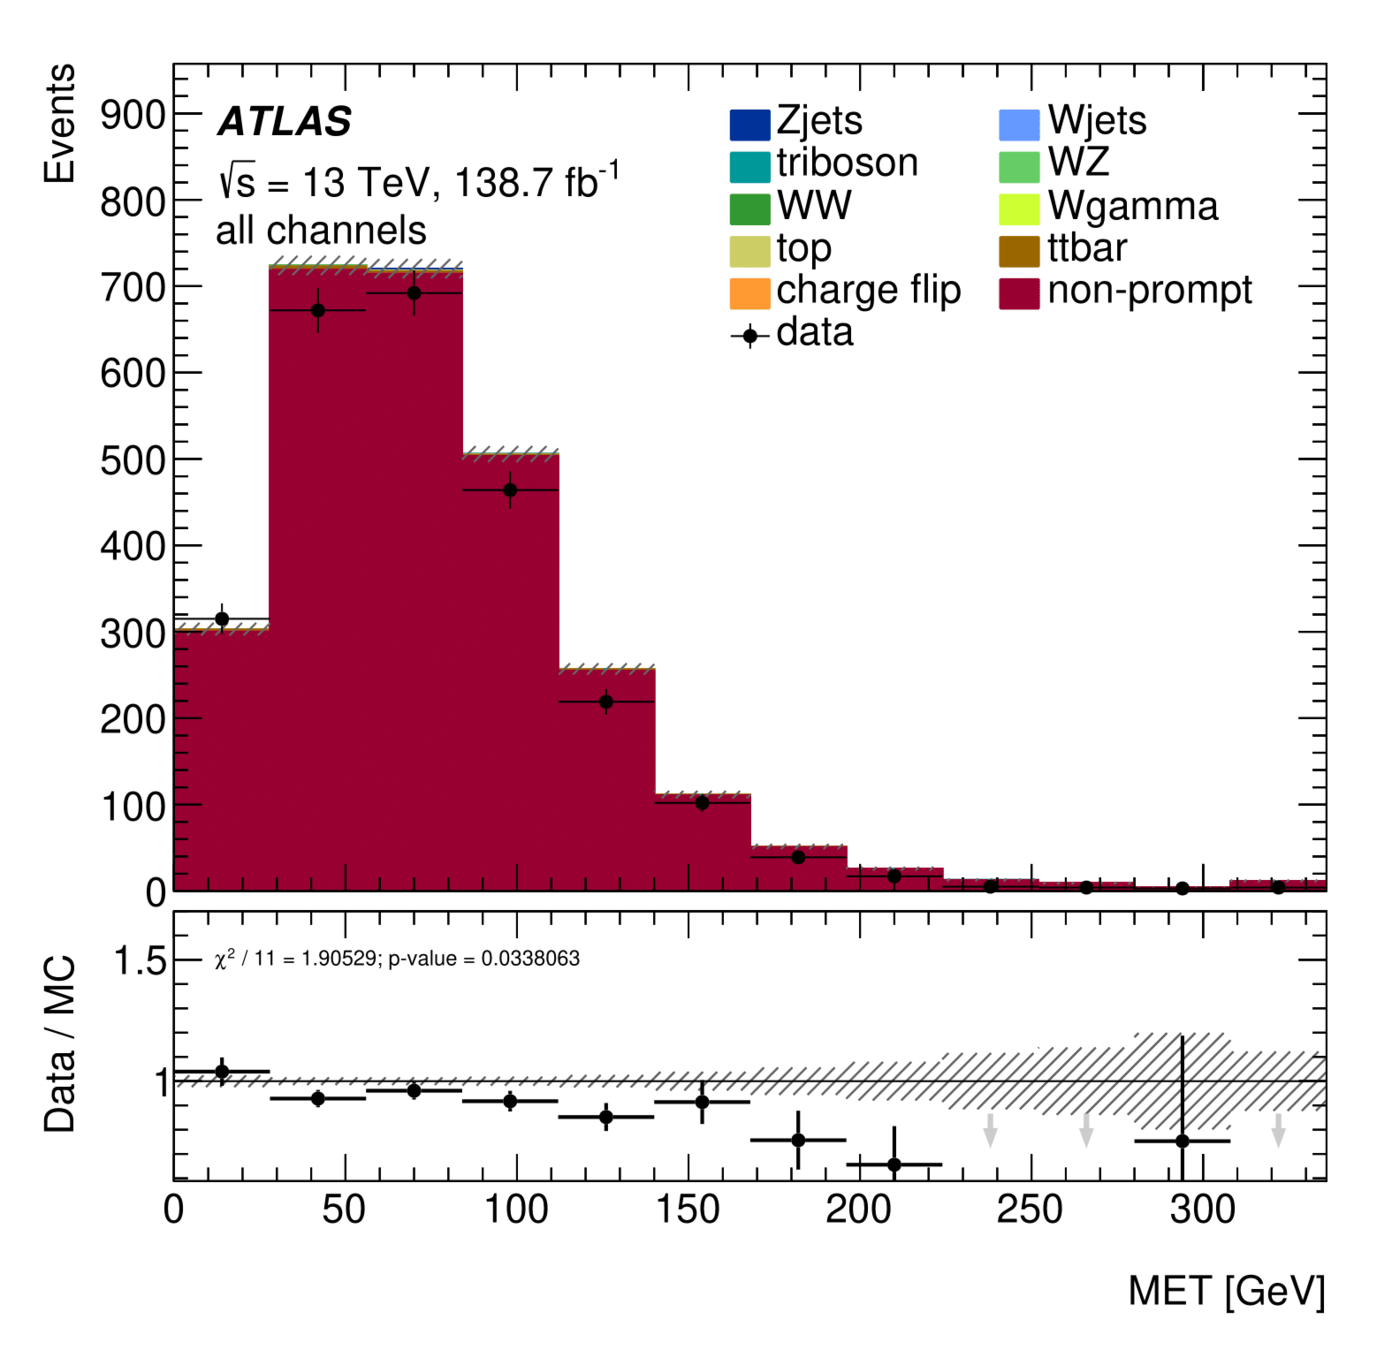
\(E_{T}^{miss}\) distribution for Non-Ana and Ana events
Non-prompt composition
Signal Region
Trilepton muon Region

Evaluation of the Trilepton Electron Region
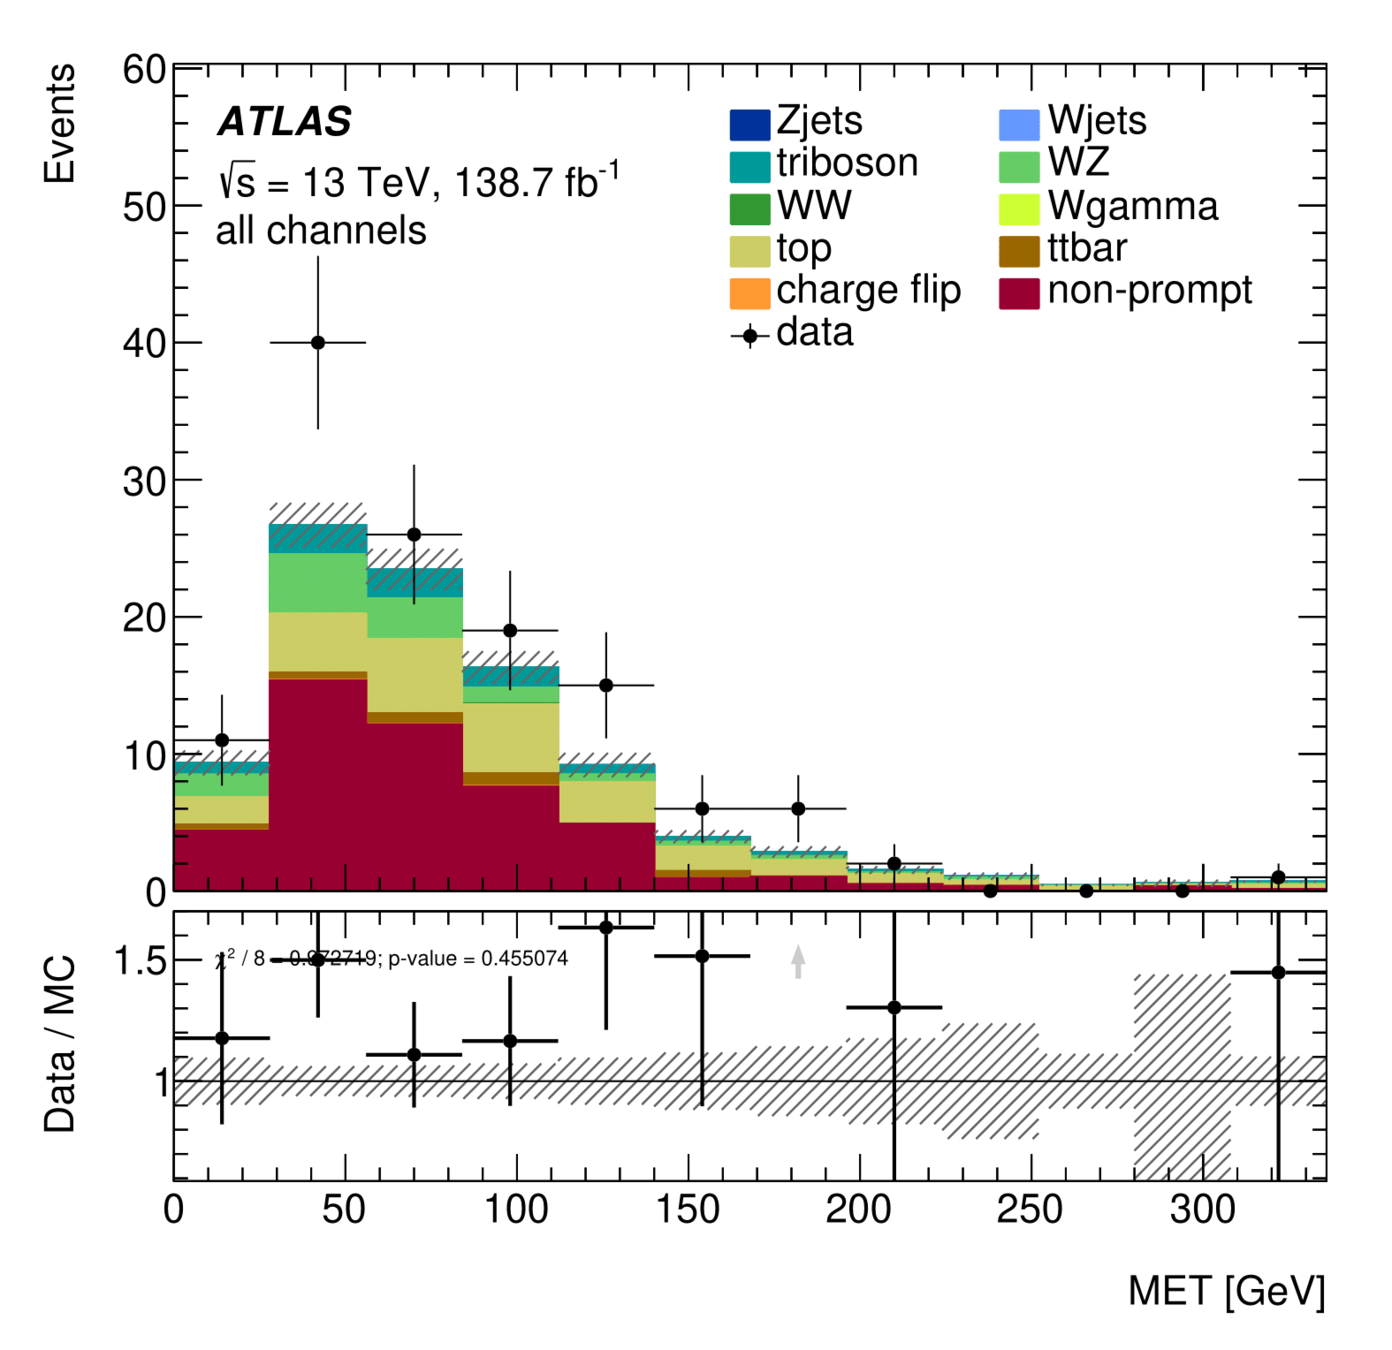
\(m_{\mu\mu}\) distribution for Non-Ana and Ana events
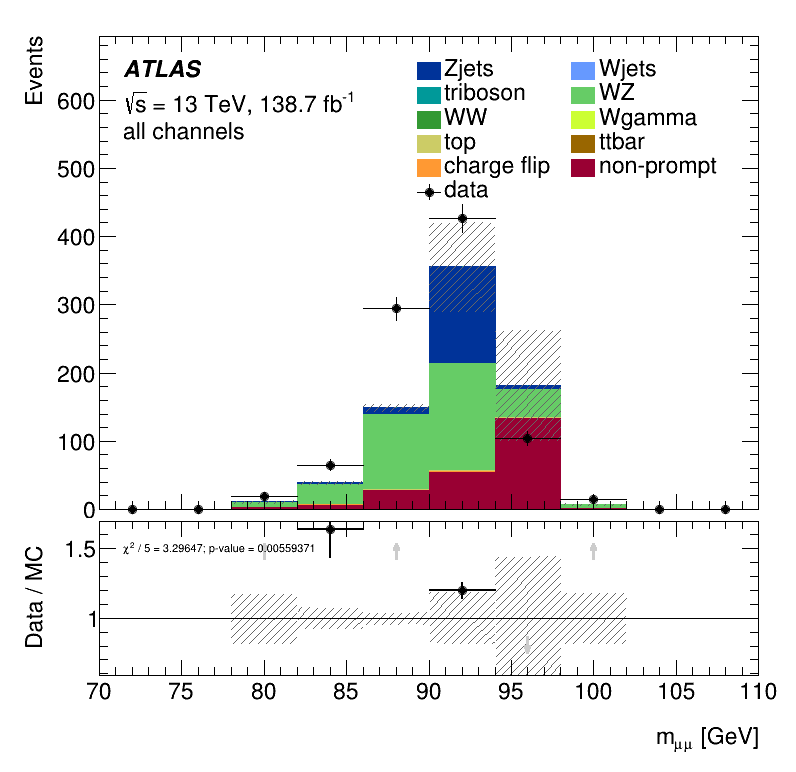
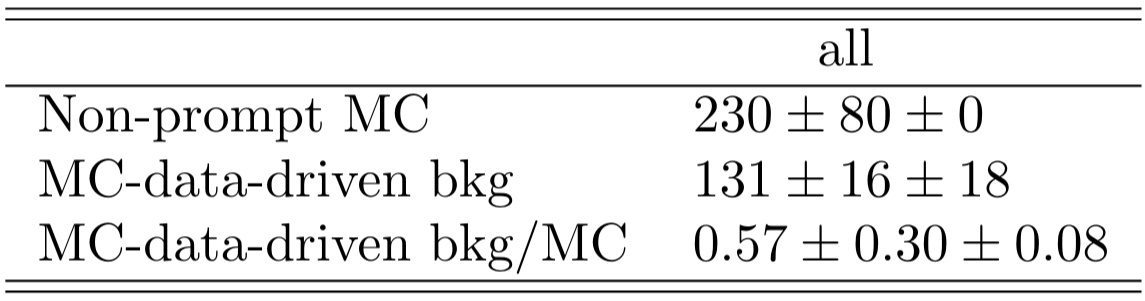
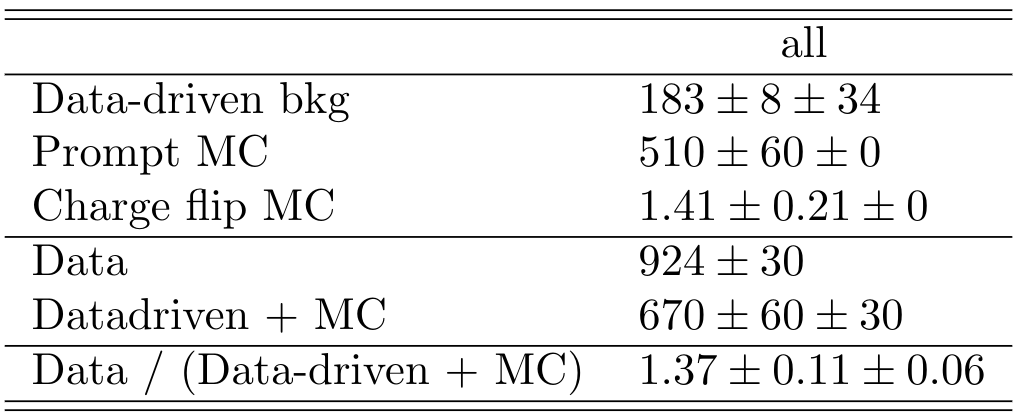
Statistic of the non-prompt electrons
Non-prompt composition
Signal Region
Trilepton electron Region
- The fake factor is extracted from MC in control region and then applied to MC in the Validation Region.
\boxed{ N_{A}^{\text{non-prompt MC}} = N_{N}^{\text{non-prompt MC}}\cdot F^{\text{MC CR}}}
Closure Tests
Monte Carlo closure test
- The \(N_{A}^{\text{non-prompt}}\) estimate given by the MC-data-driven method is compared to \(N_{A}^{\text{non-prompt}}\) which are actually non-prompt according to the MC truth level information (Non-prompt MC).
Data closure test
\boxed{ N_{A}^{\text{non-prompt}} = (N_{N}^{\text{data}}-N_{N}^{\text{prompt MC}})\cdot F^{\text{data CR}}}
- The fake factor is extracted from data in the control region and then applied to data in the validation region.
It is investigated how well the collision data is modellled by the sum of the Monte Carlo predictions for the prompt background and the non-prompt background estimated by the data-driven technique.
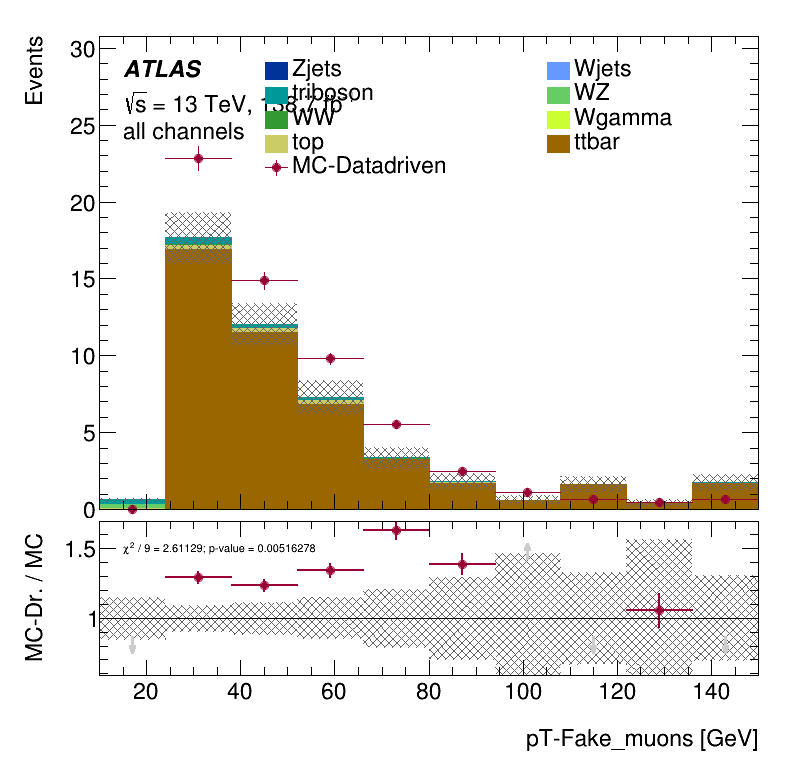
The number of non-prompt events estimated by MC-data-driven in this region is singificantly above the MC events according to truth-level information.
\(p_{T}\) distribution for non-prompt muons
Trilepton muon region
Results Monte Carlo Closure Tests
Trilepton electron region
The number of MC-data-driven events is notably below the MC events according to truth-level information.
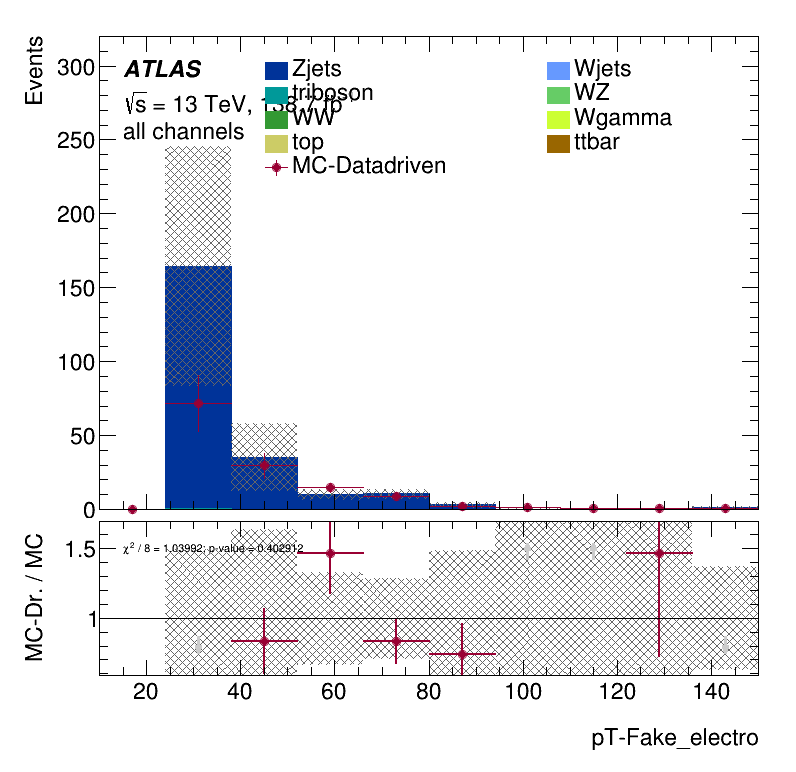
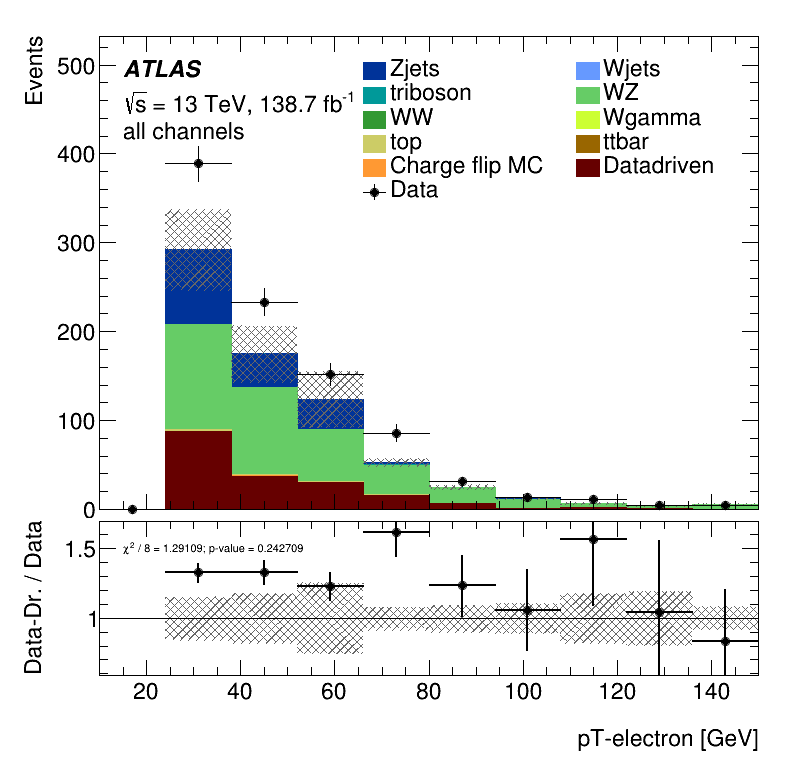
\(p_{T}\) distribution for non-prompt electrons
The result found in the MC closure is confirmed here. It is clear a not negligible overestimation of data.
\(m_{lll}\) distribution
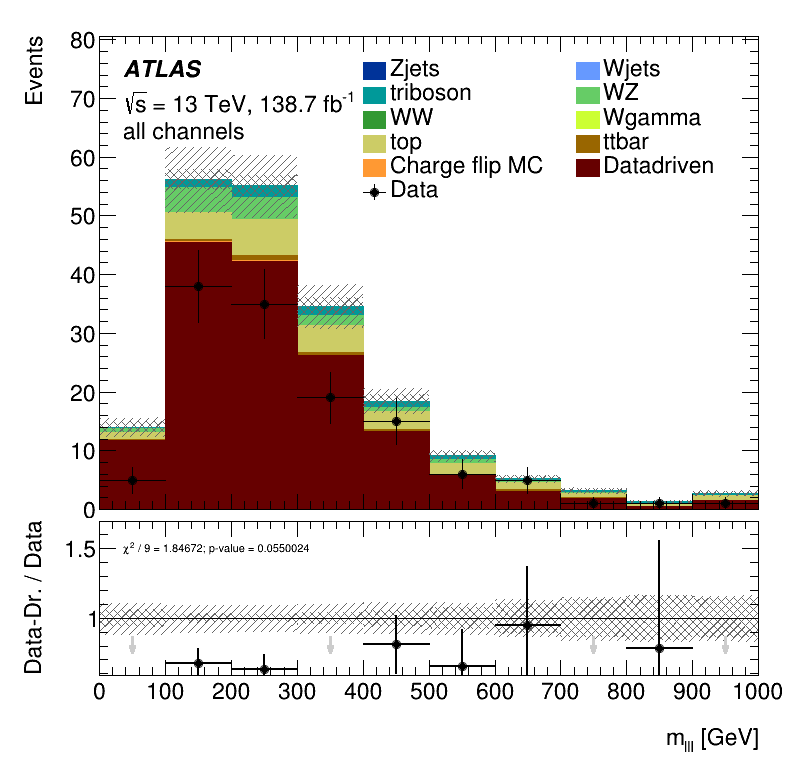
Results Data Closure Tests
Trilepton muon region
Trilepton elecrton region
It is clear a significant underestimation of the data. This underestimation is approximately a factor two in the non-prompt estimate.
Electron \(p_{T}\) distribution
Conclusion and Outlook
- Since there were found significant deviations with the data, it is necessary to check again the whole procedure followed in the control region before an application in the signal region.
- Some of the mismodelling found could be attributed to differences between the composition of these validation regions and that of the signal region.
- Given that we are considering validation regions with three leptons and the fake factors are extracted from a dilepton region, it is necessary to make additional adjustments in the set up. Even so the regions have very different selections and to have a perfect modelling could be rather difficult.
- The closure observed in the LowMjj region could be due to a compesation between the underestimation for electrons and the overestimation for muons found in the trilepton regions.
[LA-CoNGA] Presentation Bmanga
By Sebastian Ordoñez


