Adapting the Kraken Map Visualization for a Generic Use
Master Basis Module
Sebastian Schrepfer
Overview
-
Changes
-
Multiple data sets
-
New interface
-
Further changes
-
-
Performance testing
-
Future work
-
Demonstration
live slides: http://goo.gl/26m4pm

Changes
What is new?
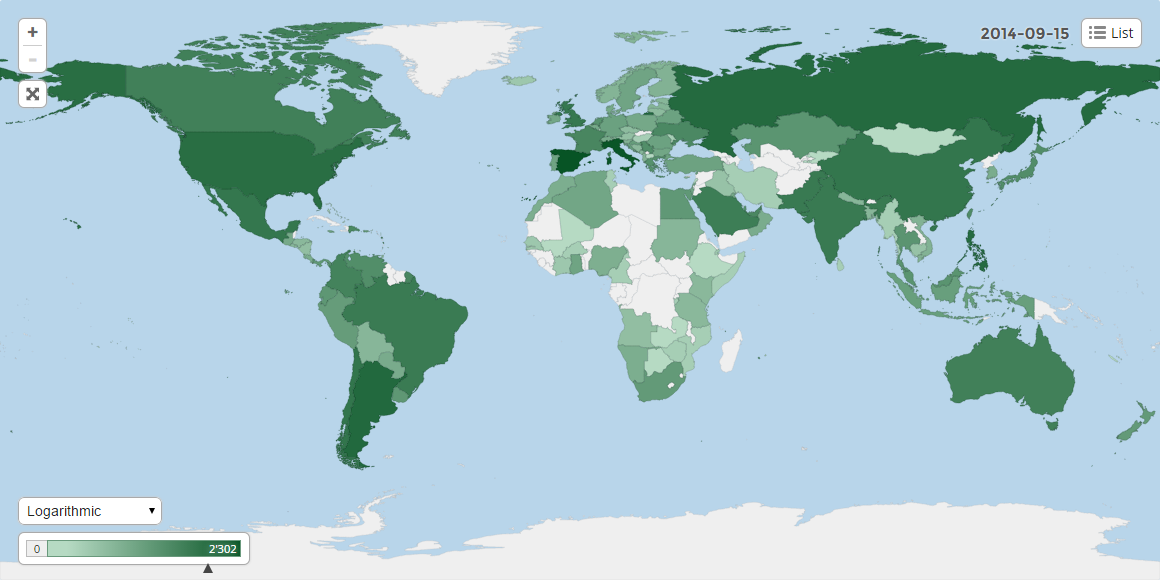
old map
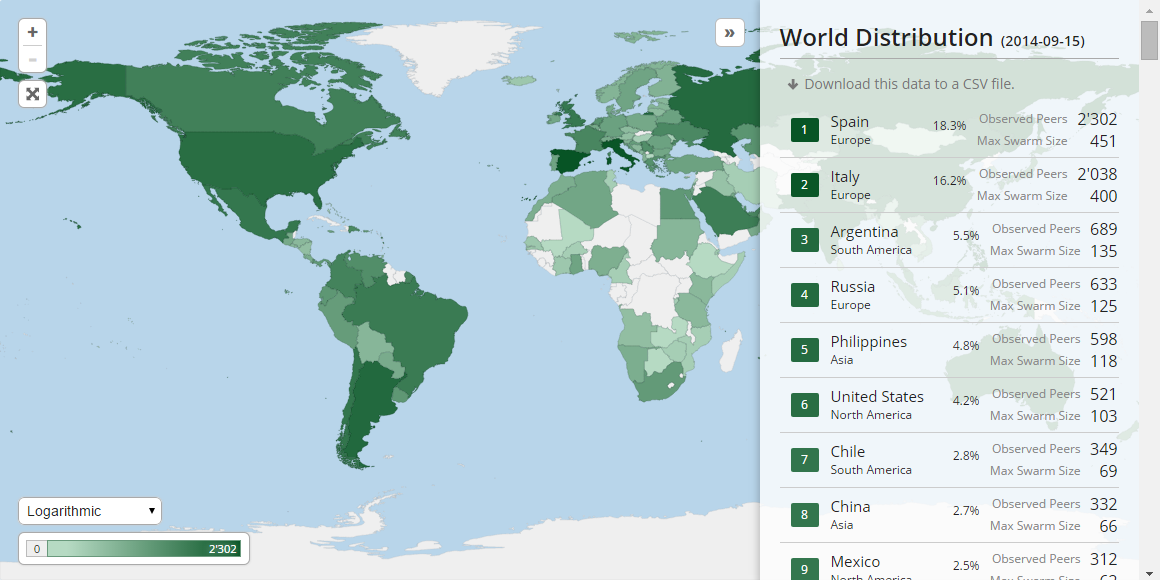
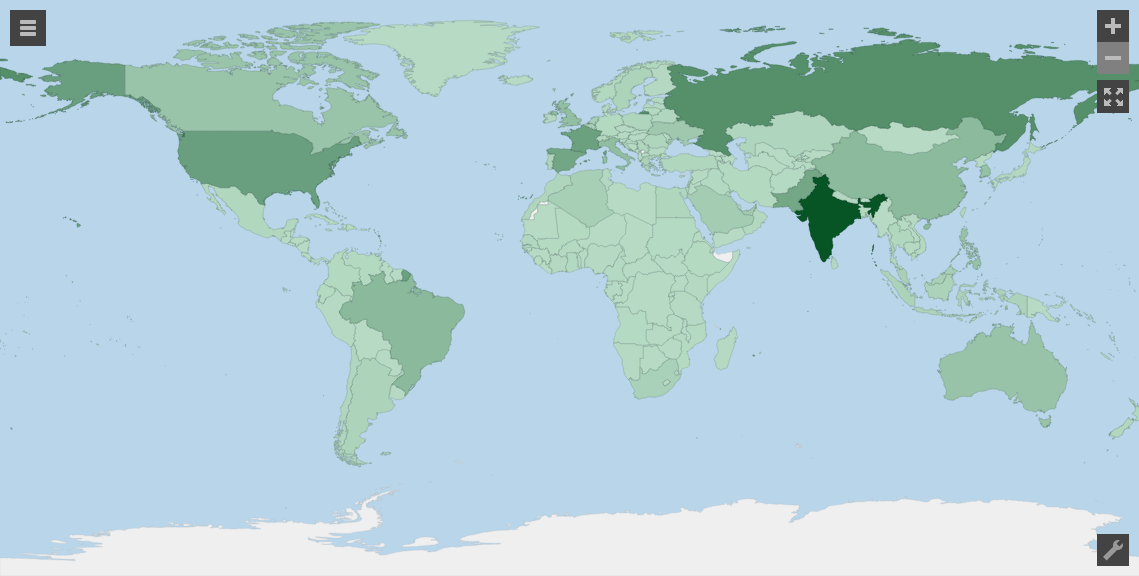
new map
What did change?
Multiple data sets
Multiple data sets
-
Multiple data sets can be displayed in one map
-
Data sets can be switched inside the map (configuration buttons)
-
The map list is able to display all sets
-
The list can be switched with tabs
New interface
Interface
-
Simple configurational API interface
-
No HTML required anymore
-
Simple JavaScript call initializes map
-
Everything is configurable (language, styles, etc.)
How to start?
/* include all dependencies and the library itself */

var configuration = {
  map: "/files/map.json",
  data: "/api/data.json",

  /* many more properties available for styling,
     labels, controls disabling, etc.
     docs on github.com/ssc-hrep3/geochart.js */

};

var chart = geochart.generate(configuration);
The data object
{
  "types": [
    {
      "type": "AVG_RESP_TIME",
      "label": "Average Response Time",
      "unit": "ms"
    }, {
      "type": "OBSRVD_PEERS",
      "label": "Observed Peers"
    }
  ],
  "countries": {
    "CH": {
      "label": "Switzerland",
      "continent": "Europe",
      "values": {
        "AVG_RESP_TIME": 10,
        "OBSRVD_PEERS": 753
      }
    },
    "US": {
      ...
    },
    ...
  }
}
The API
var configuration = {
  map: "/files/map.json",
  data: "/api/data.json",
};

var configuration_2 = {
  map: "/files/map.json",
  data: "/api/other-data.json"
};

var chart = geochart.generate(configuration);

/* Use the following calls on another place,
   e.g. after a click */
chart.setConfig(configuration_2);
chart.destroy();
Further Changes
Further Changes /1
-
Generic server-side implementation
-
No programming, just configuration required
-
Adherence to database schema is crucial
-
-
Removal of Kraken depending code
-
New Build (Ant/Maven → Grunt)
-
Bugs removed (e.g. Drag&Drop Bug)
-
Waiting spinner (in plain CSS)
-
New Code Structure/Cleaned up
Further Changes /2
-
CSS class prefix "gc-"
-
Real Fullscreen mode
-
Supports multi-language
-
Configuration is hidden behind buttons
-
Color Transitions/Animations
-
...much more smaller improvements
Performance
Performance Evaluation
Loading σ: 85.6ms
Loading Ø: 2553ms
Performance Evaluation
1. Creating DOM structure, etc.
2. Ajax call to local map file
3. Ajax call to local data file
4. Conversion from TopoJSON to GeoJSON
5. Generating overlay elements
6. Merging raw map with data object
7. Generating SVG element
Ø 10ms
Ø 56ms
Ø 52ms
Ø 155ms
Ø 12ms
Ø 767ms
Ø 1498ms
σ 0.9ms
σ 14.2ms
σ 9.9ms
σ6.5ms
σ21.2ms
σ 10.9ms
σ 65.9ms
Future work
Future Work
-
Adapt world map to only parts of the world (e.g. cantons of Switzerland)
-
works already rudimentary, viewport settings need to be improved
-
-
Decrease the loading time by adding tiles
-
Decrease the number of dependencies (e.g. jQuery, moment)
-
Increase the API size (i.e. increase the number of methods provided)
Demonstration
Improved User Interface:
- Cleaned up surface with dark buttons
- Pure CSS icons (no graphics)
- Custom scroll bar
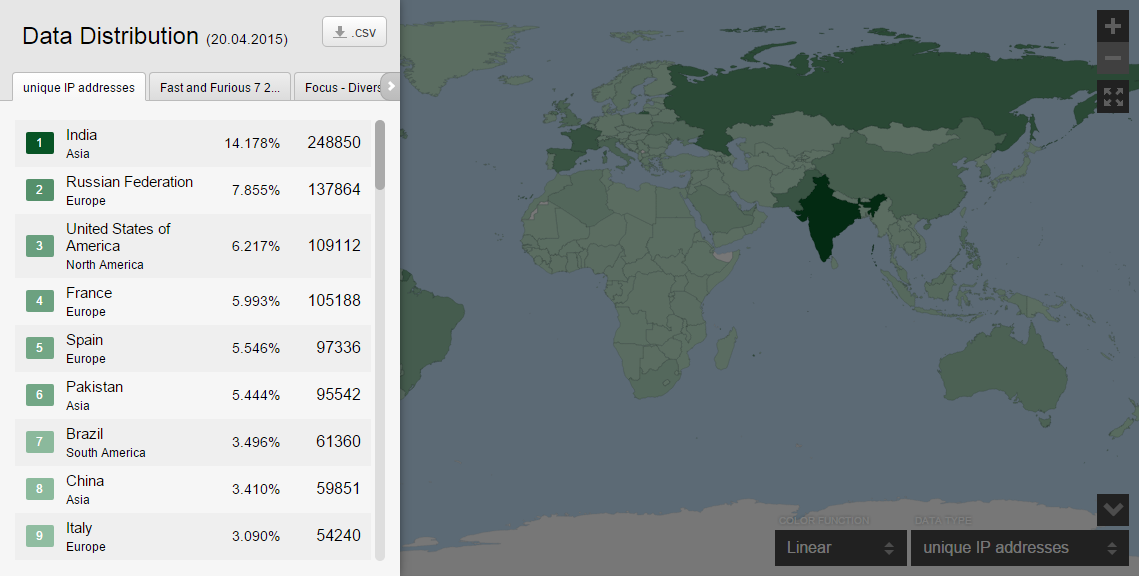
Multiple Data Sets:
- Switch current data set in configuration
- Display data set in list and switch data set
- Color Transitions instead of map reload
Full Screen & Spinner
- Spinner while loading and going to full screen
- Full screen API
Single Country Info
- now closable by country click or small '×'
Adapting the Kraken Map Visualization for a Generic Use
Master Basis Module
Sebastian Schrepfer
Master Basis Module Presentation
By S.S.