D3.js
Data-Driven Documents
What is D3.js?
D3 allows you to bind arbitrary data to a Document Object Model (DOM), and then apply data-driven transformations to the document
Cons:
- Modern Browsers only (IE9+)
- learning curve
Pros:
- Size is "good" - 78kb
- fast manipulation of DOM
- support large datasets
- interaction
- animations
D3 is about:
enter, update, and exit
...and selections.
Selection API methods
#foo        // <any id="foo">
foo         // <foo>
.foo        // <any class="foo">
[foo=bar]   // <any foo="bar">
foo.bar     // <foo class="bar">
foo#bar     // <foo id="bar">
Selections returned are always Arrays containing DOM elements.
d3.select(selector)
This method finds and returns a single element, the selection they act upon.
// returns first descendant DOM element found
let chart = d3.select('.chart');


// returns first descendant DOM element found
let dev = d3.select('div');
selector is a CSS-Selector style string, e.g. 'p', '.class', or '#unique-identifier'
d3.selectAll(selector)
// returns all <p> DOM elements
let paragraphElements = d3.selectAll('p');

// returns all elements that have .bars as a class value
let bars = d3.selectAll('.bars');
This method finds and returns a single element, the selection they act upon.
selector is a CSS-Selector style string, e.g. 'p', '.class', or '#unique-identifier'
Using .select() and .selectAll()
on selections returned by previous d3 selections
selecting on selections
// get a selection
let paragraphElements = d3.select('.chart');

// use .selectAll() on the previous selection, yea!
let bars = paragraphElements.selectAll('.bars');

// example of chaining selection methods
let tableRows = d3.select('.my-table').selectAll('tr');
Methods for use on selections
// return value from d3.select() or d3.selectAll()
// will be referred to as 'selection' from this point on

let selection = d3.select('.chart');
let selection2 = d3.selectAll('p');selection.filter()
/** using .filter with CSS-Selector style
 *
 * select all <tr> elements of '.my-table' element and
 * filter out odd rows returning only even rows
 *
**/
let paragraphElements = d3.select('.my-table')
    .select('tr')
    .filter(':nth-child(even)');
/**
 *
 * using .filter with a function
 * `d` argument is each <tr> element found
 * `i` argument is the index position of the current `d`
 *
**/
let paragraphElements = d3.select('.my-table')
    .select('tr')
    .filter(function(d, i) {
        return i % 2 === 0;
});selection.merge()
// UPDATE
var circle = svg.selectAll("circle").data(data)
    .style("fill", "blue");

// EXIT
circle.exit().remove();

// ENTER
circle.enter().append("circle")
    .style("fill", "green")
  .merge(circle) // ENTER + UPDATE
.style("stroke", "black");more clarity when we talk about data-joining
a note on the function argument
var circle = svg.selectAll("circle").data(data)
    // `d` is the data
    // `i` is the index position of the current `circle` element inside of the group selection
    // `nodes` is the group selection of all `circle elements
    .style("fill", function(d, i, nodes) {
        return
    });
3 Arguments:
`d` - data value mapped to element
`i` - index of current element
`nodes` - entire group of elements
Attribute Modification
selection.attr(name, [, value])
let paragraphElements = d3.select('.my-table')
    .selectAll('tr')
    .filter('nth-child(even)')
    .attr('even-row', 'true'); // each <tr> gets the same value
value can be a constant value
e.g. "a-helpful-label".
selection.attr(name, [, value]) continued...
value can be a function when you need a computed value instead of a constant value.
let data = [
    {
        name: 'Pie',
        votes: 1337
    },
    {
        name: 'Cake',
        votes: 2593
    }
];

let paragraphElements = d3.select('.my-table')
    .selectAll('tr')
        .data(data).append('tr')
    .attr('name', function(d, i, nodes) {

        // attach a value based on the data bound(or will be bound) to the element
        return data.name;
});selection.style(prop, [, value])
let paragraphElements = d3.select('.my-table')
    .selectAll('tr')
    .filter('nth-child(even)')
    .style('background-color', 'salmon'); // each <tr> gets the same value
prop must be a String of a valid CSS property for the element.
value can be a constant value e.g. "#000FFF" or "30px".
caveat: use .style() when you need a value through computation otherwise add a class to the element and take advantage of CSS (through external stylesheet).
selection.style(prop, [, value]) continued...
value can be a function when you need a computed value instead of a constant value.
let data = [
    {
        name: 'Pie',
        votes: 100
    },
    {
        name: 'Cake',
        votes: 150
    }
];

let paragraphElements = d3.select('.my-table')
    .selectAll('tr')
        .data(data).append('tr')
    .style('background-color', function(d, i, nodes) {

        // <tr> elements with larger votes data will
        // appear "more red" then ones will a lower vote count
        return `rgb(${d.votes + 100}, 0, 0)`;
});selection.property(name, [, value])
use this for properties in which you cannot set with .attr(). A checkbox element's `checked` property is one example, another is an input field's `value` property.
selection.text(value)
value can be a constant value e.g. "#000FFF" or "30px".
let data = [
    {
        name: 'Pie',
        votes: 100
    },
    {
        name: 'Cake',
        votes: 150
    }
];

let paragraphElements = d3.select('.chart')
    .selectAll('div')
        .data(data).append('div')
    .style('background-color', function(d, i, nodes) {
        return `rgb(${d.votes + 100}, 0, 0)`;
    })
    .text(function(d) {
        // compute name via `name` property of the data bound
        // to element
        return d.name;
});selection.append(value)
value can be a constant value e.g. "div" or a Function.
// usual use case
d3.selectAll("p").append('div');


// same as above
d3.selectAll("p").append(function() {
  return document.createElement("div");
});

// same as above
d3.selectAll("p").append(function() {
  return this.appendChild(document.createElement("div"));
});
This method, after appending, will return the appended elements as a selection.
selection.append(value) continued...
// select all <section> elements
var section = d3.selectAll("section");

// add an <h1> element to each <section>
var h1 = section.append("h1"); // .append() returns all <h1> elements
h1.text("Hello!");selection.remove()
removes the selection from the DOM
// removes all <p> elements from within the '.chart' element
d3.select('.chart').selectAll("p").remove();


// remove single element '#legend' from within the '.chart' element
d3.select('.chart').select("#legend").remove();(RTFM)
Data
Selections return Arrays of DOM elements
Data should be an Array
Coincidence? No.
Data looks like...
// an array of numbers works
let data = [1, 2, 3, 4, 5, 6];
// A scatterplot, perhaps?
var data = [
{x: 10.0, y: 9.14},
{x: 8.0, y: 8.14},
{x: 13.0, y: 8.74},
{x: 9.0, y: 8.77},
{x: 11.0, y: 9.26}
];D3 has no method for creating elements
Instead, it provides a pattern for managing the mapping from data to elements. The way to create elements from scratch is a special case of the more generalized form.
svg.selectAll("circle")
    .data(data)
  .enter().append("circle")
    .attr("cx", x)
    .attr("cy", y)
    .attr("r", 2.5);
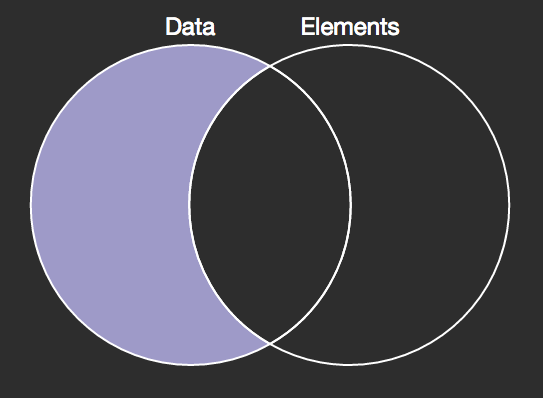
We want the selection “circle” to correspond to data.
Data-Join
.data() and .enter()
New data, for which there were no existing elements.

.data() and .enter() continued...
When initializing data you may omit update and exit patterns
// <circle> is empty. .data() attempts to
// bind each datum to a <circle> element.
// at first there are no <circle> elements
// so the leftover data will be passed to .enter() below

let circle = svg.selectAll("circle")
    .data(data);

// calling .append() on .enter() will create new elements
// for data leftover from the .data() joining above.

circle.enter().append("circle");
Data-Join
updating data
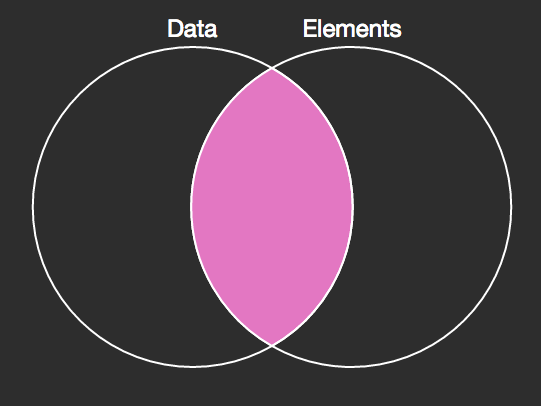
New data that was joined successfully to an existing element.

updating continued...
    let circle = svg.selectAll("circle")
        .data(data)
        .attr('cy', (data) => {
            return data.y;
        })
        .attr('cx', (data) => {
            return data.x;
        })
        .attr("r", 2.5);
When updating data you may omit enter and exit patterns
Data-Join
exiting data
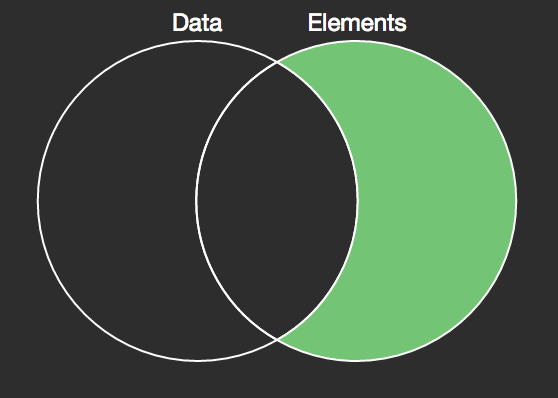
Existing elements, for which there were no new data.

exit continued...
    let circle = svg.selectAll("circle")
        .data(data)
        .attr('cy', (data) => {
            return data.y;
        })
        .attr('cx', (data) => {
            return data.x;
        })
        .attr("r", 2.5);

    // elements leftover, if any, will be available at .exit()
    // you can use .remove()
    // you can also add transitions here
    circle.exit().remove();
When updating data you may omit enter and update patterns
Creating
an HTML Bar Chart
The HTML
    <!DOCTYPE html>
    <html lang="en">
    <body>

        <div class="bar-chart"></div>

        <script src="..path/to/file.js"></script>
    </body>
    </html>
The Data
    let data = [
        {name: 'pizza', votes: 7},
        {name: 'salad', votes: 16},
        {name: 'Ahi Bowl', votes: 9},
        {name: 'Soup', votes: 4},
        {name: 'Pirosky', votes: 3}
    ];
The JavaScript
    let chart = d3.select('.bar-chart')
        .selectAll('div')
            .data(data)
        .enter().append('div')
        .style('width', (d) => {
            return d.votes;
        })
        .text((d) => {
            return d.name;
        });
Test code before moving on!
// select the parent element for the chart
let chart = d3.select('.bar-chart')
    // ..of that selection, bind data to existing <div> elements
    .selectAll('div')
        .data(data)

    // data which needs NEW elements are passed to .enter()
    // .append() creates a new element and binds data to it
    .enter().append('div')

    // ...now we can style all <div> elements
    // based on the bounded data
    .style('width', (d) => {
        return d.votes;
    })
    .text((d) => {
        return d.name;
    });
Code Breakdown
SVG Elements
References
Line Chart with SVGs
D3.js
By Ray Farias
D3.js
- 2,226


