Debugging
and
Profiling
101
by Shadi Sharaf
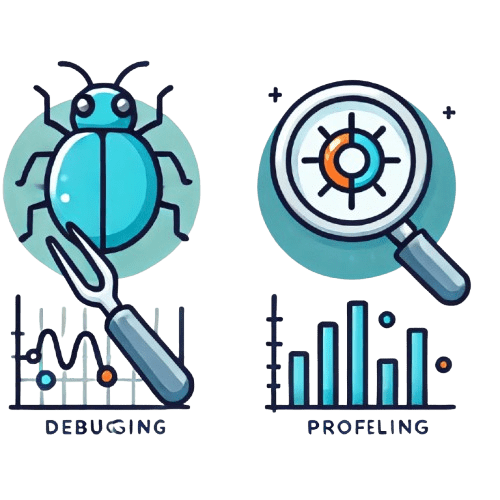
1. Debugging

# Introduction
What is Debugging
"Debugging is the process of finding the root cause of, and possible fixes for a bug."


Software Lifecycle
Bugging
aka: writing code
Debugging
aka: fixing code
80% of time
20% of time
🤖 20% of time
😫 80% of time
# Introduction
Debugging tactics?
# Introduction

Travel to the PAST
- Review logs (debug.log, error_log, NewRelic, etc)
- Log events and data ( our dear old `var_dump()`, `error_log()` and their friends.
aka
Log analysis
# Introduction

Travel to the FUTURE
- Read the code (duh!)
- Use static analysis tools, like PHPStan, PHPMD, PHPCS for PHP, or ESLint, TSLint, JSHint for JS.
aka
Control flow analysis
# Introduction

or my favorite one
SEE INTO THE MATRIX😮
# Introduction
or my favorite one
Stopping
time
# Introduction
Stepping

# Introduction
Stepping
"Stepping (step debugging) refers to the debugging method of executing code one instruction or line at a time.
The programmer may examine the state of the program, machine, and related data before and after execution of a particular line of code."
# Introduction
How does it work?
# Introduction

How does it work?
# Introduction

How does it work?
# Introduction

How does it work?
# Introduction

Xdebug is a PHP extension for debugging and profiling, it's one of a few debugging extensions for PHP, but is certainly the most popular!
# Introduction
2. Installation and Setup
Steps
PHP Extension
- Install
- Configure
- Verify
1.
2.
Triggers
- Browser extension
- Environment variables
3.
Editor
- Extension
- Configuration
# Setup
# Install via PECL
sudo pecl install xdebug

# Enable the extension
sudo -E docker-php-ext-enable xdebug
1. PHP Extension: Installation
# wp-env also has an xdebug flag
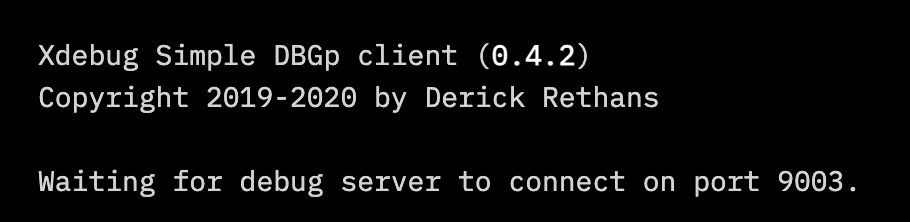
$ wp-env start --xdebug🔗 Official guide: https://xdebug.org/docs/install
# Setup
# Configure xdebug.ini

xdebug.mode=debug
xdebug.start_with_request=trigger
xdebug.client_host={EDITOR_IP_ADDRESS}
xdebug.client_port={EDITOR_XDEBUG_PORT}
1. PHP Extension: Configure
🔗 Official guide: https://xdebug.org/docs/install#related_settings
# Configure xdebug.ini within a docker container

xdebug.mode=debug
xdebug.start_with_request=trigger
xdebug.client_host=host.docker.internal
xdebug.client_port=9003
# Setup
# Verify the extension is setup and active
$ php -i | grep xdebug
1. PHP Extension: Verify
<?php

# Verify the extension is setup and active from a webpage
phpinfo();
# Setup
<?php
# Verify the extension config and status
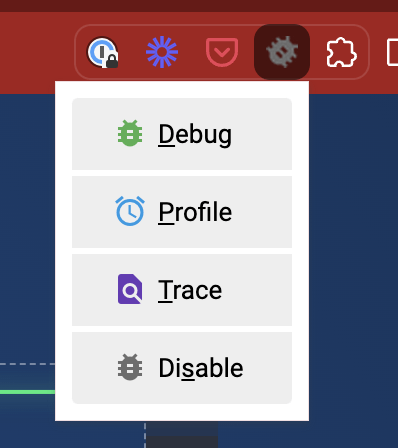
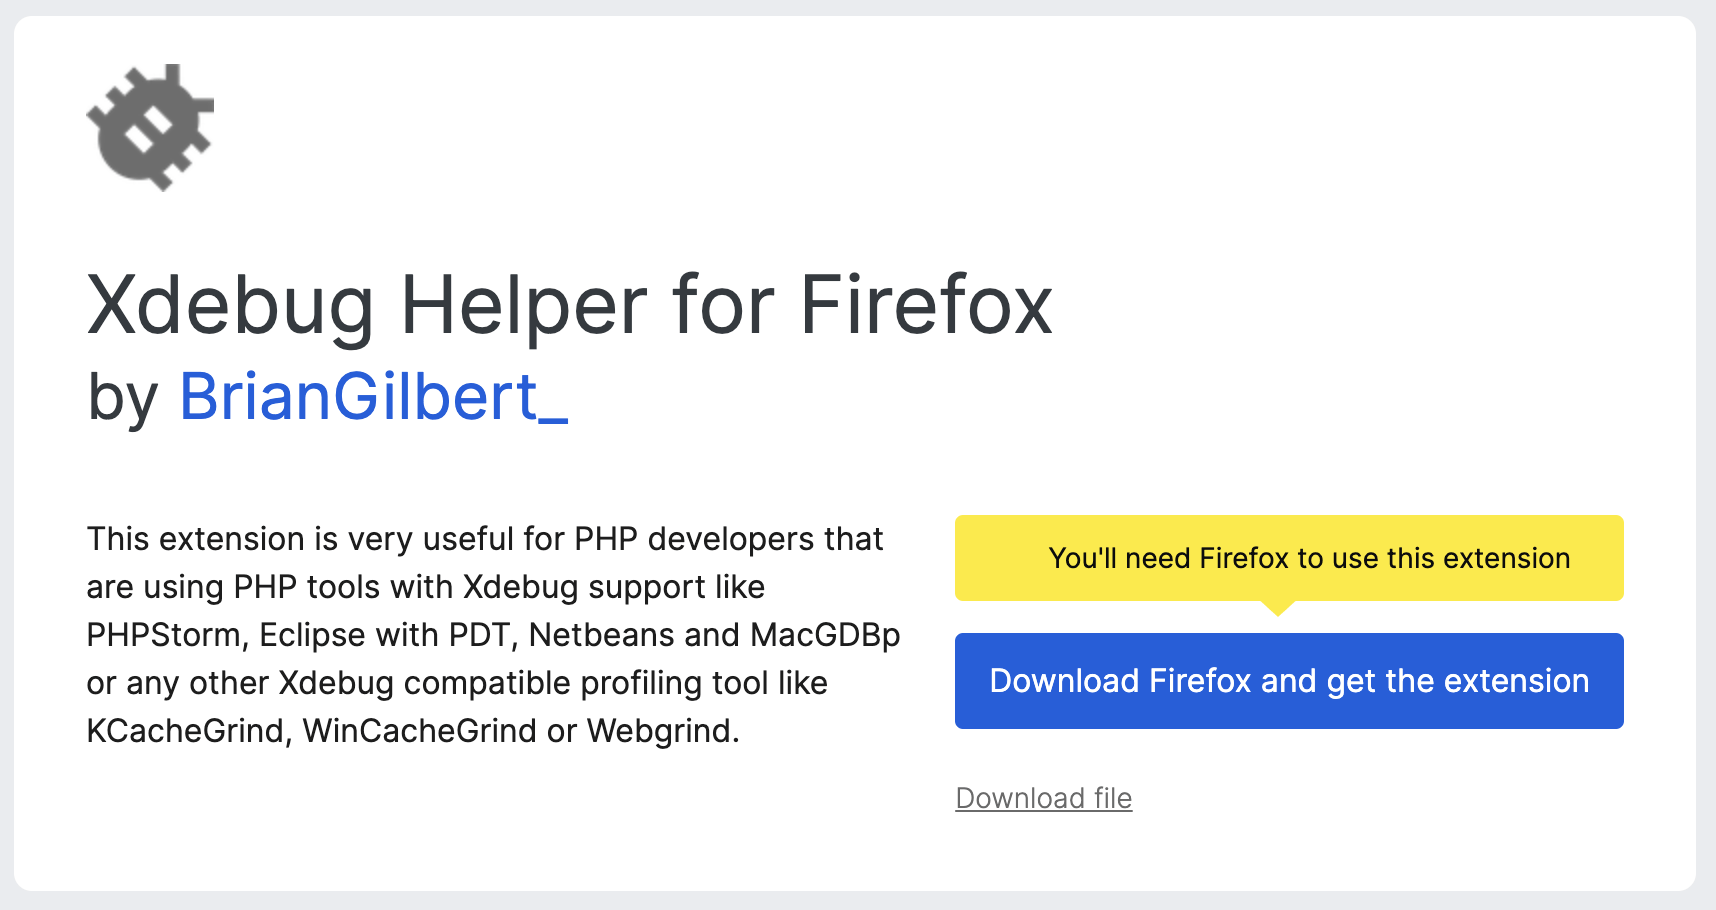
xdebug_info();2. Trigger: Browser extension
# Setup
2. Trigger: Firefox extension
# Setup
2. Trigger: Via URL

🔗 Documentation: https://xdebug.org/docs/all_settings#start_with_request
# Setup
2. Trigger: CLI Env variable
# Add the environment variable in your shell to ALWAYS enable Xdebug

export XDEBUG_TRIGGER=1

# OR use on-demand activation by prefixing the environment variable before your command

XDEBUG_TRIGGER=1 wp my-command

# .. another example, to trigger within phpunit tests

XDEBUG_TRIGGER=1 phpunit
# Setup
2. Trigger: Within code
<?php

function my_function() {
  // ..
  xdebug_break();
  // ..
}
# Setup
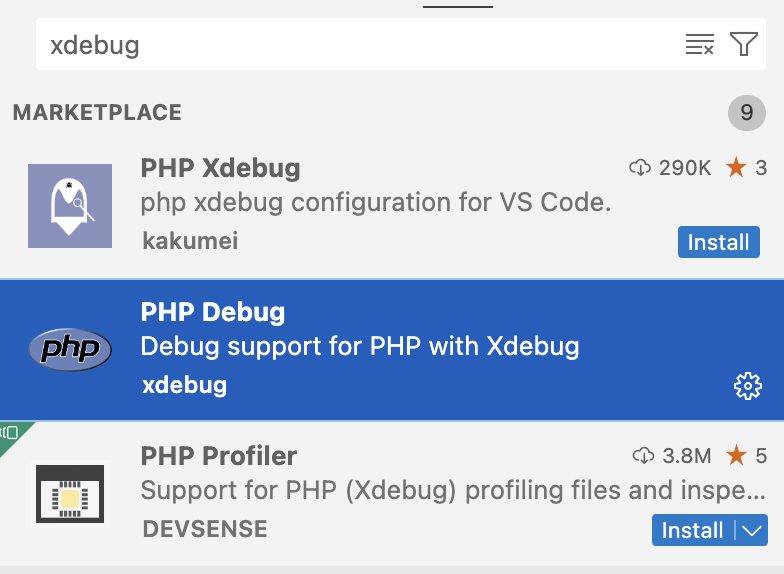
3. Editor: Install extension
🔗 Official guide: https://marketplace.visualstudio.com/items?itemName=xdebug.php-debug
# Setup
3. Editor: Configure extension
{
"version": "0.2.0",
"configurations": [
{
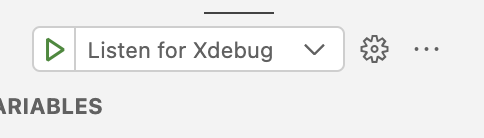
"name": "Listen for Xdebug",
"type": "php",
"request": "launch",
"port": 9003,
}
]
}# Setup
3. Editor: Configure extension
{
    "version": "0.2.0",
    "configurations": [
        {
            "name": "Listen for Xdebug",
            "type": "php",
            "request": "launch",
            "port": 9003,
            "pathMappings": {
                "/var/www/html/": "${workspaceRoot}"
            },
            "maxConnections": 1
        }
    ]
}
# Setup
3. Editor: Configure extension
{
    "version": "0.2.0",
    "configurations": [
        {
            "name": "Listen for Xdebug",
            "type": "php",
            "request": "launch",
            "port": 9003,
            "pathMappings": {
                "/var/www/html/wp-content/plugins/my-plugin": "${workspaceRoot}"
            },
            "maxConnections": 1
        }
    ]
}
# Setup
3. Client: CLI clients
# Setup
3. Interactive debugging
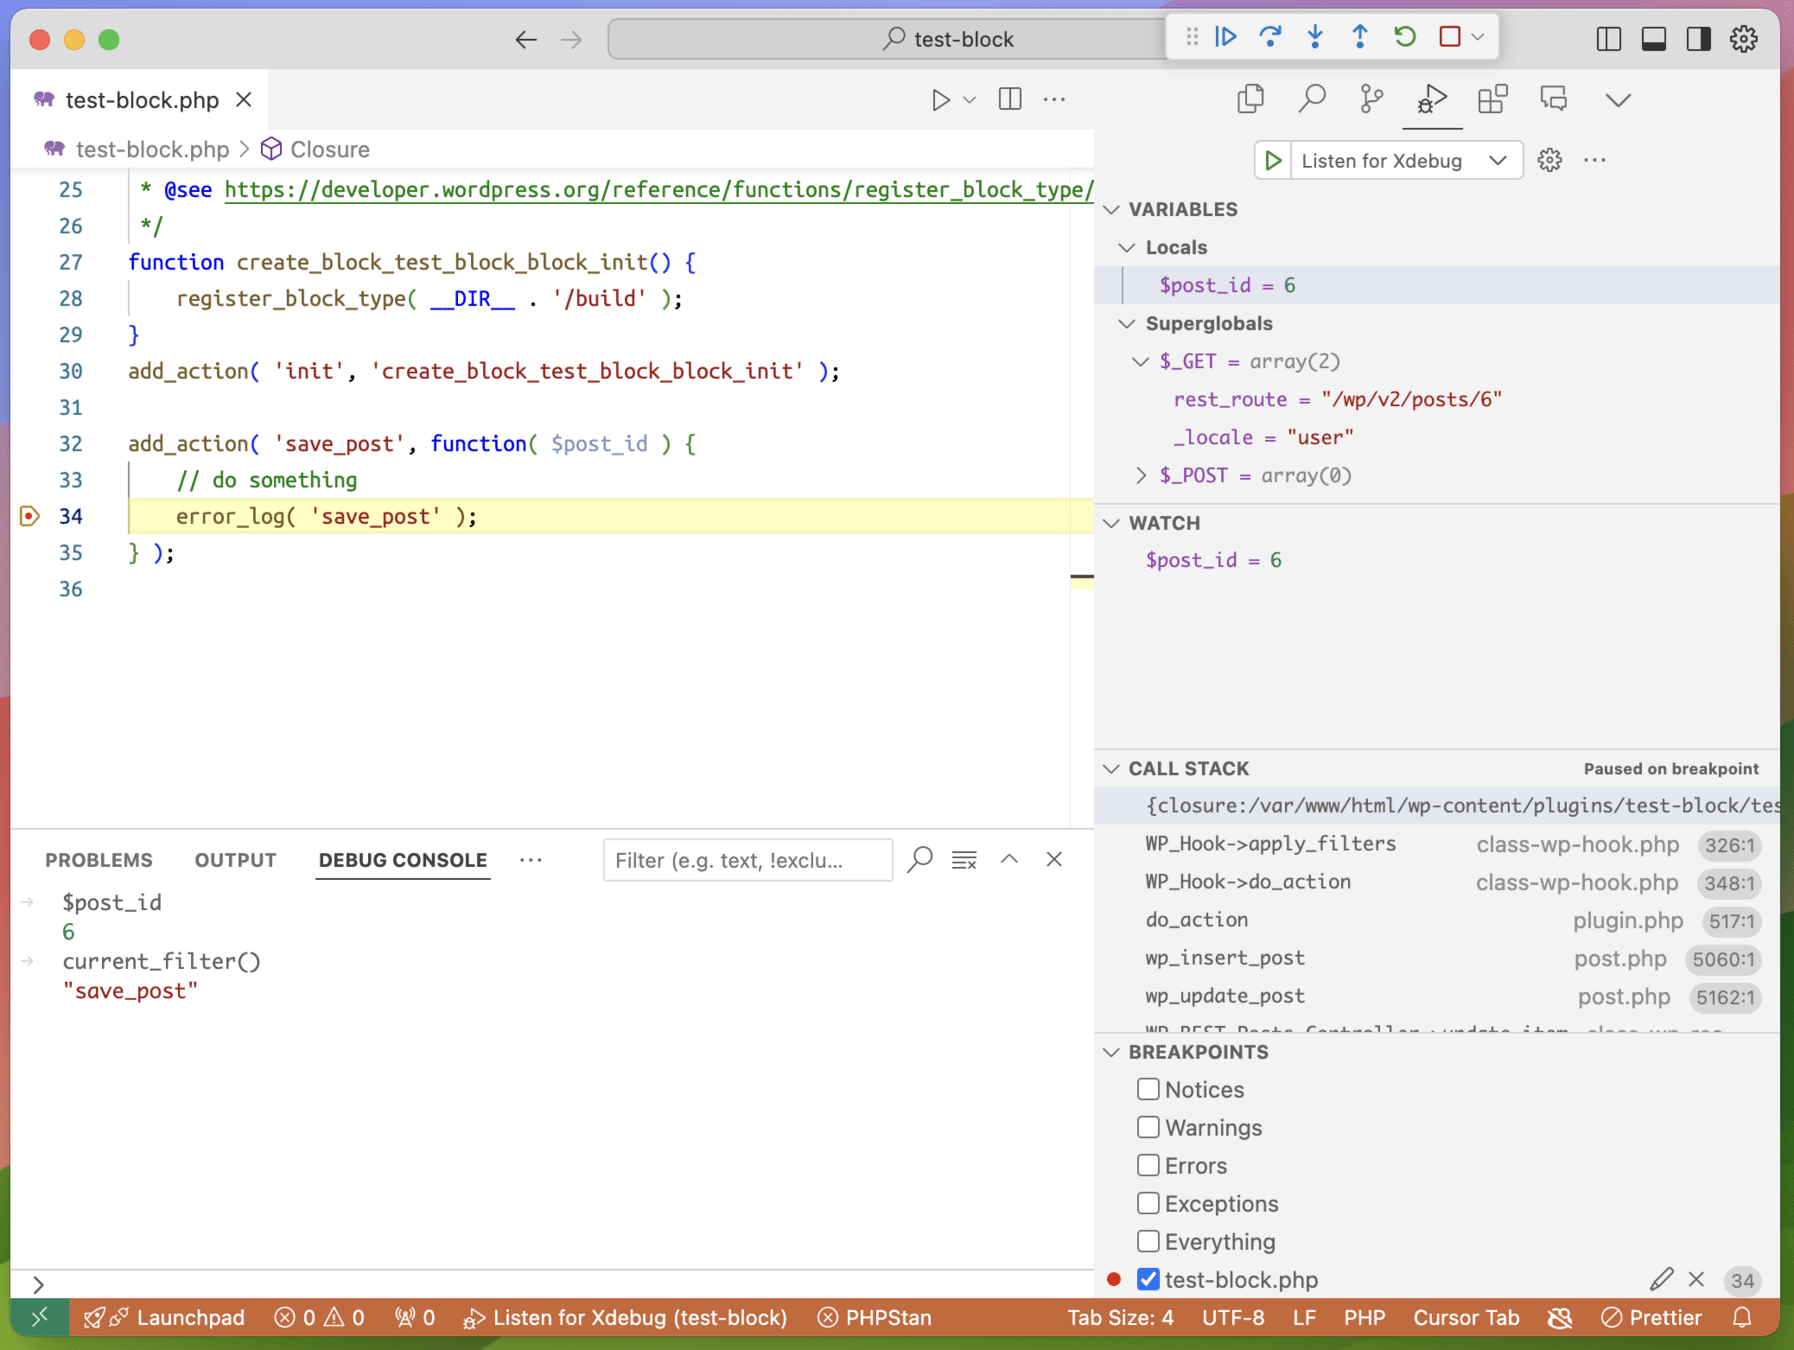
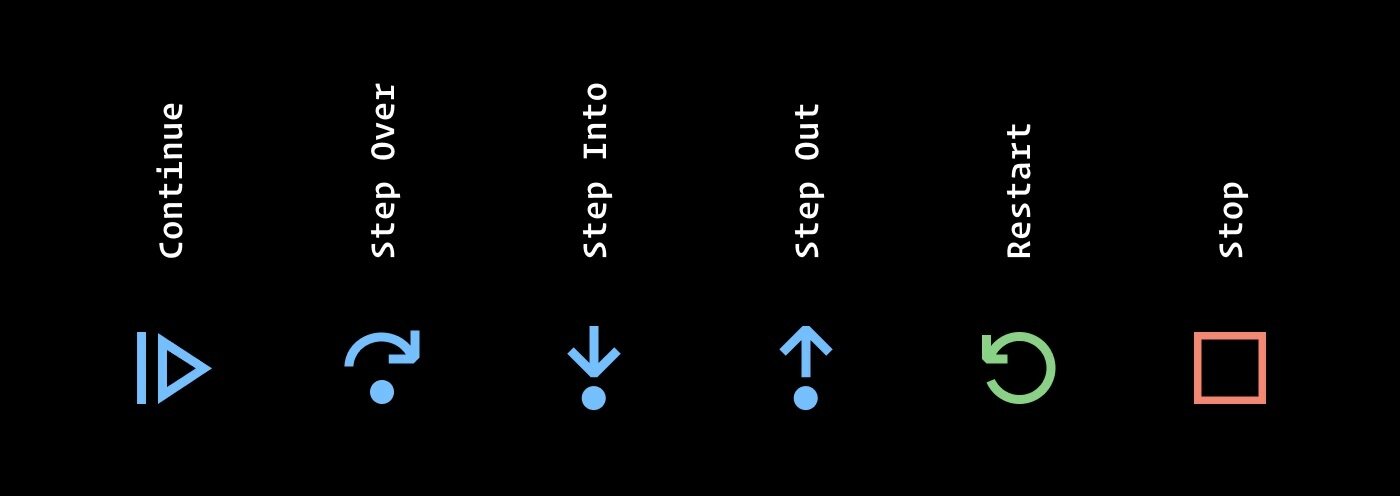
# Interactive debugging
Flow control
Continue
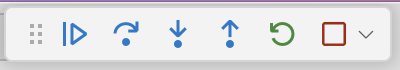
Step over
Step into
Step out
Restart
Stop
# Interactive debugging
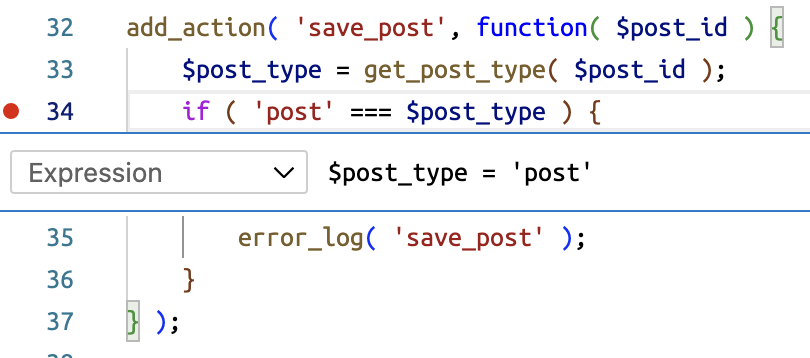
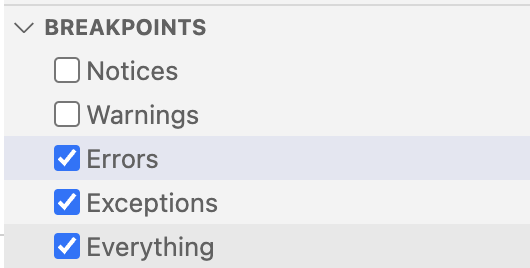
Breakpoints
Lines where the editor will stop
# Interactive debugging
Editor panel
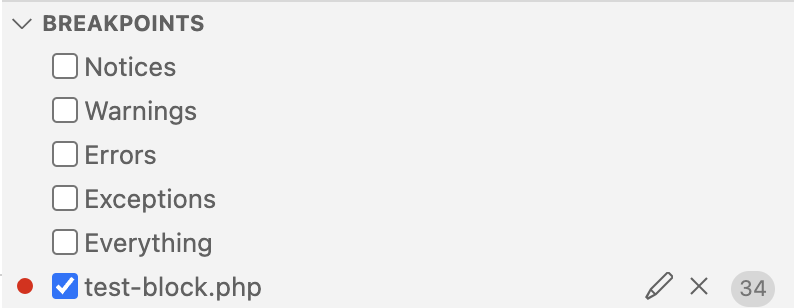
Breakpoints panel
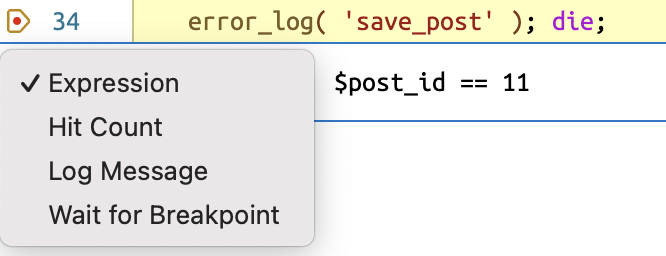
Conditional breakpoints
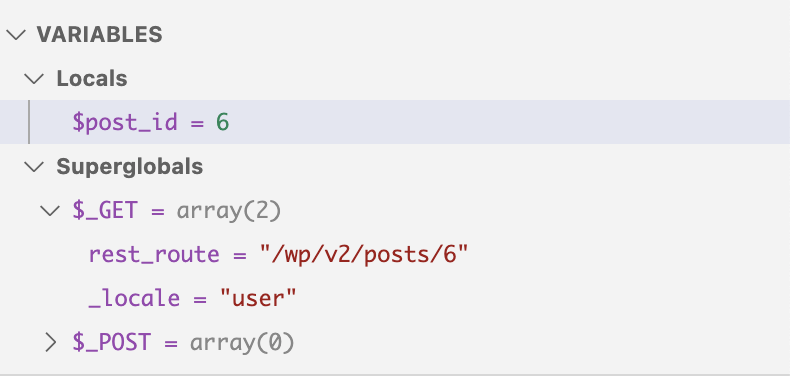
Variables
(scope, global, and constants)
# Interactive debugging
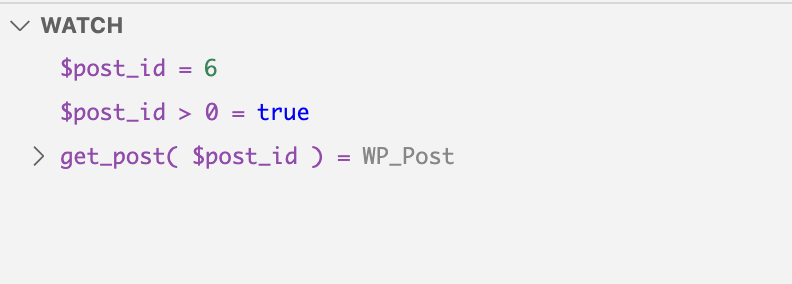
Watch expressions
Follow an expression value across steps
(variables, and expressions or statements)
# Interactive debugging
Call Stack
Sequence of function calls since the start
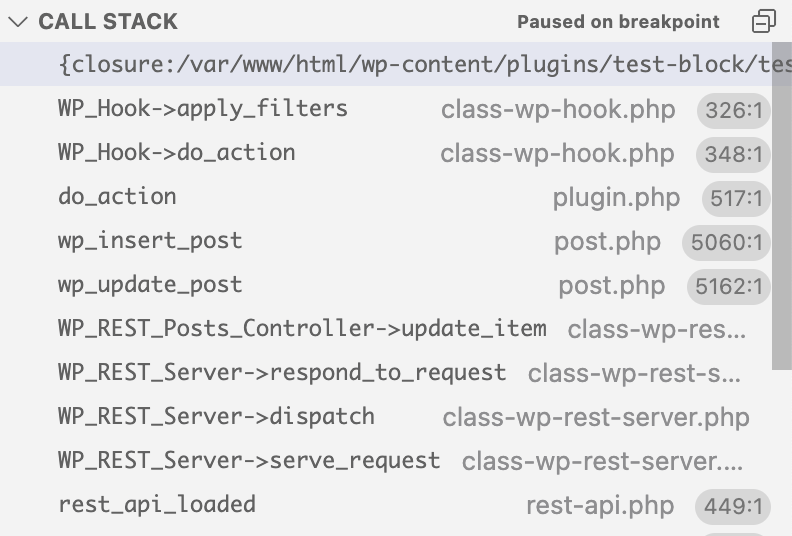
ie: Rewinding
# Interactive debugging
(click to dive into local state/variables THEN)
Debug console
Execute any command within the current state!
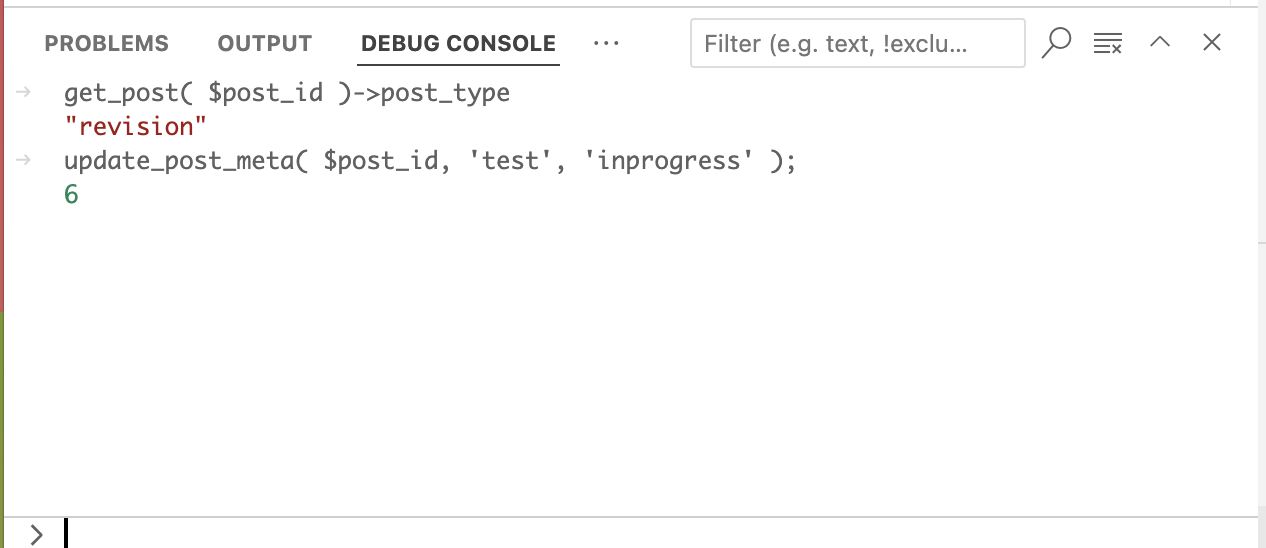

ie God mode
# Interactive debugging
Bypass hack
Alter execution flow using conditional breakpoints
ie God mode
# Interactive debugging
4. Live Demo:
Debugging in action
NOPE!
5. Troubleshooting
# Troubleshooting
Firstline troubleshooting:
<?php

// Add this to wp-config.php,
// or to any .php file that you can visit.

xdebug_info();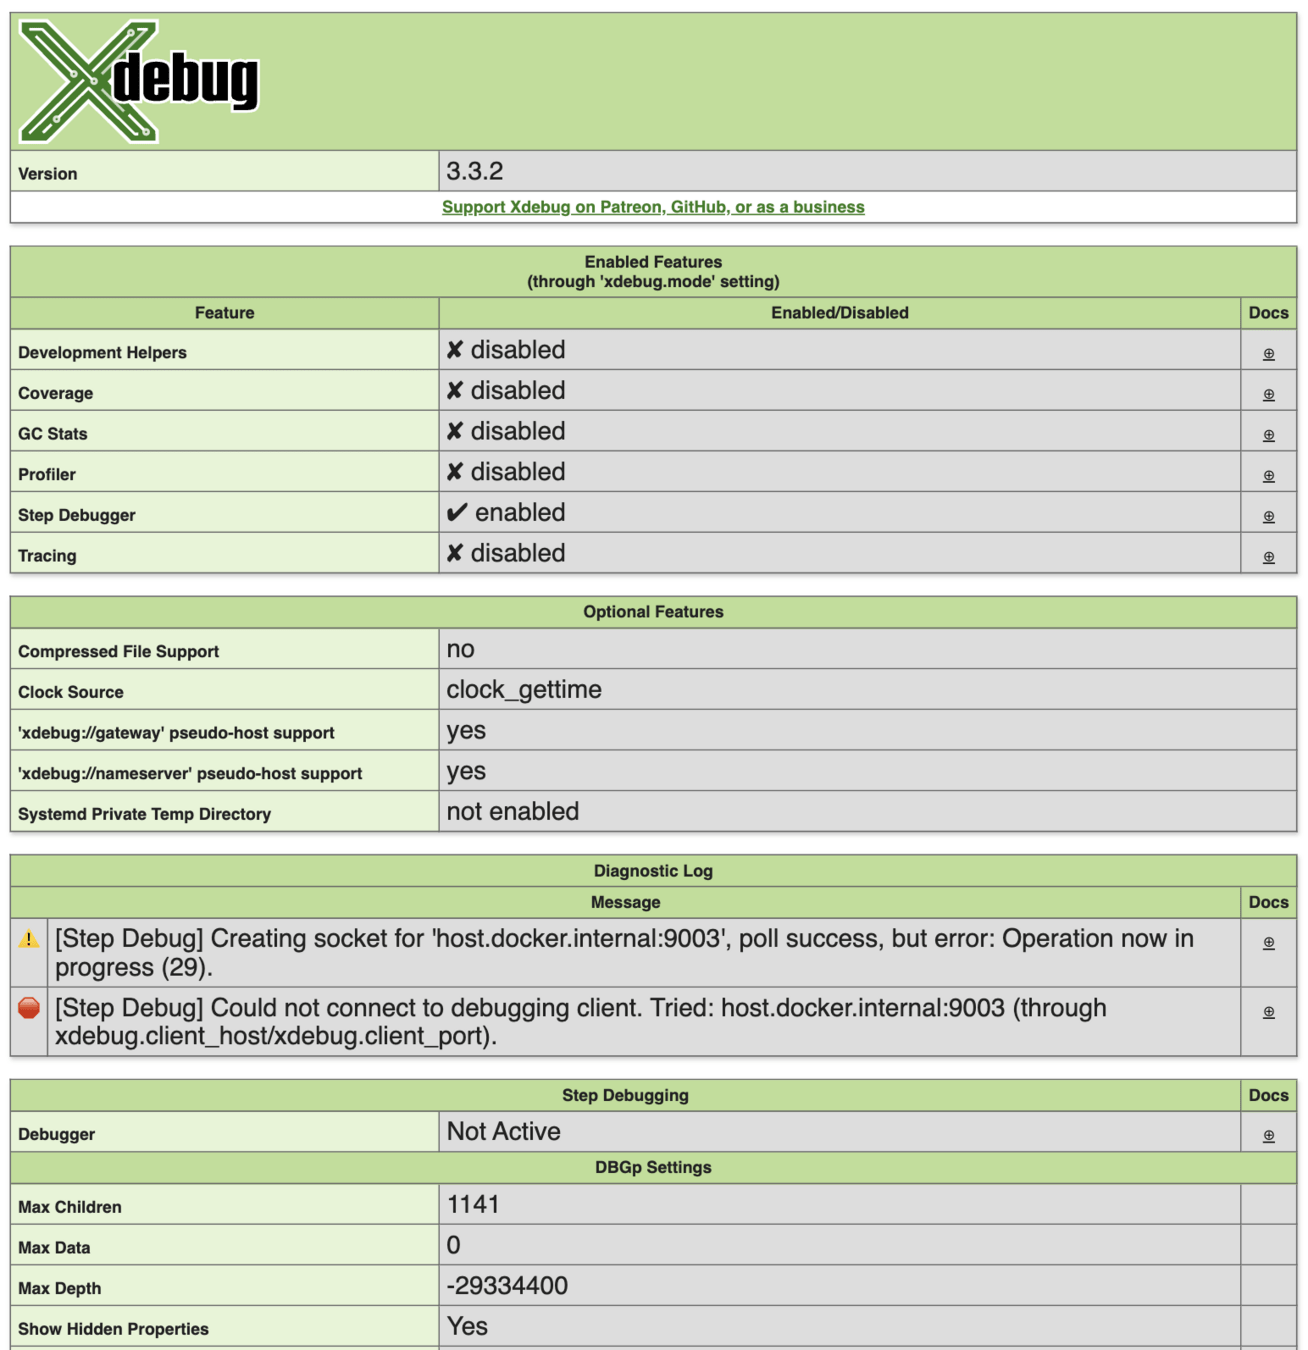
You can see xdebug settings and verify if all is as expected.
Also, Diagnostic log can offer insights on:
- If client is unreachable
- If file mapping is not set correctly
- - .. etc
# Troubleshooting
I don't know where to break?
- Try stopping on exceptions or errors if that's what you're getting as a result of the bug.
- If you see any specific strings where the error happens, try searching your codebase for that string, and put breakpoints around it to see if that's where the bug happens.
- Try adding a breakpoint as early as possible, and step through the code until you find where the bug happens. It might take time, but you'll get there eventually.
# Troubleshooting
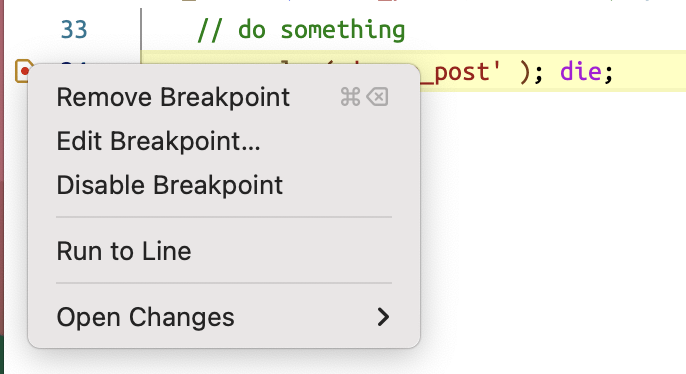
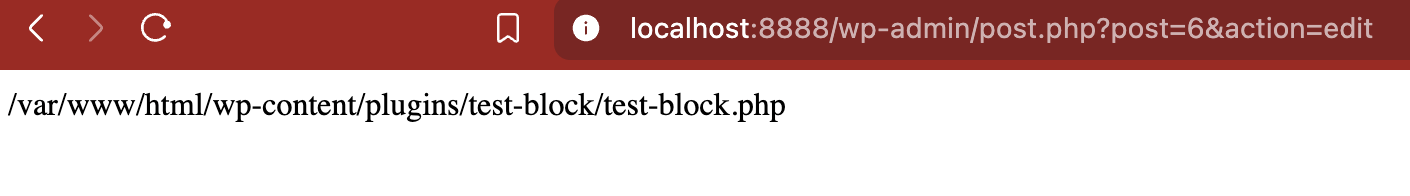
I can't figure out correct path mapping!
- From one of the files in your workspace, try figuring out the remote path via something as dump as `die( __FILE__ );`, and adjust the `pathMapping` config accordingly.
{
    "version": "0.2.0",
    "configurations": [
        {
            "name": "Listen for Xdebug",
            "type": "php",
            "request": "launch",
            "port": 9003,
			"pathMappings": {
				"/var/www/html/wp-content/plugins/test-block": "${workspaceFolder}"
			}
        }
    ]
}

# Troubleshooting
I don't have WordPress (or other dependencies) in my workspace, debugger can't find them!
- Make sure you have the dependency files on your local machine, and add the mapping accordingly.
{
    "version": "0.2.0",
    "configurations": [
        {
            "name": "Listen for Xdebug",
            "type": "php",
            "request": "launch",
            "port": 9003,
			"pathMappings": {
				"/var/www/html/wp-content/plugins/test-block": "${workspaceFolder}",
				"/var/www/html/wp-includes": "/path/to/local/wordpress/wp-includes",
				"/var/www/html/wp-admin": "/path/to/local/wordpress/wp-admin"
			}
        }
    ]
}
6. Remote Debugging

What is it?
Remote debugging is the act of debugging a problem on a remote server.
# Remote debugging
Why?
Because sometimes you just can't replicate the bug on development environments, because of mismatched infrastructure setup, or simply because the data is different.
# Remote debugging
What's the problem?
# Remote debugging

Browser
Server
Editor
How does it work?
Laptop


Server
Router
Private network
Internet
x.com
Public network


Debug session
Port forward
# Remote debugging
Challenges?
Laptop
Server
Router
Private network
Internet
x.com
Public network
Debug session
Port forward
2. Dynamic IP
1. Firewall
3. Travelling nomad! (Changing IPs)
Port Tunneling, eg: NRGOK, localtunnel
Port forwarding
xdebug.client_discovery_header

# Remote debugging
Challenges?
Laptop
Server
Router
Private network
Internet
x.com
Public network
Debug session
Port forward
2. Dynamic IP
1. Firewall
3. Travelling nomad! (Changing IPs)
# Remote debugging
Challenges?
Laptop
Server
Router
Private network
Internet
x.com
Public network

DBGP Proxy
# Remote debugging
Challenges?
Laptop
Server
Router
Private network
Internet
x.com
Public network
xdebug.cloud
# Remote debugging
Opportunities?
Laptop
Server
Router
Private network
Internet
x.com
Public network
xdebug.cloud
# Remote debugging
7. Profiling
# Profiling
What is Profiling?
Profiling is the systematic collection and analysis of runtime behavior metrics in your application, revealing where time is spent, memory is allocated, and functions are called, enabling data-driven optimisation decisions rather than gut feelings or assumptions about performance bottlenecks.
# Profiling
What is Profiling?
Profiling is like putting your code under a microscope that has multiple lenses - each lens showing you different aspects of how your code performs in real-world conditions. It's a systematic way to collect metrics about:
- Time: How long things take
- Memory: How much RAM it uses
- Frequency: How often code is executed
# Profiling
Why Profile?
- "Why is this API endpoint suddenly taking 2 seconds instead of 200ms?"
- "Which part of my React component is causing memory leaks?"
- "Is this new plugin adding significant overhead?"
- "Are my database queries or Redis calls the bottleneck?"
- "Is this slow performance coming from external calls or local processing?"
Types of Profilers
Local profilers
APM services
Xdebug
XHProf
SPX
....
NewRelic
DataDog
Tideways
....
# Profiling
Profiling vs Tracing
Profiling (what, how much)
Think of profiling like analyzing a busy restaurant kitchen. A profiler gives you statistical data about your code's performance, similar to knowing:
- How long each dish takes to prepare (function execution time)
- How many times each dish was ordered (function call count)
- Which stations are the busiest (CPU/memory hotspots)
Tracing (when, how)
Tracing is like having security cameras in your kitchen that record every single movement. It captures the exact sequence of events, showing:
- Who handed what to whom (function calls)
- When each action started and ended (timestamps)
- The exact path of each order (execution path)
# Profiling
Profiling data
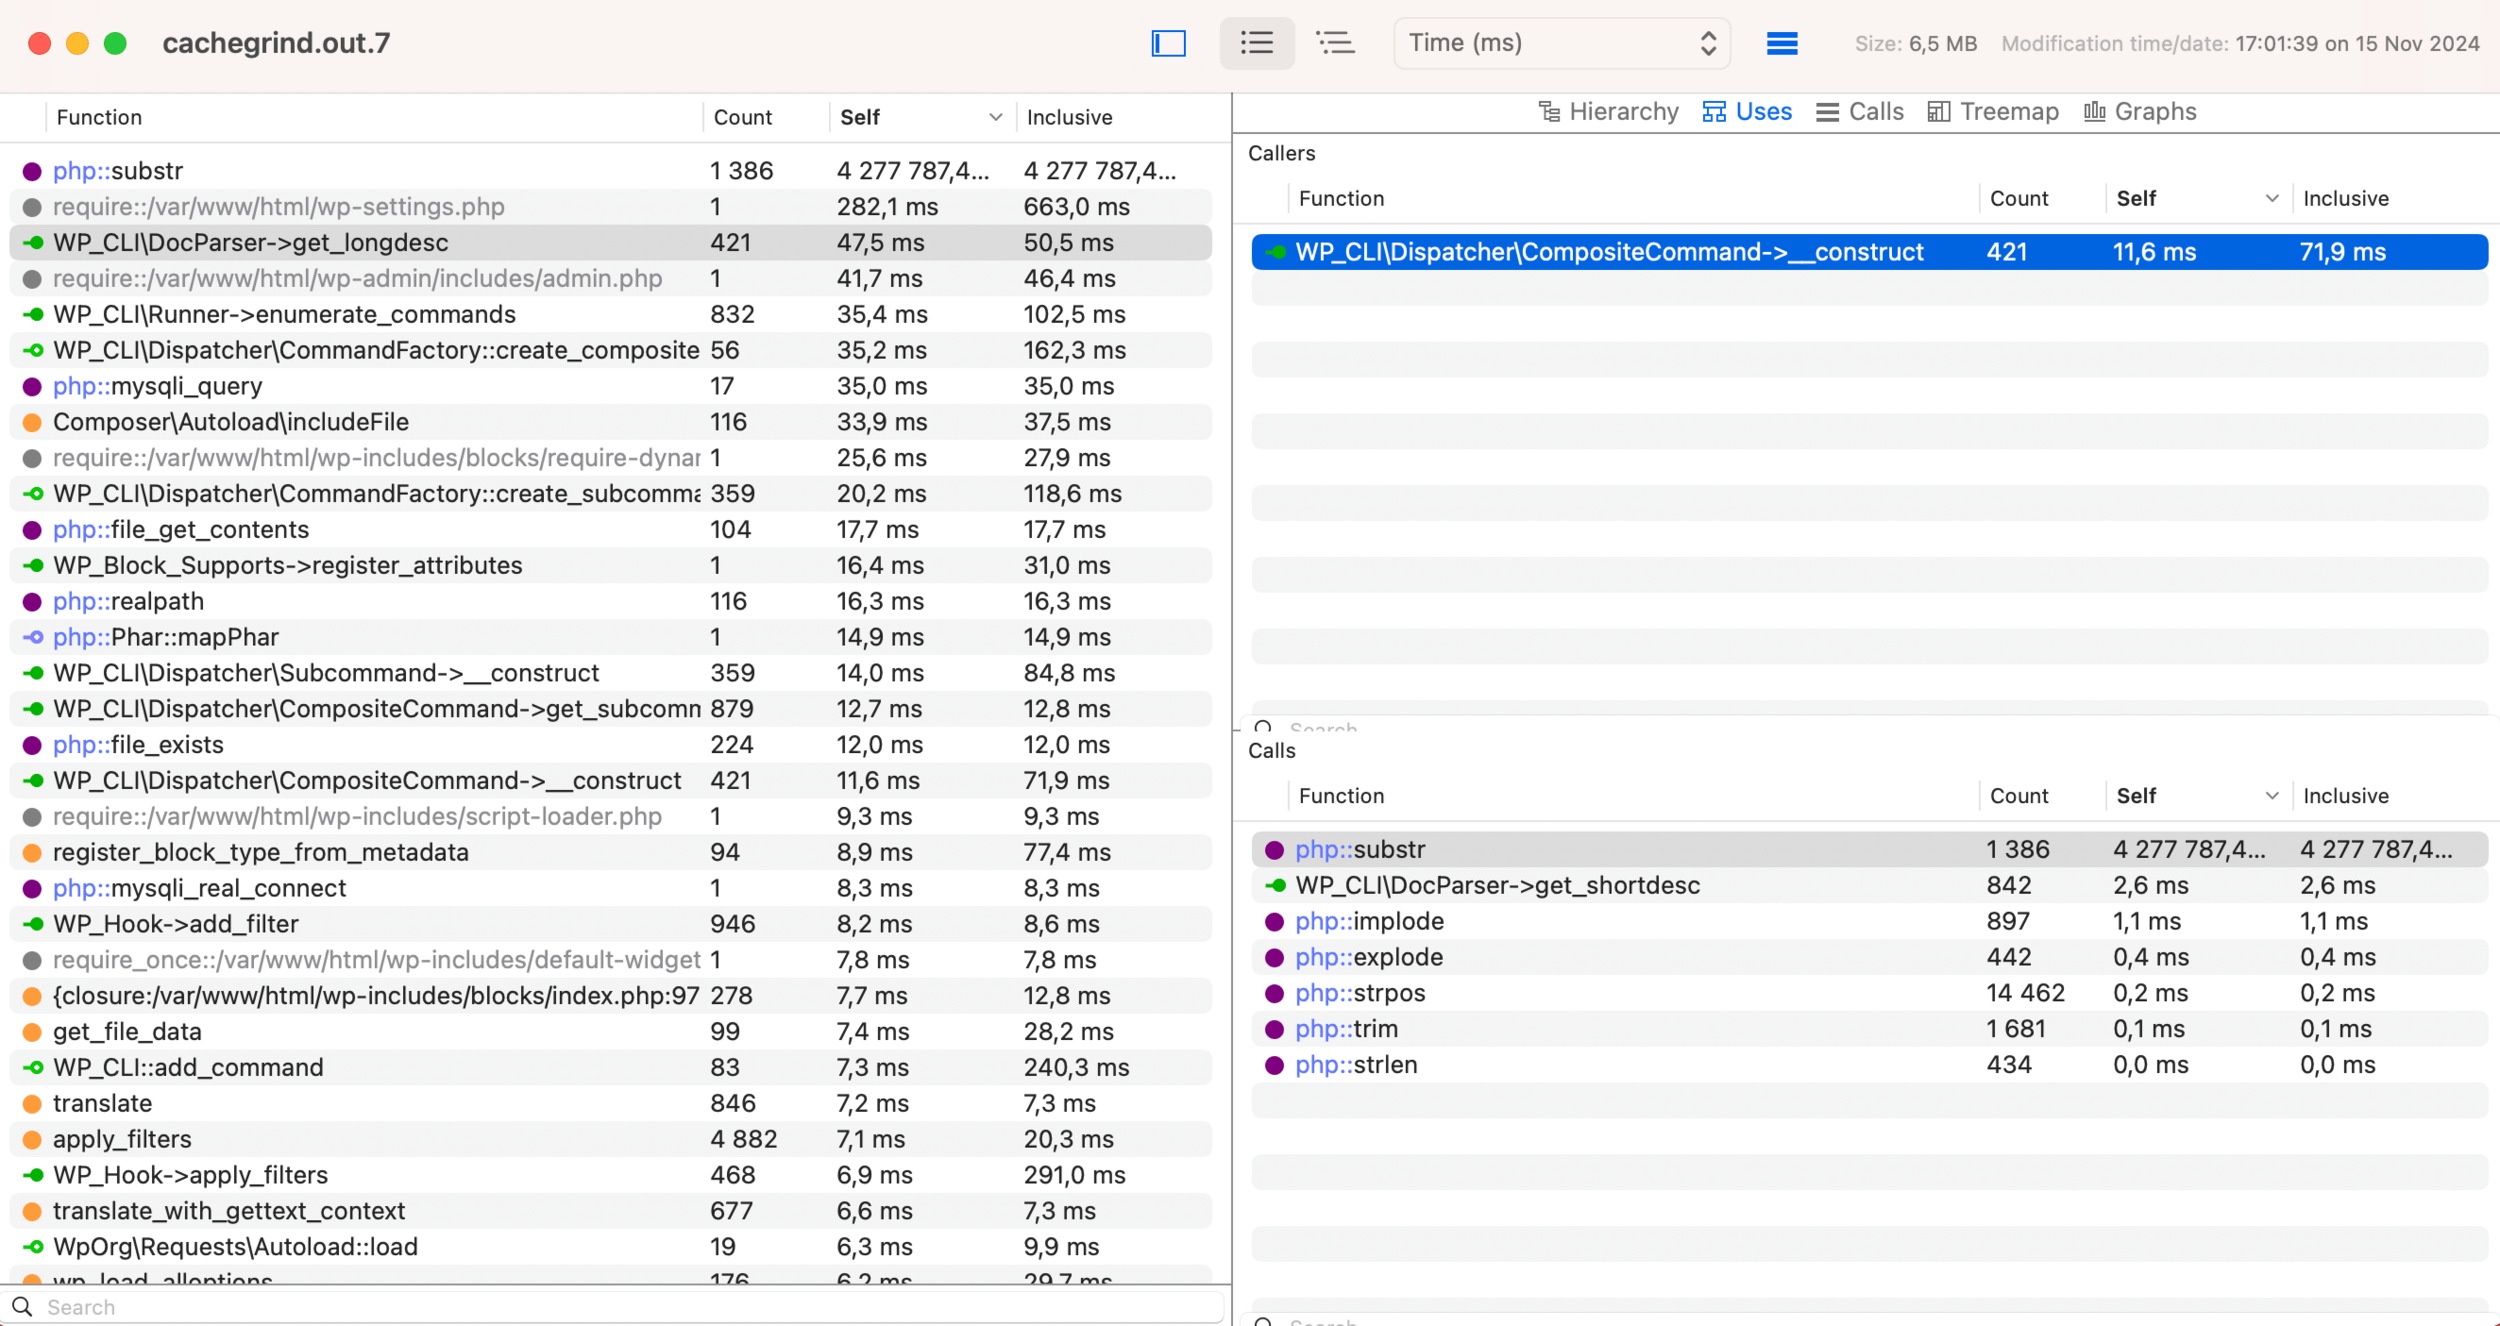
# Profiling
Tracing data
TRACE START [2024-01-01 12:00:00]
    0.0000    >   OrderProcessor->processOrder(123, array(2))
    0.0001        >   OrderProcessor->validateOrder(123, array(2))
    0.0002        <   OrderProcessor->validateOrder
    0.0003        >   OrderProcessor->calculateTotal(array(2))
    0.0003            >   array_column(array(2), 'price')
    0.0004            <   array_column = array(2)
    0.0004            >   array_sum(array(2))
    0.0004            <   array_sum = 30.0
    0.0005        <   OrderProcessor->calculateTotal = 30.0
    0.0005        >   OrderProcessor->saveOrder(123, array(2), 30.0)
    0.0007        <   OrderProcessor->saveOrder
    0.0008    <   OrderProcessor->processOrder = array(3)
TRACE END
# Profiling
# Profiling
Flamegraphs
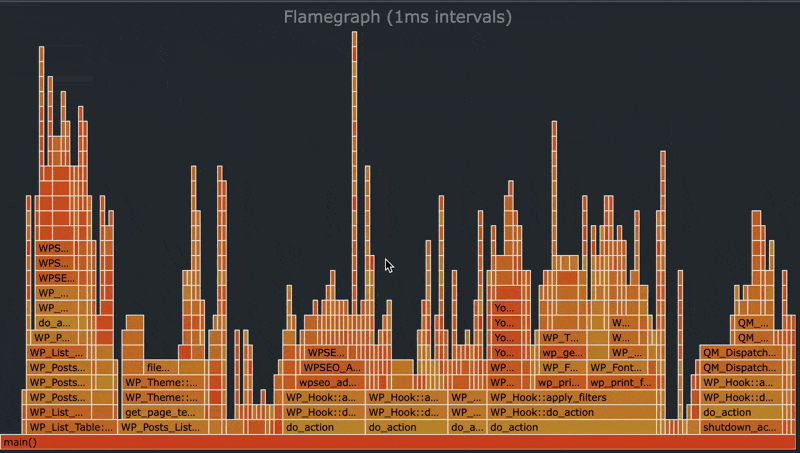
# Profiling
# Profiling
Configure
1.
2.
Generate
Select Trace from xdebug ext.
3.
View
Grab trace files
Visualise
xdebug.trace_format=3
xdebug.trace_output_name=trace.%u.%R
How to do that?
# Profiling
How to do that?
# Profiling
OR
XHProf + Query Monitor + FlameGraphs
# Profiling
# Downlod plugins
wp plugin install --activate query-monitor
wp plugin install --activate https://github.com/humanmade/query-monitor-flamegraph/archive/refs/heads/master.zip

# Install the xhprof extension
sudo pecl install xhprof
sudo -E docker-php-ext-enable xhprof
sudo service apache2 reload

# Add xhprof sample enable after the first line (typically after <?php) in wp-config.php
grep -q "xhprof_sample_enable()" /var/www/html/wp-config.php || sed -i "1a ini_set( 'xhprof.sampling_interval', 1000 ); function_exists('xhprof_sample_enable') \&\& xhprof_sample_enable();" /var/www/html/wp-config.php
Caveat: Only shows main request, not API or AJAX calls.
8. Demo:
Flamegraphs!
9. JavaScript!
# JS Debugging
Browser Dev Tools
Most browsers already have integrated dev tools into the browser to debug JavaScript code.
But what if we want to debug our JavaScript code from within our editor not our browser?

# JS Debugging
How?
1.
Bundler
1. Provide source maps
# JS Debugging
3.
Editor
1. Create debug config
Browser
1. Start with debug flag
2.
# For wp-scripts, one flag does the job:
npx wp-scripts start --webpack-devtool=eval-cheap-source-map
# OR
npm run start -- --webpack-devtool=eval-cheap-source-map
1. Bundler: Provide SourceMaps
// webpack.config.js
{
	// ...
    devtool: "eval-cheap-source-map",
    output: {
        // ...
		// Map to source with absolute file path not webpack:// protocol
        devtoolModuleFilenameTemplate: 'file:///[absolute-resource-path]'
    }
}
# JS Debugging
2. Editor: Debug config - Launch
// launch.json
{
	"version": "0.2.0",
	"configurations": [
		{
			"type": "chrome",
			"name": "Launch Chrome",
			"request": "launch",
			"url": "http://localhost:8888/wp-admin/",
		}
	]
}
# JS Debugging
2. Editor: Debug config - Launch
// launch.json
{
	"version": "0.2.0",
	"configurations": [
		{
			"type": "chrome",
			"name": "Launch Chrome",
			"request": "launch",
			"url": "http://localhost:8888/wp-admin/",
			"pathMapping": {
				"/wp-content/plugins/test-block": "${workspaceRoot}"
			},
			"sourceMapPathOverrides": {
				"webpack:///./src/*": "${workspaceRoot}/*",
				"webpack://test-block/*": "${workspaceRoot}/*",
				"webpack:///*": "${workspaceRoot}/*",
				"webpack:///./~/*": "${workspaceRoot}/node_modules/*",
				"webpack:///node_modules/*": "${workspaceRoot}/node_modules/*"
			}
		}
	]
}
# JS Debugging
2. Editor: Debug config - Attach
// launch.json
{
	"version": "0.2.0",
	"configurations": [
		{
			"type": "chrome",
			"name": "Attach to Chrome",
			"request": "attach",
			"port": 9222,
			"pathMapping": {
				"/wp-content/plugins/test-block": "${workspaceRoot}"
			},
			"sourceMapPathOverrides": {
				"webpack:///./src/*": "${workspaceRoot}/*",
				"webpack://test-block/*": "${workspaceRoot}/*",
				"webpack:///*": "${workspaceRoot}/*",
				"webpack:///./~/*": "${workspaceRoot}/node_modules/*",
				"webpack:///node_modules/*": "${workspaceRoot}/node_modules/*"
			}
		}
	]
}
# JS Debugging
3. Browser: Launch with debug flag
"/path/to/Browser" --remote-debugging-port=9222 --user-data-dir=remote-debug-profileFor 'Attach' debug configuration, run the browser in debug mode:
# JS Debugging
10. Last demo:
JS debugging in editor
Thank you!
Questions ?
linkedin: shady.sharaf
wp.org: shadyvb
github: shadyvb

Next up:
- Regression testing and performance benchmarking with Playwright @ Porto Meetup - 11th December '24
Debugging 101
By Shadi Sharaf


