D3 tutorial
Sheng Long
11/09/2023
What this tutorial will cover
-
D3.js-- what is it and why do we use SVG - select, modify, data join
- scales, axes, margins
- transitions, tooltips, event listeners and handlers
What is D3.js?
- Originally developed by Michael Bostock and co-authors in paper, D3: Data Driven Documents
- It is a JavaScript library for producing dynamic, interactive data visualizations in web browsers
- It uses Scalable Vector Graphics (SVG) (→ requires web browsers that support SVGs)
- Good for customization, animation, and interaction
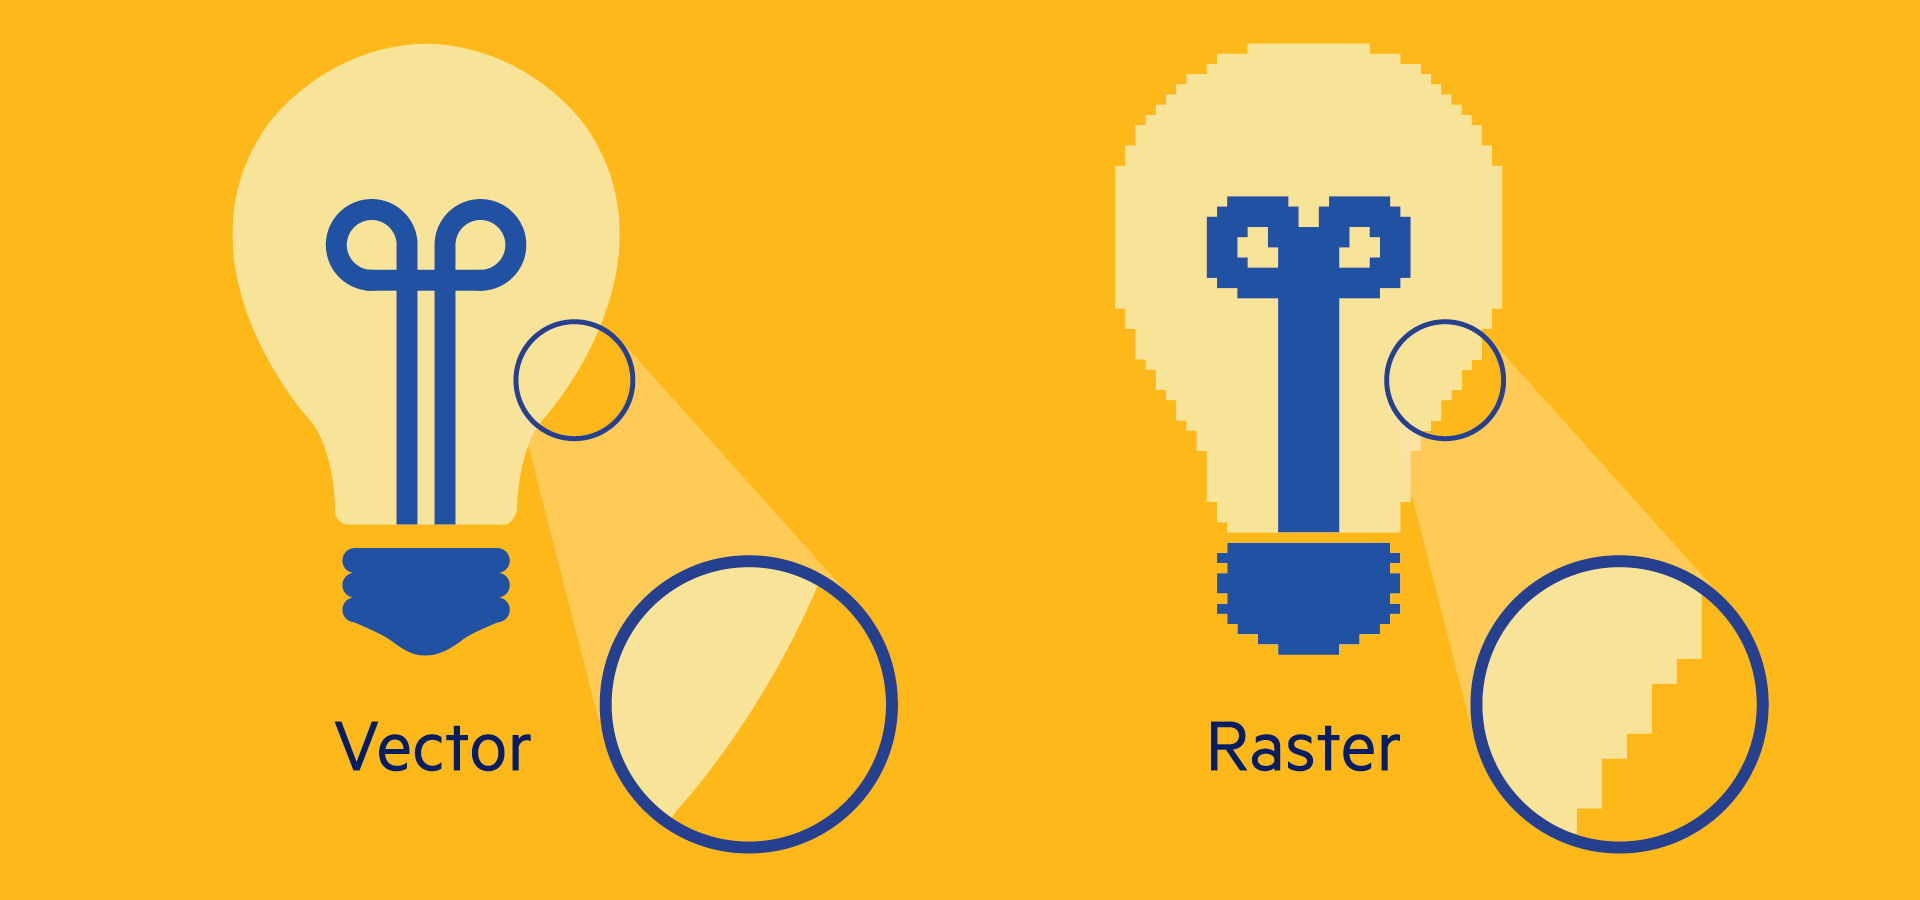
Images
- Images can either be raster graphics or vector graphics
- Examples of raster graphic: JPG, PNG, BMP
- Specifies how each individual pixel should be rendered
- Example of vector graphic: SVG
- Specified instructions for drawing the image
- knowing the structure and syntax makes it possible to use a text editor to change the image
- Specified instructions for drawing the image
SVG
- SVG is an open web strandard that uses a structured text format (XML) for rendering vector graphics
<svg
    xmlns:dc="http://purl.org/dc/elements/1.1/"
    xmlns:cc="http://creativecommons.org/ns#"
    xmlns:rdf="http://www.w3.org/1999/02/22-rdf-syntax-ns#"
    xmlns:svg="http://www.w3.org/2000/svg"
    xmlns="http://www.w3.org/2000/svg"
    version="1.1"
    width="700"
    height="1000"
    id="svgExample">
  <defs id="mydefinedLineID"/>

  <g id="horz_line">
    <path
      d="M 100 100 L 300 100"
      id="myPath"
      style="fill:none;stroke:#000000;stroke-width:1px;stroke-opacity:1"/>
  </g>
</svg>
This is what code for a black line looks like
editing style directly allows us to change image directy
D3 and SVG
- D3 can make stylistic and attribute changes to the shapes being drawn, using function calls
- In order to manipulate SVG elements, D3 uses selectors to target specific components of the document for change
Getting started with D3
<!DOCTYPE html>
<html>
    <head>
        <script src="http://d3js.org/d3.v6.min.js"></script>
    </head>
    <body>
    <div id="content"></div>
    </body>
</html>
Selecting elements
- This can be done using
d3.select()ord3.selectAll():-
d3.selectonly selects the first matching element -
d3.selectAllselects all matching elements in document order
-
- Sub-selections are allowed, e.g.,
d3.selectAll("p").select("b") - For more, refer to d3 selections.
- After selecting elements, we can use the selection to modify the elements by using
selection.attr()orselection.style()
For example, change the background red
d3.select(document.body).style("background", "red");
Or: make a clicked paragraph red
d3.selectAll("p").on("click", (event) => d3.select(event.currentTarget).style("color", "red"));
Other functions used with selections
- Elements can be added to a selection's elements using D3's
.appendand.insertmethods. - Elements can be removed using
.remove. - The
.eachmethod lets you call a function for each element of a selection. -
The
.callmethod allows a function to be called into which the selection itself is passed as the first argument.-
.callis useful where you want a reusable function that operates on a selection.
-
-
There are also filtering
.filterand sorting.sortmethods
- A data join creates a correspondence between an array of data and a selection of HTML or SVG elements.
- The general pattern for creating a data join is:
d3.select(container)
  .selectAll(element-type)
  .data(array)
  .join(element-type)
1. Select #content and add svg element with g container element to it:
Example
2. Join an array of data set to circles and add it to the SVG element
Example
Observe there is nothing because the circles don't have any attributes.
Example
4.
Reading data
There are four methods for loading data: d3.csv(), d3.json(), d3.tsv(), d3.xml(). We'll use d3.csv() for this tutorial.
- We can read a local CSV (comma-separated value) file
- Or request a file hosted online (e.g. gapminder)
Typically we have arrays of objects (rather than arrays of numbers) that we need to join with the visual elements. D3 can request a CSV file and transform it into an array of objects.
Typical format for requesting data:
url = "..."
d3.csv(url).then(function(data) { console.log(data) }); -
d3.csvaccepts the URL as its first parameter and returns a promise object. - When the browser receives the requested data, the promise is fulfilled and the function that's passed into the promise's
.thenmethod is called.- The main thing to remember is to pass a callback function into the
.thenmethod. The callback method is called when the file arrives. Its first parameter is the data.
- The main thing to remember is to pass a callback function into the
Requesting data
- D3 interprets data as strings, so it's a good practice to convert them as soon as you have the data
Scales and Axes
scales
- Scales map a dimension of abstract data to a visual representation
- Typical examples include
- linear scale for quantitative data
- log scale for quant data with a wide range
- time scale for time-series data
- ordinal scale for categorial or ordinal data
- band scale for categorical or ordinal data as a position encoding
Linear scales
Linear scales map a continuous, quantitative input domain to a continuous output range using a linear transformation (translate and scale).
To apply a position encoding:
const x = d3.scaleLinear([10, 130], [0, 960]);
x(20); // 80
x(50); // 320
To apply a color encoding:
const color = d3.scaleLinear([10, 100], ["brown", "steelblue"]);
color(20); // "rgb(154, 52, 57)"
color(50); // "rgb(123, 81, 103)"
This is mapping x, which takes value in [10, 130] to [0, 960];
domain \(\to\) codomain
- Similar to ordinal sclaes except the output range is continuous and numeric
- typically used for bar charts with an ordinal or categorical dimension
const x = d3.scaleBand(["a", "b", "c"], [0, 960]);
x("a"); // 0
x("b"); // 320
x("c"); // 640
x("d"); // undefined
D3 axis
Linear Axis
Linear Axis -- XY coordinates
.attr("transform", "translate(tx,ty)")
-
d3.transformis a helper function; possible other transformations includescale,rotate, etc. -
translateis moving the graphic element tx, ty away from the "origin".
D3 margin
- When we define a
widthandheightfor an SVG element, we usually define it for the outer dimensions. - origin is top left corner
- Usually define an object with properties for the four sides (clockwise from the top, per CSS tradition)
margin.bottom
margin.top
margin.left
margin.right
margin = ({top: 20, right: 30, bottom: 30, left: 40})D3 min max extent
https://observablehq.com/@d3/d3-extent
i.e., how to get input range of scales
min, max, extent
-
d3.minreturns the minimum value from the given iterable of values
-
d3.maxreturns the maximum value from the given iterable of values
-
d3.extentreturns [min, max] in a single pass over the input- convenient for getting the scale's domain
- Technically, d3.min and d3.max work with types other than numbers
Putting things altogether
- To create a scatterplot:
- read in data with
d3.csv - use
d3.extentto obtain range of input - use margin, scales, and axes to create the axes
- append circles of actual data
- read in data with
Margins and axes
Activity 1: create a static, scatterplot using D3
- A common technique when analyzing or visualizing data is to organize your data into groups.
- D3 can help us create a hierarchical data structure from flat data.
-
e.g., we can use D3's
.rollupfunction to group the data by any of the categorical properties. -
For more, see https://observablehq.com/@d3/d3-group
let data = [
	{"Title": "Adaptation", "Distributor": "Sony Pictures", "Genre": "Comedy", "Worldwide_Gross": 22498520, "Rating": 91},
	{"Title": "Air Bud", "Distributor": "Walt Disney Pictures", "Genre": "Comedy", "Worldwide_Gross": 27555061, "Rating": 45},
	{"Title": "Air Force One", "Distributor": "Sony Pictures", "Genre": "Action", "Worldwide_Gross": 315268353, "Rating": 78},
	{"Title": "Alex & Emma", "Distributor": "Warner Bros.", "Genre": "Drama", "Worldwide_Gross": 15358583, "Rating": 11},
	{"Title": "Alexander", "Distributor": "Warner Bros.", "Genre": "Adventure", "Worldwide_Gross": 167297191, "Rating": 16},
	{"Title": "Ali", "Distributor": "Sony Pictures", "Genre": "Drama", "Worldwide_Gross": 84383966, "Rating": 67},
	{"Title": "Alice in Wonderland", "Distributor": "Walt Disney Pictures", "Genre": "Adventure", "Worldwide_Gross": 1023291110, "Rating": 51},
	{"Title": "Alive", "Distributor": "Walt Disney Pictures", "Genre": "Adventure", "Worldwide_Gross": 36299670, "Rating": 71},
	{"Title": "All the King's Men", "Distributor": "Sony Pictures", "Genre": "Drama", "Worldwide_Gross": 9521458, "Rating": 11},
	{"Title": "Amadeus", "Distributor": "Warner Bros.", "Genre": "Drama", "Worldwide_Gross": 51973029, "Rating": 96}
];

function sumWorldwideGross(group) {
	return d3.sum(group, function(d) {
		return d.Worldwide_Gross;
	});
}

function doRollup(data) {
	let groups = d3.rollup(data, sumWorldwideGross,
						   function(d) { return d.Distributor; },
						   function(d) { return d.Genre; }
						  );

	// Get Sony Pictures
	console.log(groups.get('Sony Pictures'));

	// Get Drama within Sony Pictures
	console.log(groups.get('Sony Pictures').get('Drama'));
}


doRollup(data);
d3.rollup groups data by Distributor and Genre;
it returns a nested map object
Each of the groups is then passed into sumWorldwideGross which returns the sum of Worldwide_Gross.
D3 legend
- No "official" implementation for adding legends
- However, custom code and libraries out there that makes lives easier
- Observable - Color legend
- Building your own legends
Dynamic visualization
D3 transitions
- D3 transitions animate changes to the DOM
- selecting elements → modifying elements → timing
- control flow
d3.select('svg')
  .selectAll('circle')
  .data(data)
  .join('circle')
  .attr('cy', 50)
  .attr('r', 40)
  .transition()
    .duration(2000)
    .attr('cx', function(d) {
      return d;
    });
d3.select('svg')
.selectAll('circle')
.data(data)
.join('circle')
.attr('cy', 50)
.attr('r', 40)
.transition()
.delay(2000)
.attr('cx', function(d) {
return d;
});Easting functions
An easing function defines the change in speed of an element during a transition.
d3.select('svg')
  .selectAll('circle')
  .data(data)
  .join('circle')
  .attr('cy', 50)
  .attr('r', 40)
  .transition()
  .ease(d3.easeBounceOut)
  .attr('cx', function(d) {
    return d;
  });
Easing functions
Chained transitions
Looping through transitions
.on("end", repeat)
- Previously known as "enter, exit, update"
- HTML/SVG elements that have just been created are known as entering elements and ones that are about to be removed are known as exiting elements.
- Gives us more fine-grained control over entering and exiting elements, which may be helpful for transitions
- Entering and exiting elements can be treated differently by passing functions into the
.joinmethod:
.join(
  function(enter) {
    ...
  },
  function(update) {
    ...
  },
  function(exit) {
    ...
  }
)
- the enter function's parameter
enteris the enter selection which represents the elements that need to be created - the update function's parameter
updateis a selection containing the elements that are already in existence (and aren't exiting) - the exit function's parameter
exitis the exit selection and contains elements that need to to be removed
Example
Interactive vis
-
d3.formatallows parsing numbers and time for human consumption
- We can add event handlers to selected elements using the
.onmethod. This method takes two arguments:- First argument: a string specifying the event type
- Second argument: a callback function that's called when the event is triggered
d3.selectAll('circle')
  .on('click', function(e, d) {
    d3.select(this)
      .style('fill', 'orange');
  });
e: DOM event object
d: joined data
to modify e using D3 you must first select it using d3.select(this).
D3 tooltip
- The tooltips are small HTML elements that accompany visual objects to present data values and usually appear when the user moves the mouse pointer over an element.
- Since it is a small HTML element, it also requires styling via css
D3 tooltip - example
Looping with intervals
Basically playing something on repeat with https://www.oreilly.com/library/view/introduction-to-d3js/9781800568259/video4_2.html
Group activity: make a dynamic chart using D3
Margins and axes
Group activity: make an interactive vis using D3
Adding update functions
Example
Given an svg element containing a g element:
<svg>
  <g class="chart">
  </g>
</svg>
and an array let myData = [10, 20, 30, 40, 50], one can join this array to circle elements using
d3.select('.chart')
  .selectAll('circle')
  .data(myData)
  .join('circle')
Since the .join method returns a selection containing all of the joined elements, we can then update the HTML/SVG elements using .style, .attr and .text
Example:
<svg>
  <g class="chart">
  </g>
</svg>
and an array let myData = [10, 20, 30, 40, 50], one can join this array to circle elements using
d3.select('.chart')
  .selectAll('circle')
  .data(myData)
  .join('circle')
Since the .join method returns a selection containing all of the joined elements, we can then update the HTML/SVG elements using .style, .attr and .text
Observe there is nothing plotting on the HTML
That's because we haven't specified any attributes for the circles.
D3 tutorial
By Sheng Long


