

Lecture 2: Linear Regression and Regularization
Shen Shen
Feb 7, 2025
11am, Room 10-250
Intro to Machine Learning

Optimization + first-principle physics
DARPA Robotics Competition
2015
Outline
- Recap: Supervised Learning Setup, Terminology
- Ordinary Least Square Regression
- Problem Formulation
- Closed-form Solution (when well-defined)
- When closed-form solution is not well-defined
- Mathematically, Practically, Visually
- Regularization and Ridge Regression
- Hyperparameter and Cross-validation
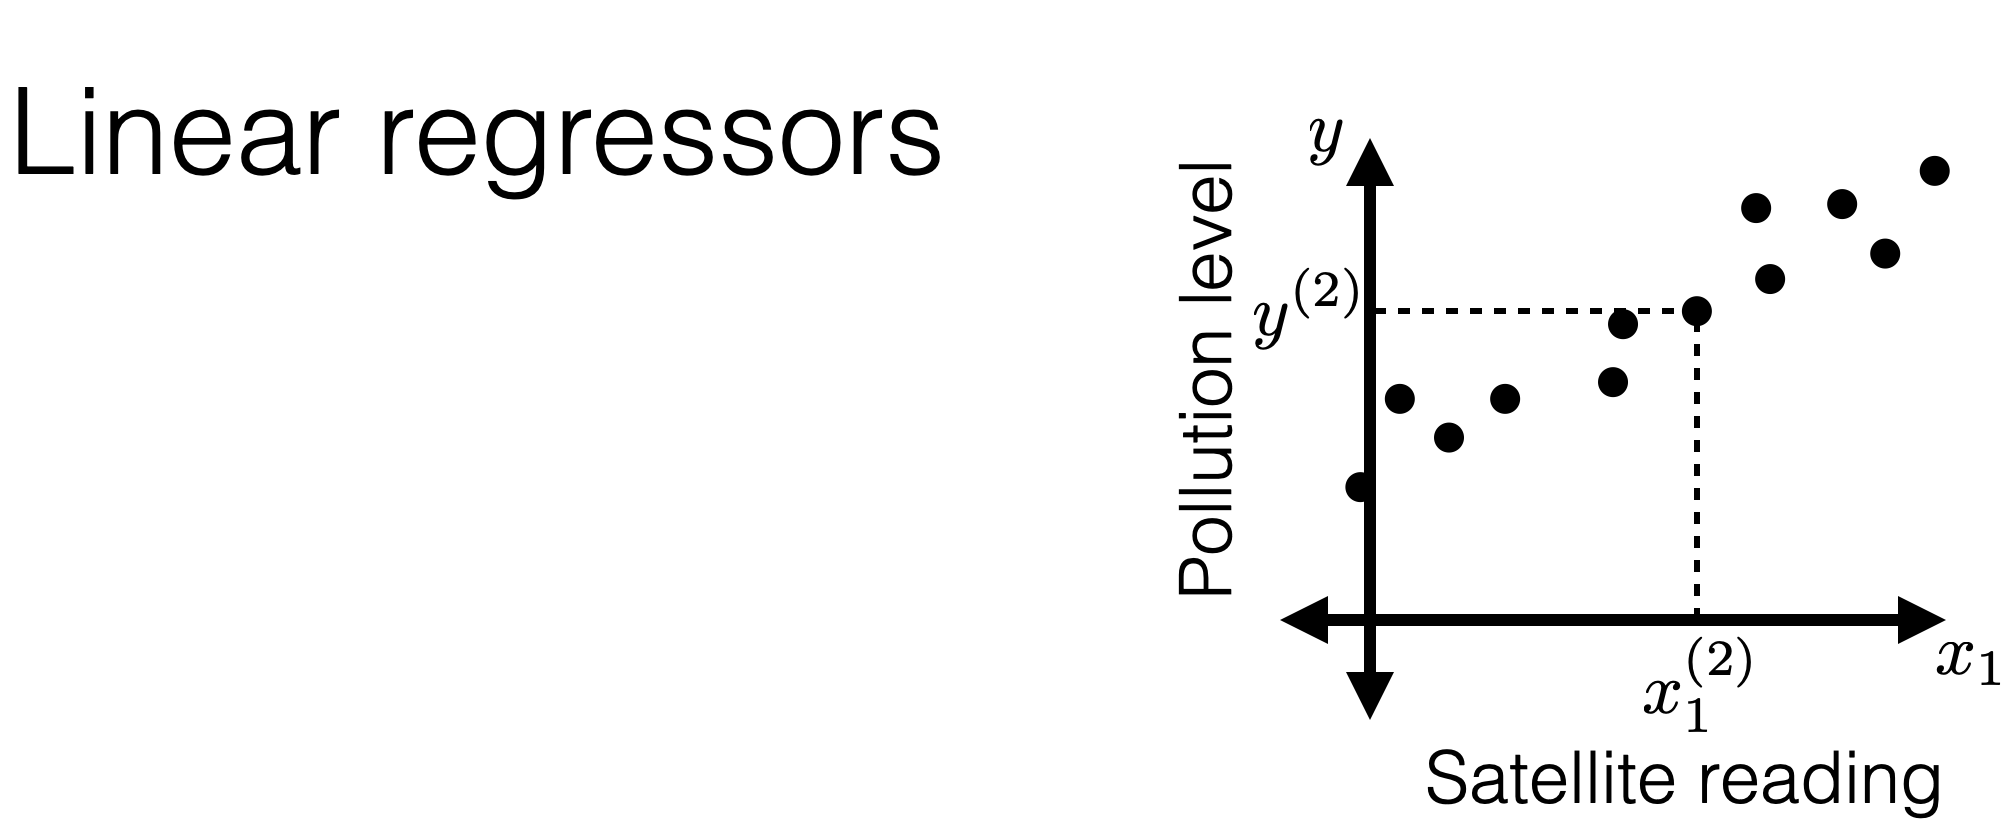
Recall: pollution prediction example
Training data:
\(\begin{bmatrix} x_1^{(1)} \\[4pt] x_2^{(1)} \\[4pt] \vdots \\[4pt] x_d^{(1)} \end{bmatrix} \in \mathbb{R}^d\)
label
feature vector
\(y^{(1)} \in \mathbb{R}\)
\(\mathcal{D}_\text{train}\)
\(\left\{\left(x^{(1)}, y^{(1)}\right), \dots, \left(x^{(n)}, y^{(n)}\right)\right\}\)
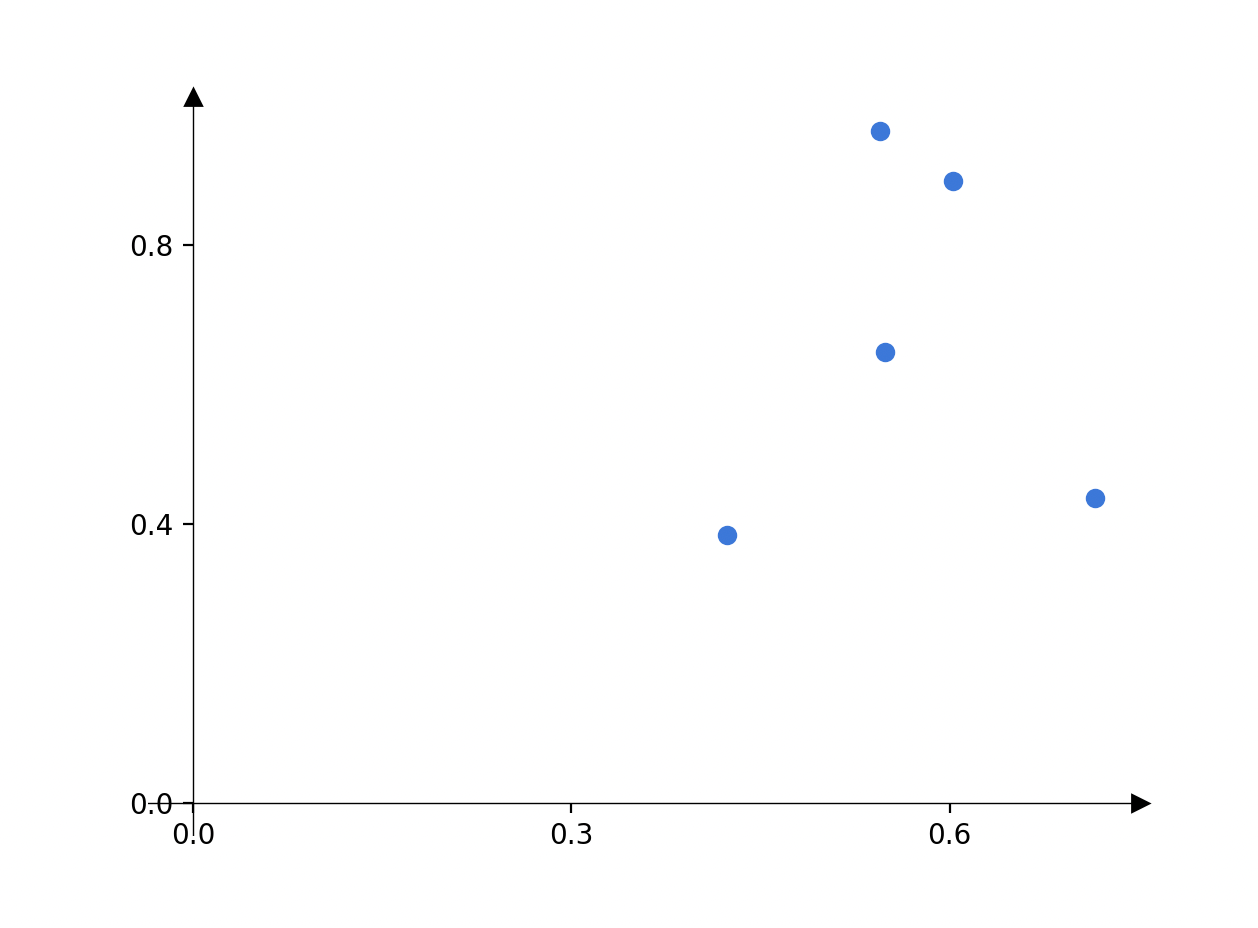
pollution
temperature \(x_1\)
\(y\)
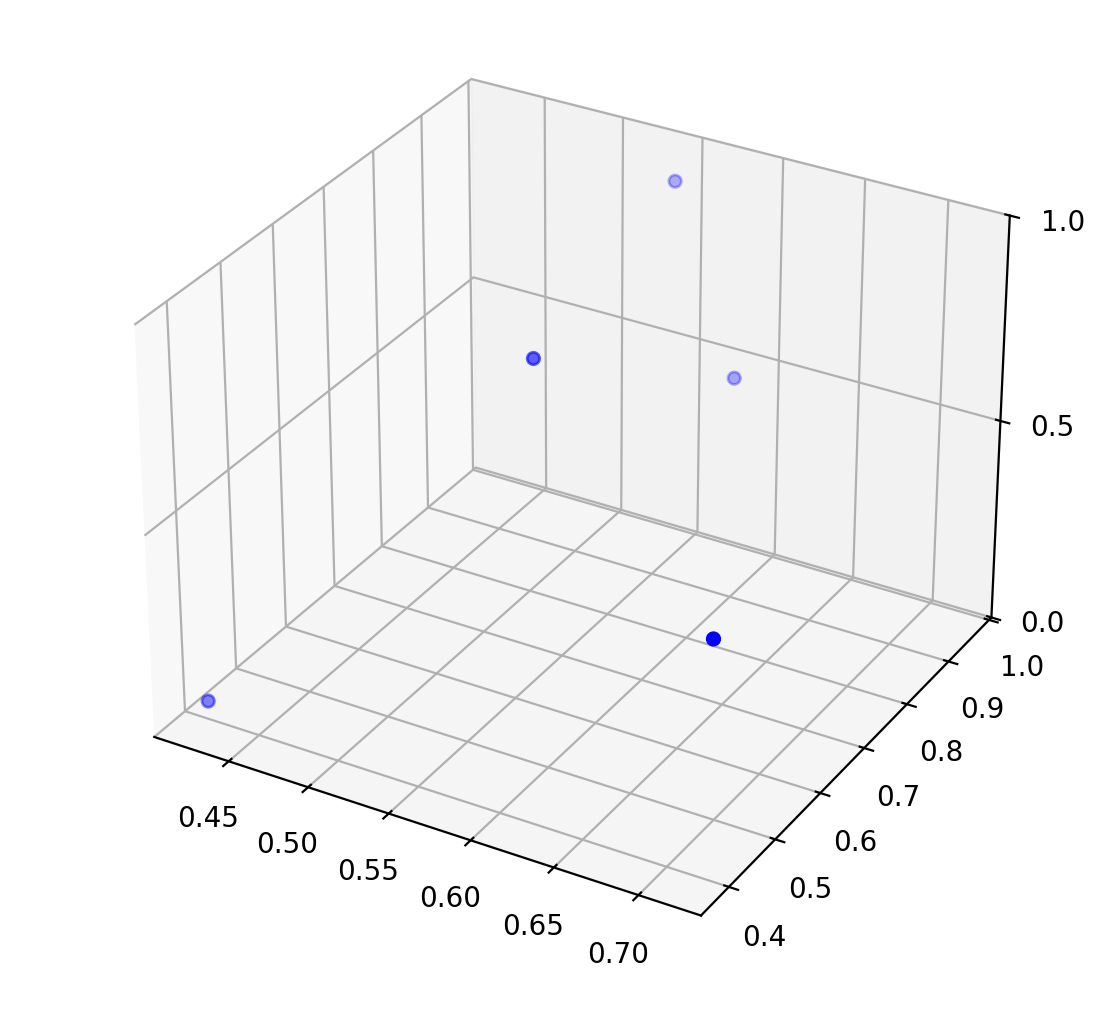
temperature \(x_1\)
population \(x_2\)
pollution
\(y\)
\(n = 5 ,\\ d = 1\)
\(n = 5 ,\\ d = 2\)
\boxed{h}
Supervised Learning
Algorithm
\rightarrow
\downarrow
y
x
\downarrow
\( \mathbb{R}^d \)
\( \mathbb{R}\)
\(\mathcal{D}_\text{train}\)
\rightarrow
\(\left\{\left(x^{(1)}, y^{(1)}\right), \dots, \left(x^{(n)}, y^{(n)}\right)\right\}\)
What do we want? A good way to label new features
For example, \(h\) : For any \(x, h(x)=1,000,000,\) valid but is it any good?
hypothesis

set of \(h\) (or specifically for today, the set of hyperplanes)
A linear regression hypothesis :
\(h\left(x ; \theta, \theta_0\right)=\theta^T x+\theta_0\)
\( = \left[\begin{array}{lllll} \theta_1 & \theta_2 & \cdots & \theta_d\end{array}\right]\) \(\left[\begin{array}{c} x_1 \\ x_2 \\ \vdots \\ x_d\end{array}\right] + \theta_0\)
parameters
data
Hypothesis class \(\mathcal{H}:\)
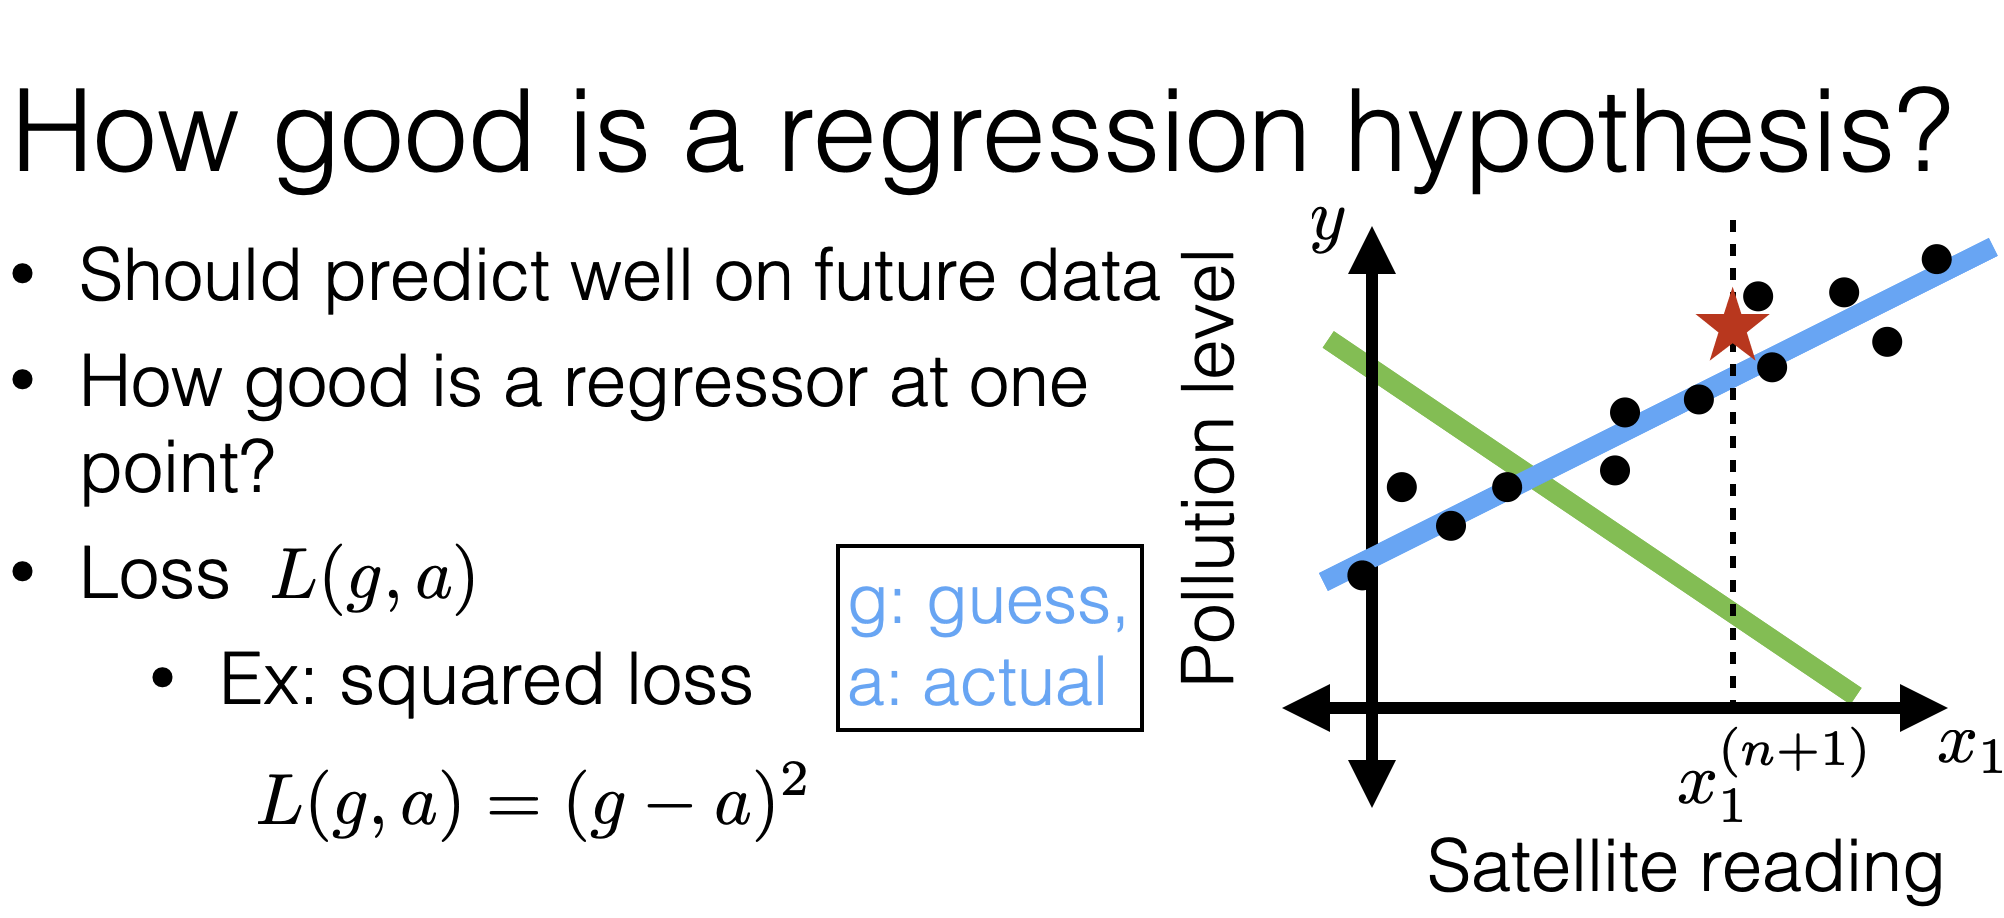
\(\mathcal{E}_{\text {test }}(h)=\frac{1}{n^{\prime}} \sum_{i=n+1}^{n+n^{\prime}} \mathcal{L}\left(h\left(x^{(i)}\right), y^{(i)}\right)\)
\(\mathcal{E}_{\text {train }}(h)=\frac{1}{n} \sum_{i=1}^n \mathcal{L}\left(h\left(x^{(i)} \right), y^{(i)}\right)\)
- Test error
- Training error
\(n'\) new points
- Squared loss
\(\mathcal{L}\left(h\left(x^{(i)}\right), y^{(i)}\right) =(h\left(x^{(i)}\right) - y^{(i)} )^2\)
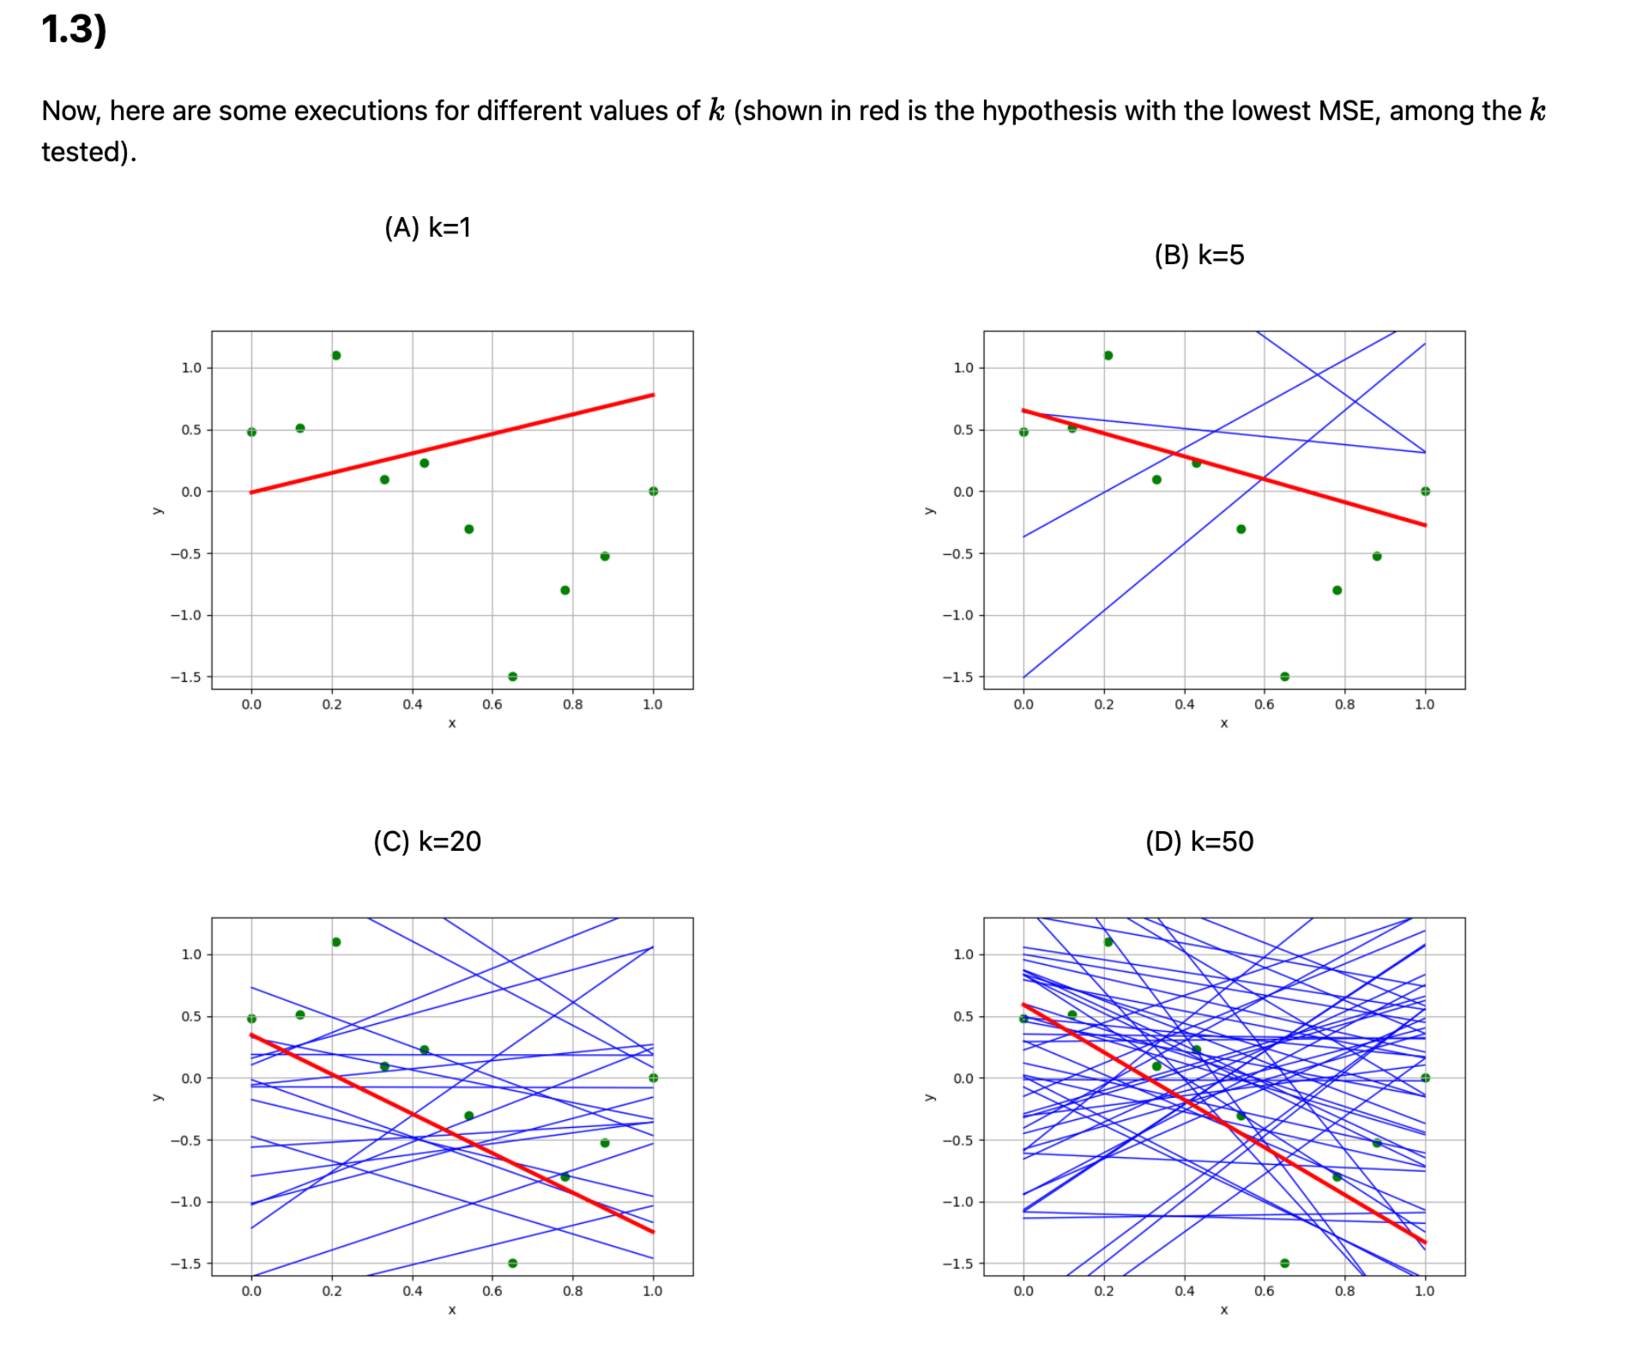
Recall lab1
def random_regress(X, Y, k):
    n, d = X.shape

    # generate k random hypotheses
    ths = np.random.randn(d, k)
    th0s = np.random.randn(1, k)

    # compute the mean squared error of each hypothesis on the data set
    errors = lin_reg_err(X, Y, ths, th0s)

    # Find the index of the hypotheses with the lowest error
    i = np.argmin(errors)

    # return the theta and theta0 parameters that define that hypothesis
    theta, theta0 = ths[:,i:i+1], th0s[:,i:i+1]
    return (theta, theta0), errors[i]
Outline
- Recap: Supervised Learning Setup, Terminology
-
Ordinary Least Square Regression
- Problem Formulation
- Closed-form Solution (when well-defined)
- When closed-form solution is not well-defined
- Mathematically, Practically, Visually
- Regularization and Ridge Regression
- Hyperparameter and Cross-validationa
Linear regression: the analytical way
- How about we just consider all hypotheses in our class and choose the one with lowest training error?
- We’ll see: not typically straightforward
- But for linear regression with square loss: can do it!
- In fact, sometimes, just by plugging in an equation!
Append a "fake" feature of \(1\)
\(h\left(x ; \theta, \theta_0\right)=\theta^T x+\theta_0\)
\( = \left[\begin{array}{lllll} \theta_1 & \theta_2 & \cdots & \theta_d\end{array}\right]\) \(\left[\begin{array}{l}x_1 \\ x_2 \\ \vdots \\ x_d\end{array}\right] + \theta_0\)
Don't want to deal with \(\theta_0\)
\( = \left[\begin{array}{lllll} \theta_1 & \theta_2 & \cdots & \theta_d & \theta_0\end{array}\right]\) \(\left[\begin{array}{c}x_1 \\ x_2 \\ \vdots \\ x_d \\ 1\end{array}\right] \)
\( = \theta_{\mathrm{aug}}^T x_{\mathrm{aug}}\)
"center" the data
Don't want to deal with \(\theta_0\)
\Rightarrow
"center" the data
\Rightarrow
temperature \(x_1\)
population \(x_2\)
pollution
\(y\)
temperature \(x_1\)
population \(x_2\)
pollution
\(y\)
center the data
| Temperature | Population | Pollution | |
|---|---|---|---|
| Chicago | 90 | 45 | 7.2 |
| New York | 20 | 32 | 9.5 |
| Boston | 35 | 100 | 8.4 |
| Temperature | Population | Pollution | |
|---|---|---|---|
| Chicago | 41.66 | -14 | -1.66 |
| New York | -28.33 | -27 | 1.133 |
| Boston | -13.33 | 41 | 0.033 |
\Rightarrow
Assemble
X = \begin{bmatrix}x_1^{(1)} & \dots & x_d^{(1)}\\\vdots & \ddots & \vdots\\x_1^{(n)} & \dots & x_d^{(n)}\end{bmatrix}
Y = \begin{bmatrix}y^{(1)}\\\vdots\\y^{(n)}\end{bmatrix}
| Temperature | Population | Pollution | |
|---|---|---|---|
| Chicago | 41.66 | -14 | -1.66 |
| New York | -28.33 | -27 | 1.133 |
| Boston | -13.33 | 41 | 0.033 |
Now the training error:
Assemble
X = \begin{bmatrix}x_1^{(1)} & \dots & x_d^{(1)}\\\vdots & \ddots & \vdots\\x_1^{(n)} & \dots & x_d^{(n)}\end{bmatrix}
Y = \begin{bmatrix}y^{(1)}\\\vdots\\y^{(n)}\end{bmatrix}
\[=\frac{1}{n}({X} \theta-{Y})^{\top}({X} \theta-{Y})\]
\[ J(\theta) = \frac{1}{n} \sum_{i=1}^n\left({x^{(i)}}^{\top}\theta -y^{(i)}\right)^2\]
Outline
- Recap: Supervised Learning Setup, Terminology
-
Ordinary Least Square Regression
- Problem Formulation
- Closed-form Solution (when well-defined)
- When closed-form solution is not well-defined
- Mathematically, Practically, Visually
- Regularization and Ridge Regression
- Hyperparameter and Cross-validationa
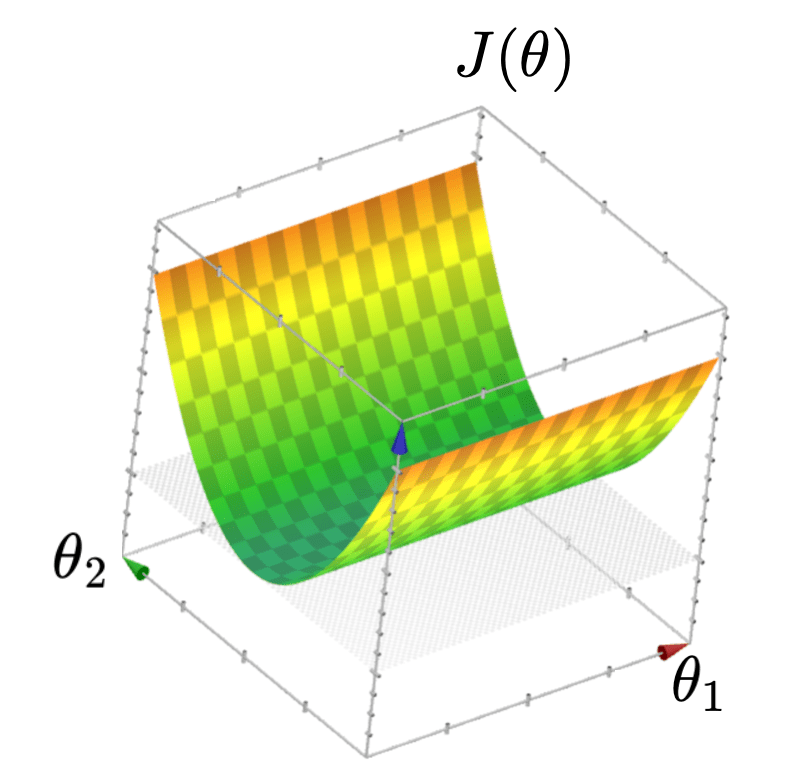
- Goal: find \(\theta\) to minimize \(J(\theta)\)
- Q: What kind of function is \(J(\theta)\)?
- A: Quadratic function
- Q: What does \(J(\theta)\) look like?
- A: Typically, looks like a "bowl"
🥰
\[ J(\theta) =\frac{1}{n}({X} \theta-{Y})^{\top}({X} \theta-{Y})\]
Objective function (training error)
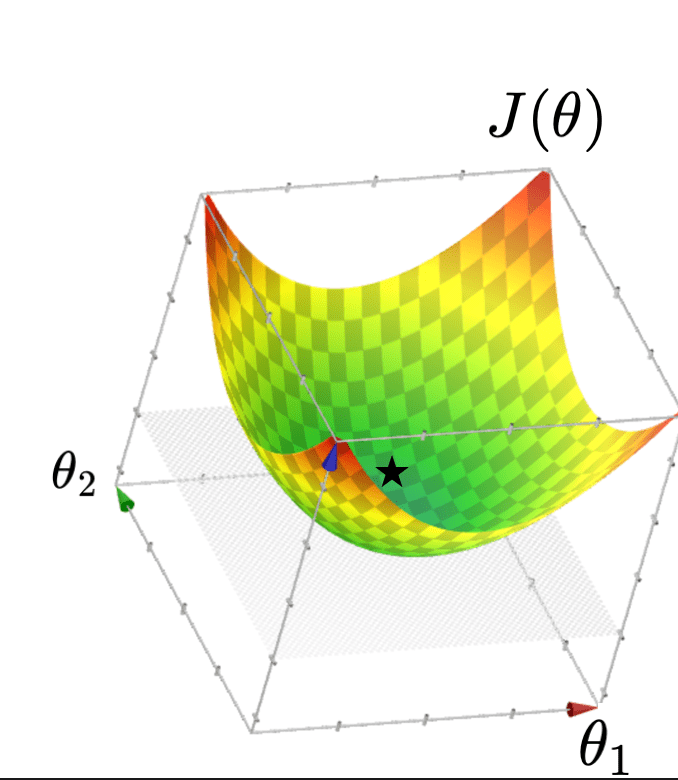
- Typically, \(J(\theta)=\frac{1}{n}({X} \theta-{Y})^{\top}({X} \theta-{Y})\) "curves up" and is unique minimized at a point if gradient at that point is zero
Set the gradient \(\nabla_\theta J\stackrel{\text { set }}{=} 0\)
- When \(\theta^*\) is well defined, it's indeed guaranteed to be the unique minimizer of \(J(\theta\))
\(\nabla_\theta J=\left[\begin{array}{c}\partial J / \partial \theta_1 \\ \vdots \\ \partial J / \partial \theta_d\end{array}\right]\)
= \(\frac{2}{n}\left(X^T X \theta-X^T Y\right)\)
\Rightarrow
\(\theta^*=\left({X}^{\top} {X}\right)^{-1} {X}^{\top} {Y}\)
Outline
- Recap: Supervised Learning Setup, Terminology
-
Ordinary Least Square Regression
- Problem Formulation
- Closed-form Solution (when well-defined)
-
When closed-form solution is not well-defined
- Mathematically, Practically, Visually
- Regularization and Ridge Regression
- Hyperparameter and Cross-validationa
- \(\theta^*=\left({X}^{\top} {X}\right)^{-1} {X}^{\top} {Y}\) is only well-defined if \(\left({X}^{\top} {X}\right)\) is invertible
- and \(\left({X}^{\top} {X}\right)\) is invertible if and only if \({X}\) is full column rank

a. either when \(n\)<\(d\) , or
b. columns (features) in \( {X} \) have linear dependency
So, we will be in trouble if \({X}\) is not full column rank, which happens:
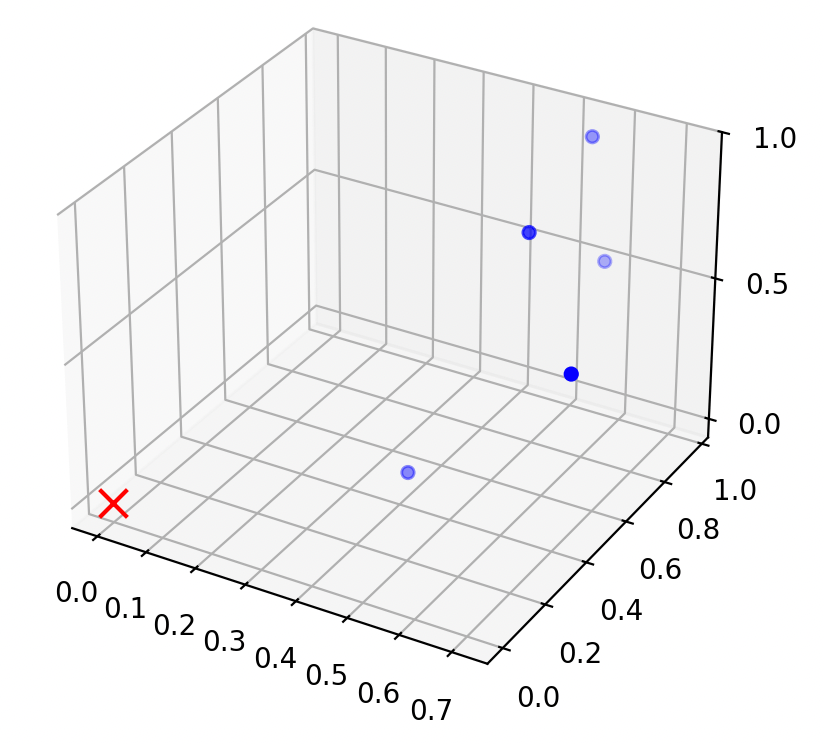
| Case | Example | Objective Function Looks Like | Optimal Parameters |
|---|---|---|---|
| 2a. less data than features |
|||
| 2b. linearly dependent features |
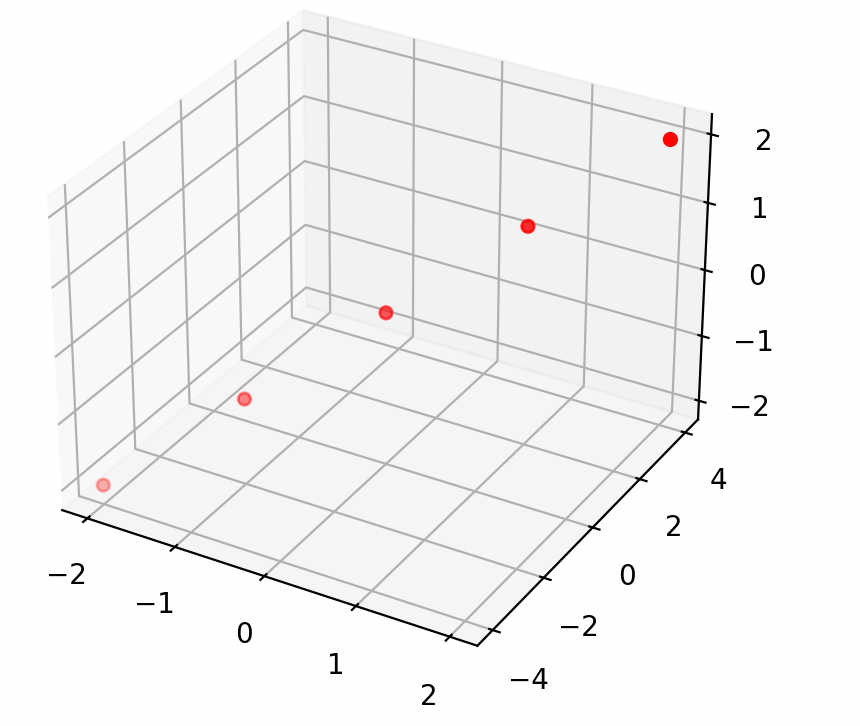
infinitely many optimal parameters
(that define optimal hyperplanes)
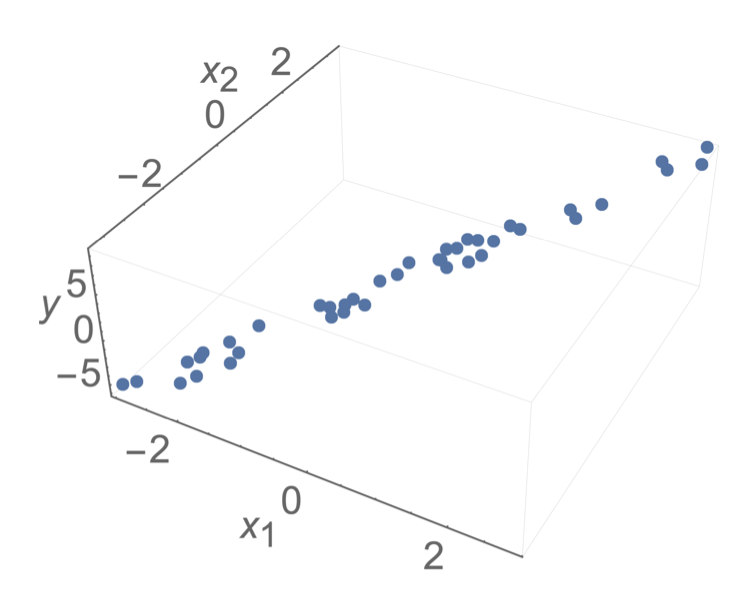
temperature \(x_1\)
population \(x_2\)
pollution
\(y\)
temperature ( °F) \(x_1\)
temperature (°C) \(x_2\)
pollution
\(y\)
Quick Summary:
- This 👈 formula is not well-defined
1. Typically, \(X\) is full column rank
🥺
🥰
- \(\theta^*=\left({X}^{\top} {X}\right)^{-1} {X}^{\top} {Y}\)
- \(J(\theta)\) looks like a bowl
a. either when \(n\)<\(d\) , or
b. columns (features) in \( {X} \) have linear dependency
2. When \(X\) is not full column rank
- \(J(\theta)\) looks like a half-pipe
- Infinitely many optimal hyperplanes
- \(\theta^*\) gives the unique optimal hyperplane
Outline
- Recap: Supervised Learning Setup, Terminology
- Ordinary Least Square Regression
- Problem Formulation
- Closed-form Solution (when well-defined)
- When closed-form solution is not well-defined
- Mathematically, Practically, Visually
- Regularization and Ridge Regression
- Hyperparameter and Cross-validation
🥰
🥺
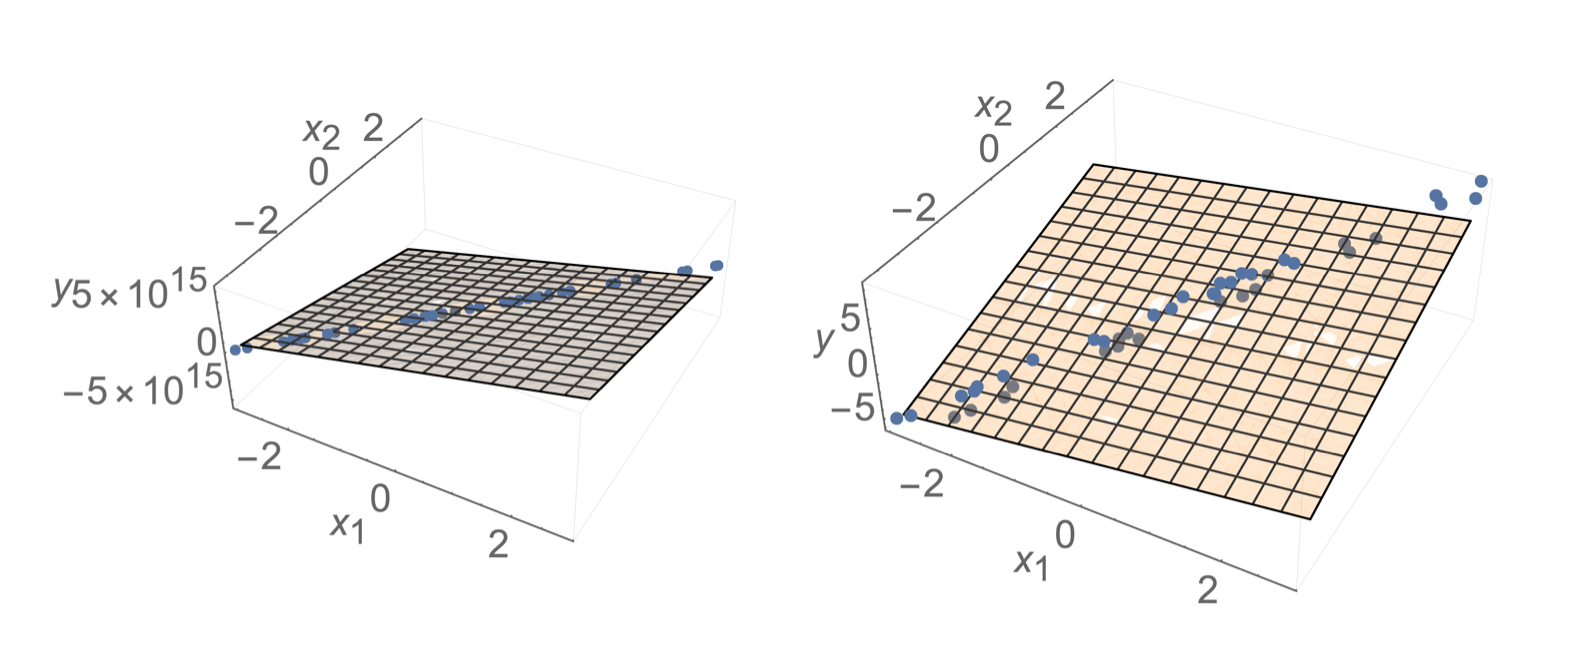
- Sometimes, noise can resolve the invertibility issue
- How to choose among hyperplanes?
- but still lead to undesirable results
- Prefer \(\theta\) with small magnitude (less sensitive prediction when \(x\) changes slightly)
Ridge Regression
- Add a square penalty on the magnitude
- \(J_{\text {ridge }}(\theta)=\frac{1}{n}({X} \theta-{Y})^{\top}({X} \theta-{Y})+\lambda\|\theta\|^2\)
- \(\lambda \) is a so-called "hyperparameter"
- Setting \(\nabla_\theta J_{\text {ridge }}(\theta)=0\) we get \(\theta^*=\left({X}^{\top} {X}+n \lambda I\right)^{-1} {X}^{\top} {Y}\)
- (\(\theta^*\) (here) always exists, and is always the unique optimal parameters.)
- (see recitation/hw for discussion about the offset.)
Outline
- Recap: Supervised Learning Setup, Terminology
- Ordinary Least Square Regression
- Problem Formulation
- Closed-form Solution (when well-defined)
- When closed-form solution is not well-defined
- Mathematically, Practically, Visually
- Regularization and Ridge Regression
- Hyperparameter and Cross-validation

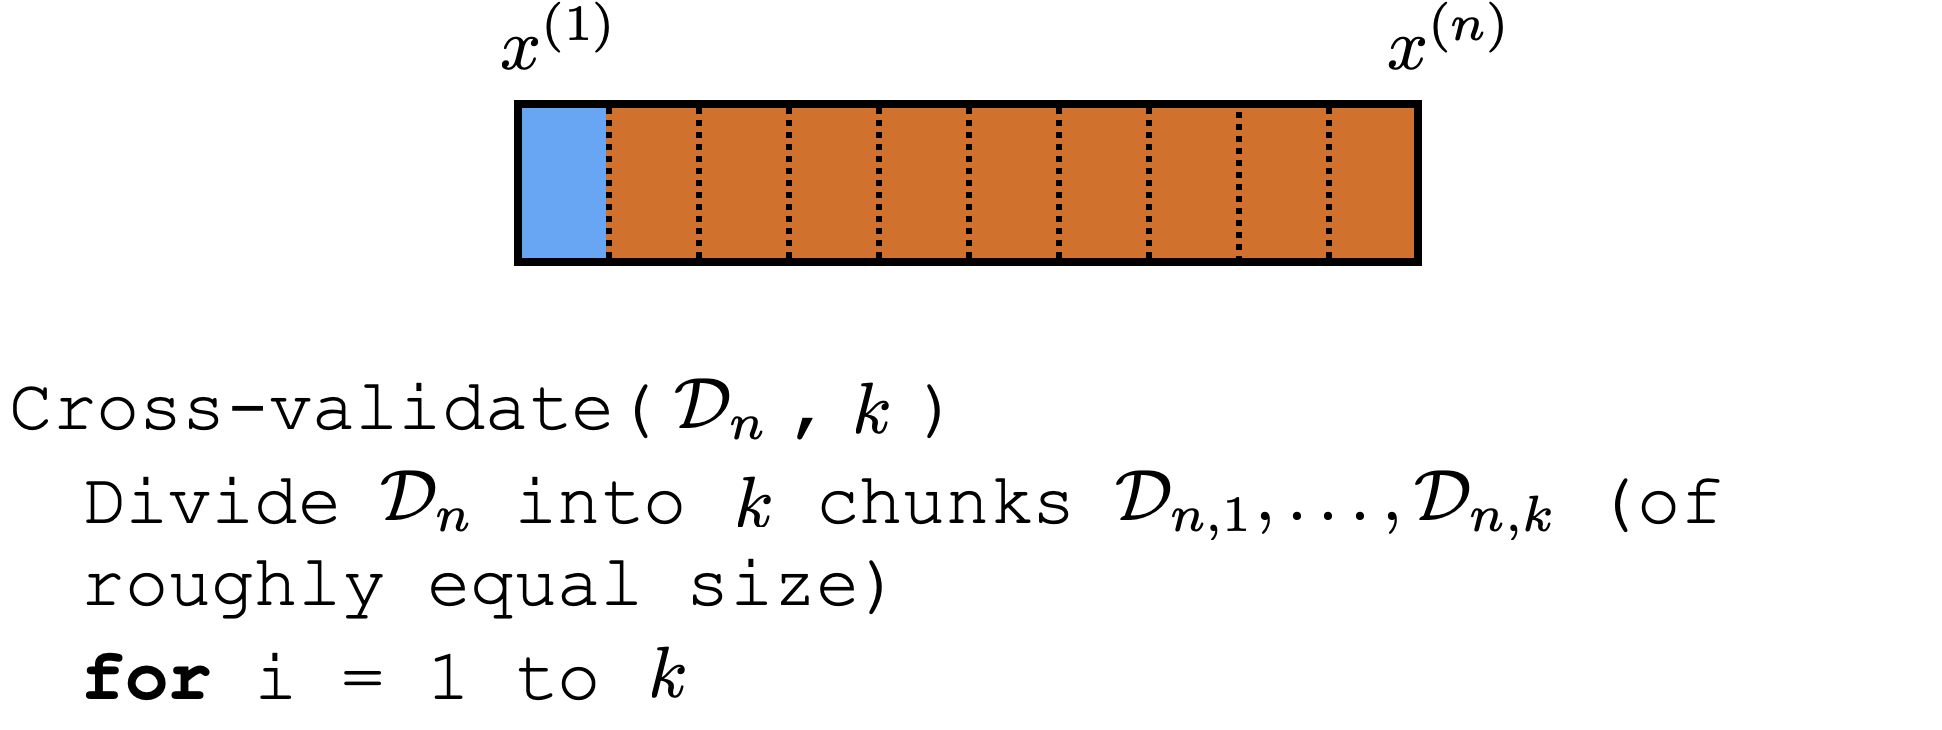
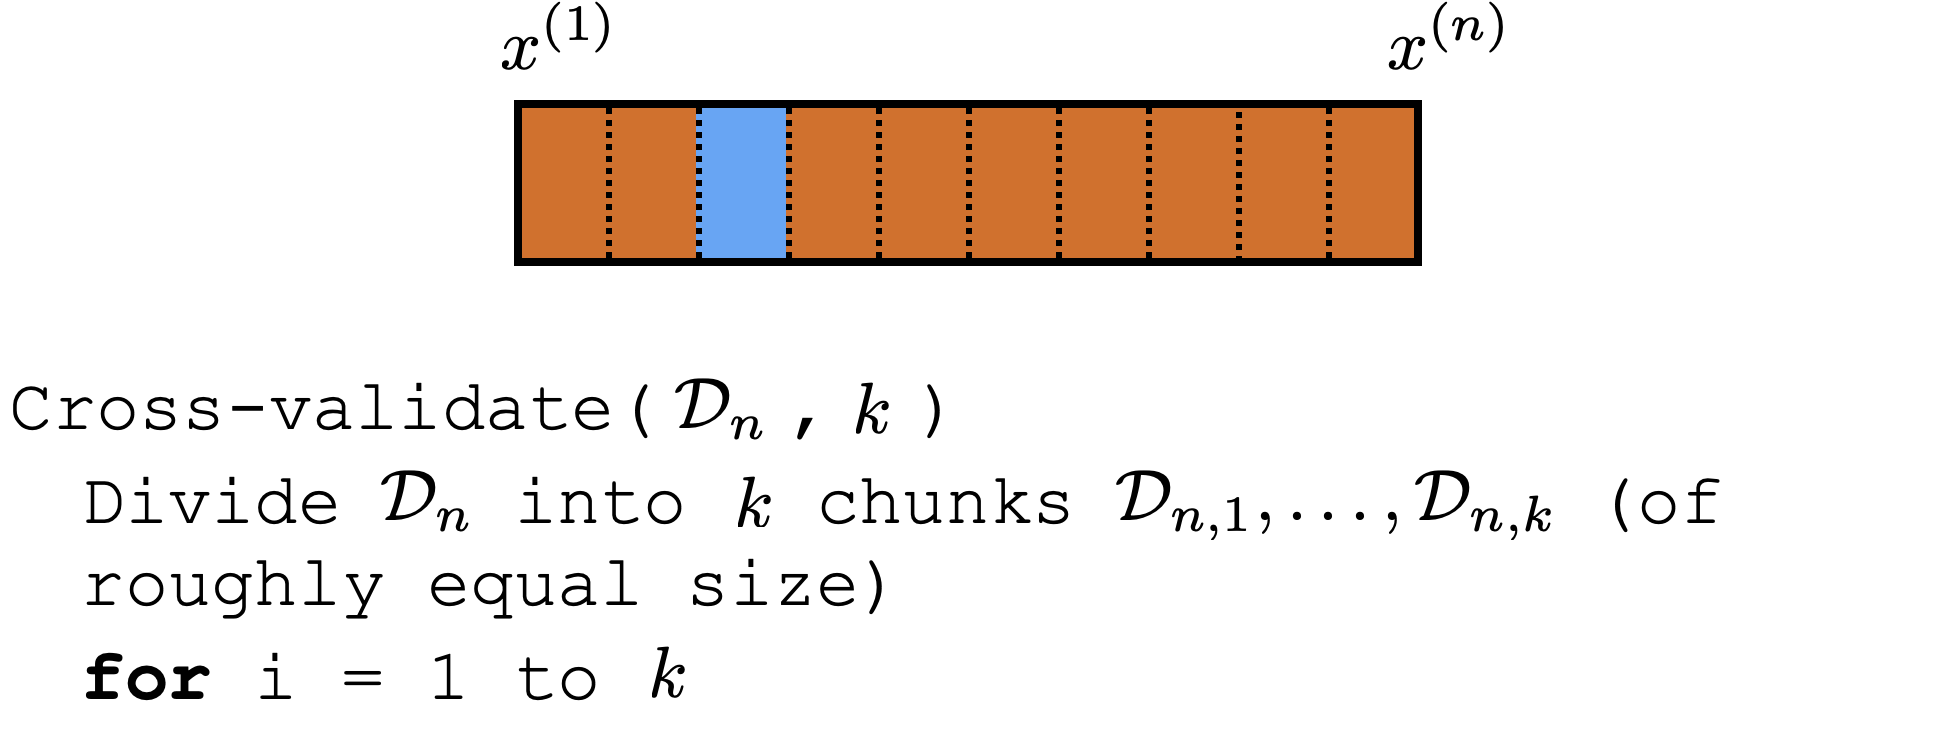
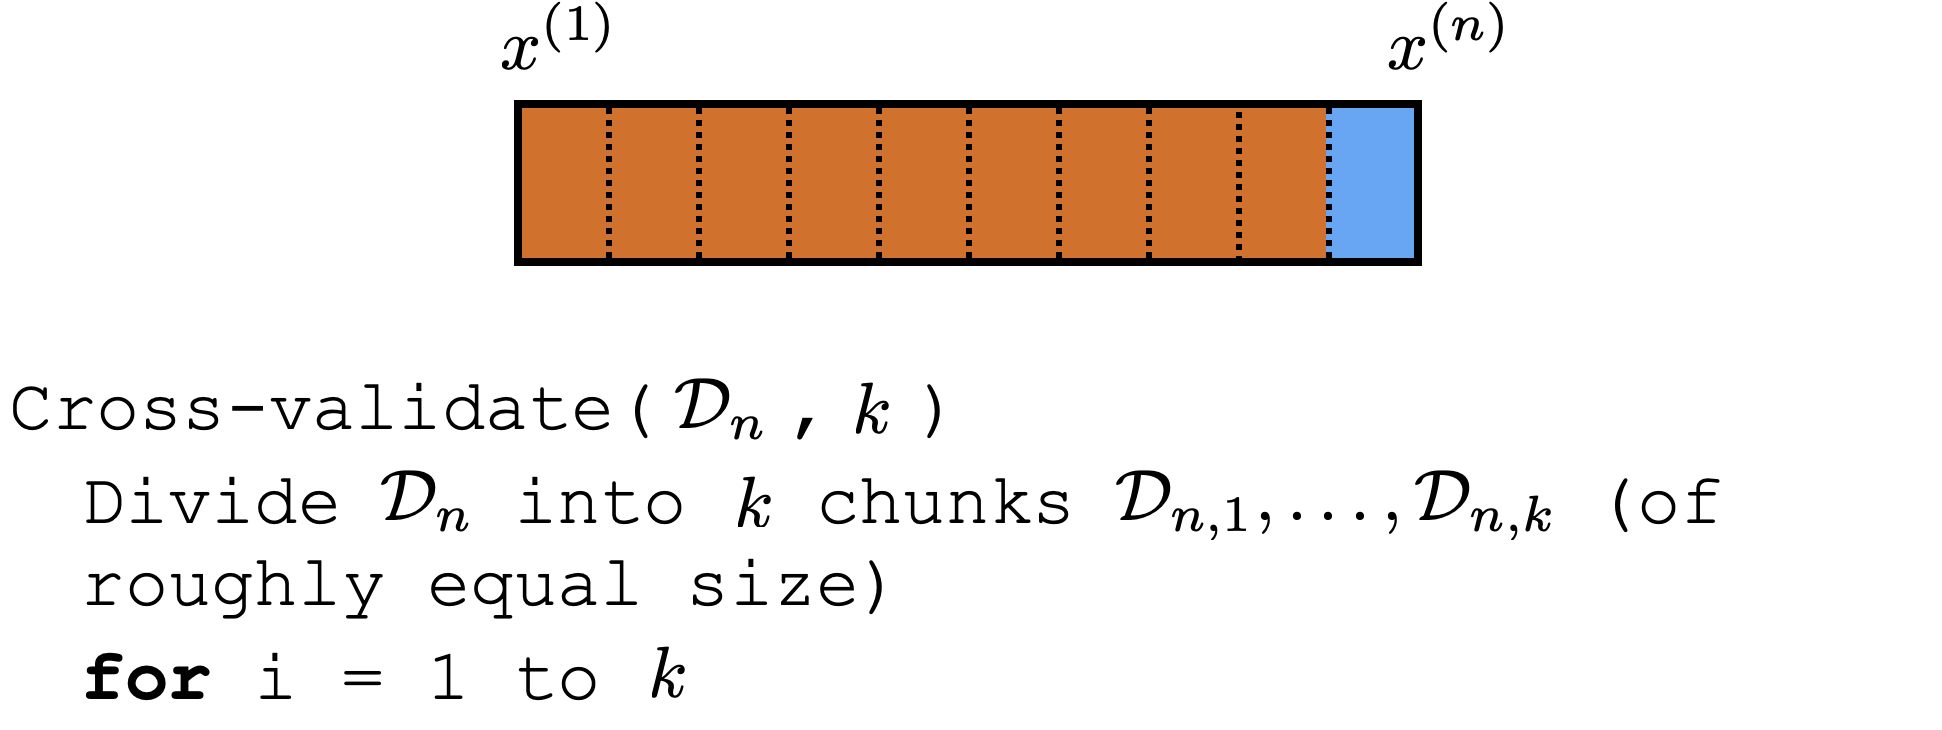
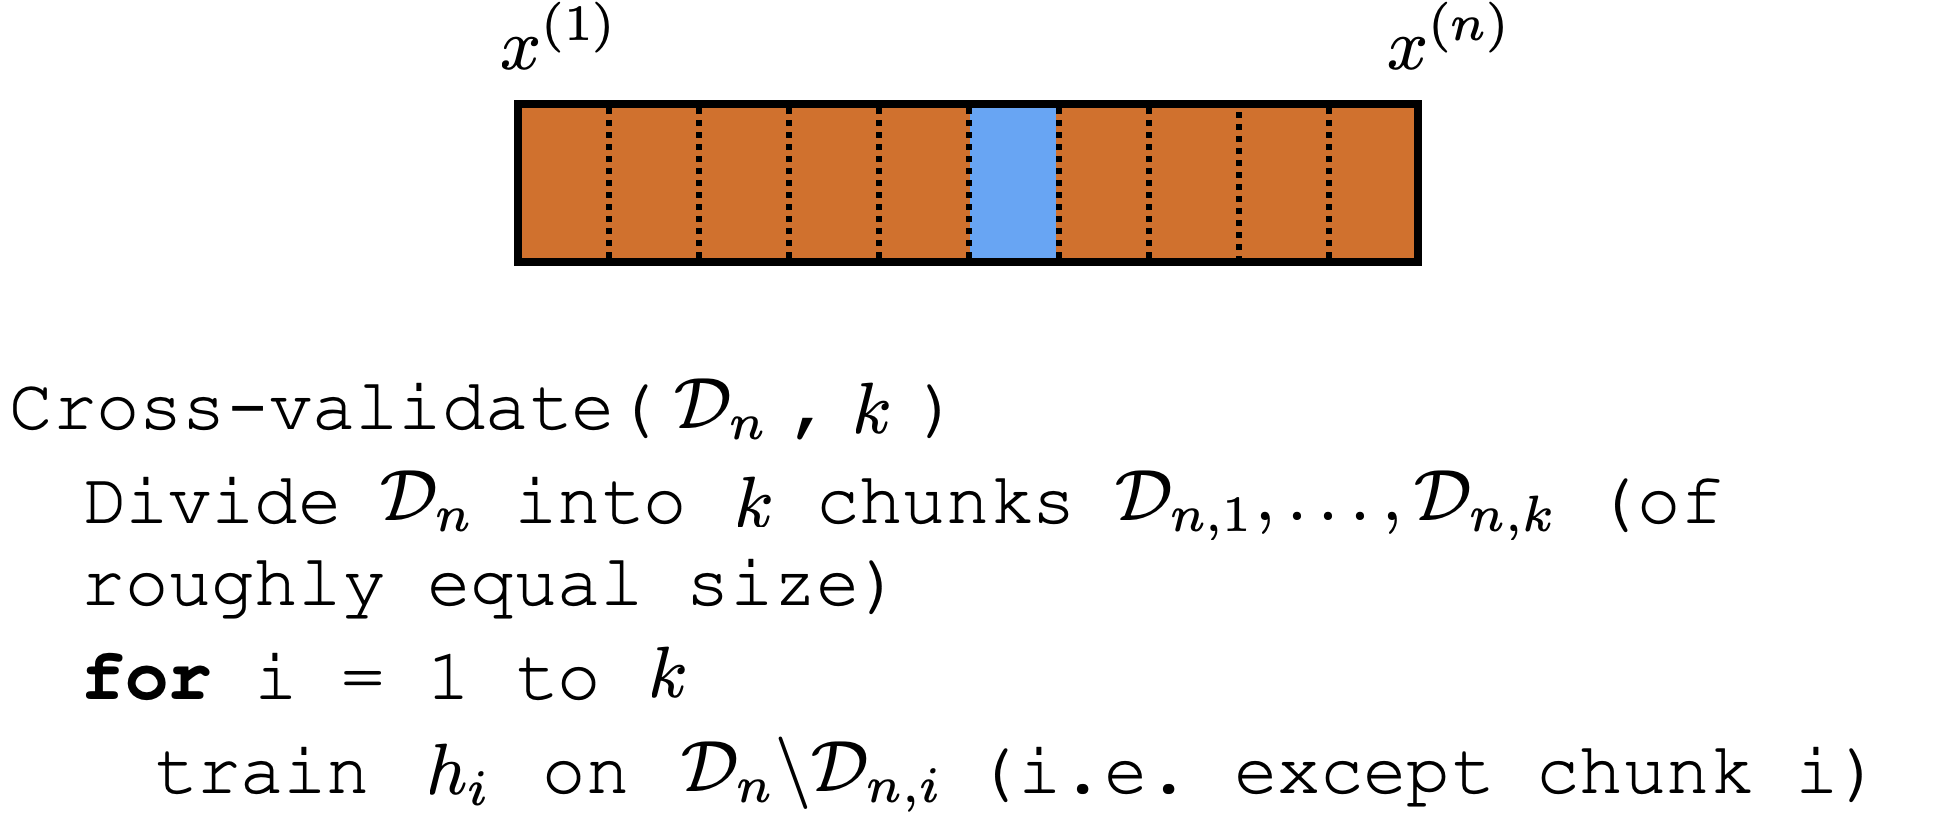
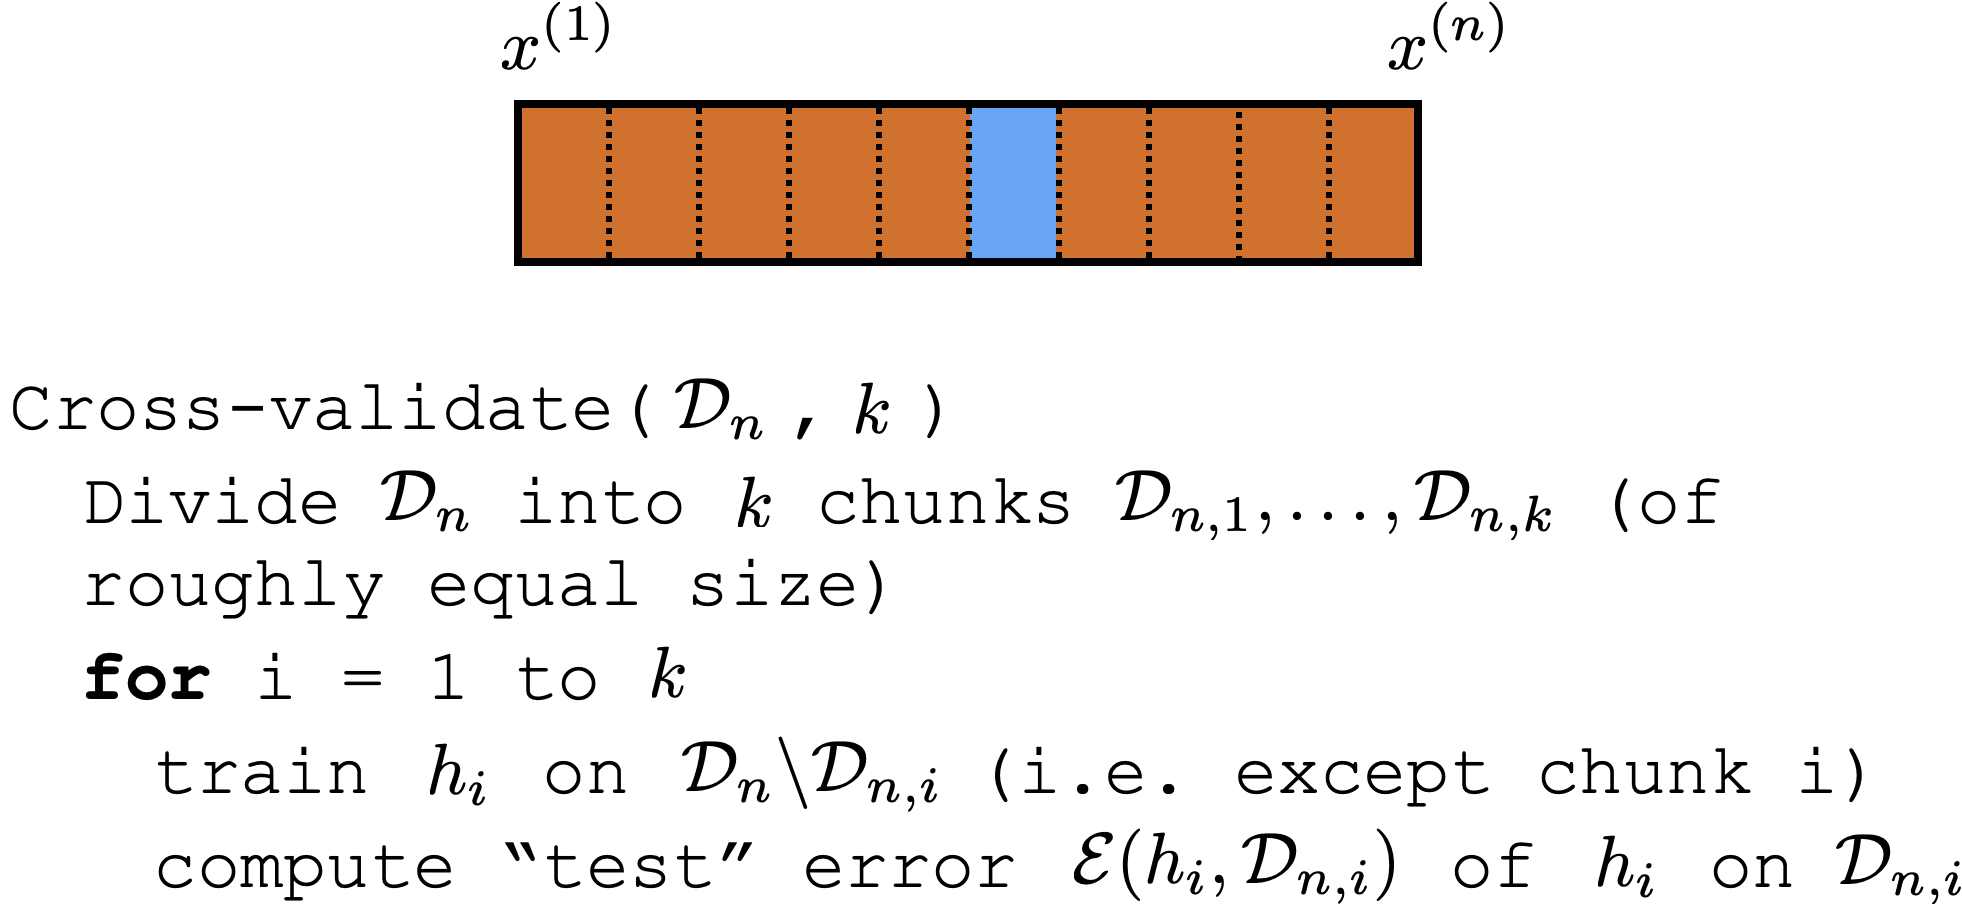
Cross-validation
Cross-validation
Cross-validation
\dots
Cross-validation
Cross-validation
Cross-validation
Cross-validation
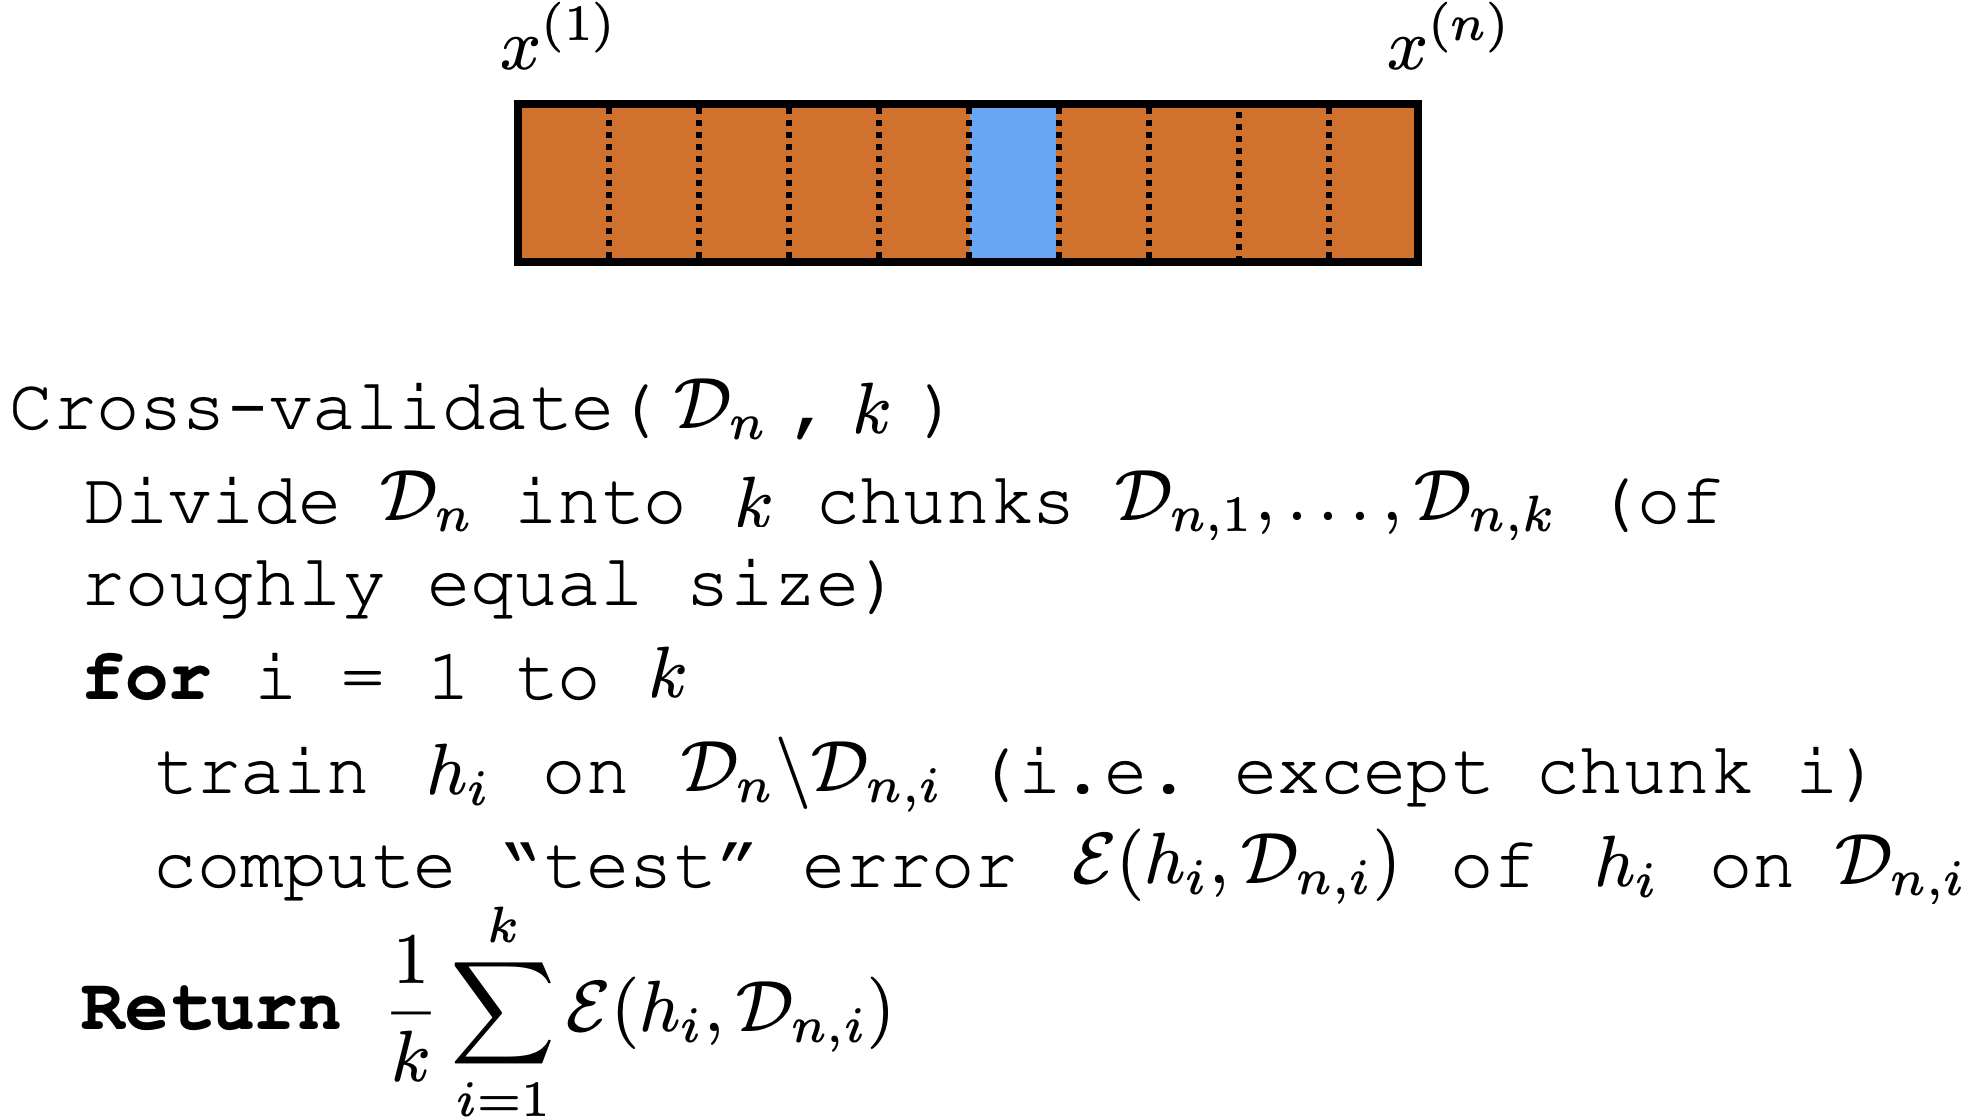
Comments on (cross)-validation
-
good idea to shuffle data first
-
a way to "reuse" data
-
it's not to evaluate a hypothesis
-
rather, it's to evaluate learning algorithm (e.g. hypothesis class choice, hyperparameters)
-
Could e.g. have an outer loop for picking good hyperparameter or hypothesis class
Thanks!
We'd love to hear your thoughts.


Lyrics sync


prompt engineered by

Lyrics:
Melody and Vocal:
Video Production:
Image Prep:
- Recall: training error: \[\frac{1}{n} \sum_{i=1}^n L\left(h\left(x^{(i)}\right), y^{(i)}\right)\]
- With squared loss: \[\frac{1}{n} \sum_{i=1}^n\left(h\left(x^{(i)}\right)-y^{(i)}\right)^2\]
- Using linear hypothesis (with extra "1" feature): \[\frac{1}{n} \sum_{i=1}^n\left(\theta^{\top} x^{(i)}-y^{(i)}\right)^2\]
- With given data, the error only depends on \(\theta\), so let's call the error \(J(\theta)\)
Recall week1 intro
What do we want to learn:
- A hypothesis (or more concretely, a set of parameters)
- that's "good"
What do we have:
- Some data
- Some ideas about the structure of the problem
Recall week1 intro
What do we want to learn:
- A hypothesis (or more concretely, a set of parameters)
- that's "good"
What do we have:
- Some data
- Some ideas about the structure of the problem
With \(\lambda \uparrow\) , typically tend to structural error \(\uparrow\) but estimation error \( \downarrow\)
Minimizing training error doesn't always gives us a hypothesis that performs well on unseen data -- one of the central struggles ML has
Very roughly, broken into two camps:
structural error (due to model class)
estimation error (due to e.g. not enough data)
- hypothesis class isn't rich enough
- bad hyperparameter
- unreasonable loss function
- "garbage in garbage out"
- training data doesn't represent test data
Summary
- For the OLS, we can find the optimizer analytically via basic calculus! Take the gradient and set it to zero. (General optimization needs more than gradient info; suffices in OLS)
- Two scenarios when closed-form formula not well-defined. Need to be careful about understanding the consequences.
- Ill-conditioned, When there are many possible solutions, we need to indicate our preference somehow.
- Regularization is a way to construct a new optimization problem.
Regularization can help battle overfitting (sensitive model). - Least-squares regularization leads to the ridge-regression formulation. Good news: we can still solve it analytically!
Validation/cross-validation are a way to choose regularization hyper parameters. Hyperparameters and how to pick them; cross-validation.
| Temperature | Population | Pollution | |
|---|---|---|---|
| Chicago | 90 | 45 | 7.2 |
| New York | 20 | 32 | 9.5 |
| Boston | 35 | 100 | 8.4 |
\[ J(\theta) = \frac{1}{n} \sum_{i=1}^n\left({x^{(i)}}^{\top}\theta -y^{(i)}\right)^2\]
6.390 IntroML (Spring25) - Lecture 2 Linear Regression and Regularization
By Shen Shen


