Stance Detection from Weakly-supervised Text
Automatic animations between code
Dr. Srijith Rajamohan
Problem
-
Natural Language Understanding for determining political affiliation/stance
- Understanding intent is difficult
- Additionally, accurately labeled data is rarely available - weak supervision
- We look at Twitter User Descriptions (TUD)
-
Active learning
- Use embeddings to learn to separate stance from noisy labels
- Deep Neural Networks (DNN) used to create projections that assist humans in classifying documents?
- Can we get some insight into this decision-making process?
-
What techniques can be used to create these projections?
- PCA, MDS, Isomap, t-SNE
Solution Overview
- Gather Twitter data related to certain political hashtags, along with user metadata
- Train a classifier on this weakly-supervised data
- Self-attention based BiLSTM with pretrained static and contextual embeddings (Elmo)
- Project affiliation in a 2D space similar to a form of Aspect-Based Sentiment Analysis (ABSA)
- Interactive web application to visualize and help correctly label this weakly-supervised data
-
Evaluate
- Visualization/cognitive efficiencies of various dimensionality reduction techniques
- Classification performance of various embeddings
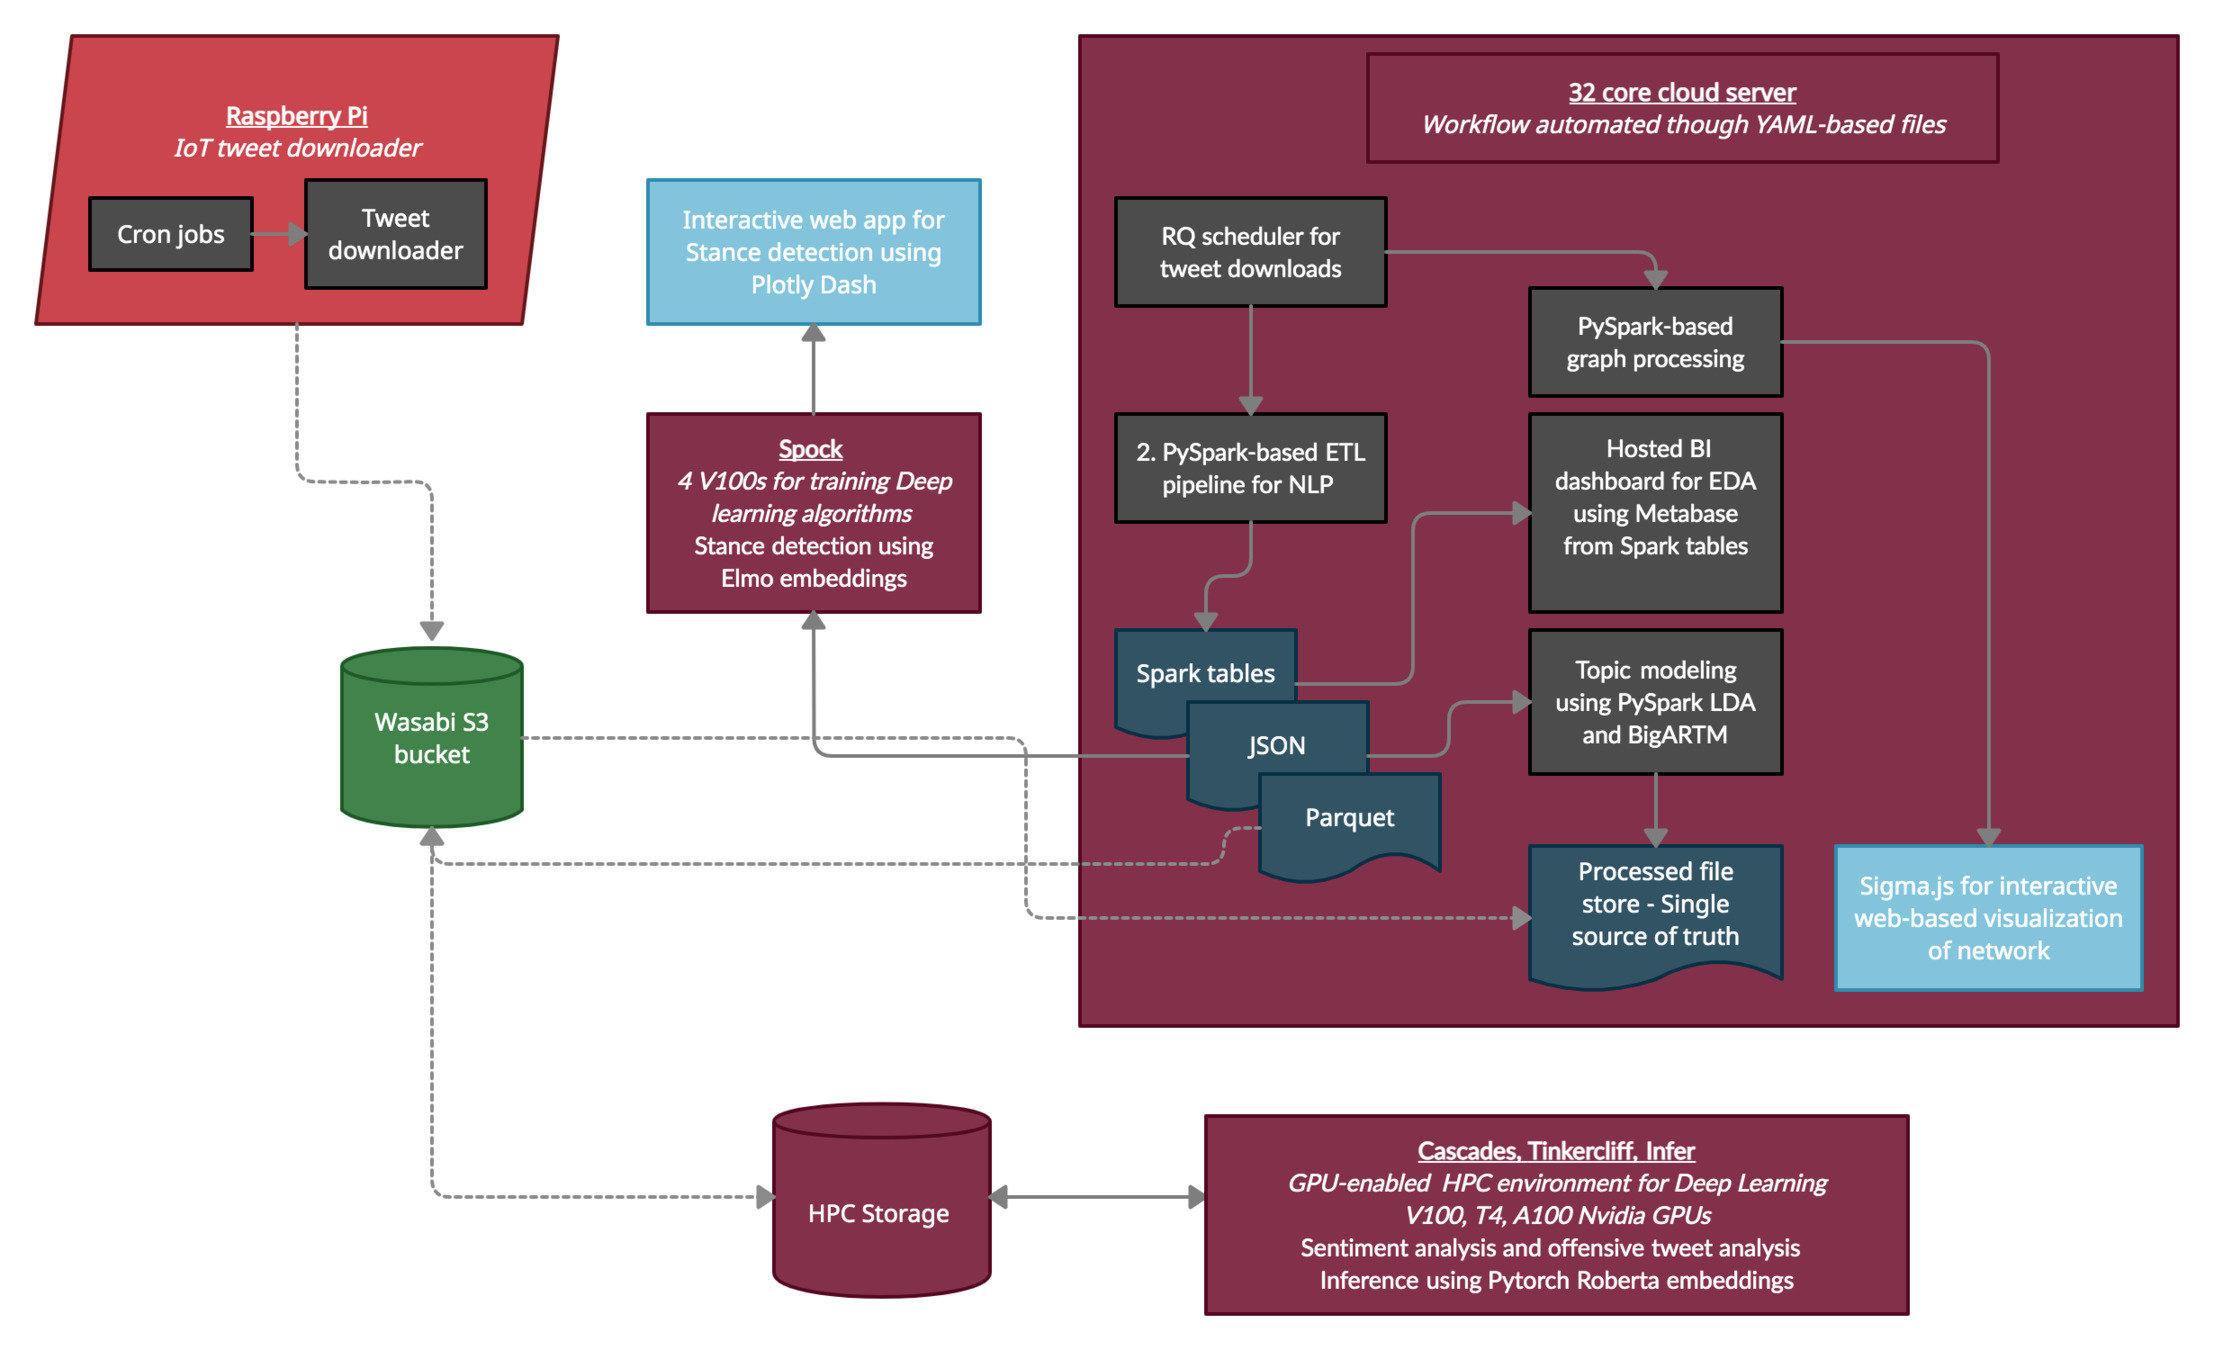
Data Ingestion Pipeline
- VT cloud server
- 18 cores,192GB RAM, 200 + 500GB volume
- Conda environments for package management
- Python RQ
- Redis-based framework for job scheduling
- Uses Tweepy for interaction with Twitter
- Downloads and stores tweets corresponding to certain hashtags in timestamped files
- MongoDB setup for interacting with the data
- Metabase used as a dashboard for this DB
- Interactive filtering, visualizing and exploratory analysis
Data Cleaning
- Weakly-supervised data
- Noisy labels because tweet hashtags do not correspond to affiliation
- PySpark for data preprocessing
- John Snow Labs Sparknlp library
- Data cleaning
- Remove hyperlinks, emoticons
- Remove entries with empty Twitter User Descriptions (TUDs)
- No stemming or lemmatization was done
- Not recommended for contextual embeddings
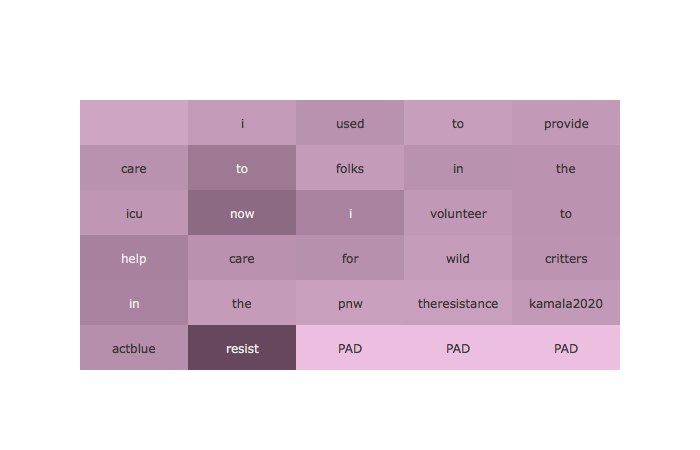
Aspect-Based Sentiment Analysis
- Different from sentiment analysis
- Learn an entity’s opinion towards a number of topics that constitute a person’s political alignment here
- Different from simply expressing a positive or negative sentiment
- ABSA also referred to as stance detection
- Frame this as inter-point distance in n-dimensional space
- Stance detection performed on Twitter User Description
- Training done on these TUDs
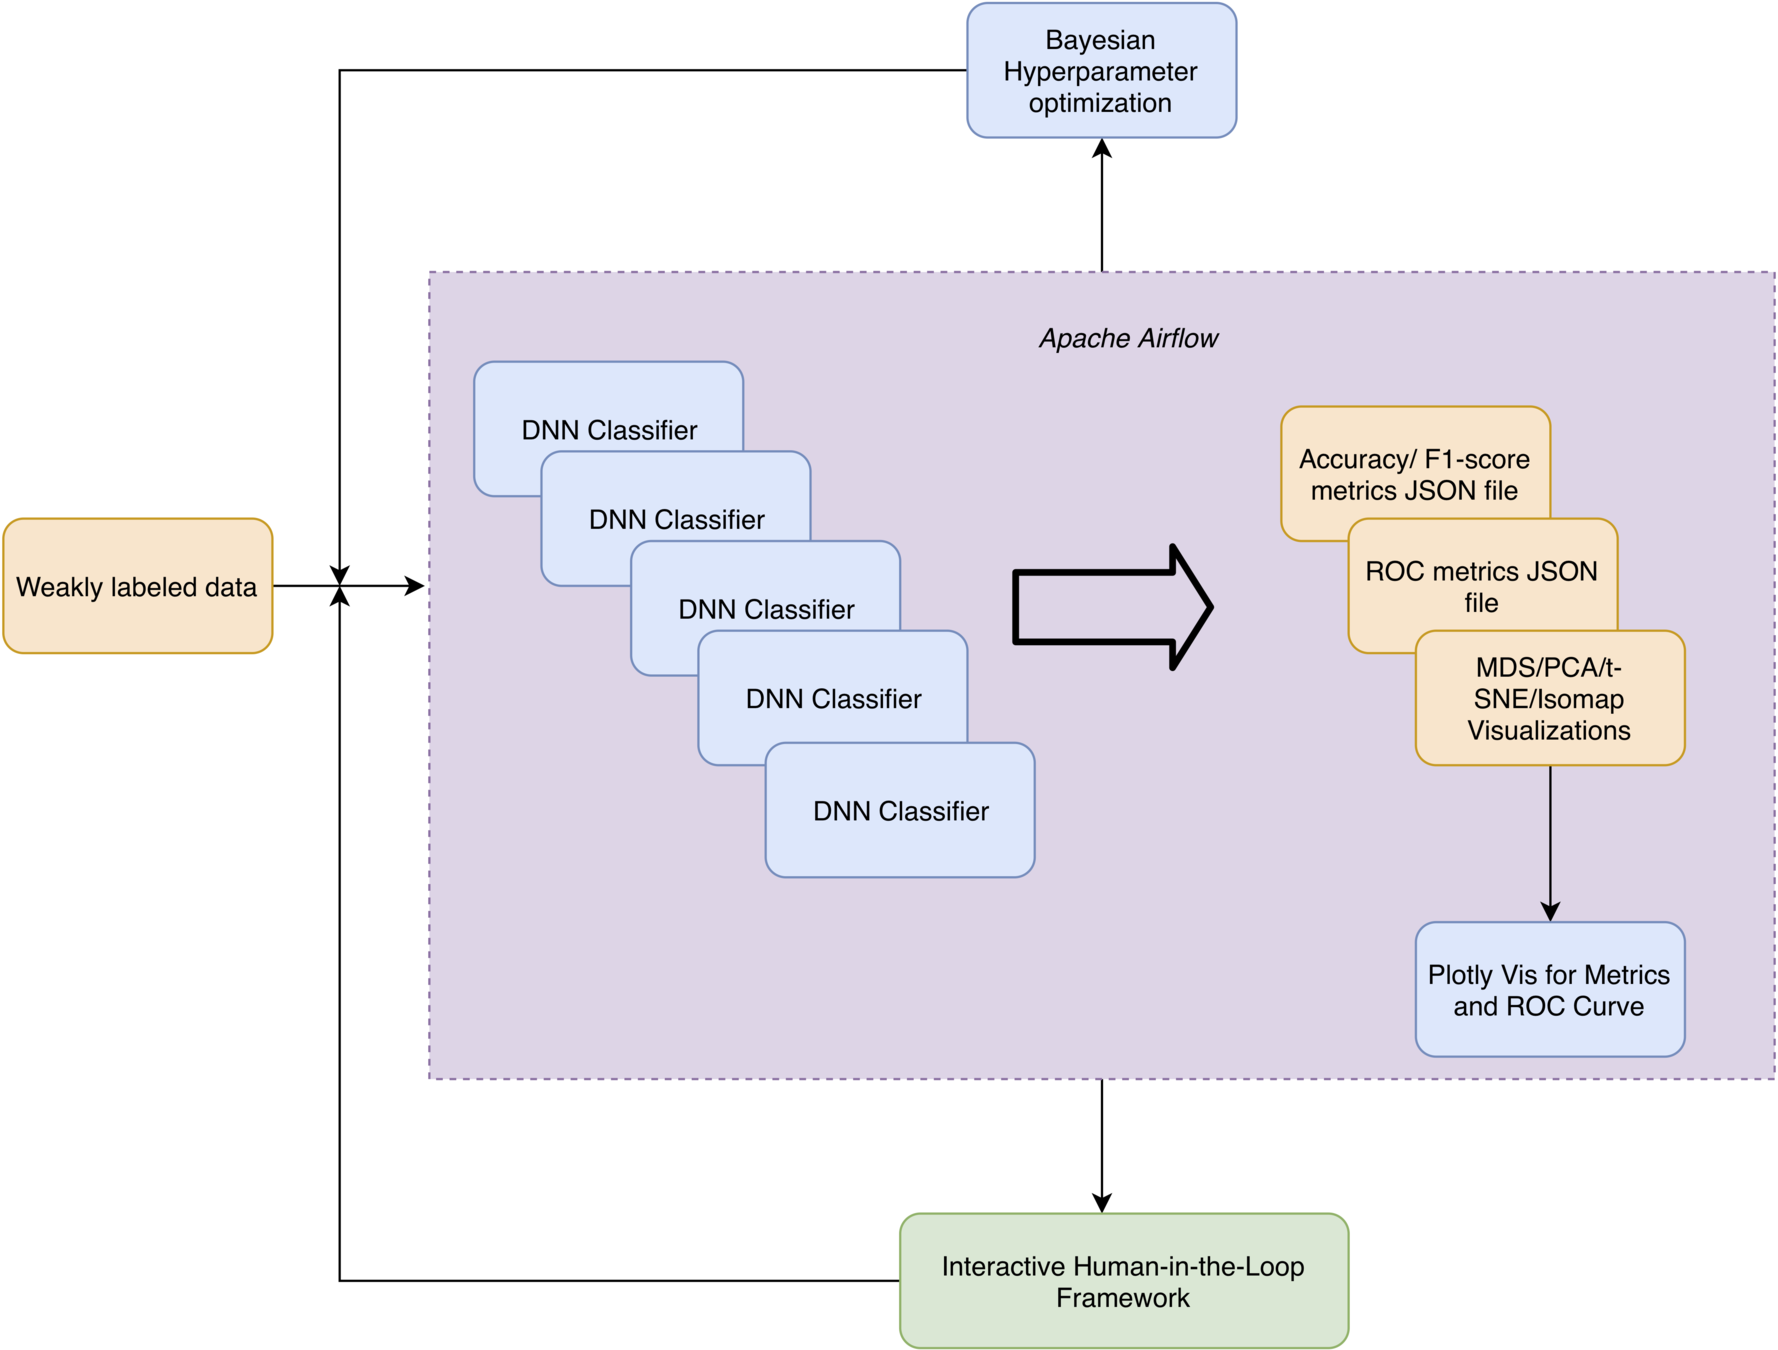
Training
- PyTorch code runs on GPUs
- 4 Volta GPU node with 16GB per-GPU memory
- Workflow automated with Airflow
-
PyTorch code:
- Model training
- Generates metrics for accuracy, F1-score and ROC scores
- Dimension reduction for visualization
-
Plot.ly used for generating the graphs
- Generating the plots from the metric files generated by PyTorch
-
PyTorch code:
- Hyperparameter optimization done with Comet.ml
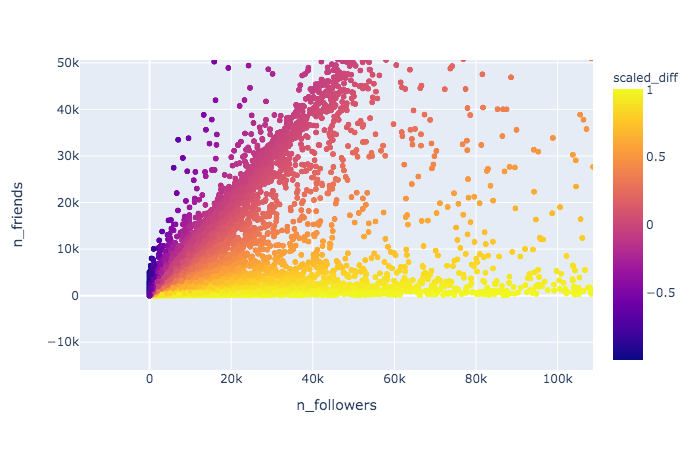
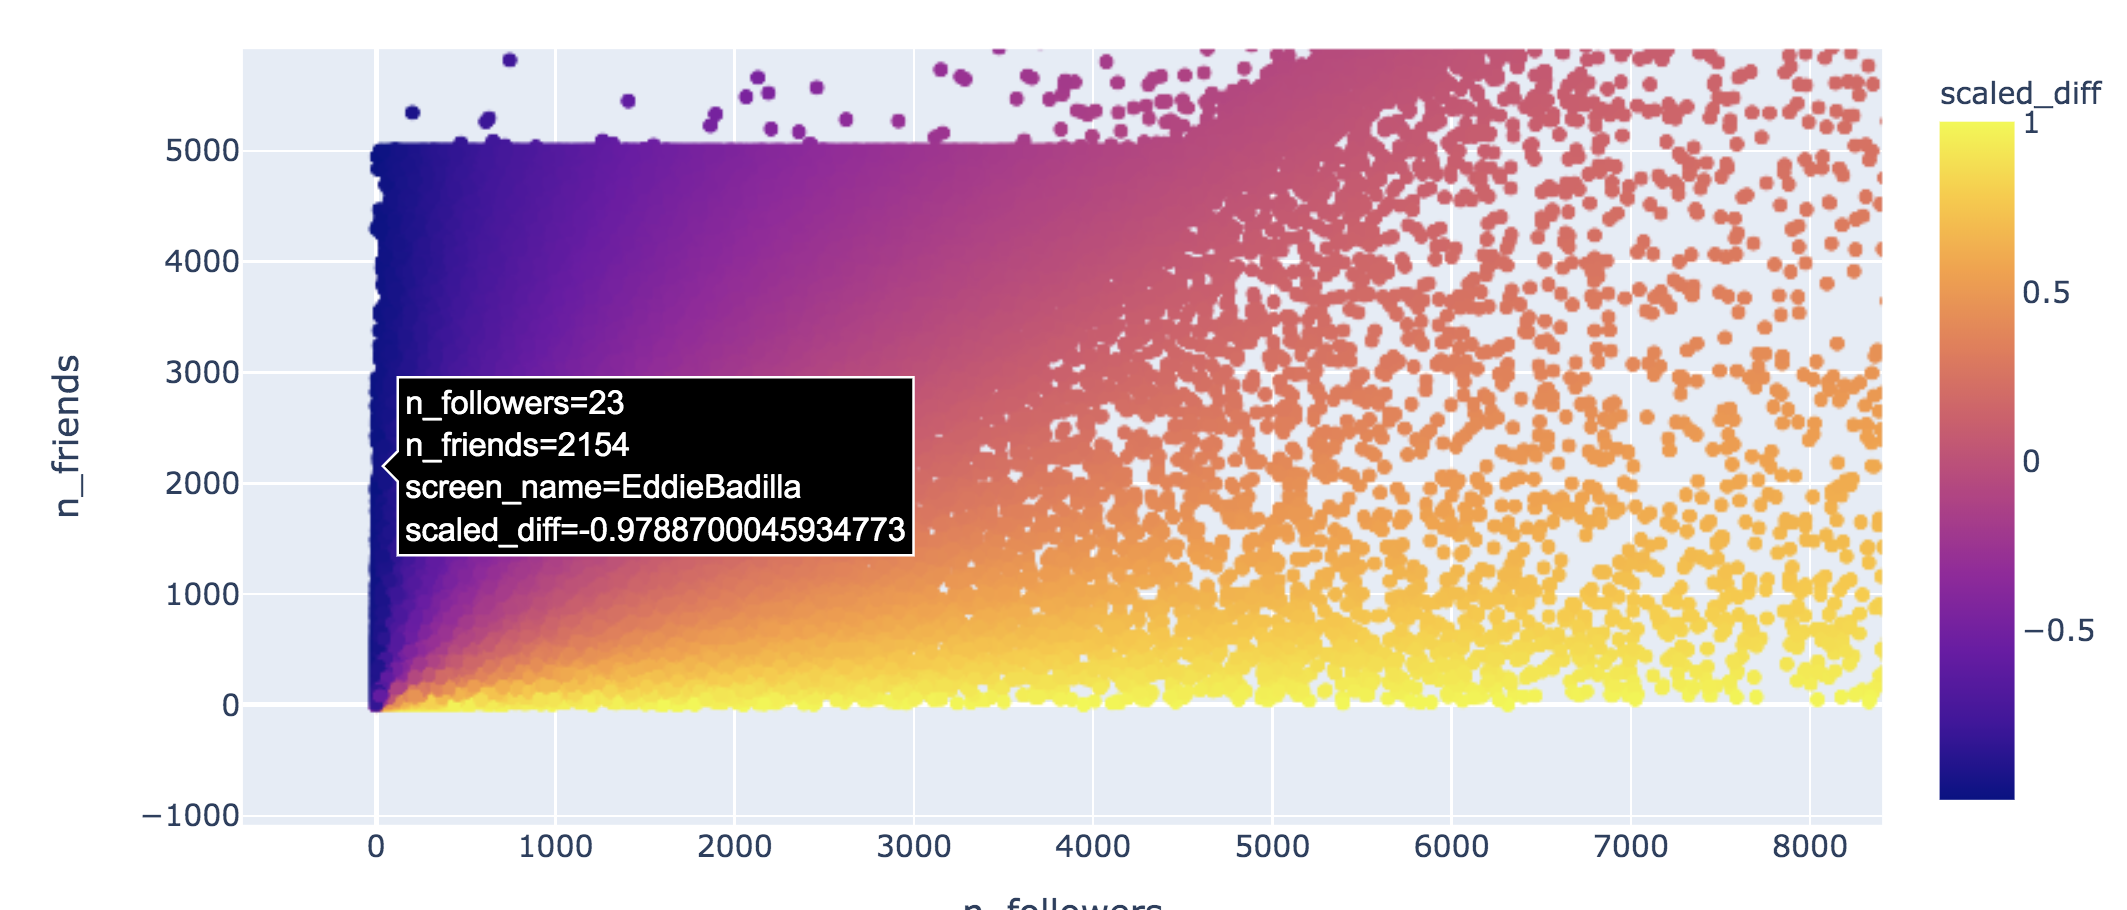
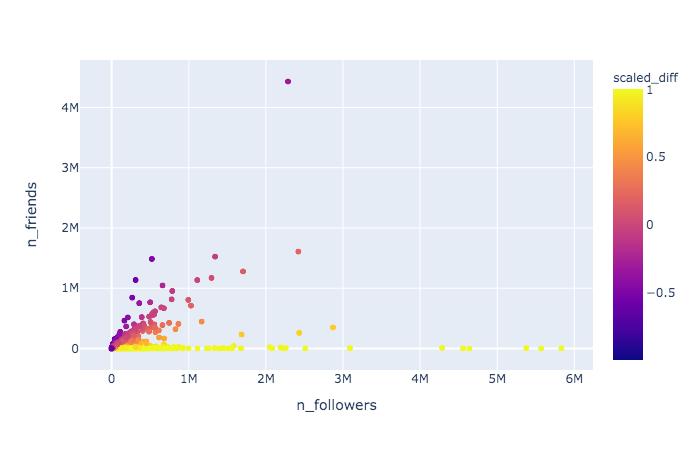
Corpus Statistics
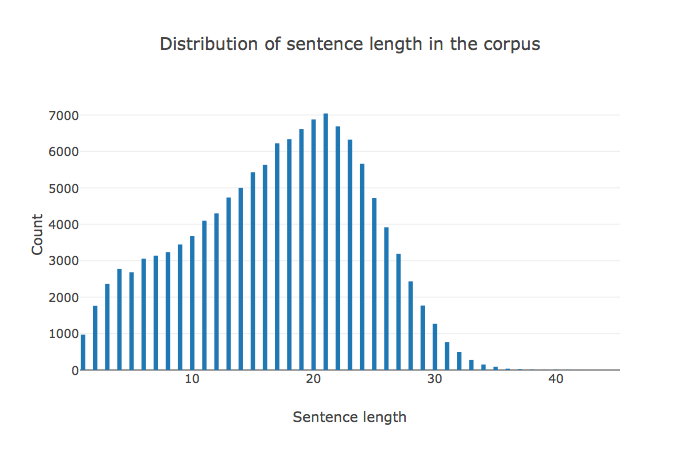
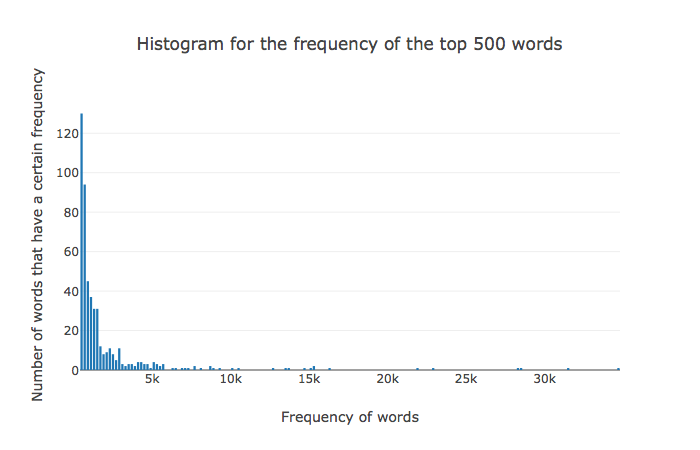
- About 120k documents in the training/validation/test corpus
- Torchtext module
- Imbalanced dataset: 90k/30k for classes
- Use F1-score as the metric for assessment
ELMo (Embeddings from Language Models)
- Contextual embeddings that address polysemy, used to capture semantic meaning
- Each token embedding is a function of the entire sentence
- Bidirectional language modeling
- Character-based and can use morphological cues to form representations of out-of-vocabulary words
- Shown to work well on small datasets
Network Architecture
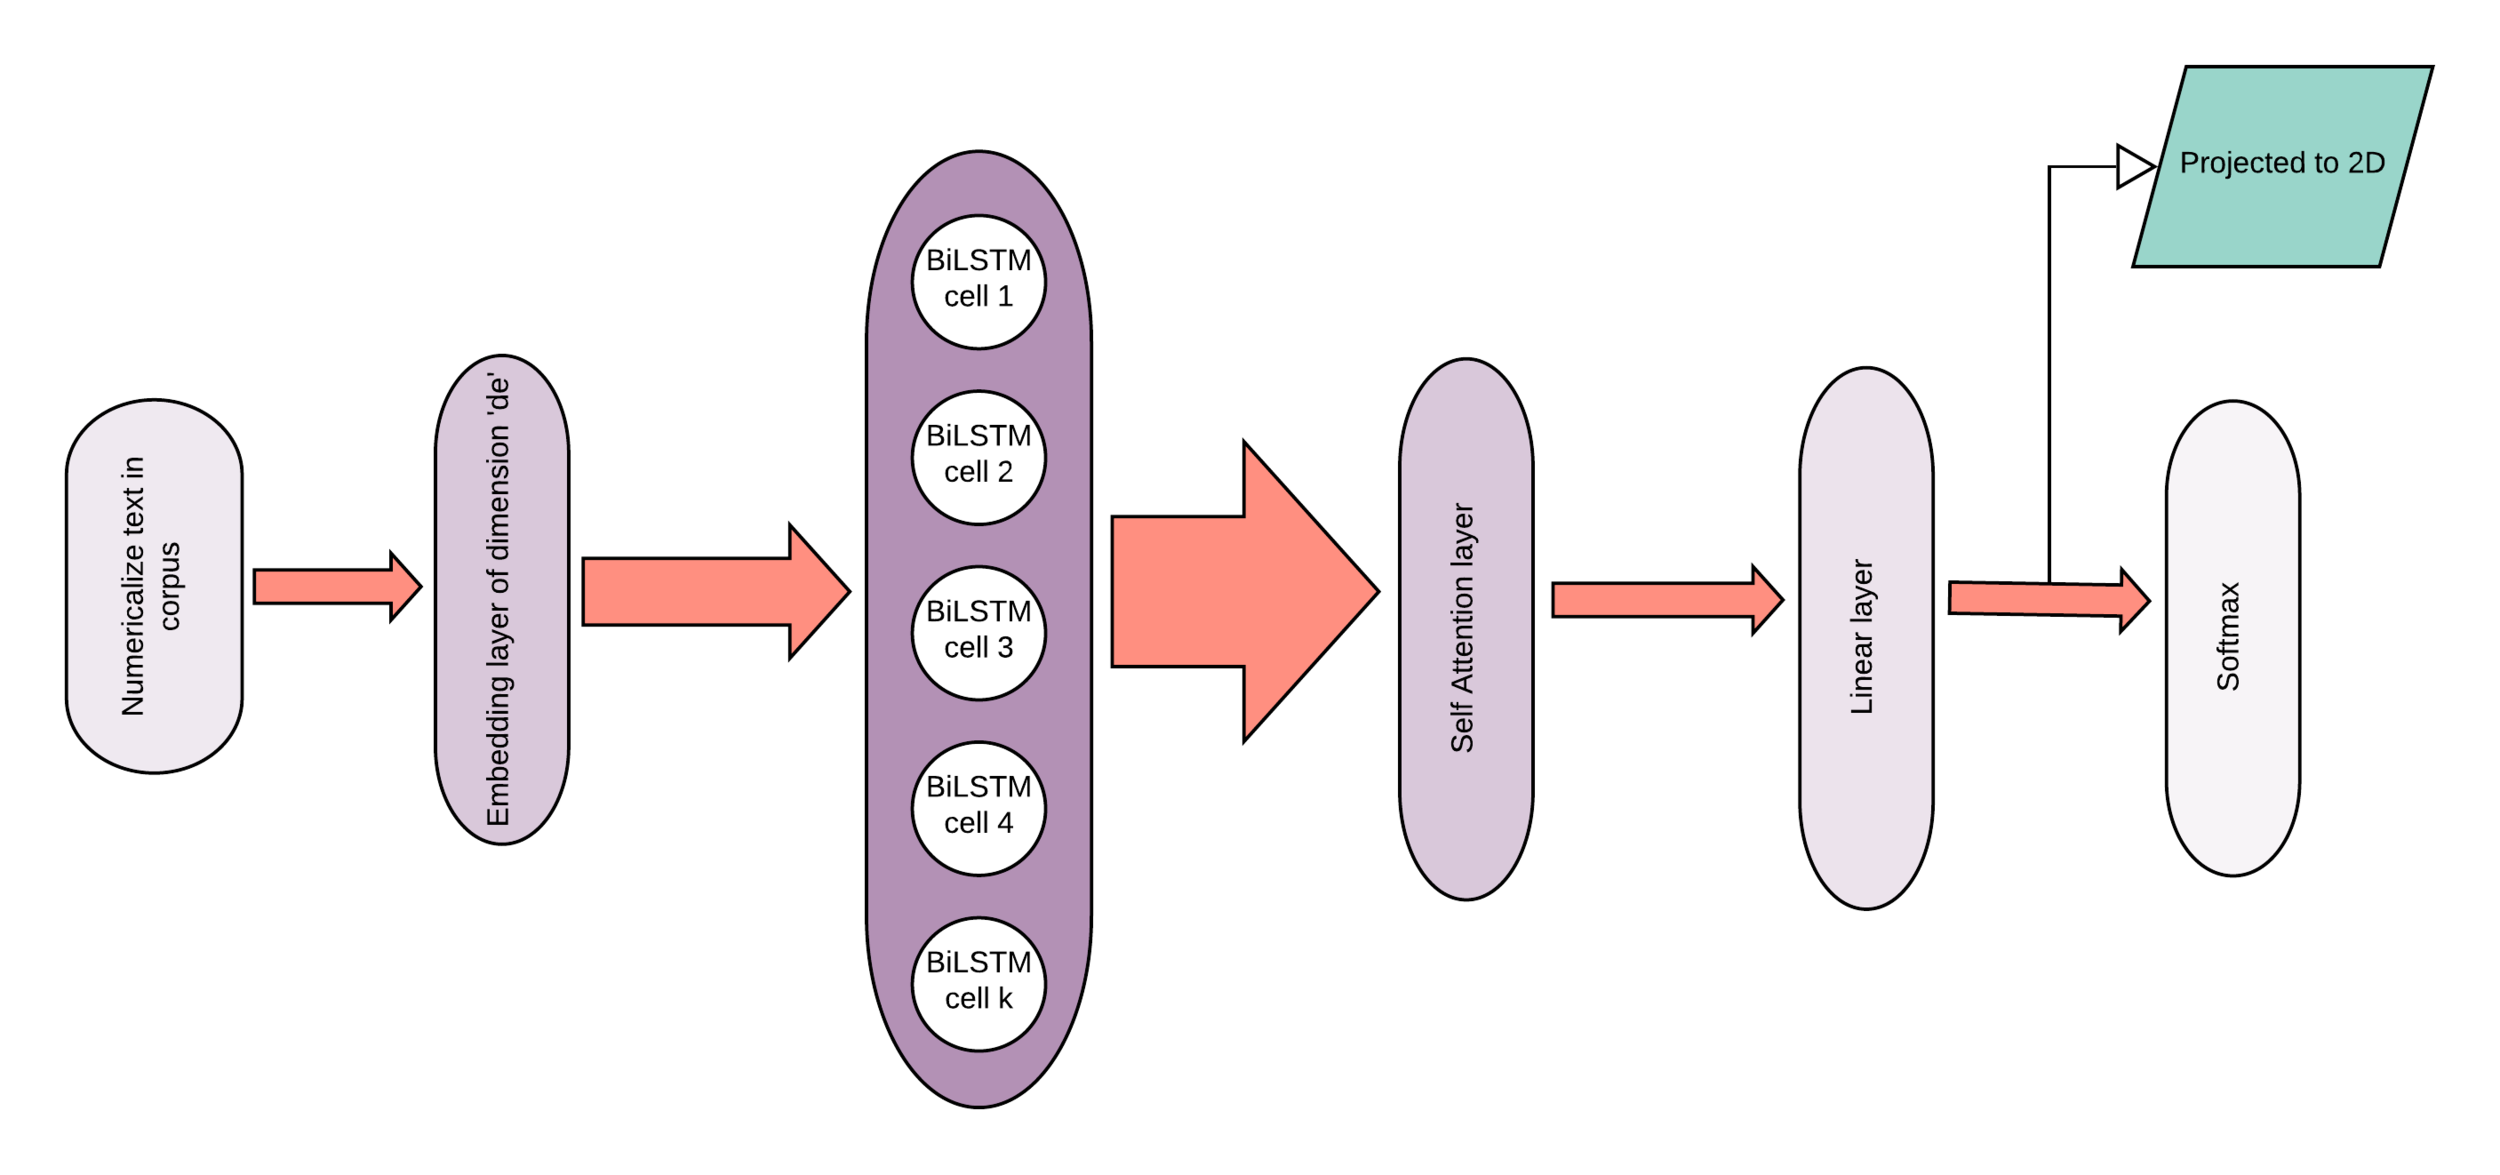
Embeddings
- Static embeddings
- Glove
- Glove.twitter
- Charngrams
- 100-dimensional embeddings
- Contextual embeddings
- Elmo
- Training
-
Full training data
- All the data we have
-
Limited training data
- Randomly sampled 5k/5k
-
Full training data
- Testing
- Hand-curated and labeled set of 1219 for testing
General Workflow
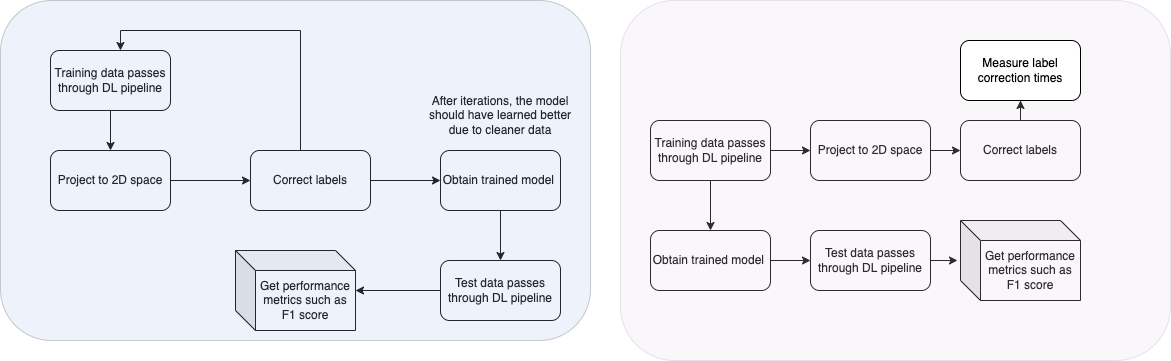
Training Pipeline
Active Learning
- Borrowing from outlier detection
- "Use supervision whenever possible"
- Active learning used to correct labels
- Done by expert who is provided guidance on where to look
- MetaCost* - normal class elements that have a reasonable probability of misclassification are relabeled
- Automatic cost-based relabeling can worsen the error
- Identify these visually
- Using the entity/cluster proximity
- Reasonable probability of misclassification
- How we define reasonable probability is the key...
- Entities with the greatest uncertainty
* https://homes.cs.washington.edu/~pedrod/papers/kdd99.pdf
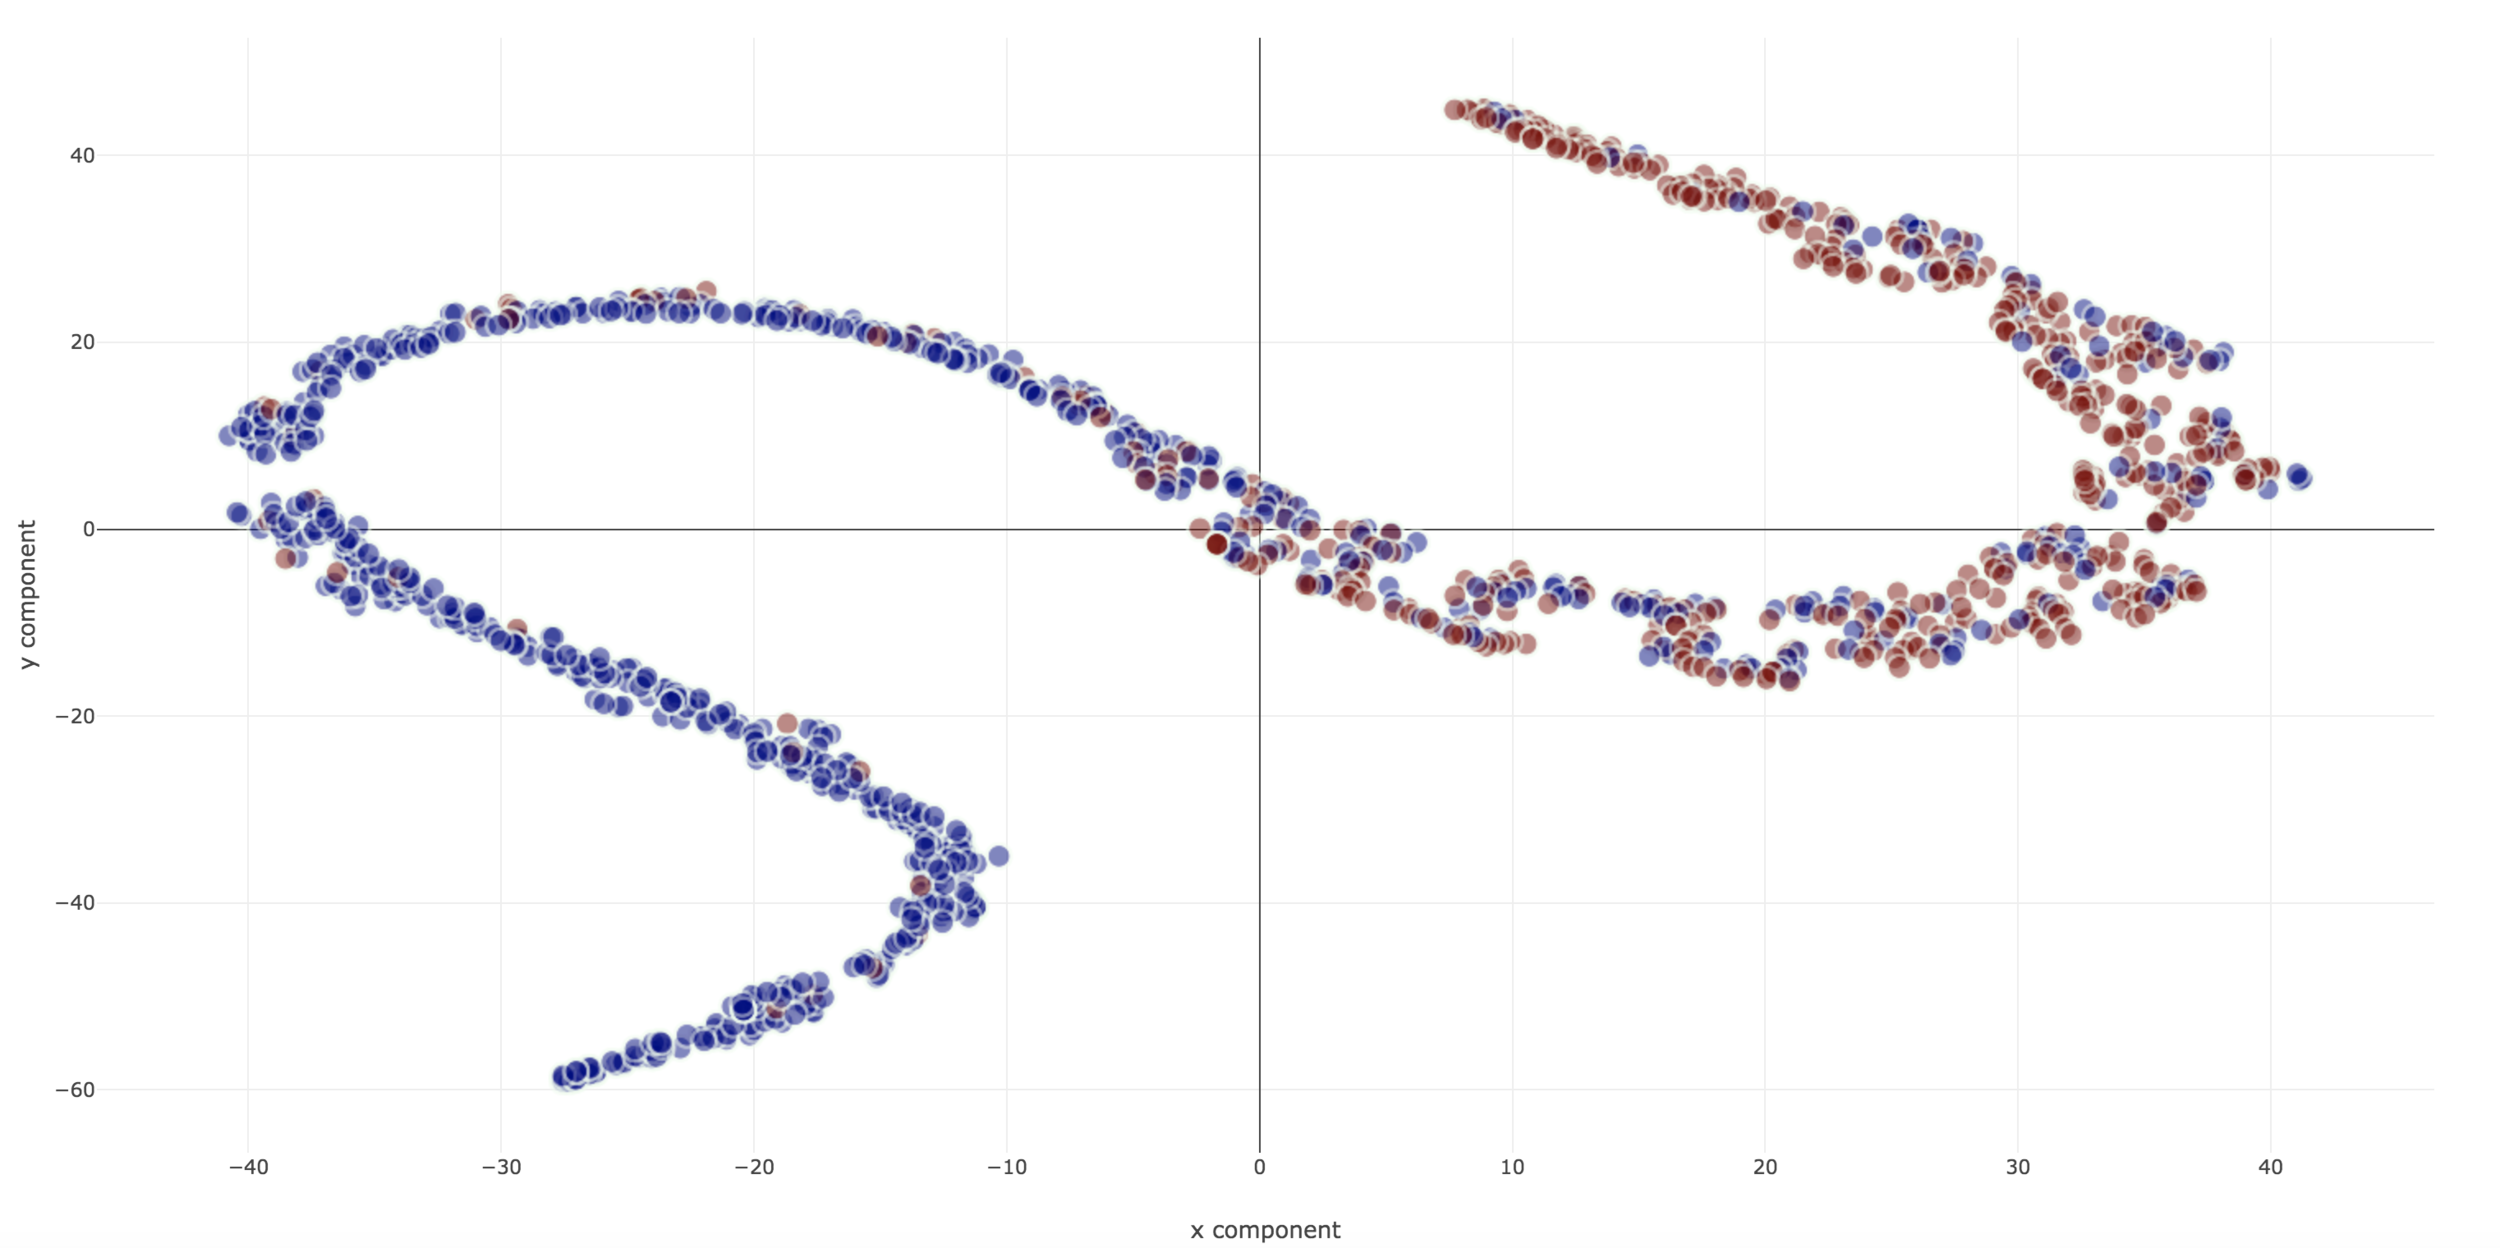
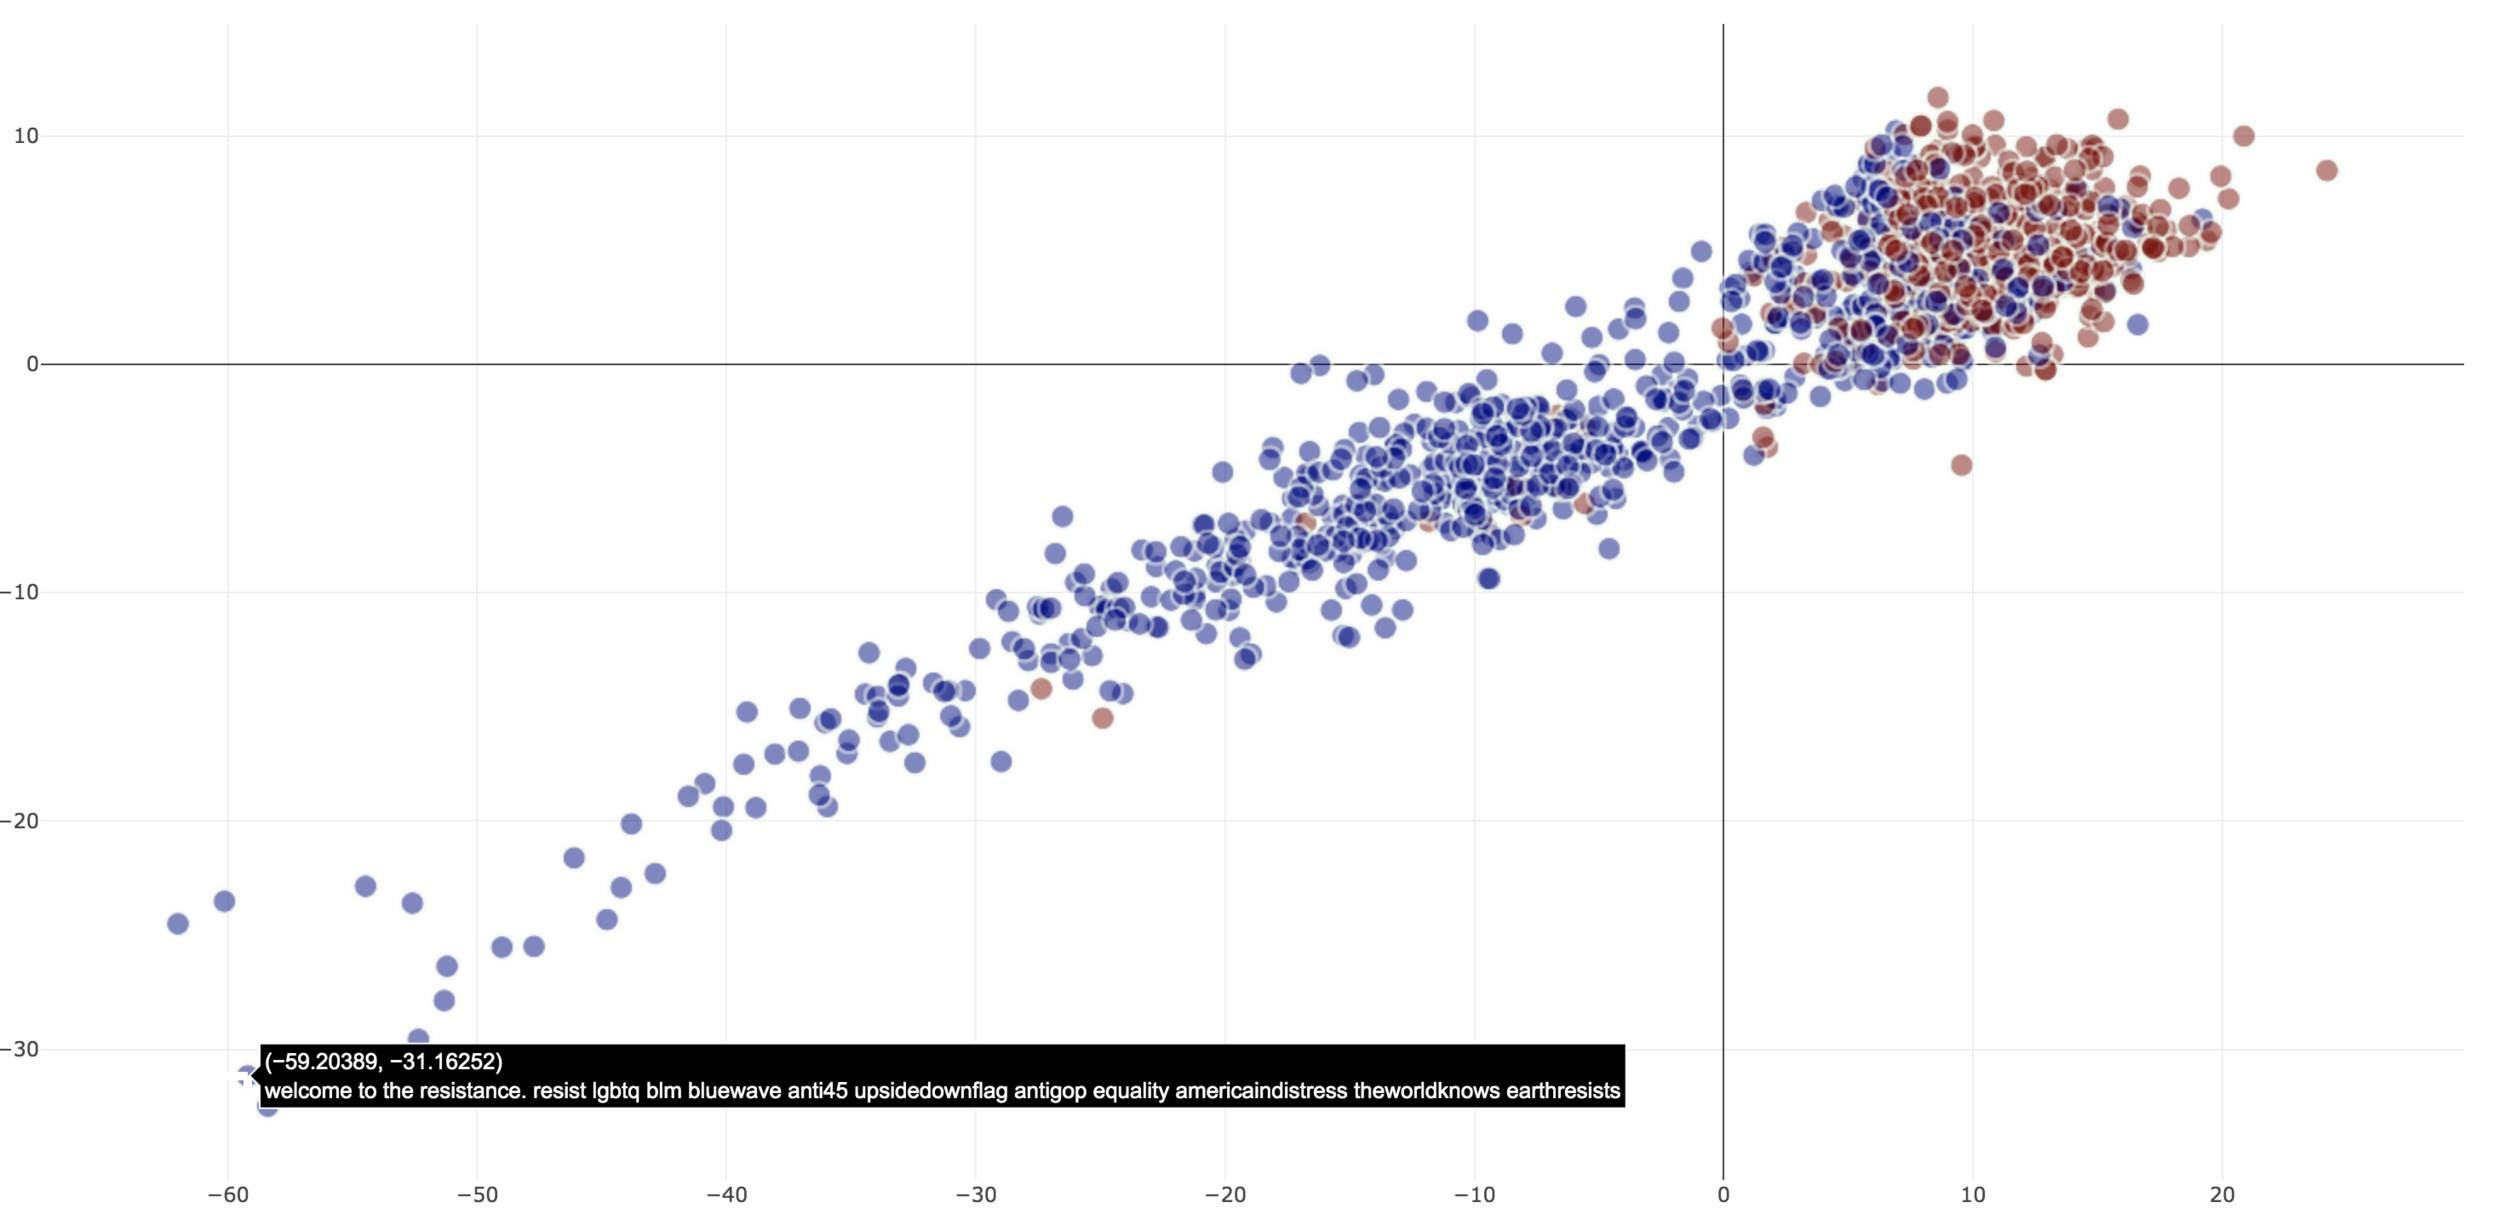
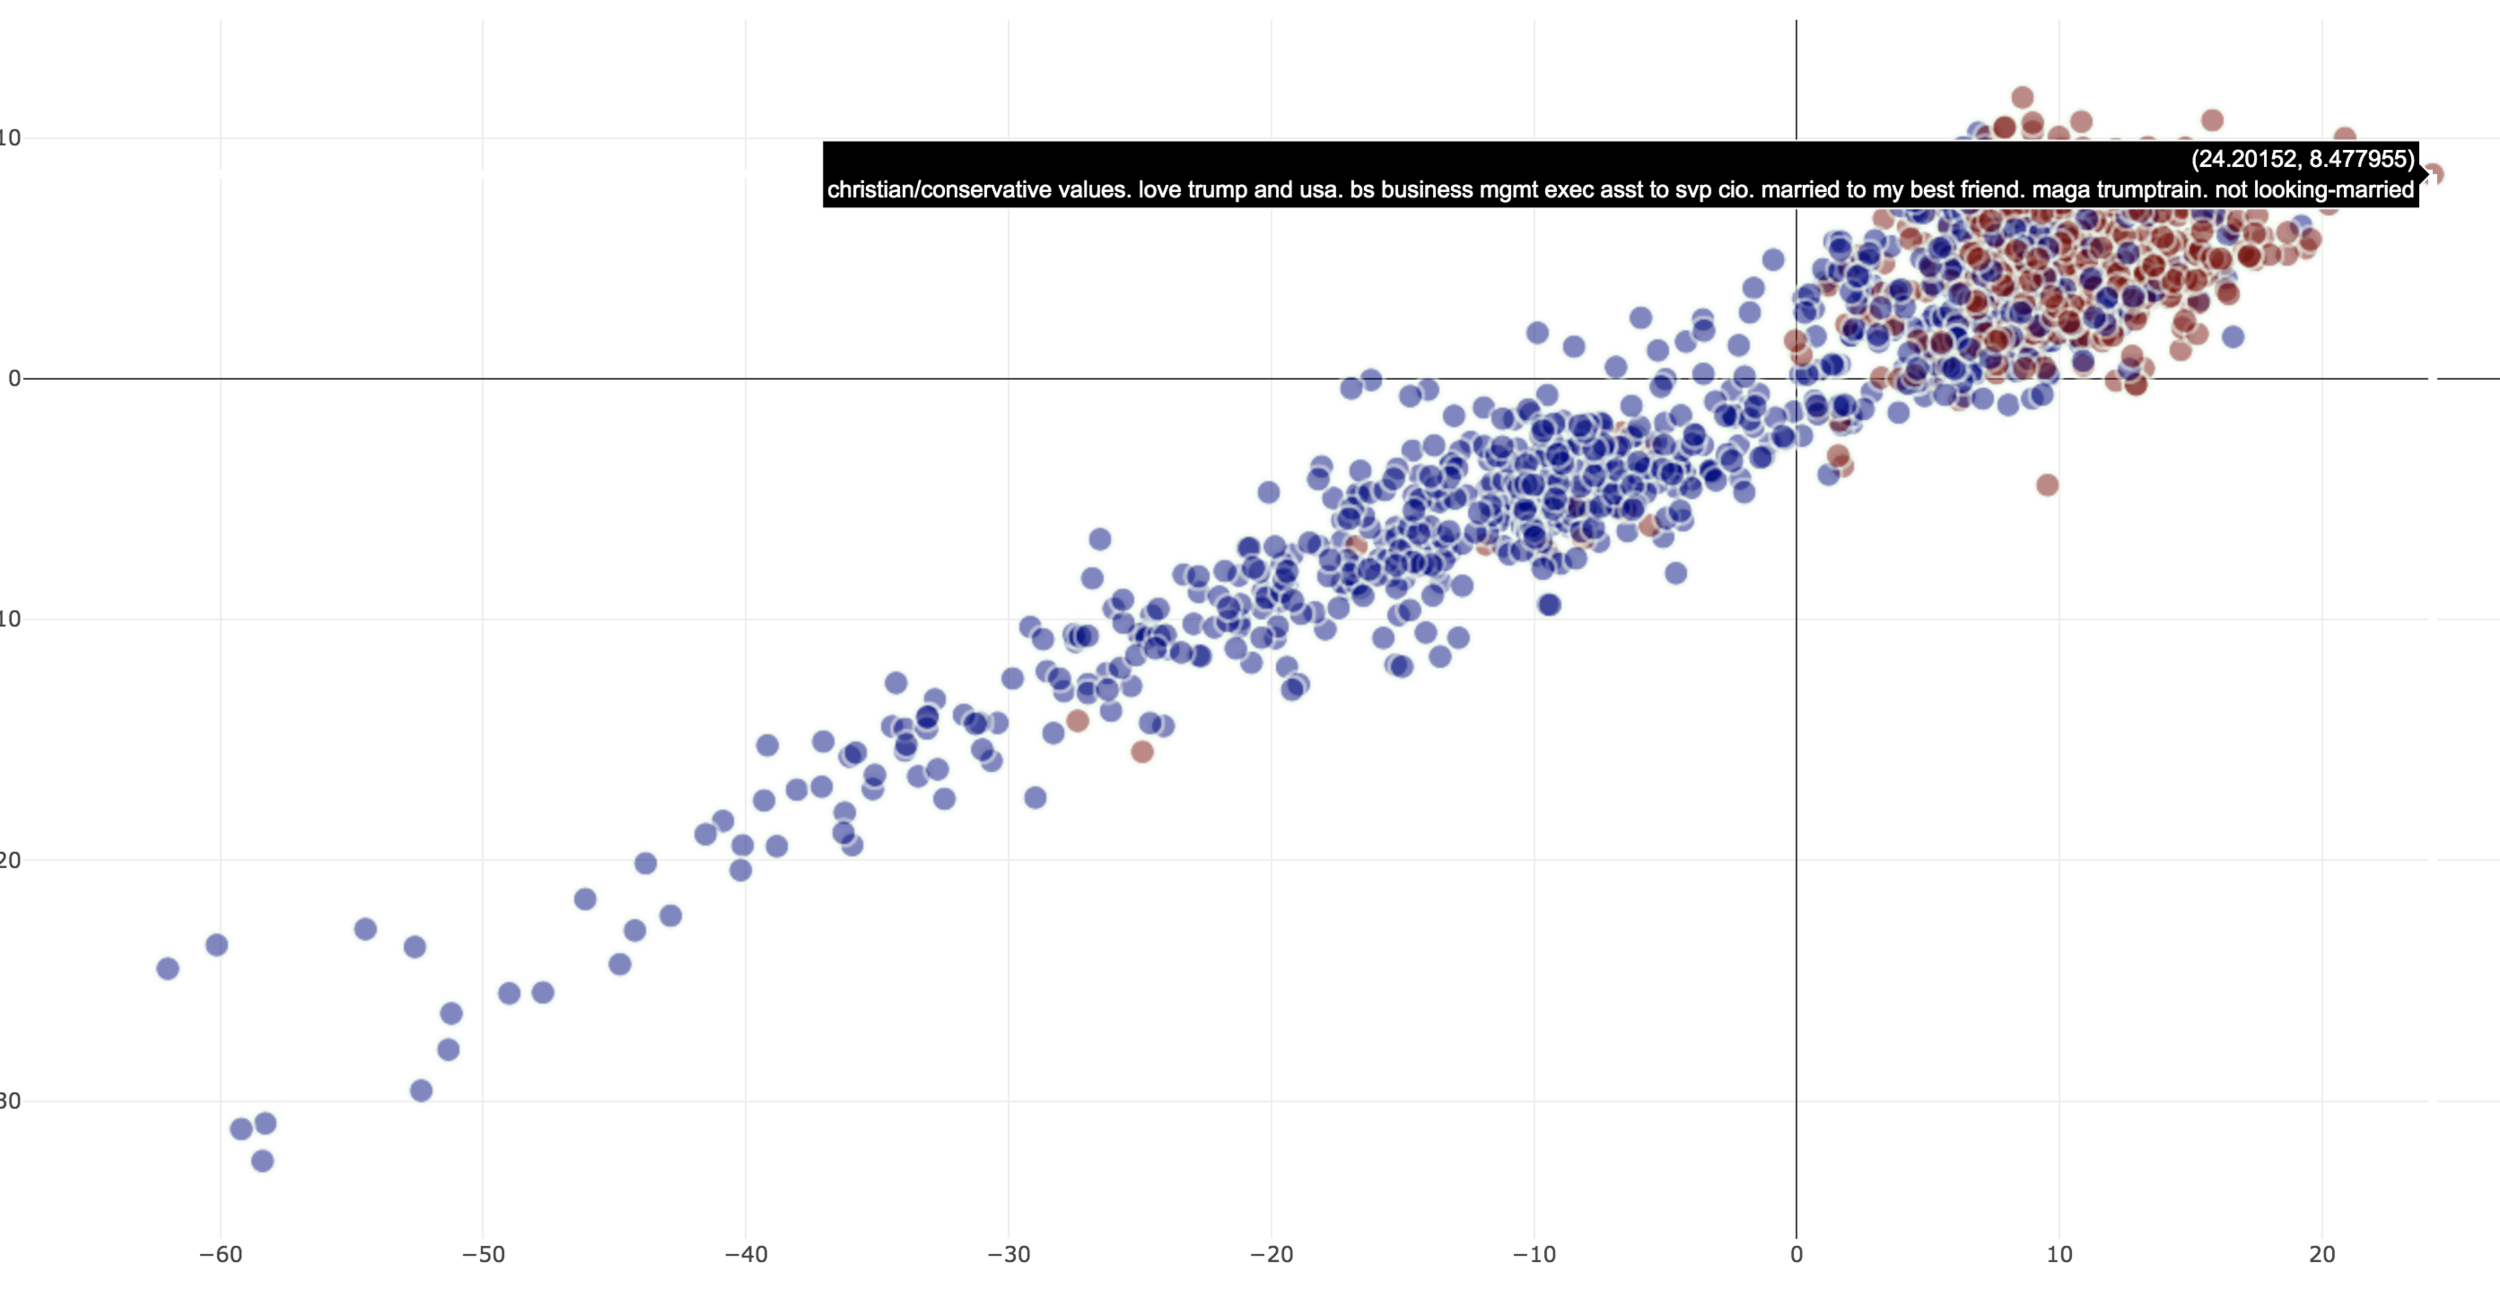
Projections - Interaction
-
Projections are
- Color coded for affiliation in corpus
- Opacity coded for classification 'confidence'
- Label mismatch identified with a ring around the entity
- Proximity in the two-dimensional space can be used to represent relative ’political stance’
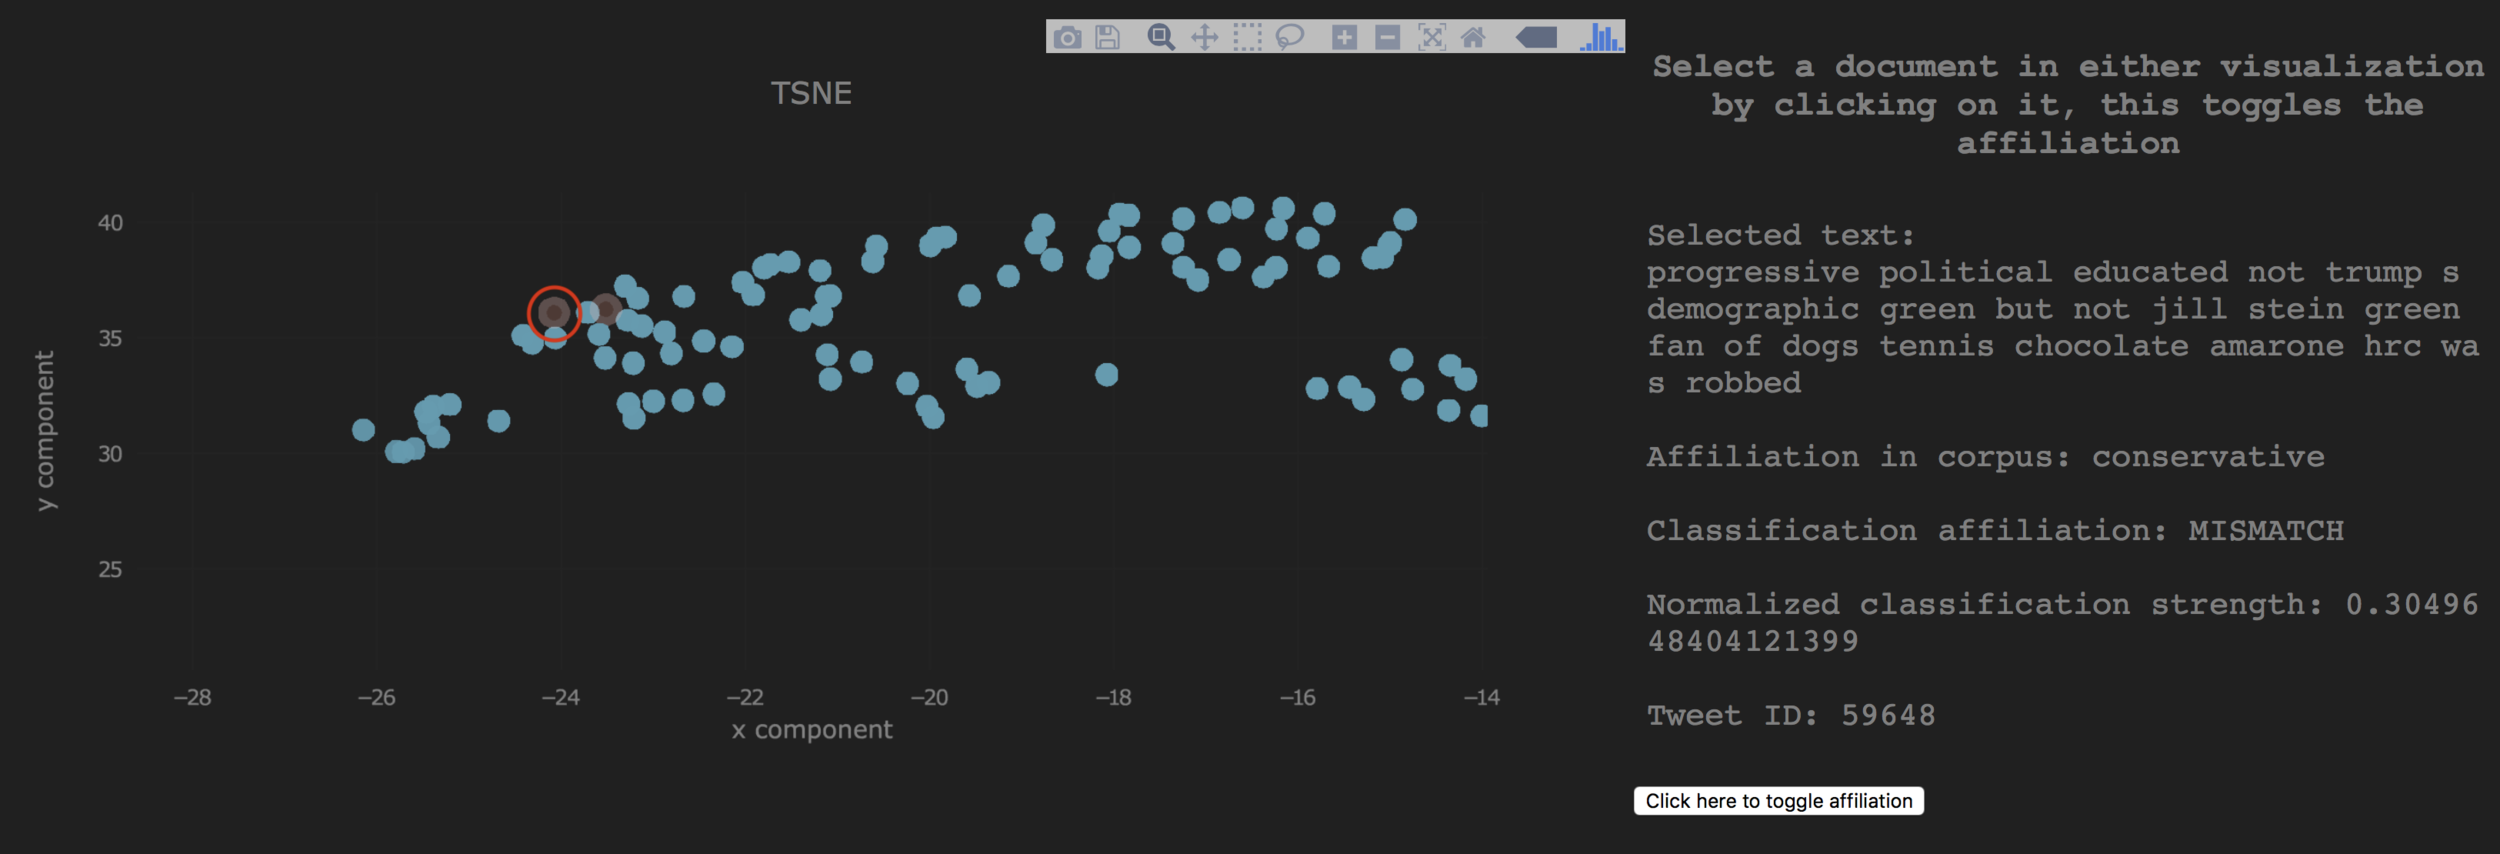
Projections - Errors
- Types of identifiable errors
- Type a error due to weakly-supervised label inaccuracy
- Type b error due to inaccuracy of the predicted label
- Outgroup: entities spatially located in the wrong group (identified by color)
| Corpus label | Classifier label | Error type | Recourse |
|---|---|---|---|
| Incorrect | Correct | Type a | Identified by ring - relabel |
| Correct | Incorrect | Type b | Identified by ring - no correction |
| Incorrect | Incorrect | Outgroup | Identified by group/entity color mismatch and location - relabel if needed |
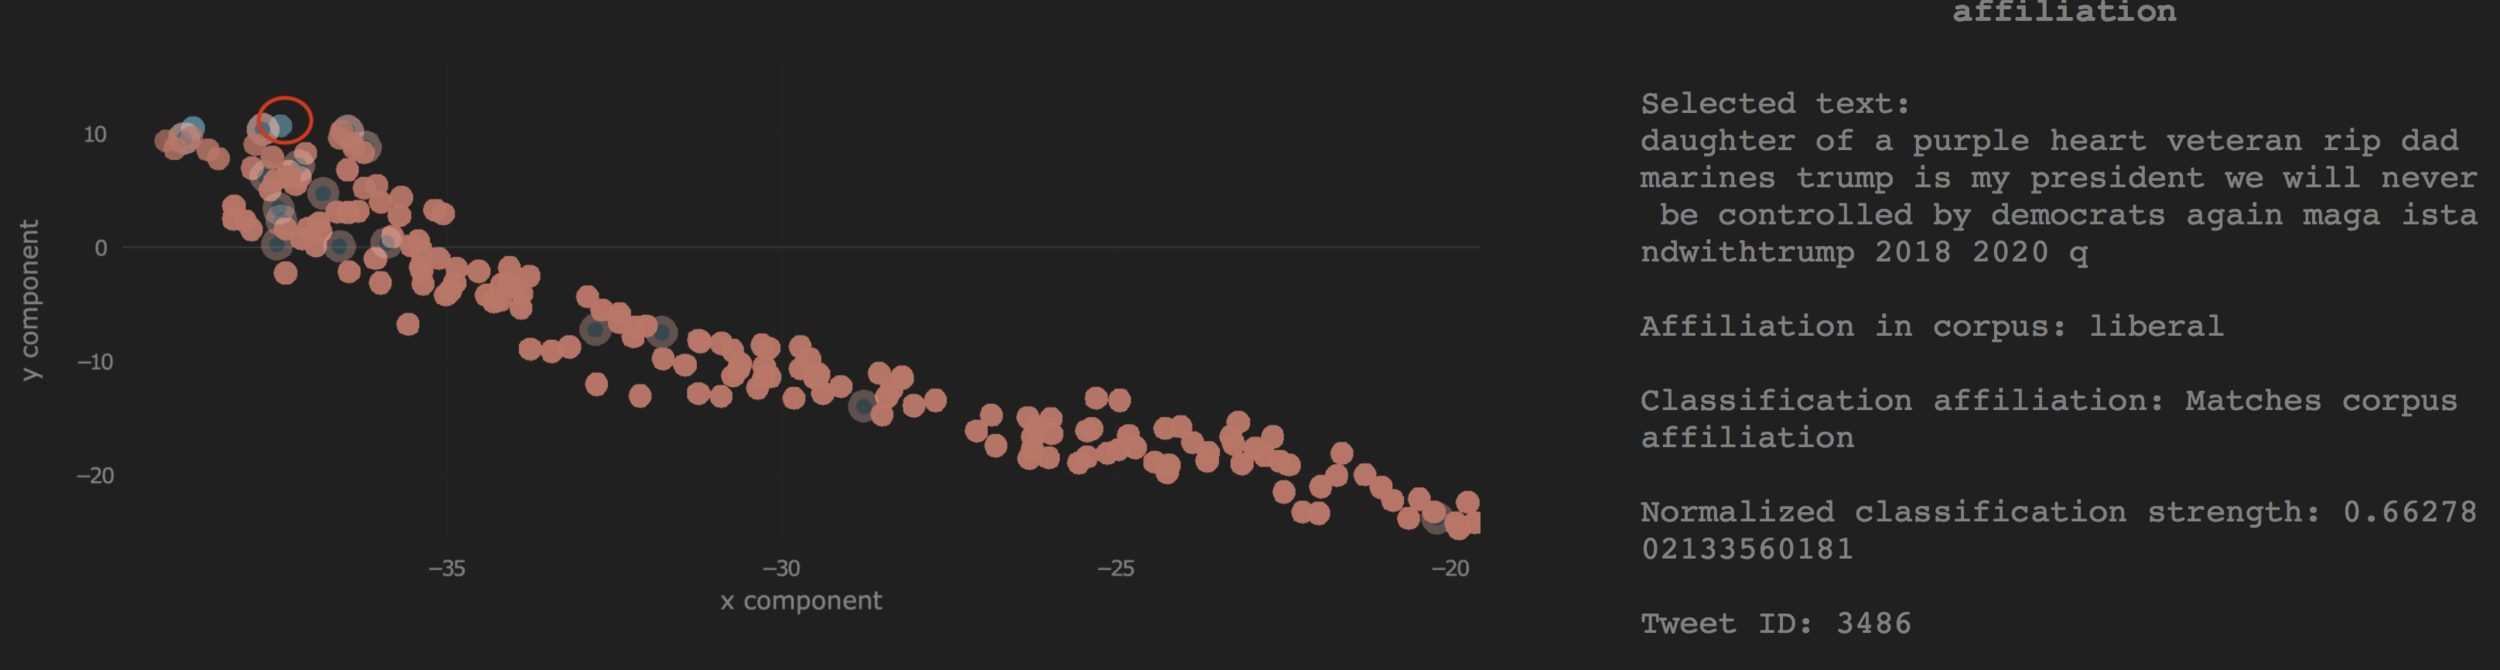
Incorrect Classification - Type (a)
The classifier prediction correctly identifies the true label - incorrect document label
Incorrect Classification - Outgroup
Classifier output is incorrect but matches corpus label, however, the location identifies the incorrect document label
A Note on Softmax Scores
- On using softmax scores as a confidence score
- Softmax score as a 'correctness likelihood'
- Calibration is not done here, ideally reliability curves should be plotted
- There is some empirical evidence on the efficacy of naive use of softmax scores
-
However, we don't need an exact estimate here
- Neural networks with softmax tend to overestimate the confidence of their predictions
- We just need to know that the network is not confident, i.e. anything that is not a high value is of interest
Attention Layer for Interpretability
Weights correspond to the inferred importance of the words for the classifier
Attention
- Given a sentence of 'n' words and each word represented by 'd' dimension, each sentence is now a matrix (n,d)
- BiLSTM (u) for a sentence has output 'H'(n,2u)
- Linear combination of the 'n' vectors to form the attention vector 'm' (1,2u) and attention weights vector 'a' (1,n)
- 'da' is a hyperparameter
- w_{s2} is a vector of size 'da'
- W_s1 (da,2u)
- These weights are learned through training
\textbf{a} = softmax(w_{s2} tanh( W_{s1} H^T)) \\
\textbf{m} = \textbf{a} H
Dimensionality Reduction for Visualization
- PCA
- Linear dimensionality reduction with vanilla PCA
- MDS
- Low-dimensional projections that attempts to maintain the inter-point distance in high-dimensional space
- Similarity (or dissimilarity) calculated using euclidean distance
- Isomap
- Similar to MDS, similarity calculated with geodesic distances
- Can capture non-linear manifold structure
- t-SNE
- Similarities as joint probabilities
- Good separation of points
MDS
- MDS
- Low-dimensional projections that attempts to maintain the inter-point distance in high-dimensional space
- Dissimlarity calculated using euclidean distance (other distance metrics can also be used here)
- [X] is the high dimensional matrix of observations
- [Z] is a low-dimensional matrix we hope to obtain through MDS.
\textbf{Stress}^2 = \sum_{i=1}^{nrows} \sum_{j=i+1}^{nrows}
\biggl( ([ X_i - X_j ] [X_{i} - X_{j}]^{T} - [Z_i - Z_j][Z_{i} - Z_{j}]^T) \biggr)
Isomap
- Similar to MDS
- Geodesic distance is used to compute similarities of points
- Helps to capture the curvature of the manifold
- Approximate distances since we don't know the true manifold
- Build a neighborhood graph using the following formula below
- With the nearest neighbor graph, use Dijkstra's algorithm to find the shortest path for pairs
d(i,j) = \lVert \mathbf{x_i} - \mathbf{x_j} \rVert \\
d(i,j) = 0
if points i,j are close (defined by k nearest neighbors)
if points i,j are not close
- Apply MDS using the above computed distances
t-SNE
-
For N points, and a high-d space represented by the vector X and low-d space represented by Y
- Convert similarities to joint probabilities
- Minimize the KL divergence between high-d (P) and low-d (Q) joint probabilities
- The joint probabilities in high-d space to measure similarity use Gaussian kernels
- Similarity in low-d space using the Student-t kernel
- Sigma is the bandwidth of the Gaussian kernel, also called perplexity
p_{j|i} = e^{-d(x_i, x_j)^2 / 2\sigma_i^2} / \sum_{k \neq i}e^{-d(x_i, x_k)^2 / 2\sigma_i^2} \\ \\
p_{ij} = \dfrac{p_{i|j} + p_{j|i}}{2N}
q_{ij} = \dfrac{(1 + \lVert y_i - y_j \rVert^2)^{-1}}{\sum_{k \neq l}(1 + \lVert y_l - y_k \rVert^2)^{-1}}
The heavy tails of the Student-t kernel allow you to transform the small inter-point distances in high-d to points farther apart in low-d (good separation)
Dimensionality Reduction Techniques
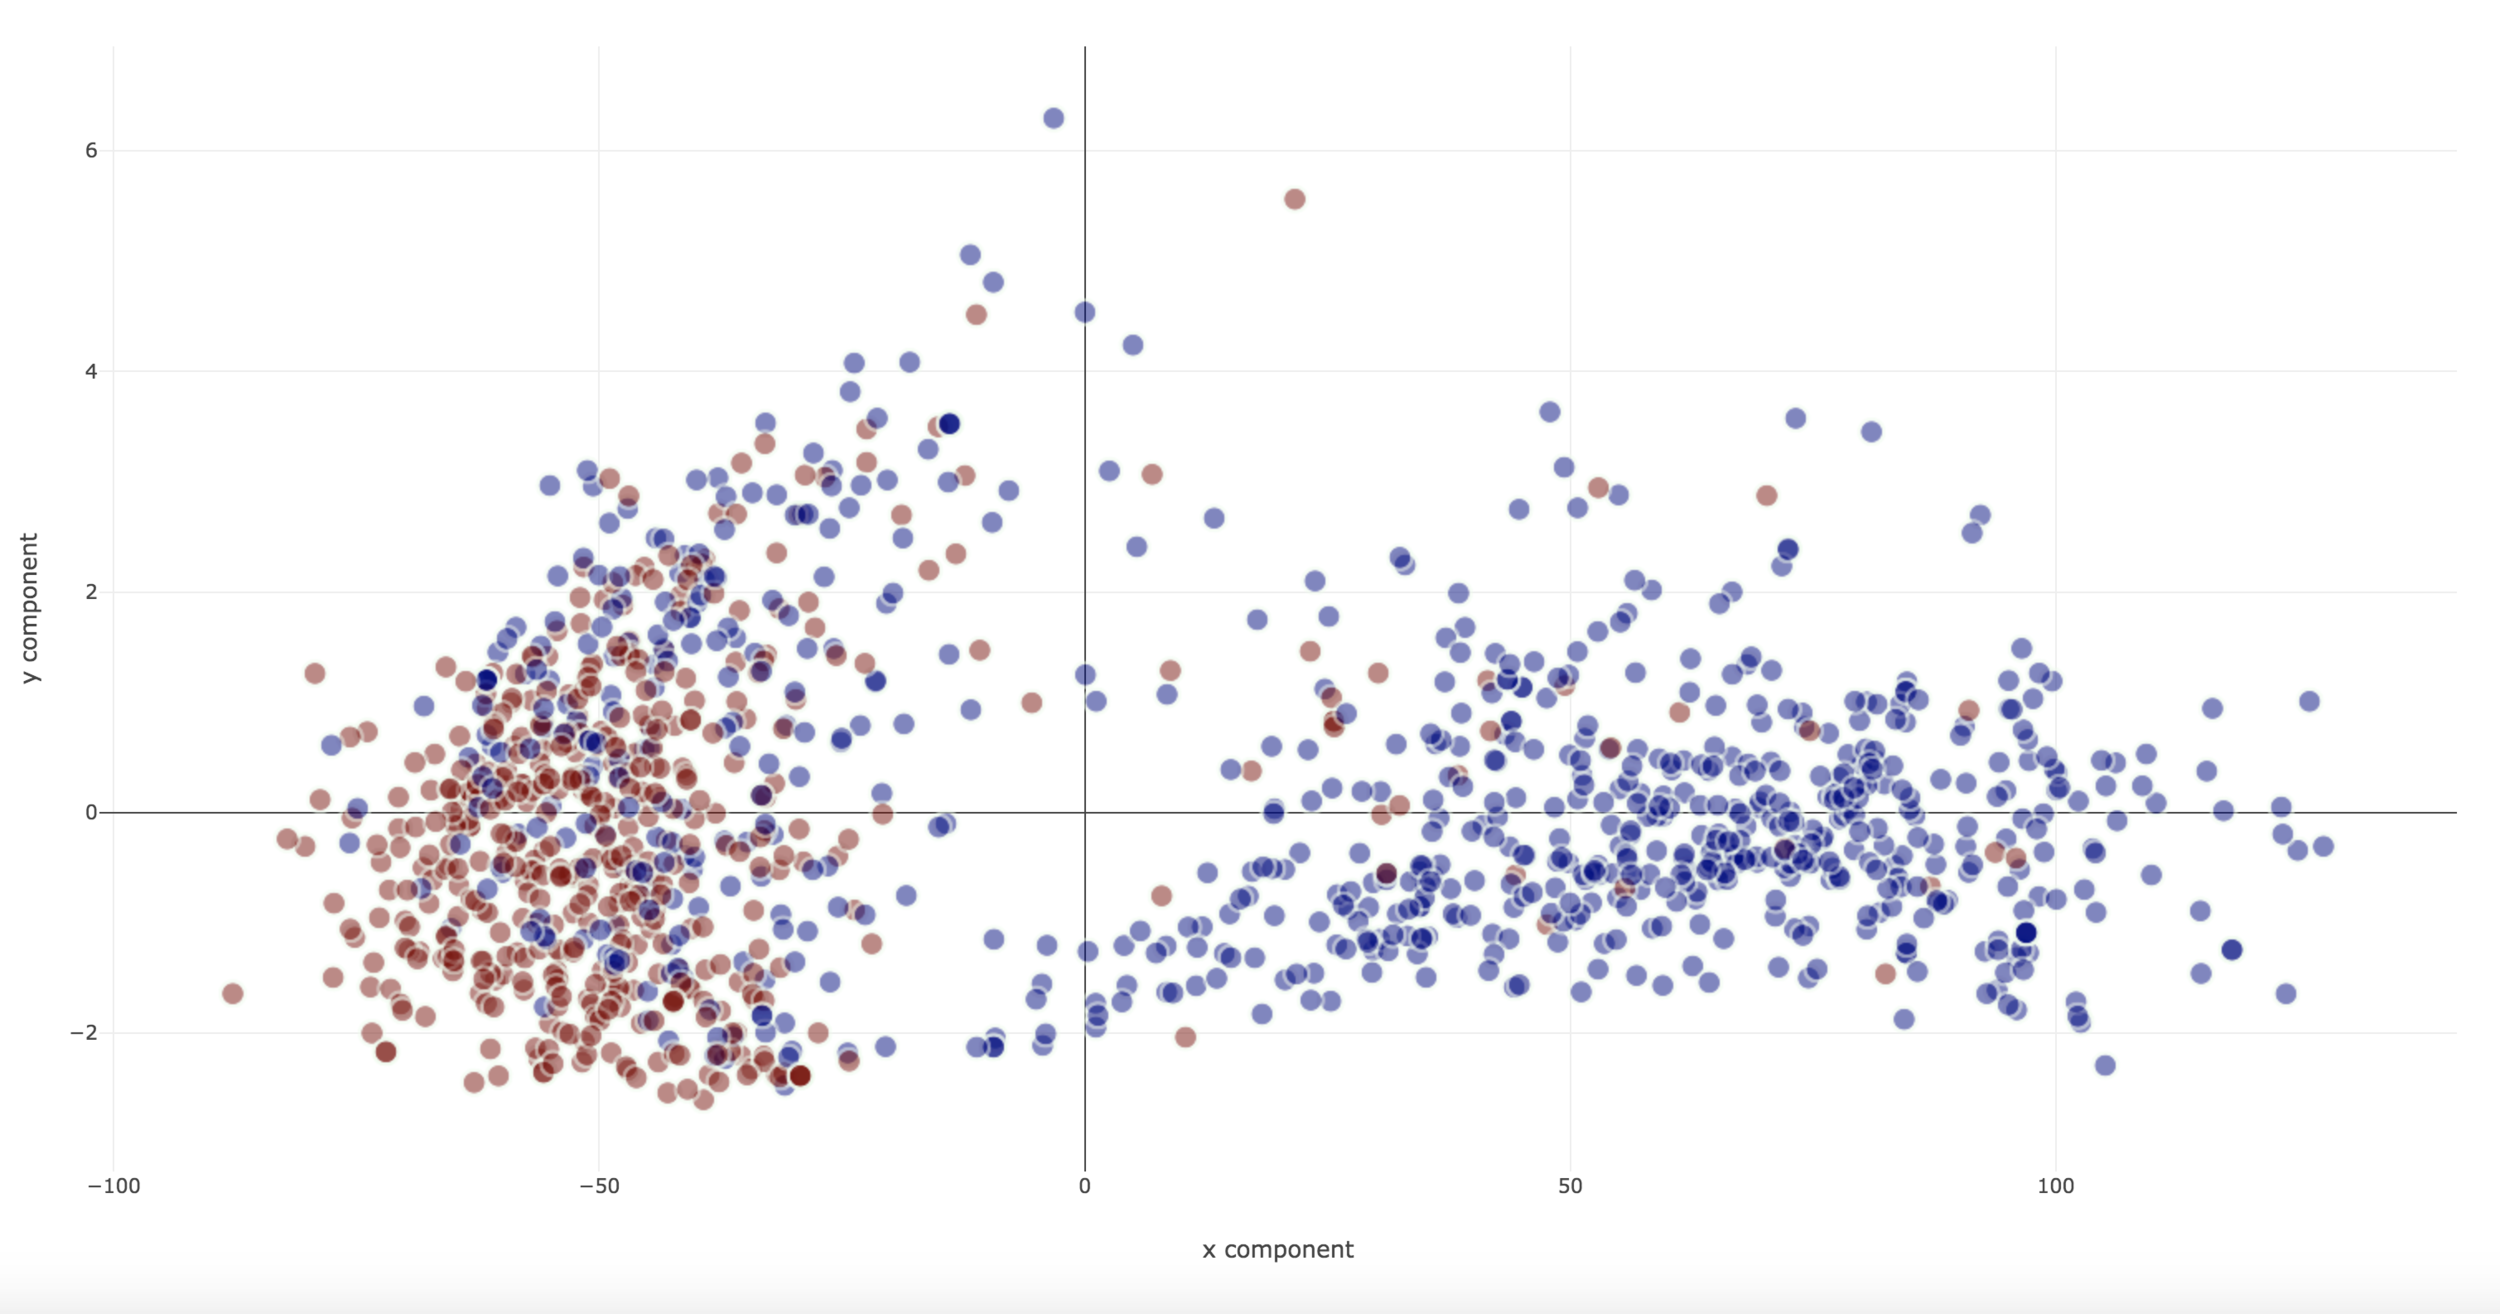
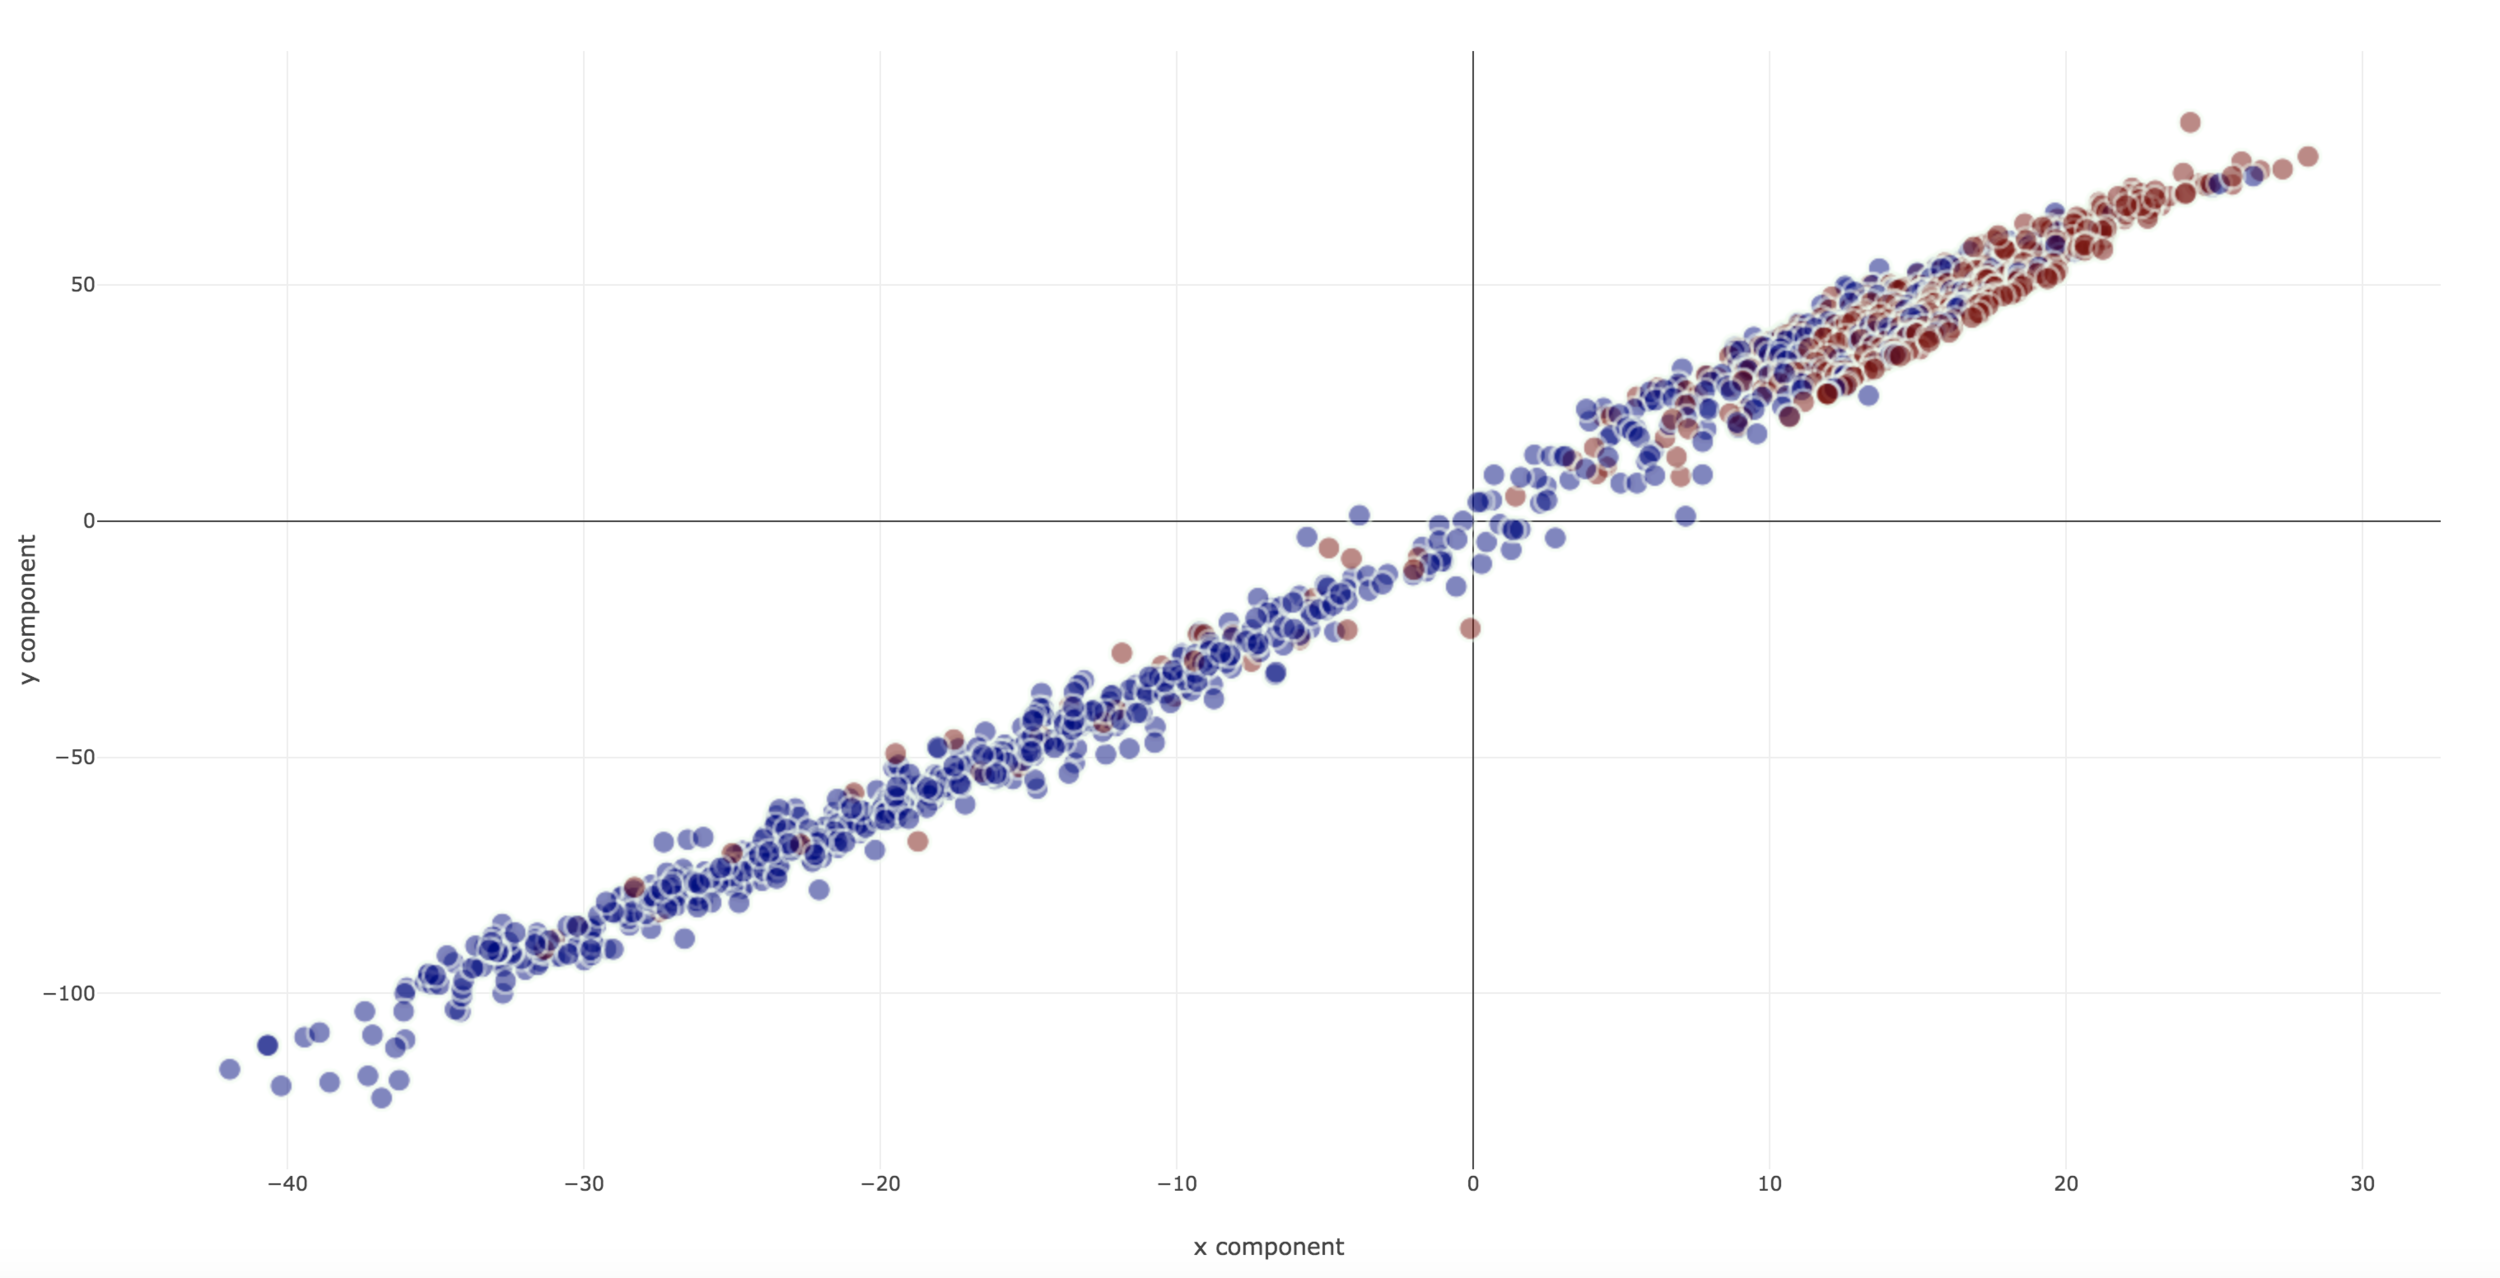
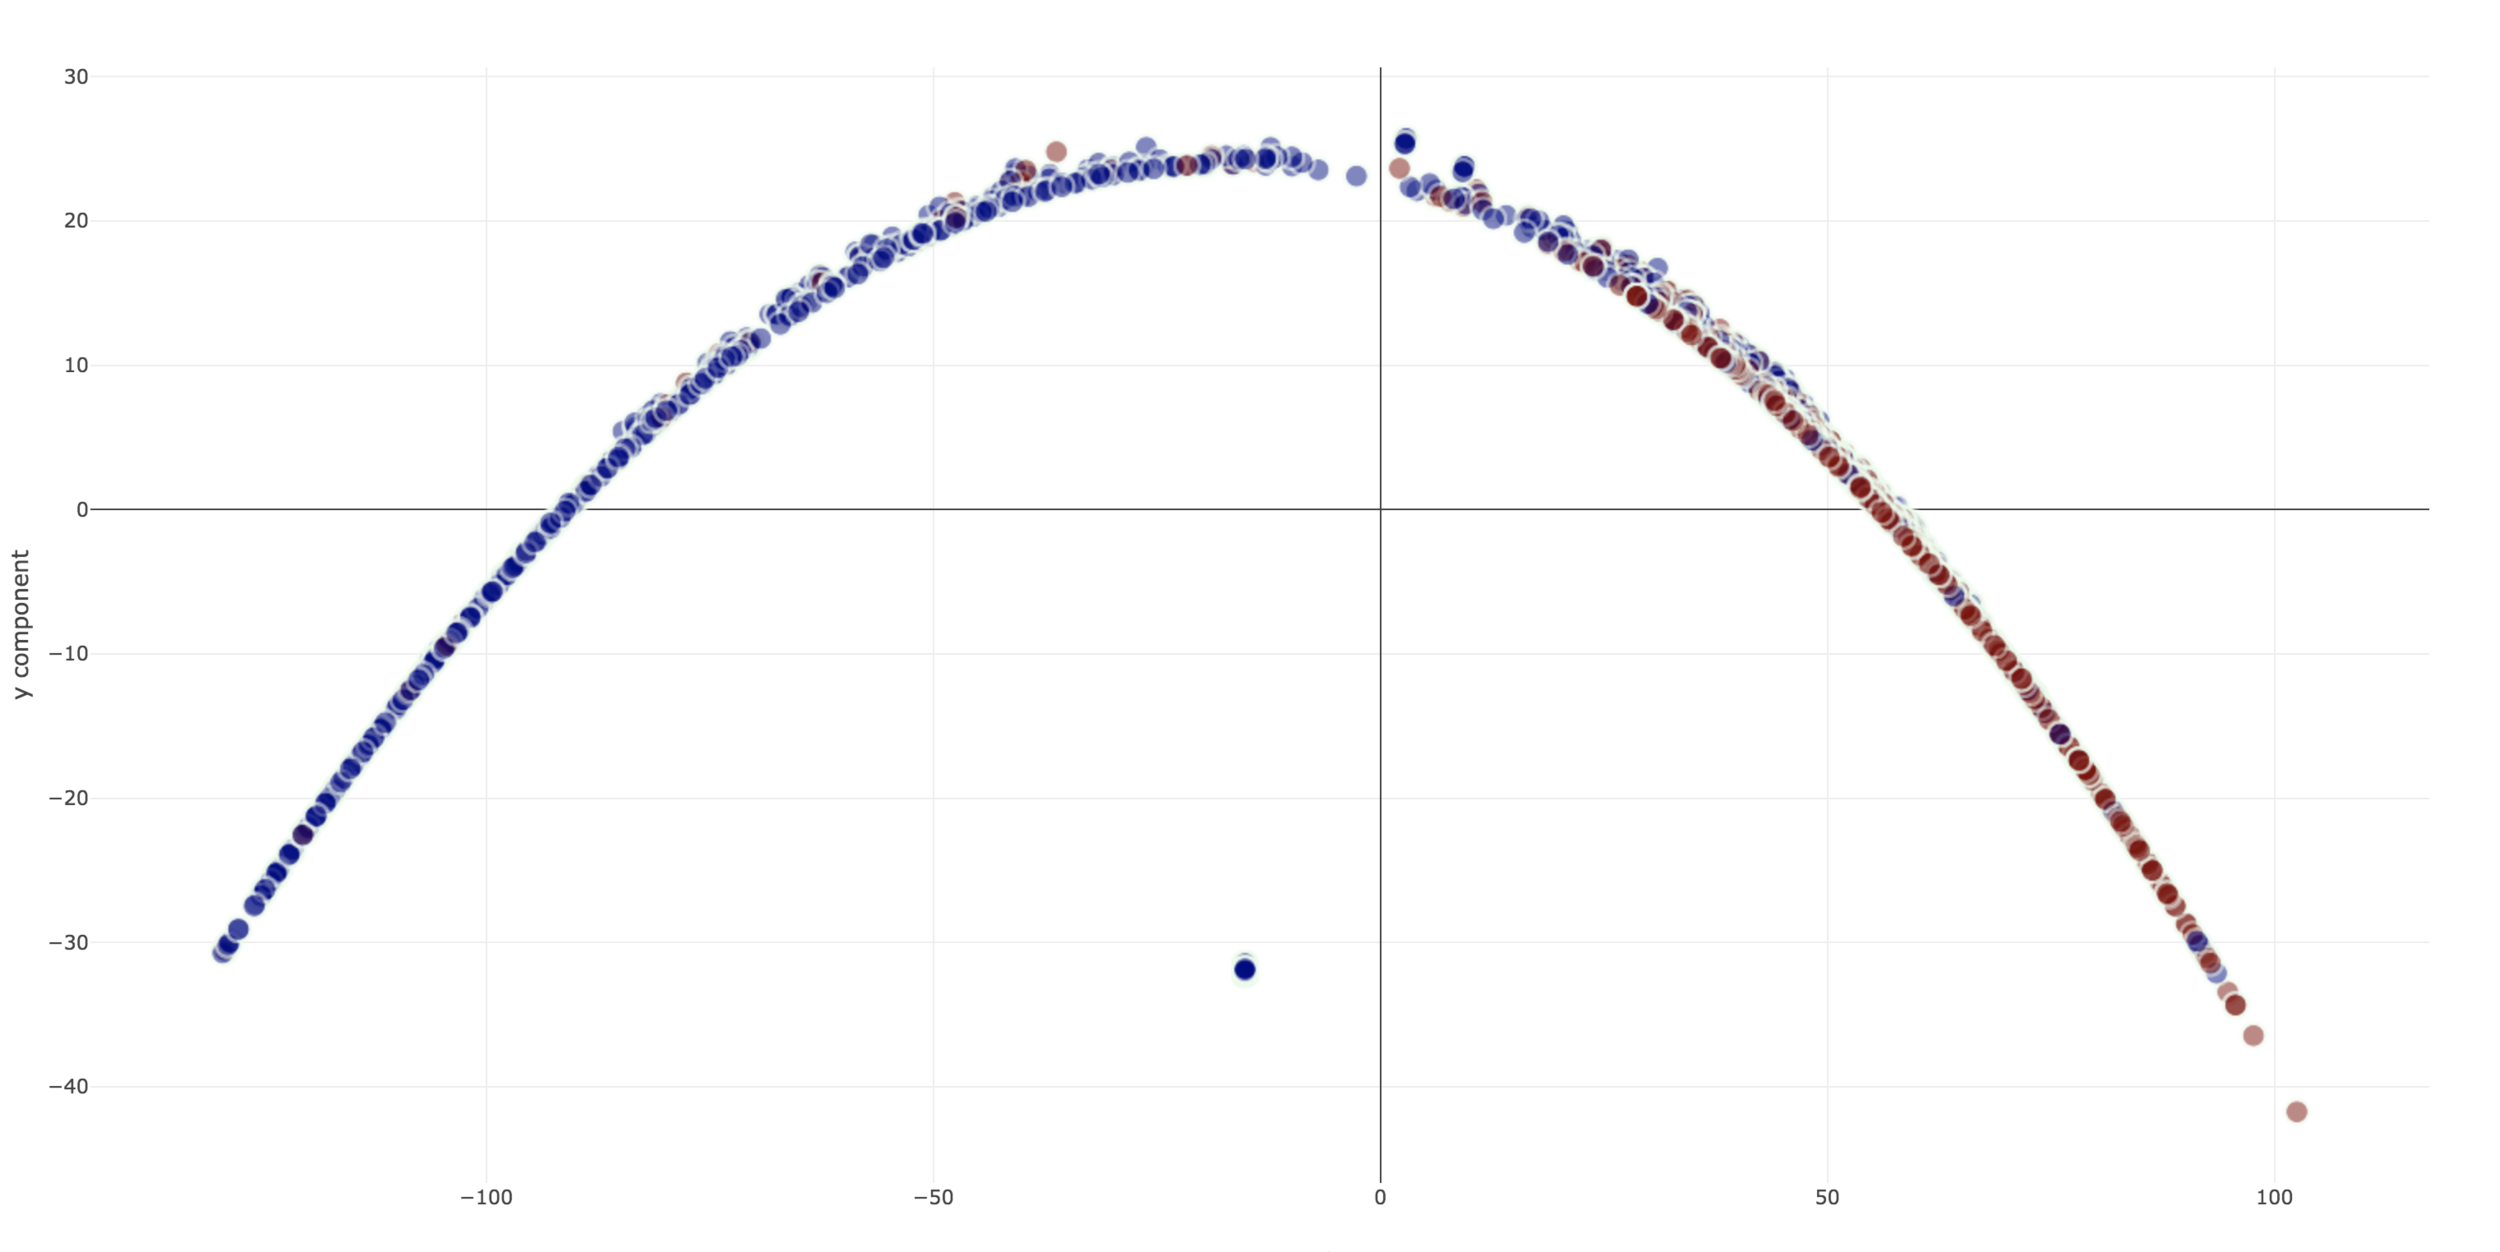
1. PCA
2. MDS
3. Isomap
4. t-SNE
Results
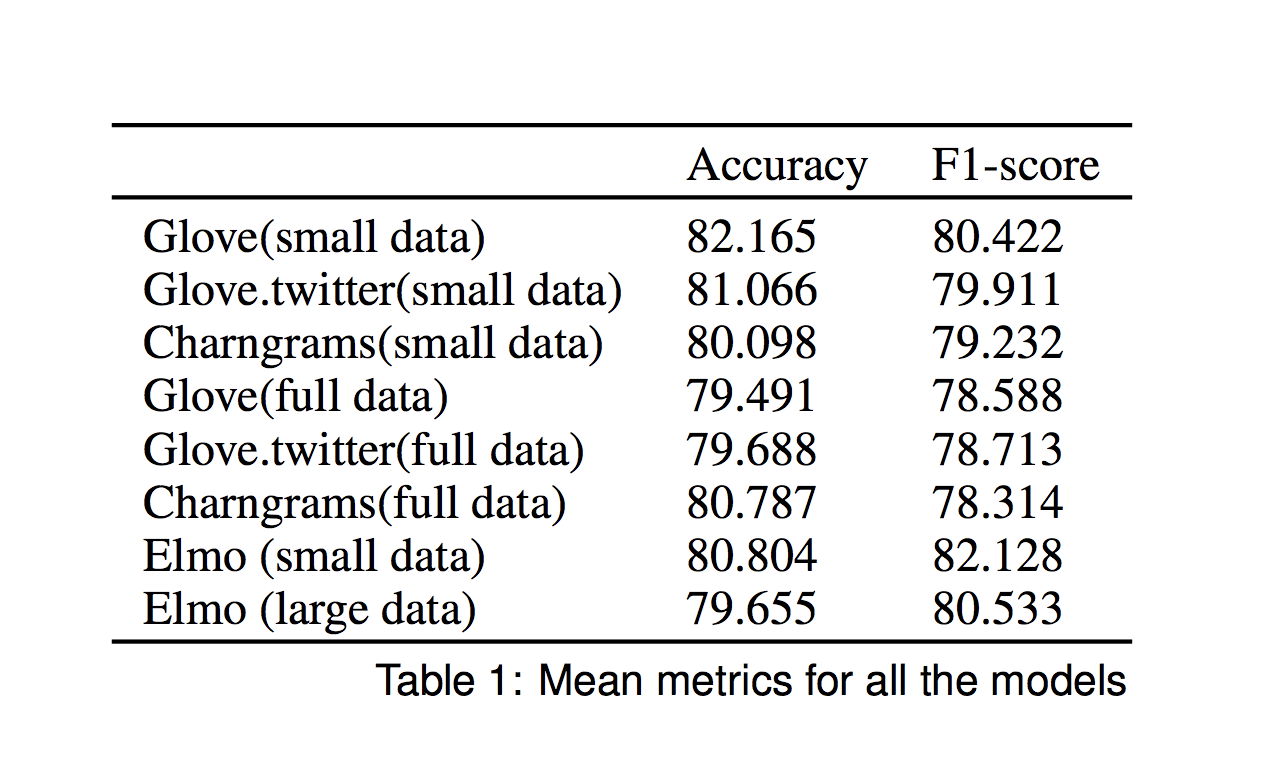
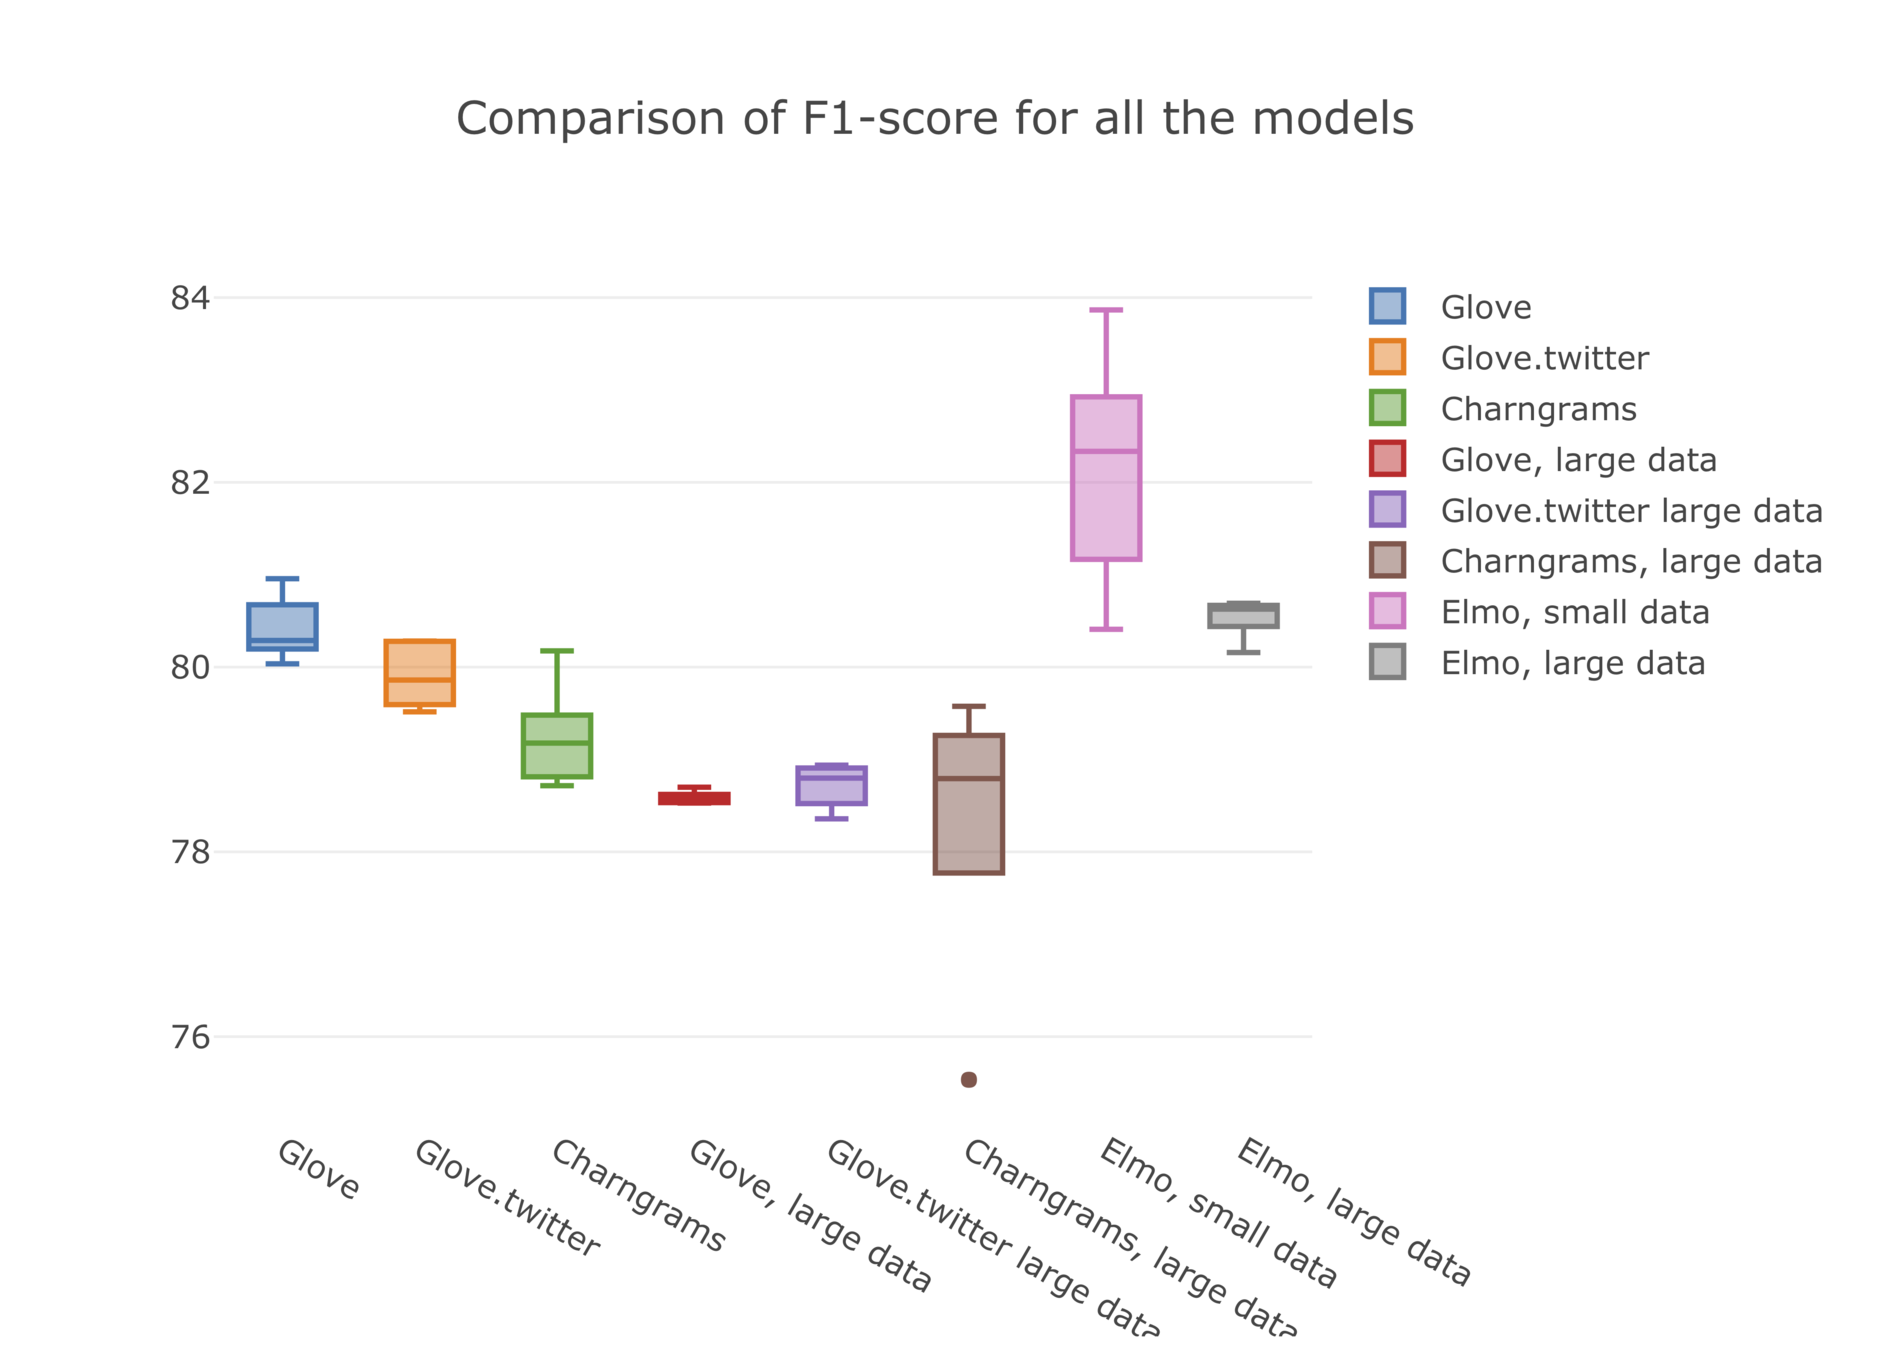
- Perturbed 8 data points from test set - 4 from each class
- 3 users were tasked with identifying the 8 errors for all 4 projections
- MDS at a mean time of 2min 50s
Thank you!
Part II - Graph Analytics on Social Networks
Mapping Right-wing Extremism
- Network mapping of right-wing figures and their supporters
- Identify influential associates and communities
- First (RQ, Tweepy) and second degree network information
- About 1 million files spread across 24 folders
- Graph of about 72 million nodes and 1 billion edges
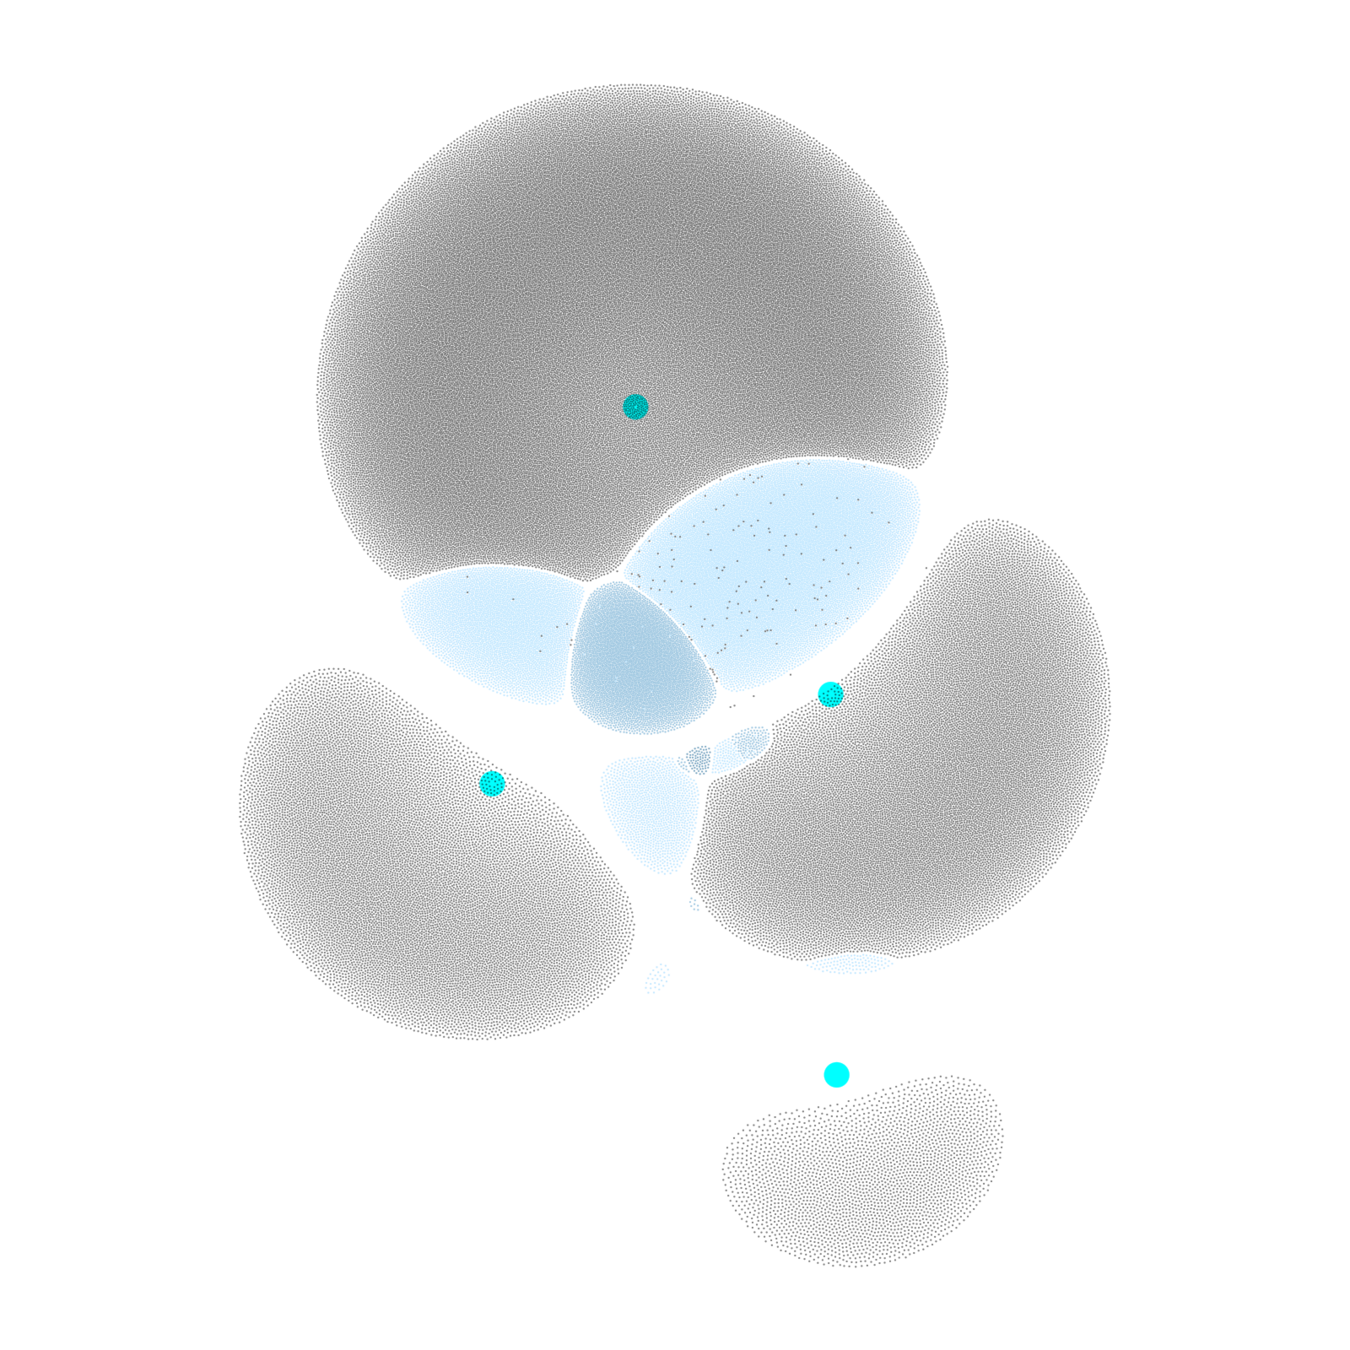
Network Visualization
Make your code shine with highlighting + Avbcuto-Animate
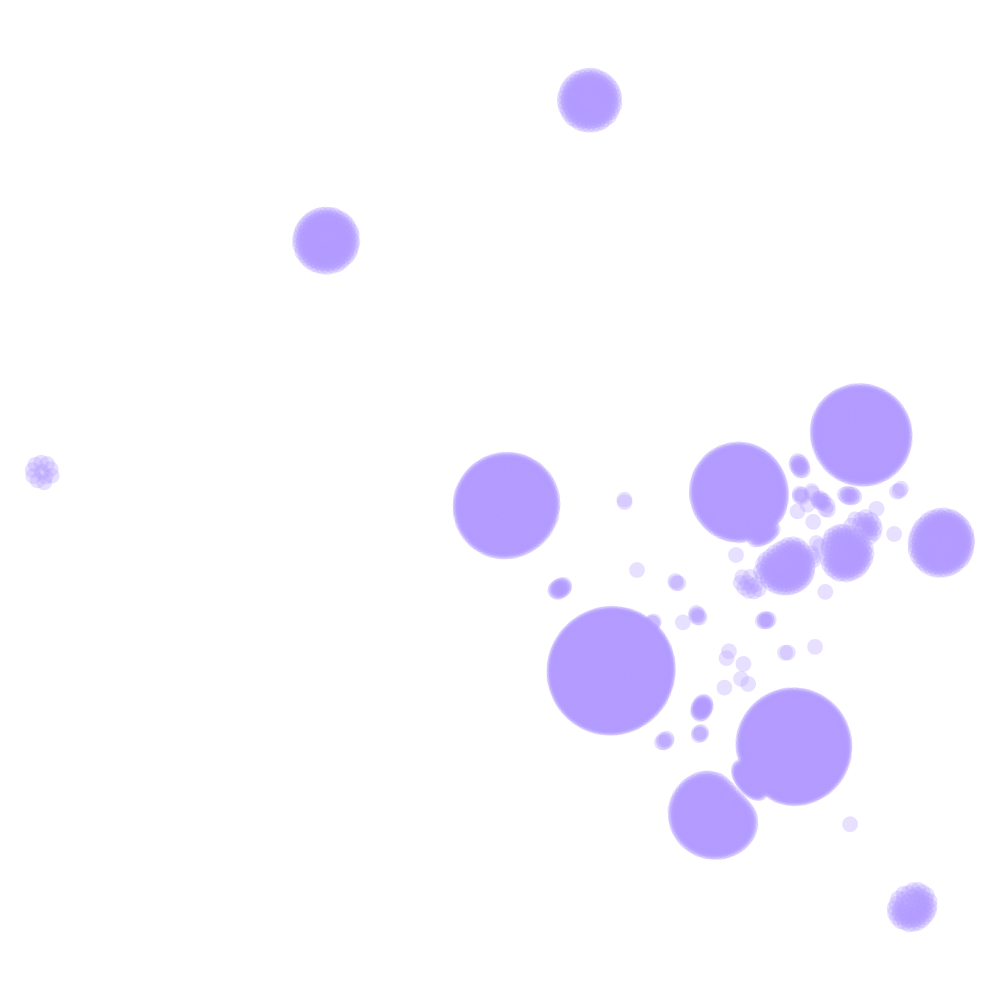
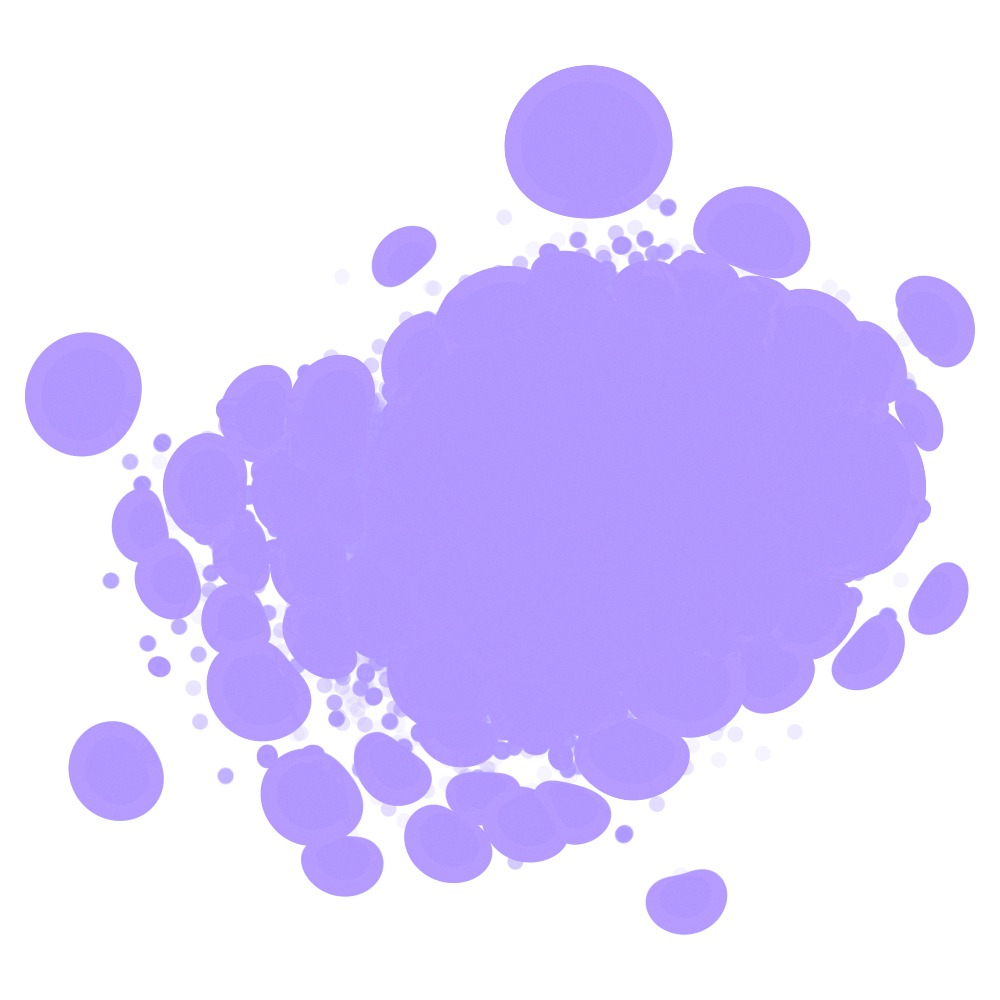
First degree network
Second degree networks: Incremental visualization of large networks
Network Visualization
Exploratory analysis: Identifying general trends in network relationships
Graph Visualization - Top 100
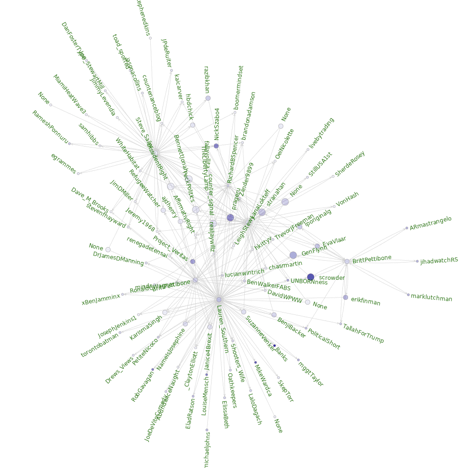
Workflow
Read 1 million txt files of friends and followers info across 24 folders
Generate edges and extract metrics
Exploratory analysis and visualizations
Incremental visualization of network in graphtools
Compute Pagerank and centrality measures for all nodes
Interactive filtering of Pagerank results in Pyspark shell
Visualization of the subgraph generated
Tweet evaluation
- Cardniffnlp Tweeteval
- Twitter-roberta-base masked language model embeddings
- Task-specific embeddings
- Four tasks were evaluated
- Hate speech
- Offensive tweets
- Emotion recognition
- Pytorch Distributed Data Parallel code using HuggingFace


Thank you!
Sage
By sjster
Sage
Presentation slides for Stance detection


